Embed Size (px)
Citation preview

MARINE ECOLOGY PROGRESS SERIESMar Ecol Prog Ser
Vol. 587: 235–245, 2018https://doi.org/10.3354/meps12442
Published January 25
INTRODUCTION
Functional and numerical responses are corner-stones of system ecology. While the functional re -sponse expresses the efficiency of a predator toextract energy from its environment in relation toprey abundance, the numerical response reports theability of predators to transform food biomass intopopulation growth. In a seminal paper, Cairns (1987)proposed that various biological parameters of a
given seabird species would vary in a non-linearfashion in relation to food abundance, similar to afunctional response. Here, the functional link tobreeding success is foraging profitability, where ahigh energy return will be associated with a highreproductive success. Recently, Cury et al. (2011)demonstrated how various populations of seabirdsreact to fish depletion: breeding success increasespositively with prey abundance and then levels offwhen prey are abundant. These authors also showed
*Corresponding author: [email protected]
Breeding failure of seabirds in relation tofish depletion: Is there one universal threshold of
food abundance?
Magella Guillemette1, François Grégoire2, Dévrig Bouillet1, Jean-François Rail3, François Bolduc3, Alain Caron1, David Pelletier1,4,*
1Département de biologie et géographie, Université du Québec à Rimouski, Rimouski, QC G5L 3A1, Canada2Fisheries and Oceans Canada, Mont-Joli, QC G5H 3Z4, Canada
3Environment and Climate Change Canada, Canadian Wildlife Service, Québec, QC G1J 0C3, Canada4Cégep de Rimouski, Rimouski, QC G5L 4H6, Canada
ABSTRACT: Many populations of seabirds are in decline across the world and one proposed causeis the global collapse of fish stocks. Recently, it has been shown that breeding success starts todecline at some critical threshold (CT) of maximum prey abundance (MPA). Here, we estimatedthis empirical threshold for a large seabird, the northern gannet Morus bassanus, and discuss itsrelevance under various conditions. Using a time series starting at the end of the 1970s thatincluded estimated biomass of fish, gannet population and food consumed by gannets, we founda positive and non-linear relationship between fish biomass and breeding success. This correla-tion was supported by the results of a bio-energetic model indicating that gannets extract a sub-stantial fraction of the available biomass. In addition, distribution and time spent at sea (derivedfrom GPS recordings) increased considerably when food abundance was low. In contrast to thegeneral CT previously proposed (34%), we found that breeding success of gannets started todecline at about 8% of MPA. Moreover, when corrected for the sizes of prey available that may beeaten by the birds and the removal of fish by the fishing industry, the observed threshold was fur-ther reduced, indicating that such effects should be included in the context of ecosystem basedmanagement. Theoretical considerations are offered to further explain the discrepancy betweenthe results of our study and a previously published meta-analysis, which included the effect of dieton feeding profitability and the effect of population size.
KEY WORDS: Bird consumption · Breeding success · Conservation threshold · Fishing impact ·Numerical responses · Prey profitability
OPENPEN ACCESSCCESS
© M. Guillemette, D. Bouillet, A. Caron, D. Pelletier, The Crown inthe Right of Canada 2018. Open Access under Creative Commonsby Attribution Licence. Use, distribution and reproduction are un -restricted. Authors and original publication must be credited.
Publisher: Inter-Research · www.int-res.com

Mar Ecol Prog Ser 587: 235–245, 2018236
that breeding success starts to decline at one-third ofmaximum prey abundance (MPA), when averagedover various species of seabirds across the world.
Although such a critical threshold (CT) might be ofgreat value for conservation purposes and ecosystembased management (Hunsicker et al. 2011, Shelton etal. 2014), Cury et al. (2011) did not consider the pos-sibility that only a part of prey biomass is available tobird predators. For instance, there must be somemaximum fish size that can be swallowed by a bird,or alternatively, only the fish present in the upperpart of the water column might be available giventhe diving capacity of each bird species. In addition,the impact of fisheries was not integrated in the mod-elling exercise, and in some cases, fisheries competewith birds (Pichegru et al. 2010, Danckwerts et al.2014, Peck et al. 2014). On theoretical grounds, sucha CT will also depend on whether a fish species sup-porting the bird population is a preferred prey or not(see ‘Discussion’). Otherwise, a decline in fish preymay have little or no influence on the breeding pop-ulation of seabirds. Therefore, all these factors maystrongly influence the computation of a CT of foodabundance.
Using data covering a period of 40 yr, we tested thethreshold value proposed by Cury et al. (2011) for alarge population of northern gannets Morus bas-sanus breeding in the Gulf of St. Lawrence (GSL),eastern Canada, where the Atlantic mackerel Scom -ber scombrus L. is the preferred prey. Gannets arelarge (3 kg), plunge-diving birds, catching pelagicfishes down to 10 m (Garthe et al. 2014). They reachfishing areas by flying up to 100s of km away fromtheir colonies during trips lasting several hours oreven days (Garthe et al. 2007, Hamer et al. 2007) inorder to feed their single chick. Using independentdata on food biomass and fishing landings of mack-erel, we tested whether there is one universal thresh-old of food biomass below which breeding successdecreases by relating reproductive success to (1) foodbiomass and (2) biomass available to gannets, bysubtracting the prey too large to be eaten and theamount of mackerel removed by the fishing industry,together with some theoretical considerations.
MATERIALS AND METHODS
Study area and monitoring programs of birds and fish
The GSL is one of the largest bodies (226 000 km2)of internal water within the Canadian marine envi-
ronment. The southern part of the Gulf is consideredthe main spawning area of Atlantic mackerel inCanadian waters (Sette 1943). In this area, the feasi-bility of a population survey based on egg samplingwas demonstrated in the late 1970s (see Grégoire &Faucher 2006 for a re view). Following this result, thesurvey has been conducted annually or bienniallysince 1983 (Grégoire et al. 2014). The spawning stockbiomass (SSB) of mackerel is estimated from the survey according to the total egg production method(TEPM) (Saville 1977). Our method assumes that thesouthern GSL is the main mackerel spawning area inCanadian waters. This was investigated in 2009 withegg surveys that were also conducted in surroundingareas, namely the Scotian Shelf and the south andwest coasts of Newfoundland (Grégoire et al. 2013a,b).The contribution of these areas to the stock wassmall, and confirmed, at least for 2009, that the south-ern GSL is by far the most important spawning areaof mackerel in the region (Grégoire et al. 2014).Canadian landings data were obtained from theCanadian Department of Fisheries and Oceans. Fol-lowing each fishing season, these data are compiledfrom fishing logbooks and purchase slips and aregrouped by province, Northwest Atlantic FisheriesOrganization (NAFO) division, sub-division and unitarea as well as by month and type of fishing gear.The fishing season starts in mid-May and lasts untilNovember and thus overlaps with the gannets’ re -productive season. Fishers operate from differentports all around the GSL, thereby reducing the prob-ability of fisher concentration.
The gannet population inhabiting the GSL is com-posed of 3 colonies (Bird Rock: 47.83° N, 61.15° W;Bonaventure Island: 48.50° N, 64.15° W; Anti costiIsland: 49.15° N, 61.70° W) that are regularly moni-tored with the methods described by Rail et al.(2013). Briefly, at each colony the number of breed-ing pairs is monitored through aerial photographs.High-quality film or digital images of each colony aretaken through an open window of fixed-wing aircraft (Britten-Norman Islander or Partenaria aircraft).Colo nies are overflown usually between 7 and 12July. The population size for 2005 and 2008 was esti-mated by interpolation using the population growthrate estimated by Rail et al. (2013). This timing corre-sponds with a period of the breeding season whenmost birds are attending a nest containing a chick or,rarely, an egg, but before nests of failed breederswould be abandoned and so degraded that they areno longer visible on the photo graphs. For Atlanticmackerel, this also corresponds to the time of maxi-mum egg production (Grégoire et al. 2014).
Guillemette et al.: Breeding failure of seabirds and fish depletion
Diet and productivity
Gannets tend to regurgitate spontaneously whengently disturbed (e.g. by persons walking slowlyalongside the colony) during the breeding season.Every week, collections of regurgitations were made,brought about either by investigators walking alongthe edge of the colony or when gannets were cap-tured for weighing or GPS deployment. Given that allregurgitated prey were fish, we do not believe thatthere was any digestion bias in our method. From theend of May to the end of September, collecting ses-sions were made with the objective of collectingapproximately 10 regurgitations per week. The massof each regurgitation was re corded together withthe mass of each fish species taken separately. Dietvaries seasonally during the reproduction period ofgannets; mackerel start to appear during the secondweek of June, coinciding with the median of egghatching of this population. As such, mackerel is themost important prey during the chick-rearing period.For these reasons, the relative importance of mack-erel was taken only for years where a complete andsystematic seasonal coverage was obtained (mid-June to mid-September, n = 6 yr).
Fledging productivity at the Bonaventure colonyhas been monitored since 1969, but we only consid-ered data from 1979 to match the database of mack-erel SSB. The monitoring of this colony has beendescribed elsewhere (Rail et al. 2013). Briefly, thecontents of each nest defended by a gannet pair isdetermined from 4 to 8 plots distributed over thecolony, which includes between 180 and 600 nestsper year. Monitoring starts during the incubationperiod; the position of each nest is numbered on aphotograph, then the nest content is determined byvisual observation. Later in the season (usually at thebeginning of September), the number of chicks pres-ent in each numbered nest is recorded. From thesedata, we estimated the fledging productivity of thecolony calculated as the number of chicks produceddivided by the number of nests with eggs.
Modelling prey consumption
The amount of mackerel consumed by the GSL gan-net population was estimated using a bio-energeticmodel, where adult daily energy expenditure (DEE),digestibility and caloric content of prey, respectively,were set at 4865 kJ d−1 (Birt-Friesen et al. 1989), 75%(Cooper 1978) and 7.5 kJ g−1 (Spitz & Jouma 2013).We used 54% as the relative importance of mackerel
in the gannet diet based on 5 reproductive seasons(2004 to 2014, n = 709). Be cause mackerel importancewas high for a 6th year (1974; 91%), we also estimatedthe amount of mackerel eaten by this population witha diet consisting of 100% mackerel (see ‘Results’).Given that we ob served that mackerel are included inthe diet of gannets from the median hatching date (26June) to the end of September, we used 100 d as thewindow of time for our calculations of mackerel con-sumption in any given year. Thus, one adult gannetwould consume 438 g of mackerel for each of the100 d when its relative importance in the diet repre-sents 54%, or 811 g when its importance is 100%. Theamount of fish consumed during 100 d was multipliedby the total number of reproductive individuals pres-ent in the GSL for any given year to obtain yearly population mackerel consumption.
We added to this estimate consumption of mackerelby non-breeding individuals and consumption bychicks, assuming a similar importance in their diet(54%) as for reproductive adults. The number of non-breeding individuals was derived from yearly esti-mates of non-breeding birds at the colony, which is11.3% on average (n = 8 yr). We did not consider con-sumption of fish by immature birds not present at thecolony in our total estimate, because this part of thepopulation is not surveyed and is of unknown size.Chicks’ consumption of fish until fledging was ob-tained from Montevecchi et al. (1984), who estimatedit to be 24.2 kg on average from 2 captive individualswith similar growth curves as wild individuals, givinga total seasonal amount of 13.06 kg (24.2 × 0.54) ofmackerel consumed by 1 chick over 1 season. Thisamount was multiplied by the total number of chicksproduced each year at the Bonaventure col ony, esti-mated from breeding productivity, ranging from 2.7%to 77% between 1976 and 2014 (n = 14). Finally, weused a similar approach for the 2 other colonies lo-cated at Anticosti Island and Bird Rock. Because pro-ductivity and diet were not monitored at these lattercolonies, we assumed that the parameter estimateswere similar to that of the Bonaventure colony.
GPS tracking
We deployed 108 GPS loggers on gannets breedingat Bonaventure Island, Québec in July and August2012, 2013 and 2014. Gannets were tracked fromtheir breeding colony using iGotU GT-120 GPS dataloggers (Mobile Action Technology; dimensions: 44.5× 28.5 × 13 mm) during the chick-rearing period. Allloggers were attached to the tail below the uropygial
237

Mar Ecol Prog Ser 587: 235–245, 2018
gland with waterproof tape (Tesa 4650; Wilson et al.1997). This technique does not damage the birds’feathers. The GPS devices were sealed and the airremoved with a vacuum machine. The loggersincluding the sealing plastic weighed 35 g on aver-age (1.2% of mean gannet body mass). GPS coordi-nates were recorded every 10 min. We caught birdson their return to the colony after 10 d on average asthey arrived from a foraging trip, and the deviceswere removed and the data downloaded. To comparethe foraging distribution of Bonaventure’s gannetsduring a year of high food abundance (2003; datafrom Garthe et al. 2007) with years of low abundance(2012 to 2014), we used only a subset of our data setcovering a similar seasonal period (August, n = 63individuals, 73 foraging trips).
Data analysis
The relationship between gannet breeding successand mackerel abundance was investigated using thepackage ‘segmented’, version 0.5-1.4 (Muggeo 2008)run with the R software, version 3.2.3 (R Core Team2015). The segmented package estimates linear andgeneralized linear models having one or more seg-mented relationship in the linear predictor. Slope andbreakpoint are estimated using an iterative proce-dure (Muggeo 2003) that requires starting values forthe breakpoint parameter. The package also includesa bootstrap restarting method that renders the algo-rithm less sensitive to starting values (Wood 2001).
For comparison purposes, we also ran the analysiswith the method given by Cury et al. (2011, their sup-plementary material) to find that the 2 methods gavedifferent results (see Table 1 and ‘Discussion’). An -other point of contention relates to the fact that usinga relative CT based on a single (and often extreme)value of food abundance (as used by Cury et al. 2011)is not sufficiently robust. Thus, we ex pressed the rel-ative threshold or breakpoint in relation to the 5 mostimportant years in terms of food biomass of mackerel(see Table 1)
RESULTS
Diet of gannets
The diet of gannets varied during their reproduc-tive period and included mackerel, capelin Mallotusvillosus, herring Clupea harengus and sand eelsAmmodytes spp. (Fig. 1). However, mackerel werethe predominant prey over most of the chick-rearingperiod, which usually ends by the end of September(Poulin 1968). When compared through years, therelative importance (wet mass) of mackerel in thegannets’ diet showed a negative trend through time(r = −0.862, nyears = 6, nregurgitations = 838, p < 0.05), andranged from 91% in 1974 to 38% in 2013. However,this relationship was no longer significant (p > 0.05)when data from 1974 were removed, and mackerelaveraged 54% in relative importance for the remain-ing 5 yr (Fig. 1).
238
Fig. 1. Annual variation in thediet of northern gannets fromBonaventure Island colony(1974 to 2014) illustrated as therelative importance (% mass)of fish prey (n = sample size).When 1974 is excluded, therelative importance of Atlanticmackerel is 54% on averagefor the 5 remaining years. Datafor 1974 are from Taylor & Nettleship (1974) and data for2004, 2005 and 2009 are from
Rail et al. (2013)
Guillemette et al.: Breeding failure of seabirds and fish depletion
Biomass of mackerel relative to gannets’ productivity
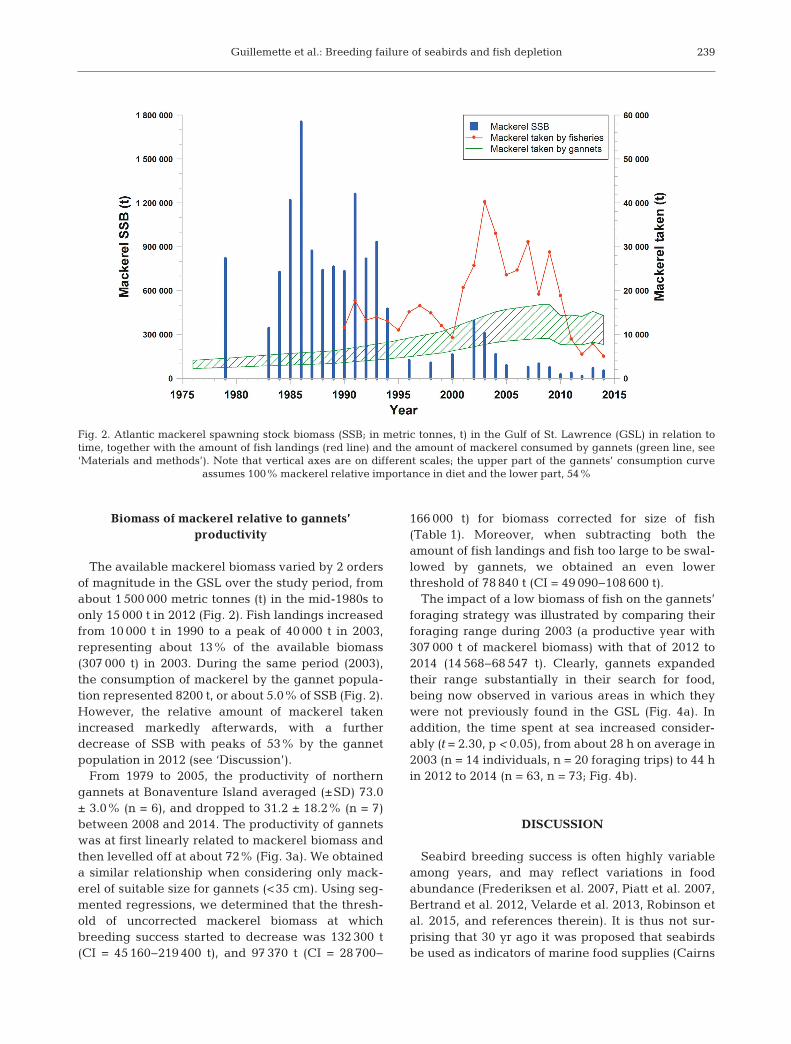
The available mackerel biomass varied by 2 ordersof magnitude in the GSL over the study period, fromabout 1 500 000 metric tonnes (t) in the mid-1980s toonly 15 000 t in 2012 (Fig. 2). Fish landings increasedfrom 10 000 t in 1990 to a peak of 40 000 t in 2003,representing about 13% of the available biomass(307 000 t) in 2003. During the same period (2003),the consumption of mackerel by the gannet popula-tion represented 8200 t, or about 5.0% of SSB (Fig. 2).However, the relative amount of mackerel takenincreased markedly afterwards, with a furtherdecrease of SSB with peaks of 53% by the gannetpopulation in 2012 (see ‘Discussion’).
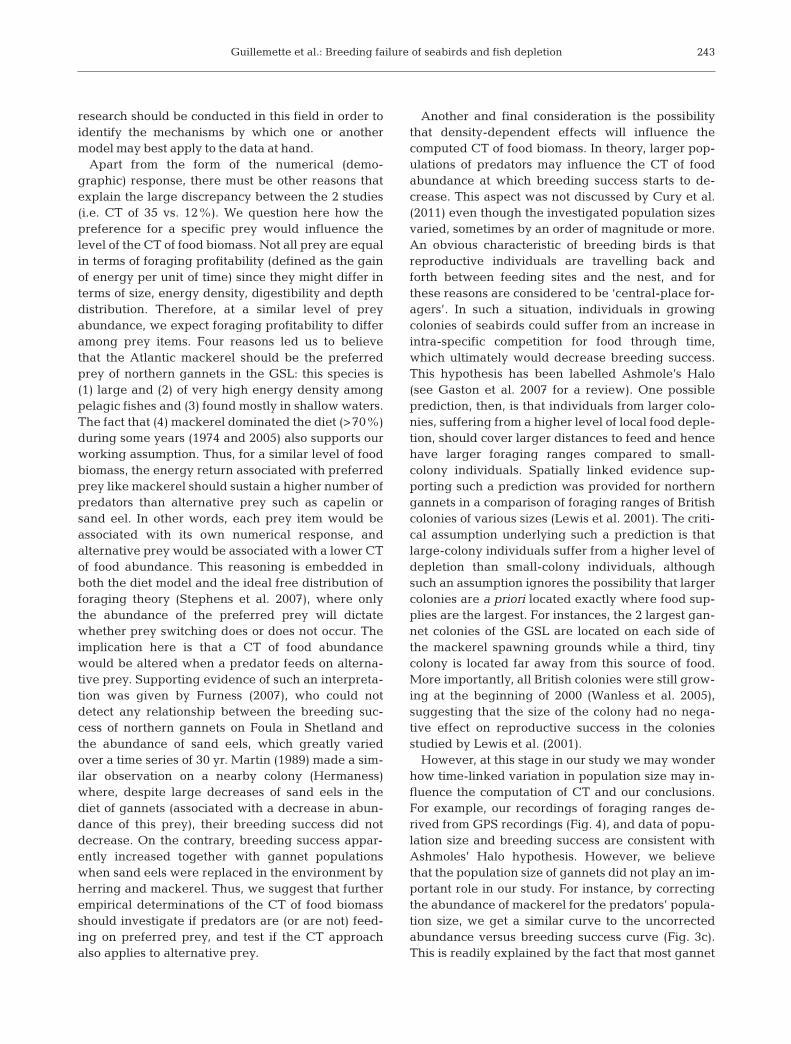
From 1979 to 2005, the productivity of northerngannets at Bonaventure Island averaged (±SD) 73.0± 3.0% (n = 6), and dropped to 31.2 ± 18.2% (n = 7)between 2008 and 2014. The productivity of gannetswas at first linearly related to mackerel biomass andthen levelled off at about 72% (Fig. 3a). We obtaineda similar relationship when considering only mack-erel of suitable size for gannets (<35 cm). Using seg-mented regressions, we determined that the thresh-old of uncorrected mackerel biomass at whichbreeding success started to decrease was 132 300 t(CI = 45 160−219 400 t), and 97 370 t (CI = 28 700−
166 000 t) for biomass corrected for size of fish(Table 1). Moreover, when subtracting both theamount of fish landings and fish too large to be swal-lowed by gannets, we obtained an even lowerthreshold of 78 840 t (CI = 49 090−108 600 t).
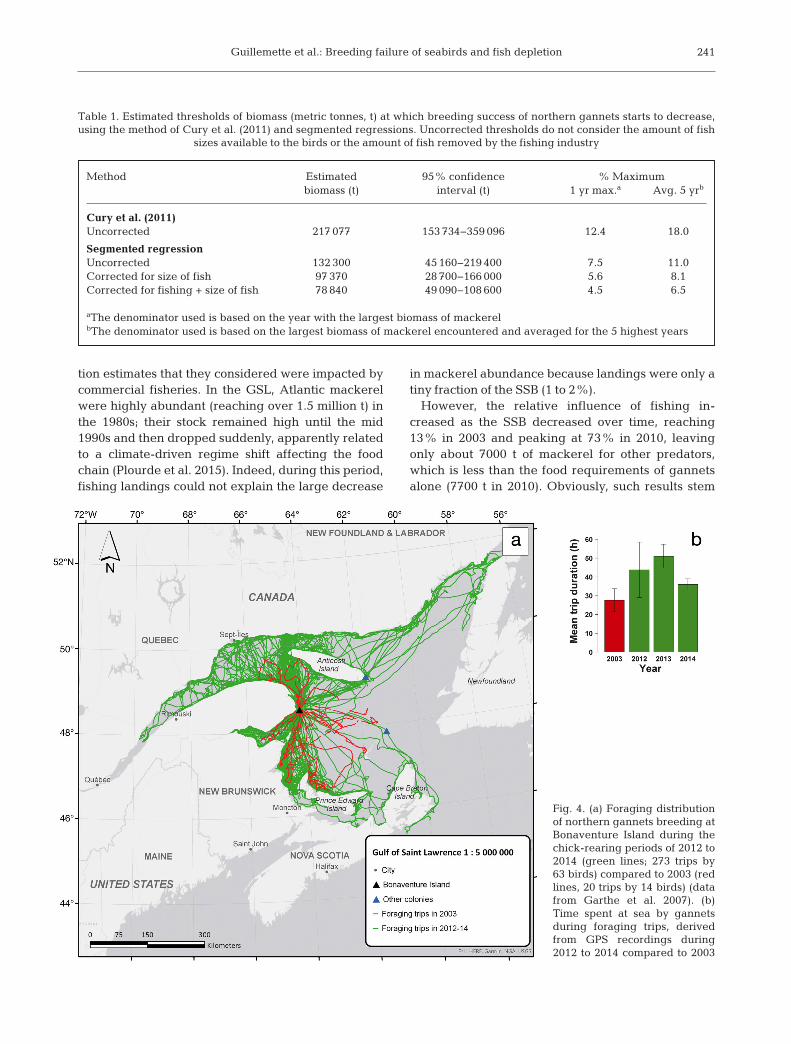
The impact of a low biomass of fish on the gannets’foraging strategy was illustrated by comparing theirforaging range during 2003 (a productive year with307 000 t of mackerel biomass) with that of 2012 to2014 (14 568−68 547 t). Clearly, gannets expandedtheir range substantially in their search for food,being now observed in various areas in which theywere not previously found in the GSL (Fig. 4a). Inaddition, the time spent at sea increased consider-ably (t = 2.30, p < 0.05), from about 28 h on average in2003 (n = 14 individuals, n = 20 foraging trips) to 44 hin 2012 to 2014 (n = 63, n = 73; Fig. 4b).
DISCUSSION
Seabird breeding success is often highly variableamong years, and may reflect variations in foodabundance (Frederiksen et al. 2007, Piatt et al. 2007,Bertrand et al. 2012, Velarde et al. 2013, Robinson etal. 2015, and references therein). It is thus not sur-prising that 30 yr ago it was proposed that seabirdsbe used as indicators of marine food supplies (Cairns
239
Fig. 2. Atlantic mackerel spawning stock biomass (SSB; in metric tonnes, t) in the Gulf of St. Lawrence (GSL) in relation totime, together with the amount of fish landings (red line) and the amount of mackerel consumed by gannets (green line, see‘Materials and methods’). Note that vertical axes are on different scales; the upper part of the gannets’ consumption curve
assumes 100% mackerel relative importance in diet and the lower part, 54%

Mar Ecol Prog Ser 587: 235–245, 2018
1987). Recently, it has been further sug-gested that the relationship betweenfood abundance and bird breeding suc-cess be used as a ‘signal’ to conserva-tion efforts of both prey and predatorpopulations. Here, we present suchdata spanning 4 decades. More specifi-cally, we tested the idea that decreasesin seabird productivity begin to appearat about one-third of food biomass,using various metrics of food abun-dance together with theoretical con -siderations. To further substantiate ourinterpretation, we present results stem-ming from a bio-energetic model alongwith GPS recordings in order to unravelthe mechanisms by which food deple-tion may influence breeding success.
Empirical considerations
Various populations of seabirds are indecline across the world (Paleczny et al.2015), and one possible cause is theglobal collapse of fish stocks (Pichegruet al. 2010, Bertrand et al. 2012, Robin-son et al. 2015). If one-third of MPA is tobe used as a general CT for predator−prey populations and a relevant conser-vation ratio, we need to know the natureand extent of fish harvest in the ecosys-tem investigated. Cury et al. (2011) gaveno indication of the extent to which thevarious time series of forage fish popula-
240
Fig. 3. (a) Productivity (% fledging success) ofnorthern gannets breeding on BonaventureIsland in relation to spawning stock biomass(SSB) of mackerel between 1979 and 2004.Segmented regression analysis indicates thatbreeding success started to decline at 132 000t of mackerel SSB (vertical dash line). (b) Evo-lution of the Gulf of St. Lawrence (GSL) gan-nets’ population size (no. of reproductive indi-viduals). Open symbols are associated with anaverage breeding success of 31.2% (CV =58.3%); filled symbols: 72.6% (CV = 4.1%).(c) Productivity (% fledging success) of north-ern gannets breeding on Bonaventure Islandin relation to SSB of mackerel per capita (cor-rected for population size of gannets). Seg-mented regression analysis indicates thatbreeding success started to decline at 0.75 t of
mackerel SSB ind.−1
Guillemette et al.: Breeding failure of seabirds and fish depletion
tion estimates that they considered were impacted bycommercial fisheries. In the GSL, Atlantic mackerelwere highly abundant (reaching over 1.5 million t) inthe 1980s; their stock remained high until the mid1990s and then dropped suddenly, apparently relatedto a climate-driven regime shift affecting the foodchain (Plourde et al. 2015). Indeed, during this period,fishing landings could not explain the large decrease
in mackerel abundance because landings were only atiny fraction of the SSB (1 to 2%).
However, the relative influence of fishing in -creased as the SSB decreased over time, reaching13% in 2003 and peaking at 73% in 2010, leavingonly about 7000 t of mackerel for other predators,which is less than the food requirements of gannetsalone (7700 t in 2010). Obviously, such results stem
241
Method Estimated 95% confidence % Maximum biomass (t) interval (t) 1 yr max.a Avg. 5 yrb
Cury et al. (2011)Uncorrected 217 077 153 734−359 096 12.4 18.0
Segmented regressionUncorrected 132 300 45 160−219 400 7.5 11.0Corrected for size of fish 97 370 28 700−166 000 5.6 8.1Corrected for fishing + size of fish 78 840 49 090−108 600 4.5 6.5
aThe denominator used is based on the year with the largest biomass of mackerelbThe denominator used is based on the largest biomass of mackerel encountered and averaged for the 5 highest years
Table 1. Estimated thresholds of biomass (metric tonnes, t) at which breeding success of northern gannets starts to decrease,using the method of Cury et al. (2011) and segmented regressions. Uncorrected thresholds do not consider the amount of fish
sizes available to the birds or the amount of fish removed by the fishing industry
Fig. 4. (a) Foraging distributionof northern gannets breeding atBonaventure Island during thechick-rearing periods of 2012 to2014 (green lines; 273 trips by63 birds) compared to 2003 (redlines, 20 trips by 14 birds) (datafrom Garthe et al. 2007). (b)Time spent at sea by gannetsduring foraging trips, derivedfrom GPS recordings during2012 to 2014 compared to 2003

Mar Ecol Prog Ser 587: 235–245, 2018242
from the limitations of our data set. In fact, the bio-mass estimated by the mackerel egg survey repre-sents only a minimum amount of fish because itmeasures only the mature fraction of the stock. More-over, one must consider the possibility that the pro-portion of mackerel spawning outside the southernGSL changes from year to year. Another weakness ofour data set is the absence of diet data for severalyears of the time series, and that we used 54% as therelative importance of mackerel as constant in ourbio-energetic model. When considering the historicalrecord of Taylor & Nettleship (1974), the relativeimportance of mackerel varies between years (see‘Results’) and it is possible that the 2010 and 2012seasons were associated with a relative importanceof mackerel lower than 54%. This is particularlyplausible as these 2 years were associated with thelowest mackerel SSB recorded in the time series.
Nevertheless, despite these caveats we believe ourestimates of the mackerel biomass removed by gan-nets and the fishing industry to be a major strength ofour approach. It shows that the poor breeding suc-cess of gannets was associated with an acute short-age of their preferred prey (see below), for whichthey were potentially competing with other preda-tors. However, the relative importance of mackerel inthe diet of grey seals Halichoerus grypus is minute inthe southern GSL (0.7% mass; Hammill et al. 2007,Hammill 2011), and Atlantic bluefin tuna Thunnusthynnus visits the southeastern part of the GSL onlyin small numbers (Wilson et al. 2011). Thus, we con-cluded that fisheries impact was negligible at thebeginning of the time series, but its relative effect in -creased considerably with the decrease in mackerelstock, thereby indicating a potential competitionwith gannets.
Not all prey items are equally available to a preda-tor. Because gannets rarely dive deeper than 10 m,we expect food found deeper in the water column tobe unavailable to such plunge-diving predators. Thisis particularly important under the observed rise insea-surface temperature (SST) in many oceans acrossthe world, as increases in SST might influence thedepth distribution of most fish species. Unfortunately,we do not have data about the depth distribution ofmackerel in the GSL, and therefore we cannot cor-rect the SSB in relation to that factor. However, an -other aspect that might influence the fraction of bio-mass available to gannets is prey size. Camphuysen(2011) measured experimentally that northern gan-nets prefer fish prey smaller than 35 cm, probablybecause larger prey cannot be swallowed whole.Therefore, using information about the size of fish
collected from mackerel landings, we removed allmackerel larger than 35 cm in our estimate of avail-able biomass. We found that doing so decreased ourCT of food abundance from 132 300 to 97 370 t. Thethreshold was further reduced to 78 840 t when boththe amount of fish taken by the industry and thosetoo large to be taken by gannets were considered inour estimate. Clearly, any conservation-oriented esti-mates of food abundance in the context of ecosystembased management should take these 2 aspects intoconsideration.
Theoretical considerations
Our uncorrected CT (132 300 t) of MPA (1 754 052 t)represents 7.5%, which is much less than the averageof 34% (CI = 31−39%) given by Cury et al. (2011).However, these authors used a different and non-linear model to estimate their threshold. Using theirmethod (Cury et al. 2011, their supplementary mate-rial), we found that breeding success would start todecrease at 12% (see Fig. S1 in the Supplement atwww.int-res.com/articles/suppl/ m587 p235 _ supp. pdf),which is still lower than 34% and outside the confi-dence intervals computed by these authors. Althoughit may seem trivial to obtain different results when us-ing a different modelling tool, choosing the right toolis not. We used a linear model in this study (Fig. 3a)because it was considered a more parsimonious ap-proach: linear models are simpler, and if we can ex-plain the same variability compared to a nonlinearmodel, it could be more parsimonious. After testingvarious approaches, Cury et al. (2011, their Table S2)found the best fit for their data with asymptoticmodels (although the difference from linear modelswas small). However, there are several examples inthe literature of both linear and non-linear relation-ships of food abundance and breeding success ofbirds (see Newton 1998 for a comprehensive review),and discriminating which model should apply on atheoretical basis is, at best, difficult. This is becausethe breeding success of birds may vary in relation tomany other factors such as predation, parasite loads,etc., which are unrelated to food supplies (Cairns1992). In addition, behavioural flexibility might differbetween species, as some birds may use behaviouralcompensation when food is scarce (e.g. work harder)in order to maintain or buffer conditions of food short-age. For instance, gannets from Bona venture Islandincreased their foraging ranges and time spent at seaconsiderably under conditions of low food abundance(Fig. 4). Therefore, we can only conclude that further
Guillemette et al.: Breeding failure of seabirds and fish depletion
research should be conducted in this field in order toidentify the mechanisms by which one or anothermodel may best apply to the data at hand.
Apart from the form of the numerical (demo-graphic) response, there must be other reasons thatexplain the large discrepancy between the 2 studies(i.e. CT of 35 vs. 12%). We question here how thepreference for a specific prey would influence thelevel of the CT of food biomass. Not all prey are equalin terms of foraging profitability (defined as the gainof energy per unit of time) since they might differ interms of size, energy density, digestibility and depthdistribution. Therefore, at a similar level of preyabundance, we expect foraging profitability to differamong prey items. Four reasons led us to believethat the Atlantic mackerel should be the preferredprey of northern gannets in the GSL: this species is(1) large and (2) of very high energy density amongpelagic fishes and (3) found mostly in shallow waters.The fact that (4) mackerel dominated the diet (>70%)during some years (1974 and 2005) also supports ourworking assumption. Thus, for a similar level of foodbiomass, the energy return associated with preferredprey like mackerel should sustain a higher number ofpredators than alternative prey such as capelin orsand eel. In other words, each prey item would beassociated with its own numerical response, andalternative prey would be associated with a lower CTof food abundance. This reasoning is embedded inboth the diet model and the ideal free distribution offoraging theory (Stephens et al. 2007), where onlythe abundance of the preferred prey will dictatewhether prey switching does or does not occur. Theimplication here is that a CT of food abundancewould be altered when a predator feeds on alterna-tive prey. Supporting evidence of such an interpreta-tion was given by Furness (2007), who could notdetect any relationship between the breeding suc-cess of northern gannets on Foula in Shetland andthe abundance of sand eels, which greatly variedover a time series of 30 yr. Martin (1989) made a sim-ilar observation on a nearby colony (Hermaness)where, despite large decreases of sand eels in thediet of gannets (associated with a decrease in abun-dance of this prey), their breeding success did notdecrease. On the contrary, breeding success appar-ently increased together with gannet populationswhen sand eels were replaced in the environment byherring and mackerel. Thus, we suggest that furtherempirical determinations of the CT of food biomassshould investigate if predators are (or are not) feed-ing on preferred prey, and test if the CT approachalso applies to alternative prey.
Another and final consideration is the possibilitythat density-dependent effects will influence thecomputed CT of food biomass. In theory, larger pop-ulations of predators may influence the CT of foodabundance at which breeding success starts to de -crease. This aspect was not discussed by Cury et al.(2011) even though the investigated population sizesvaried, sometimes by an order of magnitude or more.An obvious characteristic of breeding birds is thatreproductive individuals are travelling back andforth between feeding sites and the nest, and forthese reasons are considered to be ‘central-place for-agers’. In such a situation, individuals in growingcolonies of seabirds could suffer from an increase inintra-specific competition for food through time,which ultimately would decrease breeding success.This hypothesis has been labelled Ashmole’s Halo(see Gaston et al. 2007 for a review). One possibleprediction, then, is that individuals from larger colo -nies, suffering from a higher level of local food deple-tion, should cover larger distances to feed and hencehave larger foraging ranges compared to small-colony individuals. Spatially linked evidence sup-porting such a prediction was provided for northerngannets in a comparison of foraging ranges of Britishcolonies of various sizes (Lewis et al. 2001). The criti-cal assumption underlying such a prediction is thatlarge-colony individuals suffer from a higher level ofdepletion than small-colony individuals, althoughsuch an assumption ignores the possibility that largercolonies are a priori located exactly where food sup-plies are the largest. For instances, the 2 largest gan-net colonies of the GSL are located on each side ofthe mackerel spawning grounds while a third, tinycolony is located far away from this source of food.More importantly, all British colonies were still grow-ing at the beginning of 2000 (Wanless et al. 2005),suggesting that the size of the colony had no nega-tive effect on reproductive success in the coloniesstudied by Lewis et al. (2001).
However, at this stage in our study we may wonderhow time-linked variation in population size may in-fluence the computation of CT and our conclusions.For example, our recordings of foraging ranges de -rived from GPS recordings (Fig. 4), and data of popu-lation size and breeding success are consistent withAshmoles’ Halo hypothesis. However, we be lievethat the population size of gannets did not play an im-portant role in our study. For instance, by correctingthe abundance of mackerel for the predators’ popula-tion size, we get a similar curve to the un correctedabundance versus breeding success curve (Fig. 3c).This is readily explained by the fact that most gannet
243

Mar Ecol Prog Ser 587: 235–245, 2018
population growth took place be tween 1976 and 2004(Fig. 3b), a period when breeding success varied little(73% on average); the population stabilized after-wards (2004 to 2014) at ~154 000 individuals on aver-age (CV = 4%), together with a decrease in breedingsuccess starting in 2008. For the same periods, therewas a sizable food biomass between 1976 and 2004 atabout 700 000 t (CV = 66%) on average, and about60 000 t (CV = 49%) be tween 2004 and 2014. Thus,most of the variation in breeding success was associ-ated with a large de crease and high variability infood abundance at the same time the population sizewas stable. One reason that could possibly explainthe absence of density dependence in our system isthat gannets in the GSL were decimated by travellersand fishermen in the 19th century (Gosselin 2015);the observed in crease in the size of the population is arecovery re sponse. Although we could not find anyevidence for a density dependent process in ourstudy, we believe that this warrants further researchin the future. Furthermore, because mackerel wereabundant at the beginning of the time series and pre-dation by gannets removed only a tiny/negligibleportion of the fish biomass, stock failure could not beexplained by gannet predation.
We conclude that gannet breeding failure is di rectlylinked to food depletion in our system, even thoughthe CT of MPA observed in our study does not matcha similar threshold proposed from a previous meta-analysis. We believe that analyses such as this arecertainly persuasive in demonstrating a common pat-tern and should be highly valuable for ecosystembased management practice and advice. However,we suggest that further research should include fac-tors that may affect feeding profitability, diet andprey availability for seabirds together with the effectof fisheries in order to improve the veracity and use-fulness of ecological predictions.
Acknowledgements. Fieldwork was conducted in accor-dance with guidelines of the Canadian Council on AnimalCare, with review and approval by the Université duQuébec à Rimouski Animal Care Committee (permit num-ber CPA-65-16-177), Canadian Wildlife Service (CWS) ofEnvironment Canada (Québec region) (permit numbers SC-25, RE-27, 10704 M, 10704 T) and Société des établisse-ments de plein air du Québec (permit numbers PNIBRP-2012-001, PNIBRP-2013-001, PNIBRP-2014-001). This studywas funded through the Canadian Natural Sciences andEngineering Research Council (NSERC) discovery andequipment grants to M.G. and Fonds de recherche duQuébec − Nature et Technologies (FRQNT) Research pro-gram for college researchers to D.P. (FRQNT-146290). Weacknowledge the contribution of long-term monitoring pro-grams of gannets and other seabirds under the auspice ofCWS of Environment Canada (Québec region) and the long-
term monitoring programs of mackerel abundance data,fishing statistics, and commercial samples from the Depart-ment of Fisheries and Oceans (DFO) Canada (Québecregion). Thanks for the extensive commitment of sampling,laboratory and analytical personnel involved at Universitédu Québec à Rimouski (Yannick Seyer, Laurie Maynard,Sarah Wing, Isabeau Pratte, Mélanie Laflèche, CatherineAyotte), Cégep de Rimouski (Gabrielle Bouchard, Anne-Charlotte Lebel, Daisy Turcotte, Laura Turcotte), CWS andDFO during all those years. Thanks to Parc national de l’Île-Bonaventure-et-du-Rocher-Percé and its staff for transporta-tion and supportive collaboration. Final thanks to Kyle Elliottand many anonymous reviewers for helpful comments.
LITERATURE CITED
Bertrand S, Joo R, Smet CA, Tremblay Y, Barbraud C,Weimerskirch H (2012) Local depletion by a fishery canaffect seabird foraging. J Appl Ecol 49: 1168−1177
Birt-Friesen VL, Montevecchi WA, Cairns DK, Macko SA(1989) Activity-specific metabolic rate of free-livingnorthern gannets and other seabirds. Ecology 70: 357−367
Cairns DK (1987) Seabirds as indicators of marine food sup-plies. Biol Oceanogr 5: 261−271
Cairns DK (1992) Bridging the gap between ornithology andfisheries science: use of seabird data in stock assessmentmodels. Condor 94: 811−824
Camphuysen KS (2011) Northern gannets in the North Sea: foraging distribution and feeding techniques around theBass Rock. Br Birds 104: 60−76
Cooper J (1978) Energetic requirements for growth andmaintenance of the cape gannet (Aves, Sulidae). Afr Zool13: 305−317
Cury PM, Boyd IL, Bonhommeau S, Anker-Nilssen T andothers (2011) Global seabird responses to forage fishdepletion — one-third for the birds. Science 334: 1703−1706
Danckwerts DK, McQuaid CD, Jaeger A, McGregor GK,Dwight R, Le Corre M, Jaquemet S (2014) Biomass con-sumption by breeding seabirds in the western IndianOcean: indirect interactions with fisheries and implica-tions for management. ICES J Mar Sci 71: 2589−2598
Frederiksen M, Mavor RA, Wanless S (2007) Seabirds asenvironmental indicators: the advantages of combiningdata sets. Mar Ecol Prog Ser 352: 205−211
Furness RW (2007) Responses of seabirds to depletion offood fish stock. J Ornithol 148(Suppl 2): 247−252
Garthe S, Montevecchi WA, Chapdelaine G, Rail JF, Hedd A(2007) Contrasting foraging tactics by northern gannets(Sula bassana) breeding in different oceanographicdomains with different prey fields. Mar Biol 151: 687−694
Garthe S, Guse N, Montevecchi WA, Rail JF, Grégoire F(2014) The daily catch: flight altitude and diving behav-ior of northern gannets feeding on Atlantic mackerel.J Sea Res 85: 456−462
Gaston AJ, Ydenberg RC, Smith GEJ (2007) Ashmole’s haloand population regulation in seabirds. Mar Ornithol 35: 119−126
Gosselin M (2015) L’île aux trésors: d’Audubon à JamesBond. QuébecOiseaux 26:12–18
Grégoire F, Faucher S (2006) Distribution and abundance ofthe Atlantic mackerel (Scomber scombrus L.) eggs forthe ichthyoplankton surveys conducted in the southernGulf of St. Lawrence between 1976 to 1979. DFO Can SciAdvis Sec Res Doc 2006/099
Grégoire F, Beaulieu JL, Gendron MH, LeBlanc D (2013a)
244
Guillemette et al.: Breeding failure of seabirds and fish depletion
Results of the Atlantic mackerel (Scomber scombrus L.)egg survey conducted on the Scotian Shelf and New-foundland’s south coast in 2009. DFO Can Sci Advis SecRes Doc 2012/127
Grégoire F, Barry W, Barry JJ, Barry J, Beaulieu JL, Gen-dron MH (2013b) West coast of Newfoundland capelin(Mallotus villosus M.) and Atlantic herring (Clupeaharengus harengus L.) larval survey, Part 10: Abundanceestimates and marine community analyses of the datacollected in partnership with the industry (Barry Group)in July 2009 and comparison with previous surveys. CanTech Rep Fish Aquat Sci 3062
Grégoire F, Girard L, Boudreau M (2014) Résultats desrelevés du programme de monitorage zonal Atlantique(PMZA)-maquereau bleu (Scomber scombrus L.) réalisésdans le sud du Golfe Saint-Laurent en 2012 et 2013. SecrCan de Consult Sci du MPO. Doc de rech 2014/075
Hamer KC, Humphreys EM, Garthe S, Hennicke J and oth-ers (2007) Annual variation in diets, feeding locationsand foraging behaviour of gannets in the North Sea: flex-ibility, consistency and constraint. Mar Ecol Prog Ser 338: 295−305
Hammill MO (2011) Feeding of grey seals in southern Gulfof St. Lawrence. DFO Can Sci Advis Sec Res Doc2010/130
Hammill MO, Stenson GB, Proust F, Carter P, McKinnon D(2007) Feeding by grey seals in the Gulf of St. Lawrenceand around Newfoundland. NAMMCO Sci Publ 6: 135−152
Hunsicker ME, Ciannelli L, Bailey KM, Buckel JA and oth-ers (2011) Functional responses and scaling in preda-tor−prey interactions of marine fishes: contemporaryissues and emerging concepts. Ecol Lett 14: 1288−1299
Lewis S, Sherrat TN, Hamer KC, Wanless S (2001) Evidenceof intra-specific competition for food in a pelagic seabird.Nature 412: 816−819
Martin AR (1989) The diet of Atlantic puffin Fraterculaartica and northern gannet Sula bassana chicks at aShetland colony during a period of changing prey avail-ability. Bird Study 36: 170−180
Montevecchi WA, Ricklefs RE, Kirkham IR, Gabaldon D(1984) Growth energetics of nestling northern gannets(Sula bassanus). Auk 101: 334−341
Muggeo VMR (2003) Estimating regression models withunknown break-points. Stat Med 22: 3055−3071
Muggeo VMR (2008) segmented: an R package to fit regres-sion models with broken-line relationships. R News 8: 20−25
Newton I (1998) Population limitation in birds. AcademicPress, New York, NY
Paleczny M, Hammill E, Karpouzi V, Pauly D (2015) Popula-tion trend of the world’s monitored seabirds, 1950–2010.PLOS ONE 10: e0129342
Peck MA, Neuenfeldt S, Essington VM, Trenkel A and oth-ers (2014) Forage fish interactions: a symposium on ‘Cre-ating the tools for ecosystem-based management of mar-ine resources’. ICES J Mar Sci 71: 1−4
Piatt JF, Harding AMA, Shultz M, Speckman SG, van PeltTI, Drew GS, Kettle AB (2007) Seabirds as indicators ofmarine food supplies: Cairns revisited. Mar Ecol Prog Ser352: 221−234
Pichegru L, Grémillet D, Crawford JM, Ryan PJ (2010) Mar-ine no-take zone rapidly benefits endangered penguin.Biol Lett 6: 498−501
Plourde S, Grégoire F, Lehoux C, Galbraith PS, CastonguayM, Ringuette M (2015) Effect of environmental variabil-ity on body condition and recruitment success of Atlanticmackerel (Scomber scombrus) in the Gulf of St.Lawrence. Fish Oceanogr 24: 347−363
Poulin JM (1968) Reproduction du Fou de Bassan (Sula bas-sana), île Bonaventure, Québec. MSc thesis, UniversitéLaval, Québec
R Core Team (2015) R: a language and environment for sta-tistical computing. R Foundation for Statistical Comput-ing, Vienna. www.r-project.org
Rail JF, Champoux L, Lavoie RA, Chapdelaine G (2013)Suivi de la population et de la contamination du Fou deBassan au Québec, 1966–2009. Série de rapports tech-niques no 528. Environnement Canada. Service cana-dien de la faune, région du Québec, EnvironnementCanada, Québec
Robinson WML, Butterworth DS, Plaganyi EE (2015) Quan-tifying the projected impact of the South African sardinefishery on the Robben Island penguin colony. ICES J MarSci 72: 1822−1833
Saville A (ed) (1977) Survey method of appraising fisheryresources. FAO Fish Tech Pap 171: 1−76
Sette OE (1943) Biology of the Atlantic mackerel (Scomberscombrus L.) of North America. Part 1: Early life history,including the growth, drift, and mortality of the egg andlarval populations. Fish Bull 38: 149−237
Shelton AO, Samhouri JF, Stier AC, Levin PS (2014) Assess-ing trade-offs to inform ecosystem-based fisheries man-agement of forage fish. Sci Rep 4: 7110
Spitz J, Jouma J (2013) Variability in energy density of for-age fishes from the Bay of Biscay (north-east AtlanticOcean): reliability of functional grouping based on preyquality. J Fish Biol 82: 2147−2152
Stephens DW, Brown JS, Ydenberg RC (eds) (2007). Forag-ing: behavior and ecology. University of Chicago Press,Chicago, IL
Taylor PS, Nettleship DN (1974) The seabirds of Bonaven-ture Island, Percé Rock and area, Québec, in summer1974. Environment Canada Report No. 29, CanadianWildlife Service, Ottawa
Velarde E, Ezcurra E, Anderson DW (2013) Seabird dietsprovide early warning of sardine fishery declines in theGulf of California. Sci Rep 3: 1332
Wanless S, Murray S, Harris MP (2005) The status of north-ern gannet in Britain & Ireland in 2003/04. Br Birds 98: 280−294
Wilson RP, Pütz K, Peters G, Culik BM, Scolaro JA, Char-rassin JB, Ropert-Coudert Y (1997) Long-term attach-ment of transmitting and recording devices to penguinsand other seabirds. Wildl Soc Bull 25: 101−106
Wilson SG, Lawson GL, Stokesbury MJW, Spares A, Bous-tany AM, Neilson JD, Block BA (2011) Movements of At -lantic bluefin tuna from the Gulf of St. Lawrence to theirspawning grounds. Col Vol Sci Pap ICCAT 66: 1247−1256
Wood SN (2001) Minimizing model fitting objectives thatcontain spurious local minima by bootstrap restarting.Biometrics 57: 240−244
245
Editorial responsibility: Rory Wilson, Swansea, UK
Submitted: November 7, 2016; Accepted: December 4, 2017Proofs received from author(s): January 21, 2018