Embed Size (px)
Citation preview

♦Corresponding Author:
Somayeh Raiesdana, PhD Faculty of Electrical, Biomedical and Mechatronics Engineering, Qazvin Branch, Islamic Azad University, Qazvin, Iran Tel: 02833665275-3506 Fax: 02833685101
Email: [email protected]
Received: March 02, 2020; Accepted: October 19, 2020
Breast Cancer Detection Using
Optimization-Based Feature Pruning and
Classification Algorithms
Somayeh Raiesdana, PhD
Faculty of Electrical, Biomedical and Mechatronics Engineering, Qazvin Branch, Islamic
Azad University, Qazvin, Iran
Original Article
Middle East Journal of Cancer; January 2021; 12(1): 48-68
Abstract Background: Early and accurate detection of breast cancer reduces the mortality
rate of breast cancer patients. Decision-making systems based on machine learning and intelligent techniques help to detect lesions and distinguish between benign and malignant tumours.
Method: In this diagnostic study, a computerized simulation study is presented for breast cancer detection. A metaheuristic optimization algorithm inspired by the bubble-net hunting strategy of humpback whales is employed to select and weight the most effective features, extracted from microscopic breast cytology images, and optimize a support vector machine classifier. Breast cancer dataset from UCI repository was utilized to assess the proposed method. Different validation techniques and statistical hypothesis tests (t-test and ANOVA) were used to confirm the classification results.
Results: The accuracy, precision, and sensitivity metrics of the models were computed and compared. Based on the results, the integrated system with a radial basis function kernel was able to extract the fewest features and result in the most accuracy (98.82%). According to the tests, in comparison with genetic algorithm (GA) and particle swarm optimization (PSO), the WOA based system selected fewer features and yielded higher classification accuracy and speed. The statistical validation of the results further showed that this system outperformed the GA and PSO in some metrics. Moreover, the comparison of the proposed classification system with other successful systems indicated the former’s competitiveness.
Conclusion: The proposed classification model had superior performance metrics, less run time in simulation, and better convergence behaviour owing to its enhanced optimization capacity. Use of this model is a promising approach to develop a reliable automatic detection system.
Keywords: Breast neoplasm, Fine needle aspiration, Support vector machine, Classification
Please cite this article as: Raiesdana S. Breast cancer detection using optimization-based feature pruning and classification algorithms. Middle East J Cancer. 2021;12(1): 48-68. doi: 10.30476/mejc.2020. 85601.1294.
Optimization-Based Breast Cancer Detection
Middle East J Cancer 2021; 12(1): 48-68 49
Introduction
Breast cancer is the second most commonly diagnosed cancer after skin cancer, and the second leading cause of cancer mortality among women after lung cancer.1 According to the statistics of the Research Centre of Tehran University of Medical Sciences, 14000 new cases with breast cancer are detected each year. Breast cancer demands specific investigation as it affects the more sensitive and emotional members of society. Early, accurate, and reliable detection and treatment can alleviate stress, reduce the anxiety and emotional upheaval associated with breast cancer, and increase the survival rate. Hence, a vast number of studies and executive procedures have concentrated on this subject.2 Patients are often subjected to advanced imaging techniques, including sonography and mammography. Accurate diagnosis is highly related to the ability of the specialist and the quality of the images. The specialist should have sufficient knowledge regarding the pathology of the disease and the characteristics of the images to be able to visually recognize the breast masses, macrocalcification, and tumours. On the other hand, the diversity of abnormal tissues in shape, clustering, or branching, their being hidden in the dense breast tissues, and vague tumour margins are among the factors that may lead to missed or ignored tumours.3
Breast abnormalities are highly diverse, and their detection requires expertise. Nonetheless, a professional expert may miss some of the early or pale signs or mistakenly detect the kind of the abnormalities. This may be attributed to the irregular borders of tumours and the characteristics of the cells in the images. Border of tumours may disappear within the breast homogenous tissue and their shape may not be detectable. Therefore, abnormal masses in the breast soft tissue may be invisible or hardly detected. Meanwhile, images often have different brightness levels and wide dynamic ranges, and, also, suffer from poor contrast, hence the need for trustable detection systems. Some efforts have been made to propose automatic or semi-automatic systems with high accuracy and reliability, suitable for an early
detection of breast cancer and categorizing a tumour as benign or malignant.4
Machine learning and data mining techniques have been extensively employed to facilitate breast cancer detection.5 The objective is to reduce the variability of diagnosis among different specialists and increase the speed and accuracy of the detection process. Early detection of the type and stage of breast cancer allows the selection of effective treatments. In addition, early diagnosis and timely treatment result in a significant reduction in breast cancer-related mortality.
Sonographic and mammographic images are often used for the initial detection of the presence of masses/tumours. Nevertheless, pathologic tests of the suspicious breast tissues are required to accurately and reliably detect the existence of and discriminate the type of the masses and lumps. In this connection, fine needle aspiration cytology (FNAC) is a reliable method for the preoperative characterization of breast cancers detected either by self-examination or mammographic screening.6 The fine needle aspiration (FNA) images are basically evaluated by cytopathologists and with a microscope. There exist difficulties associated with visual subjective detection of tumours using microscopic FNA images, indicating the importance of developing automated diagnostic methods. Recently, efforts have been made to analyse cytological images using automated diagnostic methods and image analysis techniques.7,8 These approaches have mostly been concentrated on classifying FNA images as benign or malignant.
Nature-based optimization algorithms such as swarm-based algorithm have been reported to be suitable candidates for feature extraction in the classification process.9 In the present work, we utilized a recently-developed metaheuristic optimization algorithm, named whale optimization algorithm (WOA), in order to select suitable features, weight the selected features, and tune the parameters of a classification model. WOA mimics the social behaviour and cooperation of humpback whales in hunting. It is inspired by the foraging behaviour and the bubble-net hunting strategy of whales.10

Somayeh Raiesdana
Middle East J Cancer 2021; 12(1): 48-6850
The objective of this work was to present an improved classification scheme for breast cancer detection using a metaheuristic optimization algorithm. It was hypothesised that distinctive features of the cells extracted from FNA images could discriminate benign and malignant tumors and the whale optimization was convergent and able to find optimal input features and classifier’s parameter. In general, two different strategies are considered, when constructing an improved classification platform using an evolutionary algorithm. The first one is based on the fact that the quality of features fed into a classifier has a significant impact on the performance of a classification task. The second strategy is to optimize the classifier via tuning its parameters. The idea of this work is to improve the classification performance by better exploring the properties of datasets and accurately tuning the classifier parameters. To this end, selecting the best subset of input features that were highly discriminative and informative and able to reduce the computational time and improve the accuracy is considered. The selected features were further weighted to estimate their relative importance and assign them a corresponding weight. The idea is that highly important features should be emphasized and less informative ones should be ignored. Besides, optimizing the parameters of a support vector machine (SVM) classifier to improve the classification accuracy. By accurately tuning the SVM kernel parameters via an optimization algorithm, it is possible to map the data into higher dimensional spaces, expecting that the data will be more easily separated or better structured.
Two different scenarios are defined to accomplish this task. In the first one, distinctive features are extracted and a number of classification models are subsequently trained. The WOA is responsible for the feature extraction used in combination with a K-nearest neighbor (KNN) classifier to provide a supervised feature extraction process. A classification model based on SVM is also used to classify the data. In the second scenario, features are weighted and the classifier’s parameters are simultaneously tuned
using WOA with the aim of increasing the robustness of SVM classifiers. Such problems have to be solved at the same time because weighting features influences the appropriate classifier’s kernel parameters and vice versa. Both scenarios are implemented, evaluated, and compared to find a suitable platform of breast cancer classification problem.
The rest of the paper is organised as follows. In section 2, a literature review is included. In section 3, the data and processing techniques are introduced. Since the WOA technique is described substantially in references (e.g. Mirjalili et al.), it is reviewed briefly in section 3 and some details of its binary variant are then presented. The implementation of the proposed method and the foregoing scenarios are mentioned in section 4. Section 5 includes the results and evaluates the performance of the proposed method. Discussion and conclusion are respectively presented in sections 6 and 7.
Literature review
The literature review in this paper includes two parts; a review on breast cancer detection and a review on WOA (and its variants) optimization capabilities.
Review on literature for breast cancer detection
The Wisconsin diagnostic breast cancer (WDBC) database is a well-known public standard database, which includes a comprehensive set of features extracted from FNA images. This dataset is more often than not employed as a benchmark for the implementation and evaluation of proposed methods. Literatures reviewed in this section were all implemented using this database.
Fadzil et al. developed an automatic method to detect breast cancer through selecting the suitable features.11 They adjusted the optimization parameters of a neural network using a genetic algorithm. The proposed algorithm was assessed with three different error back-propagation techniques to accurately adjust the neural network weights. The neural network-genetic hybrid algorithm using error back-propagation learning technique resulted in the highest accuracy

Optimization-Based Breast Cancer Detection
Middle East J Cancer 2021; 12(1): 48-68 51
(99.43%). In another study, three different topologies of neural networks, including multilayer perceptron network, general regression, and probabilistic neural network were evaluated.12 Based on their results, multilayer perceptron network and general regression had a better accuracy compared with probabilistic network in classifying the WDBC dataset. Ashraf Osman et al. introduced the integration of differential evolutionary algorithms and multilayer perceptron to construct an automatic system for breast cancer
detection.13 They defined the data classification problem as a multiobjective optimization problem and made use of a multiobjective differential evolution algorithm. Reducing the learning error and minimizing the network structure were the two goals considered for the optimization problem. Their proposed multiobjective method yielded 97.5% accuracy for learning and test data.
An accuracy of 95.61% was achieved by prototype selection based on SVM for K-NN rules.14 The K-SVM model, integrating K-Means
Figure 1. The flowchart of the proposed breast cancer detection algorithm. Feature selection with WOA algorithm (left column) and feature classification with SVM algorithm (right column). Note that SVM1, SVM2, SVM3, and SVM4 stand for kernels of linear, polynomial, sigmoid, and RBF, respectively. WOA: whale optimization algorithm; SVM: support vector machine; WDBC: Wisconsin diagnostic breast cancer

Somayeh Raiesdana
Middle East J Cancer 2021; 12(1): 48-6852
Figure 2. The flowchart of the second scenario described in the text including an optimization algorithm for feature weighting and classifier tuning. SVM: support vector machine; WDBC: Wisconsin diagnostic breast cancer

Optimization-Based Breast Cancer Detection
Middle East J Cancer 2021; 12(1): 48-68 53
technique and SVM, was used for classification by Bichen et al. (2014).15 In this model, a K-Means algorithm was applied to detect the hidden patterns of benign and malignant tumours. The extracted patterns were employed to evaluate tumour membership in the learning phase. Afterwards, the membership values were used to classify any input tumour (as a new pattern) into benign or malignant. By applying a 10-fold cross-validation technique, the accuracy of the mentioned method on WBDC increased to 97.38%. This method extracted six features out of the 32 features in the training phase. The described method could not only successfully detect breast cancer, but also, significantly reduce the training time. The Naive Bayes classifier has also been utilized by researchers to classify the abnormalities of breast tissues.16,17 By introducing weights to the Bayes classifier, Karabatak was able to enhance the accuracy of the classifier and successfully evaluate his proposed method on several databases for breast cancer. An accuracy of 98.54% was obtained for WDBC dataset using the five-fold cross-validation technique. Researchers proposed a knowledge-based system for breast cancer classification using the fuzzy rule-based reasoning method.18 They utilized expectation maximization clustering technique to cluster data in distinctive groups. In their work, PCA was used for reducing the dimensionality of data and classification; regression trees (CART) was applied to extract fuzzy rules.
A data mining technique with a two-step feature reduction algorithm was further utilized to classify the extracted FNA features.19 The proposed two-step feature reduction method based on correlation coefficient (CC) and PCA algorithm significantly reduced the dimension of the data. A model based on decision tree and two-step feature reduction algorithm was applied to WDBC data; it was found that the texture mean, the concavity mean, the standard error of area, the largest area, and the largest concavity points were the most frequently selected features. Interestingly, all of the classification models chose these five features as the most effective properties. According to the results of this research, K-NN classifier with
Euclidean distance and two-step feature reduction (CC+PCA) had the highest accuracy in breast cancer detection.19 We can also make mention of a hybrid classification algorithm with remarkable accuracy proposed by Abed et al. (2016).20 This method was based on genetic optimization algorithm for selecting the most optimal features of WDBC and optimizing the K value for the K-NN classifier.
Review of literature for WOA
WOA has exhibited a good performance in solving various optimization problems in comparison to other known optimization algorithms such as particle swarm, gravitational search, and differential evolution and genetic.10 There exist some improvements for the WOA technique. WOA-GA algorithm was recently presented to generate a hybrid wrapper feature selection model.21 The objective was to enhance the exploitation property of the WOA algorithm. In this model, tournament selection mechanism of genetic algorithm was utilized to select the search agents instead of a random selection mechanism. This option provided more possibilities for weakening the selected solutions. In another model proposed by the same authors, a hybrid metaheuristics algorithm including WOA and simulated annealing (SA) was constructed to further enhance the exploitation of the WOA algorithm.21 In their work, SA was employed in two alternative approaches to create hybrid models. In the first model, SA was embedded in
Figure 3. This figure compares classification accuracy for different kernels used in the support vector machine classifier. RBF: radial basis function.

Somayeh Raiesdana
Middle East J Cancer 2021; 12(1): 48-6854
WOA to search for the neighborhood of the best search agent to ensure that it is the local optimum. SA was used to ameliorate the exploitation by searching for the most promising regions located by the WOA algorithm. In the second model, SA was employed in a pipeline mode after WOA termination, aiming to enhance the best-found solution. Classification results for 18 standard benchmark datasets from UCI repository corroborated the efficiency of the hybrid WOA, looking for the feature space and selecting the most informative attributes in comparison with original WOA and other state-of-the-art metaheuristic searching algorithms such as genetic and swarm optimizations.21
In another recent study, the WOA was compared and contrasted with the grey wolf optimization technique and the hybrid grey wolf optimizer–sine cosine algorithm (GWO–SCA).22 The GWO–SCA was able to deal with uncertain environments using the GWO algorithm for exploitation and the sine cosine algorithm for exploration. More tests revealed the excellent performance of WOA in comparison with 10 different metaheuristic searching algorithms for solving a number of benchmark optimization problems and classifying some well-known biomedical datasets. Nonetheless, comparison of run times between WOA and GWO (and its variants) showed less run time for GWO in solving almost all the 22 standard optimization problems that were considered in that reference.22
Furthermore, the convergence speed and accuracy of WOA in solving challenging datasets were less than SCA probably due to getting stuck in the local minima.
Materials and Methods
Dataset FNA is a simple and inexpensive test for
assessing breast suspicious tissues. In this
procedure, intra-tissue fluid samples are extracted from breasts and visually examined with a microscope. The cells and their clustering patterns are very diverse and complex. Staging and classification of suspicious cells are important steps to cancer diagnosis and determining its type and extent. Structural differentiation of cells (in size, shape, and staining of the nucleus) and the mitosis rate are among the features often considered to assess cancerous tissues. Since the visual discrimination is difficult, automatic intelligent systems could be conducive to characterizing cell nuclei and their features to decide on the type of the lumps or masses.23
In this diagnostic study, we utilized a publicly available database for implementation. The data were acquired from UCI machine learning repository which is open access for research purposes (https://archive.ics.uci.edu/ml/datasets/ Breast+Cancer+Wisconsin+(Diagnostic); Ethical approval was not required for the present work. The WDBC dataset included quantitative results of FNA tests conducted for 569 patients in
Table 1. Confusion matrix Real Class
Negative Positive Model outcome Positive True Positive False Positive
Negative False Negative True Negative
Figure 4. Convergence curves for WOA, GA and PSO are compared. WOA: whale optimization algorithm; GA: genetic algorithm; PSO: particle swarm optimization

Optimization-Based Breast Cancer Detection
Middle East J Cancer 2021; 12(1): 48-68 55
Wisconsin Hospital.24 This data was labelled “determining the existence or absence of cancer”. In WDBC dataset, each patient was labelled “benign or malignant”, representing the kind of tumour. Of the 569 available samples in this database, 357 samples were benign, and 212 were malignant.
A matrix including the features extracted from FNA microscopic images was shared for each subject in this open access data. To extract the numerical features, the microscopic images were initially converted to grayscale digital images; some image processing techniques were then employed to specify the boundary of the cells’ nuclei in microscopic images. Subsequently, for each nucleolus, we extracted features such as radius (distance from center to points on the perimeter), texture (the variance of grayscale level for pixels inside the nucleolus), perimeter, area, compactness (the square of perimeter divided by area), smoothness (local variations in radius length), concavity (severity of concave portions of the contour), concave points (number of concave portions of the contour), symmetry, and fractal dimension (fractal dimension of the nucleolus boundary resulting from the coastline approximation). Overall, 10 features were extracted for each nucleolus in an image. Ultimately, we computed the mean, standard error, and the largest value (the average of the three largest values) of each feature, yielding an overall 30 real numerical values for each subject.
Data analysis
Feature selection process is often performed in automatic decision-making and classification problems to identify the effective features and eliminate irrelevant and redundant features. For high dimensional data, feature selection is considered as an efficient and necessary step for reducing the dimensionality; this helps to improve the accuracy of the system and speed up the classification procedure. In the following, we described the metaheuristic searching algorithm inspired from the social behaviour of humpback whales in hunting (WOA) for feature reduction. This method is specialized to globally explore
the problem space and extract an optimum subset of features.
WOA
According to researchers, there exist special cells in certain parts of a whale’s brain that are quite similar to spindle cells in the human brain. These cells are responsible for judgment, feelings, and social behaviour. This might be the reason for the whales’ ability to think, learn, judge, communicate, and have feelings. Humpback whales have specific behaviours in their feeding and hunting. Whales create distinctive circular bubbles around the prey (bubbles can be upward spiral or double loops) on the surface of the water to entrap the prey and hunt it. This method is called bubble net hunting. In WOA whales’ spiral bubble manoeuvre is mathematically modelled.10 The following steps should be considered in implementing the WOA. 1. Creating the initial population of artificial
whales (in the optimization problem, each whale represents a solution for the problem being solved).
2. Selecting the best whale according to its distance from the prey (evaluating each solution and determining the fitted one).
Figure 5. ROC curves are plotted to compare GA-SVM, WOA-SVM and PSO-SVM. WOA: whale optimization algorithm; GA: genetic algorithm, PSO: particle swarm optimization, SVM: support vector machine; ROC: recursive operating characteristic

Somayeh Raiesdana
Middle East J Cancer 2021; 12(1): 48-6856
3. Updating the position of whales by three processes:
• Searching for prey (exploration) • Encircling the prey • Spiral bubble net attaching (exploitation)
4. Referring to step 2 if the termination condition is not satisfied.
In WOA, an initial population of artificial whales is randomly distributed in the searching space. Each artificial whale, which is a solution for the problem being solved, comprises a position vector, which is defined by a vector of length n, representing the number of parameters to be optimized. At each iteration of the optimization process, the first step is to select the most optimal solution. The closer the whale is to the prey, the higher the probability of its selection will be. The best solution corresponds to the whale with the least distance to the prey. When the best agent is chosen, other whales update their positions towards the best search agent. In the second stage, the position of each whale is updated using three mechanisms, namely encircling the prey, exploitation, and exploration. This phenomenon can be mathematically presented with the following equations:
(1)
, where A and C are coefficient vectors, X* is the position vector of the best solution, and X is the position used for each possible solution. Symbol | | represents the absolute value. Vectors A and C are calculated as follows:
(2)
, where a is a parameter that decreases linearly over the course of iteration, and r is a random vector in the interval [0;1]. Hence, each agent (whale) in the vicinity of the best existing response (prey) can update its position over the algorithm iterations. This simulates the mechanism of prey recognition and its encircling by whales. Afterwards, the position of each artificial whale is updated during both exploitation and exploration phases. In the former phase, whales try to hunt the best prey by a process called bubble-net attacking. This two-step process includes both shrinking the encircling mechanism and spiral updating of the position. After encircling, the shrinking mechanism occurs through reducing the value of a in equation 2. This generates smaller circles around the prey. Next, all positions are updated, and the whales attack the prey. A distance function between the whale and the prey is modelled by a spiral equation that mimics the helix-shaped movement of humpback. An equation for simulating the position of whale over time can be formulated as below:
(3)
In this equation, is the distance between the prey and the ith whale, b is a constant value, and l is a random number in the interval [-1 1]. In summary, when humpback whales reach a prey, they swim both inside a small circle and along a spiral path (meaning both mechanisms of encircling and making spiral bubbles are simultaneously in progress). In this
Table 2. Implementation parameters for WOA, GA, and PSO WOA PSO GA
population size 100 swarm size 100 population size 50 a in equation 2 [0,2] velocity scalar coefficient (ω) 1 probability of cross over 0.5 b in equation 3 1 velocity change in each iteration 99% probability of mutation 0.3 l in equation 3 [-1,1] velocity equation coefficients 2.5 elite rates 0.2
(φ1and φ1) maximum 100 maximum number of iterations 100 maximum number of 100 number of iterations iterations WOA: whale optimization algorithm, GA: genetic algorithm, PSO: particle swarm optimization

Optimization-Based Breast Cancer Detection
Middle East J Cancer 2021; 12(1): 48-68 57
algorithm, the probability of choosing either shrinking encircling mechanism or spiral movement is set to 50% to update the whales’ position. This process is modelled as below:
(4) p is a random number in the interval [0 1].
To find the prey, whales search randomly prior to performing the bubble net strategy. To consider this natural behaviour in the WOA model, an exploration mechanism is further included. During exploration, whales search for a new prey (the best response) by moving randomly in the search space. In the exploration phase, the position of each whale is updated in accordance with its distance to other whales. This means that instead of making updates according to the best-found agent, positions are updated based on a randomly selected agent. Similar to the shrinking phase, it is possible to simulate this behaviour by making changes in vector A (equation 2). It was proposed that elements of A are set randomly larger than 1 or smaller than -1 to make the search agent move far away from a reference whale.10 Using this mechanism and assuming | A| >1, exploration phase allows WOA to perform a global search. The exploration phase is formulated as:
(5)
, where is a random position vector stating a random whale.
Noteworthy, the convergence of WOA was evaluated on 29 different mathematical benchmark optimization problems and compared with other state-of-the-art metaheuristic methods.10 In this paper, analysis of convergence behaviour indicated the behaviour in local maxima avoidance and convergence speed.
Implementation of the proposed methods
First scenario: In this implementation, the effective features are extracted by binary whale optimization algorithm (BWOA). For this purpose, the position vector for each artificial whale is considered as a binary array with n components (n is the number of features). The amount of ith component is equal to 0 (when the feature is not selected) or 1 (when it is selected). A transfer function can be utilized to convert a continuous swarm intelligence technique to a binary algorithm without changing its structure. In this transfer function, the input is the distance calculated for each whale and the output is a number in the interval [0 1], which indicates the probability of updating the whale’s position. The larger the distance for the search agent, the more probable its updating will be. To simulate the sudden position changes for the whales far away from the goal, a V shaped transfer function was selected to create BWOA:
(6)
Table 3. Comparison of different classification models with RBF kernel using 10-fold cross validation Model Feature count* Accuracy Precision Sensitivity
(out of 30) Train Test Train Test Train Test
1 10 96 94.7 95.5 94.6 96.1 97 2 7 100 98.3 97 94.8 100 98.5 3 11 95.4 93 97.8 95.1 92.7 90.9 4 12 98.2 96.6 98.2 98 94.5 93.8 5 7 99.1 98.4 100 99.4 100 98.7 6 9 100 99.4 100 96.8 97.8 96.2 7 8 92.8 91.7 95.1 95 94.4 94 8 11 97.2 95.9 97 92.1 95.9 93.2 9 8 99.3 96.4 94.3 90.3 100 97 10 9 97.6 94.1 96.2 94.3 96.1 95.3 Average 9.2 97.5 95.8 97.1 95 96.7 95.4 RBF: radial basis function; * Number of selected features
Somayeh Raiesdana
Middle East J Cancer 2021; 12(1): 48-6858
In this equation, D is the distance defined in equation 5. The probability of position update for all the artificial whales is calculated using the transfer function of equation (6); a new position is then computed for each agent in the binary search space as:
(7)
r is a random number in the interval [0 1]; this number determines the solution vector components to be updated. For random r less than T, the corresponding component is complemented.
In evolutionary algorithms, the optimality of the selected solutions is assessed over iterations using a predefined criterion. This continues until the algorithm converges to the best solution. In order to select a suitable subset of features for an optimum classification performance, a fitness function based on classification metrics is employed. Of note, a compromise between “exiguity” and “eligibility” of the selected subset of feature should be existed. Therefore, the following fitness function is proposed here:
(8)
, where n is the total number of features and s is the number of selected features. The first term in this equation is a measure of classification accuracy, and the second one is the feature reduction ratio. Due to the priority of detection accuracy to the subset size of the feature in a classification task, α is selected more often than β.
As previously mentioned, BWOA is initiated by a number of randomly-initialized subsets of features (arrays of length n with random elements of 0 and 1). Following enough iterations, the best subset (entailing suitable non-redundant features) is introduced. During the feature extraction phase, reduced subsets of feature, suggested by BWOA at each iteration, are evaluated with a KNN classifier. The KNN classifier learns to classify the reduced features into benign and malignant at the training phase. Next, the accuracy of KNN classification on the test data and the number of selected features is employed to calculate the eligibility of each whale. In other words, each subset of reduced features is assessed based on two criteria: accuracy of KNN classifier and the number of selected features. On this basis, BWOA
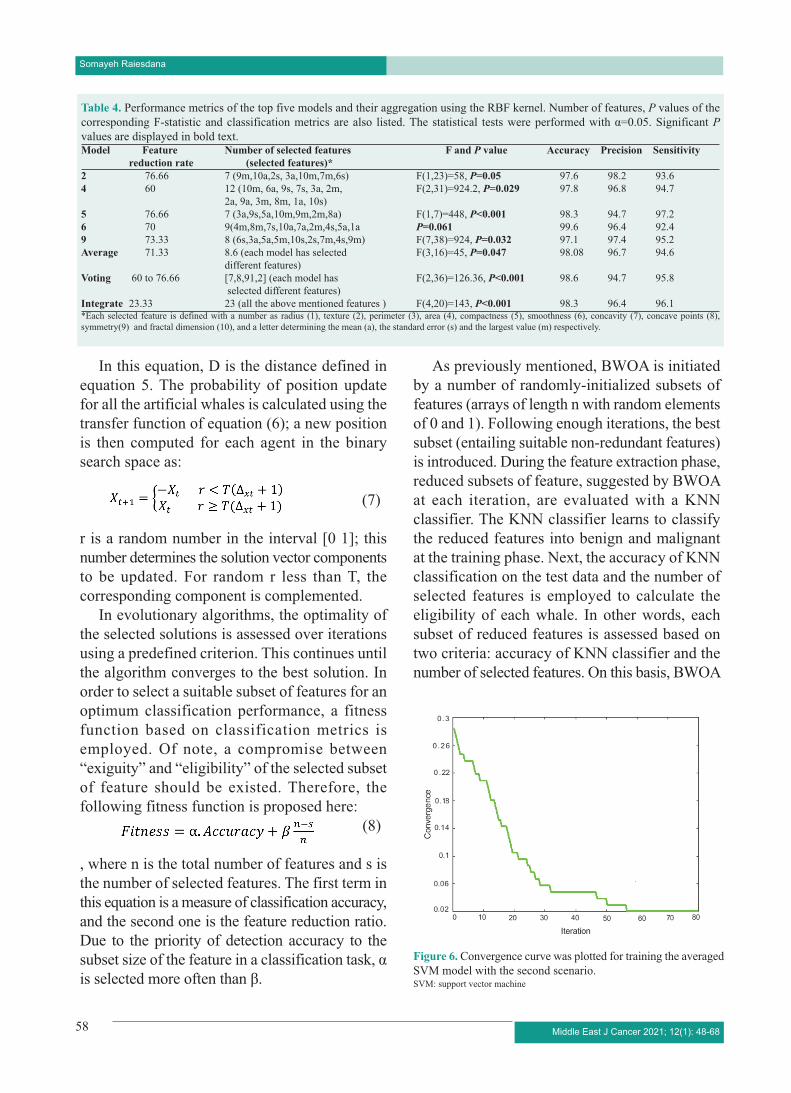
Table 4. Performance metrics of the top five models and their aggregation using the RBF kernel. Number of features, P values of the corresponding F-statistic and classification metrics are also listed. The statistical tests were performed with α=0.05. Significant P values are displayed in bold text. Model Feature Number of selected features F and P value Accuracy Precision Sensitivity
reduction rate (selected features)*
2 76.66 7 (9m,10a,2s, 3a,10m,7m,6s) F(1,23)=58, P=0.05 97.6 98.2 93.6 4 60 12 (10m, 6a, 9s, 7s, 3a, 2m, F(2,31)=924.2, P=0.029 97.8 96.8 94.7
2a, 9a, 3m, 8m, 1a, 10s) 5 76.66 7 (3a,9s,5a,10m,9m,2m,8a) F(1,7)=448, P<0.001 98.3 94.7 97.2 6 70 9(4m,8m,7s,10a,7a,2m,4s,5a,1a P=0.061 99.6 96.4 92.4 9 73.33 8 (6s,3a,5a,5m,10s,2s,7m,4s,9m) F(7,38)=924, P=0.032 97.1 97.4 95.2 Average 71.33 8.6 (each model has selected F(3,16)=45, P=0.047 98.08 96.7 94.6
different features) Voting 60 to 76.66 [7,8,91,2] (each model has F(2,36)=126.36, P<0.001 98.6 94.7 95.8
selected different features) Integrate 23.33 23 (all the above mentioned features ) F(4,20)=143, P<0.001 98.3 96.4 96.1 *Each selected feature is defined with a number as radius (1), texture (2), perimeter (3), area (4), compactness (5), smoothness (6), concavity (7), concave points (8), symmetry(9) and fractal dimension (10), and a letter determining the mean (a), the standard error (s) and the largest value (m) respectively.
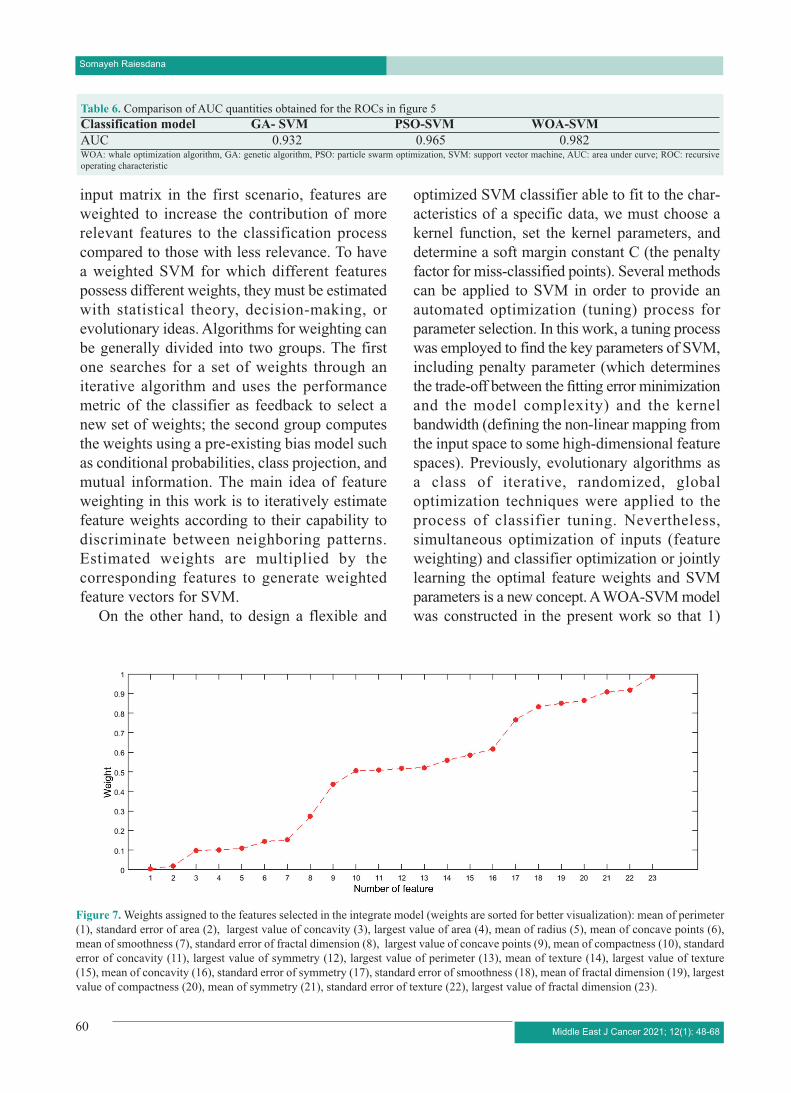
Figure 6. Convergence curve was plotted for training the averaged SVM model with the second scenario. SVM: support vector machine

Optimization-Based Breast Cancer Detection
Middle East J Cancer 2021; 12(1): 48-68 59
searches among the several possible subsets of features to find the optimized solution. The termination condition for search is to reach either the maximum number of iterations or the best fitness. A distance function is defined for KNN classifier to analyse the similarity of samples within a class.26 Various distance functions were introduced in the literature, while the Euclidean distance function is the most widely employed. Euclidean distance of the two vectors xs and yt is defined as follows:
(9)
Another parameter to be defined in KNN classifier is a constant (K) which determines the number of neighbours. Choosing the optimal K value influences the classification accuracy. Generally, a compromise is considered in selecting the optimal K value to achieve the most correct classification rate. Notably, a higher K reduces the effect of noise on the classification but makes the boundaries between classes less distinct. Also, the odd values of K (1, 3, 5, 7, 9) are preferred to avoid tied votes.
Ten-fold cross-validation technique was employed to train KNN classifiers. The input data was divided into 10 sections, and each time, nine sections were used to train a model, and one section was employed to test it. This process was repeated 10 times until all sections were tested once. At each repetition, the training data were given to WOA in order to select the more important features according to the proposed fitness function. After training a KNN classifier via these features, its accuracy on test data was
computed for evaluation and subset selection. At the end of this step, we had 10 optimized solutions (one for each fold). The classification procedure using the reduced features were then continued and prediction models using SVMs were designed for the detection and prognosis of the breast cancer. The performance of an SVM classifier depends on the selection of a suitable kernel function and its parameters; therefore, we evaluated the SVM performance with four different kernel functions, namely linear, polynomial, sigmoid, and RBF to obtain the best possible result. In addition, different combinational classification models such as averaging, voting, and integration models were implemented to classify the reduced features of breast cancer into benign and malignant. Training of SVMs was such that at each repetition, the features proposed by the whale algorithm (consistent with the ones available in the final position of the best whale as the optimized solution) were extracted from the train and test data for application to the SVM. Meanwhile, the rest of the features were set aside. Ten-fold cross validation was used for training as it was mentioned for KNN classifier. Figure 1 depicts the flowchart of the proposed system.
Second scenario: This scenario, which basically follows the first one, is to make more improvement in the classification performance. Unlike the first scenario, in which feature selection and classification steps are independent, feature weighting and classifier tuning processes are performed simultaneously in this implementation. The purpose of a feature weighting method is to assign real-valued numbers to each feature. Subsequent to selecting the best features of the
Table 5. Comparison of three different optimization-based feature reduction techniques Model Feature Mean Average Features consistency %
reduction rate accuracy run time(s) GA-SVM 65 93.4 4:20 texture-fractal dimension- 66
perimeter-symmetry- PSO-SVM 58 96.2 3:38 area-smoothness-fractal 72
dimension-concavity WOA-SVM 68 96.7 3:45 symmetry-compactness- 86
fractal dimension- concavity WOA: whale optimization algorithm, GA: genetic algorithm, PSO: particle swarm optimization, SVM: support vector machine
Somayeh Raiesdana
Middle East J Cancer 2021; 12(1): 48-6860
input matrix in the first scenario, features are weighted to increase the contribution of more relevant features to the classification process compared to those with less relevance. To have a weighted SVM for which different features possess different weights, they must be estimated with statistical theory, decision-making, or evolutionary ideas. Algorithms for weighting can be generally divided into two groups. The first one searches for a set of weights through an iterative algorithm and uses the performance metric of the classifier as feedback to select a new set of weights; the second group computes the weights using a pre-existing bias model such as conditional probabilities, class projection, and mutual information. The main idea of feature weighting in this work is to iteratively estimate feature weights according to their capability to discriminate between neighboring patterns. Estimated weights are multiplied by the corresponding features to generate weighted feature vectors for SVM.
On the other hand, to design a flexible and
optimized SVM classifier able to fit to the char-acteristics of a specific data, we must choose a kernel function, set the kernel parameters, and determine a soft margin constant C (the penalty factor for miss-classified points). Several methods can be applied to SVM in order to provide an automated optimization (tuning) process for parameter selection. In this work, a tuning process was employed to find the key parameters of SVM, including penalty parameter (which determines the trade-off between the fitting error minimization and the model complexity) and the kernel bandwidth (defining the non-linear mapping from the input space to some high-dimensional feature spaces). Previously, evolutionary algorithms as a class of iterative, randomized, global optimization techniques were applied to the process of classifier tuning. Nevertheless, simultaneous optimization of inputs (feature weighting) and classifier optimization or jointly learning the optimal feature weights and SVM parameters is a new concept. A WOA-SVM model was constructed in the present work so that 1)
Table 6. Comparison of AUC quantities obtained for the ROCs in figure 5 Classification model GA- SVM PSO-SVM WOA-SVM
AUC 0.932 0.965 0.982 WOA: whale optimization algorithm, GA: genetic algorithm, PSO: particle swarm optimization, SVM: support vector machine, AUC: area under curve; ROC: recursive operating characteristic
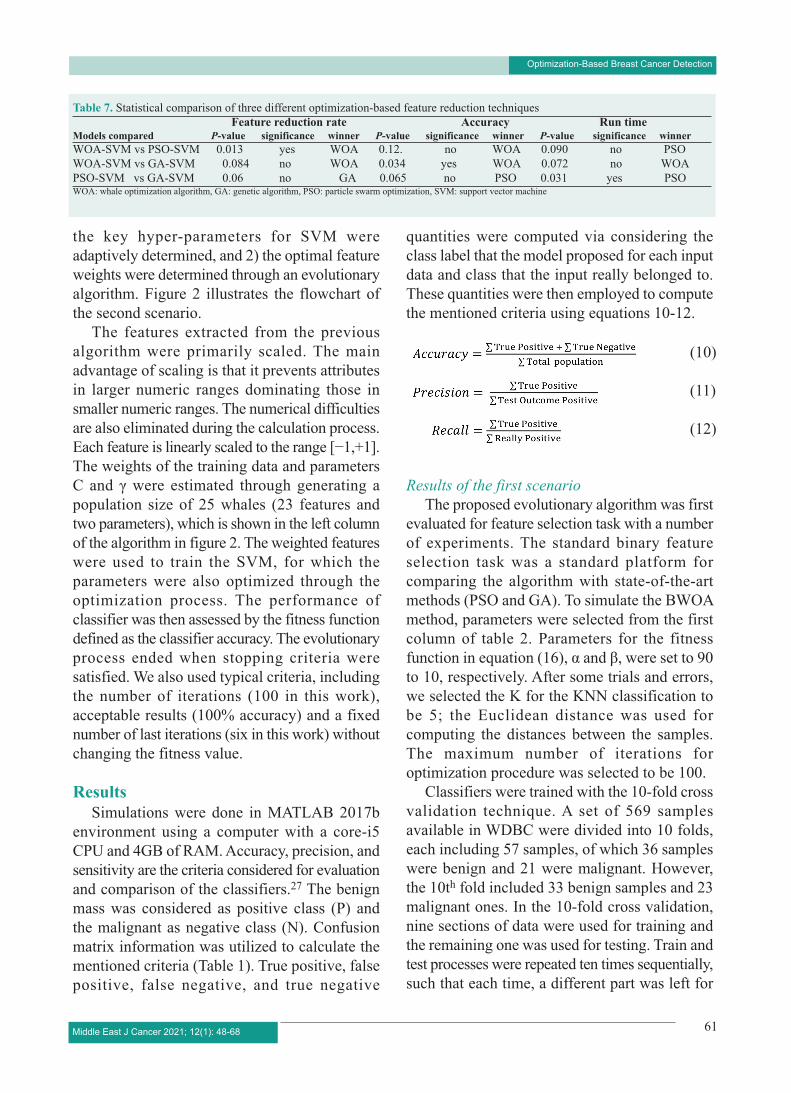
Figure 7. Weights assigned to the features selected in the integrate model (weights are sorted for better visualization): mean of perimeter (1), standard error of area (2), largest value of concavity (3), largest value of area (4), mean of radius (5), mean of concave points (6), mean of smoothness (7), standard error of fractal dimension (8), largest value of concave points (9), mean of compactness (10), standard error of concavity (11), largest value of symmetry (12), largest value of perimeter (13), mean of texture (14), largest value of texture (15), mean of concavity (16), standard error of symmetry (17), standard error of smoothness (18), mean of fractal dimension (19), largest value of compactness (20), mean of symmetry (21), standard error of texture (22), largest value of fractal dimension (23).
Optimization-Based Breast Cancer Detection
Middle East J Cancer 2021; 12(1): 48-68 61
the key hyper-parameters for SVM were adaptively determined, and 2) the optimal feature weights were determined through an evolutionary algorithm. Figure 2 illustrates the flowchart of the second scenario.
The features extracted from the previous algorithm were primarily scaled. The main advantage of scaling is that it prevents attributes in larger numeric ranges dominating those in smaller numeric ranges. The numerical difficulties are also eliminated during the calculation process. Each feature is linearly scaled to the range [−1,+1]. The weights of the training data and parameters C and γ were estimated through generating a population size of 25 whales (23 features and two parameters), which is shown in the left column of the algorithm in figure 2. The weighted features were used to train the SVM, for which the parameters were also optimized through the optimization process. The performance of classifier was then assessed by the fitness function defined as the classifier accuracy. The evolutionary process ended when stopping criteria were satisfied. We also used typical criteria, including the number of iterations (100 in this work), acceptable results (100% accuracy) and a fixed number of last iterations (six in this work) without changing the fitness value.
Results
Simulations were done in MATLAB 2017b environment using a computer with a core-i5 CPU and 4GB of RAM. Accuracy, precision, and sensitivity are the criteria considered for evaluation and comparison of the classifiers.27 The benign mass was considered as positive class (P) and the malignant as negative class (N). Confusion matrix information was utilized to calculate the mentioned criteria (Table 1). True positive, false positive, false negative, and true negative
quantities were computed via considering the class label that the model proposed for each input data and class that the input really belonged to. These quantities were then employed to compute the mentioned criteria using equations 10-12.
Results of the first scenario
The proposed evolutionary algorithm was first evaluated for feature selection task with a number of experiments. The standard binary feature selection task was a standard platform for comparing the algorithm with state-of-the-art methods (PSO and GA). To simulate the BWOA method, parameters were selected from the first column of table 2. Parameters for the fitness function in equation (16), α and β, were set to 90 to 10, respectively. After some trials and errors, we selected the K for the KNN classification to be 5; the Euclidean distance was used for computing the distances between the samples. The maximum number of iterations for optimization procedure was selected to be 100.
Classifiers were trained with the 10-fold cross validation technique. A set of 569 samples available in WDBC were divided into 10 folds, each including 57 samples, of which 36 samples were benign and 21 were malignant. However, the 10th fold included 33 benign samples and 23 malignant ones. In the 10-fold cross validation, nine sections of data were used for training and the remaining one was used for testing. Train and test processes were repeated ten times sequentially, such that each time, a different part was left for
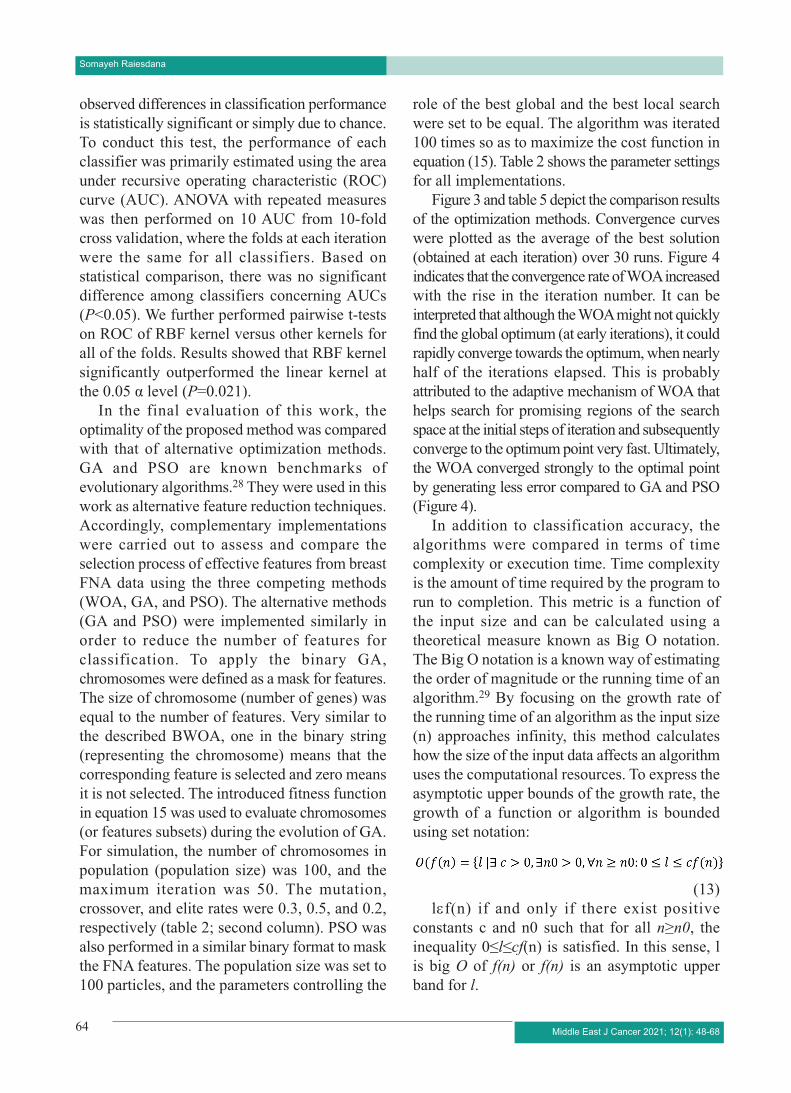
Table 7. Statistical comparison of three different optimization-based feature reduction techniques Feature reduction rate Accuracy Run time
Models compared P-value significance winner P-value significance winner P-value significance winner
WOA-SVM vs PSO-SVM 0.013 yes WOA 0.12. no WOA 0.090 no PSO WOA-SVM vs GA-SVM 0.084 no WOA 0.034 yes WOA 0.072 no WOA PSO-SVM vs GA-SVM 0.06 no GA 0.065 no PSO 0.031 yes PSO WOA: whale optimization algorithm, GA: genetic algorithm, PSO: particle swarm optimization, SVM: support vector machine
(10)
(11) (12)

Somayeh Raiesdana
Middle East J Cancer 2021; 12(1): 48-6862
the test. After that, SVM classifiers were learned with reduced feature subsets suggested by the 10 different models. Table 3 shows the results of performance evaluation for SVM models with RBF kernel. Parameters for RBF kernel were C=10 and γ =0.027. It can be inferred from this table that an accurate classification was achieved using nearly one third of the existing features. Moreover, the results of different classification models were significantly consistent. We selected and used the top five models based on accuracy for more evaluations. Five models with the highest accuracy (considering the average of train and test accuracy) were recruited within three different configurations: 1) the averaged model, 2) the model based on majority voting, and 3) the integrated model. First, all available input samples were presented to the top models and the performance metrics were computed for each one. The averaged model was simply constructed by averaging the outputs of the models. The output of the classification model was determined via the majority voting rule. This means that each sample was classified as benign or malignant based on the votes received for each class by the top models. In the third configuration, all features proposed by top models were collectively considered to train an SVM classifier. The redundant features were eliminated for this classification task. The performance metrics, namely accuracy, precision, and sensitivity were computed for each of the top models and ensemble models. Table 4 shows the results of the described scenarios for SVM with RBF kernel. This result confirms that the combination of different classifiers could improve the classification results. As observed, aggregating the classifiers with a better performance in isolation resulted in accurate and precise classification.
The features extracted by each model were further analysed by one-way multivariate analysis
of variance (mANOVA). The aim was to specify whether the extracted features were significantly different (P< 0.05). ANOVA can be used to test the significance of a feature vector and test the null hypothesis for multiple features extracted for each model. With one-way ANOVA, it is possible to simultaneously test the equality of multiple means using the variances. ANOVA test can determine whether the mean of variables differs significantly among the groups. In this test, we focused on specifying whether the entire set of feature means differed from one group (benign) to the next (malignant). The third column in table 4 shows the result of ANOVA test for each classification model. The feature subsets that were significantly different between the groups were written in bold. The features selected via the top models and their combinations were almost significantly different between benign and malignant classes. For instance, the voting-based model was found to be significantly different (F(2,36)=126.36, P<0.001).
As can be inferred from table 4, employing the voting method or applying all proposed features in aggregation (rows 7 and 8) increased the detection accuracy to more than 98%. It can be stated that by combining the best classifiers, the integrated method was able to provide robust predictions in dealing with diverse types of tumours and microcalcifications. However, this combinational model uses more features for classification and is especially suitable for malignant tumour detection, which demands more sensitivity. The voting-based model selected fewer features for classification, implying its low cost. The results of accuracy and other metrics and the statistical tests showed that the voting system is an efficient combinational method. In this system, a single sample was classified via a consultation accomplished among the expert models. i.e., the outstanding classification models shared
Table 8. Comparison of different classification models for the second scenario (weighting and tuning were added) Model Accuracy Precision Sensitivity Area under curve Average run time(s)
Average 98.32 97.30 96.93 0.985 5:52 Voting 98.65 96.45 97.82 0.988 6:45 Integrate 21.99 97.81 97.49 0.992 6.36

Optimization-Based Breast Cancer Detection
knowledge, such as qualified experts, for classification of breast abnormalities, where lots of intrinsic ambiguities and uncertainties existed.
The classification procedure was repeated four times with different kernel functions. Results of different SVM kernels were compared in terms of the accuracy of the averaged system, the voting-based system, and the integrated system. The results are expressed as bar plots in figure 3. As observed, the highest accuracy (98.6%) in the voting-based strategy belonged to SVM with RBF kernel. It is notable that linear kernel function had less success probably due to the non-linear nature of the data. This classifier was also prone to over-fitting. The third degree polynomial and quadratic kernels showed better results than linear
kernel, while RBF kernel outperformed all. The stationary, isotropic, and infinitely smooth RBF kernel had an almost superior performance regarding all the classification configurations. This kernel can create a non-linear mapping of input samples into a higher dimensional space, where the classes are easily separable, hence readily able to handle the existing nonlinearities between the attributes and the tumour kind.
As reported, the RBF kernel nominally outperformed different kernels. However, being nominally the superior classifier does not necessarily mean a statistically significant difference. Indeed, the statistical outperformance of this classifier has to be tested. When comparing classifiers, it is important to assess whether the
Middle East J Cancer 2021; 12(1): 48-68 63
Table 9. Comparison of some recently proposed methods for WDBC classification Method Implementation details Accuracy Sensitivity Specificity
Quasiconformal A novel dimensionality reduction method 97.26 - - kernel common locality named (QKCLDA) which preserves the discriminant31 local and discriminative relationship
of the data for classification PSO+ Boosted C5.032 Combination of particle swarm optimization 96.38 97.70 94.28
with boosted C5.0 decision tree classifier PSO-KDE8 A new model for specifying the kernel bandwidth 98.45 100 97.99
based PSO with non-parameter kernel density estimation (KDE)-based classifier; PSO is used to simultaneously determine l the optima kernel bandwidth and feature subset.
K-Boosted C5.033 K-means clustering for undersampling both the 98.2 93.75 100
majority and minority classes and boosted ensemble classifier for class imbalance problem.
FOA-SVM34 Fruit fly optimization algorithm was used 96.90 96.86 96.89
to address SVM’s model selection and optimal parameter tuning in order to maximize the generalization capability of the SVM classifier.
GA-ANN with resilient An automatic GA-based and hidden node size 98.29 99.52 97.60 back propagation35 optimization was proposed; simultaneous and
automatic search of the optimal hidden node size of the ANN and the most salient feature subset was done.
MOEA/D feature Inter-class and intra-class distance measures were 96.53 - - selection and weighting maximized and minimized simultaneously by use method36 of a multi-objective evolutionary algorithm based
on decomposition (MOEA/D). WDBC: Wisconsin diagnostic breast cancer; SVM: support vector machine; PSO: particle swarm optimization, GA: genetic algorithm
Somayeh Raiesdana
observed differences in classification performance is statistically significant or simply due to chance. To conduct this test, the performance of each classifier was primarily estimated using the area under recursive operating characteristic (ROC) curve (AUC). ANOVA with repeated measures was then performed on 10 AUC from 10-fold cross validation, where the folds at each iteration were the same for all classifiers. Based on statistical comparison, there was no significant difference among classifiers concerning AUCs (P<0.05). We further performed pairwise t-tests on ROC of RBF kernel versus other kernels for all of the folds. Results showed that RBF kernel significantly outperformed the linear kernel at the 0.05 α level (P=0.021).
In the final evaluation of this work, the optimality of the proposed method was compared with that of alternative optimization methods. GA and PSO are known benchmarks of evolutionary algorithms.28 They were used in this work as alternative feature reduction techniques. Accordingly, complementary implementations were carried out to assess and compare the selection process of effective features from breast FNA data using the three competing methods (WOA, GA, and PSO). The alternative methods (GA and PSO) were implemented similarly in order to reduce the number of features for classification. To apply the binary GA, chromosomes were defined as a mask for features. The size of chromosome (number of genes) was equal to the number of features. Very similar to the described BWOA, one in the binary string (representing the chromosome) means that the corresponding feature is selected and zero means it is not selected. The introduced fitness function in equation 15 was used to evaluate chromosomes (or features subsets) during the evolution of GA. For simulation, the number of chromosomes in population (population size) was 100, and the maximum iteration was 50. The mutation, crossover, and elite rates were 0.3, 0.5, and 0.2, respectively (table 2; second column). PSO was also performed in a similar binary format to mask the FNA features. The population size was set to 100 particles, and the parameters controlling the
role of the best global and the best local search were set to be equal. The algorithm was iterated 100 times so as to maximize the cost function in equation (15). Table 2 shows the parameter settings for all implementations.
Figure 3 and table 5 depict the comparison results of the optimization methods. Convergence curves were plotted as the average of the best solution (obtained at each iteration) over 30 runs. Figure 4 indicates that the convergence rate of WOA increased with the rise in the iteration number. It can be interpreted that although the WOA might not quickly find the global optimum (at early iterations), it could rapidly converge towards the optimum, when nearly half of the iterations elapsed. This is probably attributed to the adaptive mechanism of WOA that helps search for promising regions of the search space at the initial steps of iteration and subsequently converge to the optimum point very fast. Ultimately, the WOA converged strongly to the optimal point by generating less error compared to GA and PSO (Figure 4).
In addition to classification accuracy, the algorithms were compared in terms of time complexity or execution time. Time complexity is the amount of time required by the program to run to completion. This metric is a function of the input size and can be calculated using a theoretical measure known as Big O notation. The Big O notation is a known way of estimating the order of magnitude or the running time of an algorithm.29 By focusing on the growth rate of the running time of an algorithm as the input size (n) approaches infinity, this method calculates how the size of the input data affects an algorithm uses the computational resources. To express the asymptotic upper bounds of the growth rate, the growth of a function or algorithm is bounded using set notation:
(13) lεf(n) if and only if there exist positive
constants c and n0 such that for all n≥n0, the inequality 0≤l≤cf(n) is satisfied. In this sense, l is big O of f(n) or f(n) is an asymptotic upper band for l.
Middle East J Cancer 2021; 12(1): 48-6864

Optimization-Based Breast Cancer Detection
The time complexity of the described procedures were computed. Observing that the algorithm run time had a polynomial profile of some degree, several models were fitted to estimate the order of a polynomial. O(n3) was the estimated time complexity of the classification task in this work. This states that since the population size grows unboundedly, the problem size also grows unboundedly; thus, a much larger computing resource is needed for the next iterations. The complexity can also be stated as O(K*N*M) for K (number of iterations), N (number of agents in the population), and M (number of features in each array representing the agent). The execution time of the algorithms was also computed and compared. Table 5 illustrates the run times for all methods, indicating the reasonably short run time for WOA.
ROC curves were then computed to compare the performance of competitive classification models. The ROC curve takes the specificity (the percentage of right classification on negative class) as x-axis and sensitivity (the percentage of correct classification on positive class) as y-axis. Additionally, the area under the ROC curve is a suitable metric for classification evaluation, which describes the probability when the prediction of true positive instance is higher than the true negative instance. In sum, the ROC depicts the relative tradeoffs between benefits (true positives) and costs (false positives).
ROC curves for three competitive classification models were drawn in one graph (Figure 5) to obtain the conclusion intuitively. As shown, all curves passed through the upper left corner, indicating the high overall accuracy. The AUC of each classification model was further computed and shown in table 6. All AUCs were greater than 0.5 and less than 1. This means that using these models for classification/prediction is better than random classification/prediction. Furthermore, the AUC value of WOA was higher than other AUC values. The higher the AUC value, the higher the accuracy rates of a classifier will be. Therefore, WOA is the most suitable model for making predictions on WDBC datasets.
Finally, T-tests were run to statistically compare
the three implementations based on GA, PSO, and WOA. The voting-based classification model with 10-fold cross-validation was implemented, and t-tests were applied on the evaluation metrics listed in table 5. The null hypothesis showed that the difference between the two averages was based on chance. When the obtained P value is lower than 0.05, one can say that the two averages are significantly different with a 95% confidence. P values obtained by the t-tests are listed in table 7. Each row in this table indicates the algorithm that performed best with the given performance metric. Based on the results presented in table 7, WOA-SVM classified tumours significantly faster and more accurately than GA-based classification. In addition, feature reduction rate for WOA was significantly better than GA and PSO.
Results of the second scenario
The previous section basically focused on validating the proposed WOA-based classification system. This section reports the improvement results via feature weighting and classifier tuning. An experiment was performed as an extension of the feature selection process done in the previous section. The ratio of weight to each feature was estimated using the evolutionary optimization algorithm described in the second scenario aimed at defining the importance degree of that feature. Average, voting, and integrate classification models were implemented and trained once again using 10-fold cross-validation technique, the weighted inputs, and the optimized kernel parameters. Figure 6 shows the convergence curve for the integrated model, which exhibits a better convergence behavior owing to the additional optimization procedure adopted in this experiment. Fewer training errors were obtained in fewer iterations compared to feature selection stage (Figure 4). The results of classification models are tabulated in table 8. Comparison of table 8 with tables 3, 5, and 6 indicates that the second scenario (with further optimization on features and classifier) improved the accuracy of WDBC classification.
To further evaluate the feature weighting process, the normalized weights estimated by the
Middle East J Cancer 2021; 12(1): 48-68 65

Somayeh Raiesdana
optimization method are illustrated in figure 7. By implementing the second scenario, all the remaining features extracted from the feature selection algorithm were assigned a real number in the interval [0 1]. Hence, besides pruning away the unnecessary weights, the weight assigned to each feature in this work was assessed. In figure 7, weights were sorted for better visualization, demonstrating an incremental trend. This allows one to select more relevant features, since some features were weighted substantially more than others.
Discussion
The hybrid method presented in this study was shown to be a robust classification technique with high performance metrics. The best classification platform was meticulously determined in this work. The proposed cancer classification model could successfully identify malignant samples with high sensitivity rate. Percentage of correct prediction (accuracy) and measure of accuracy provided that a specific class was predicted (precision) 21.99 and 97.81, respectively, which were competitive to the existing methods. These results show that the proposed method is promising for developing a reliable automatic detection system.
Combination of optimization-based feature selection algorithm with feature weighting and simultaneously tuning the classifier parameters (or modifying the structure of the classifier) improved the classification performance and provided an adaptable classification platform suitable for every given dataset. WOA was implemented twice in this paper: once in the binary format to mask the available features and select the best subset of features during an iterative evolution, and once for weighting the selected inputs and tuning the classifier. In addition to pruning away the unnecessary and redundant features, they were weighted in the present work. By this phase, more relevant features were further weighted prior to entering the classification model. Beside pruning and weighting the important features, making a proper input data for SVM, the best kernel parameters for the classification model were set in the proposed optimization
algorithm to ensure more improvement. Some efforts were previously made on feature selection and reduction (31 and 32) and classification structure improvement (34 and 35); however, the joint extraction of the weights and parameters was a novel technique implemented in this study. Classification metrics and statistical tests showed that the RBF kernel for SVM classifier significantly outperformed a number of kernels. We further optimized the penalty parameter and kernel bandwidth, as the two effective parameters affecting the SVM performance, for each classification model. This optimization process is not included in most of classification models, which use preset constant non-optimal values.
The contribution of distinctive feature to construct an optimal separating hyperplane for a classification model was more highlighted with the feature weighting process. This means that the more the information a certain feature provides for a classification process, the bigger the corresponding weight will be. In this sense, the specific pattern related to the weights of the obtained feature scan further help prune the features. Nonetheless, this needs more assessment with more data and different weighting algorithms. According to the map of the weights in our work (Figure 7) and owing to the obvious increasing trend of the weights, one can readily select the discriminative and informative features by choosing the features with higher weights.
By comparing WOA with GA and PSO (as state-or-the-art methods) via numerous experiments reported throughout this paper, it was observed that WOA had a better convergence behaviour, a shorter run time, a higher mean accuracy, and a higher AUC (Tables 5, 6, and 7 and Figures 4 and 5). Therefore, the WOA meta-heuristic algorithm is good enough for an optimization problem adopted for selecting suitable features for a classification task. However, there are variants and improvements for WOA which were not considered here.22 Since this work was more concentrated on classification platform, and not the optimization performance, the original WOA algorithm was utilized and compared with GA and PSO.
Middle East J Cancer 2021; 12(1): 48-6866

Optimization-Based Breast Cancer Detection
Conclusion
As a successful optimization algorithm, WOA avoids the local optimums and has an efficient convergence behaviour. Optimizing the structure of the classifier by tuning its parameter and selecting and weighting its entrance features showed further enhancement in the classifier performance. The assessments throughout the paper showed that the proposed method was able to optimally prepare the input data (dimensionality reduction and weighting) and tune the classifier structure, resulting in a high detection accuracy for breast cancer detection. Performance evaluations in this paper showed that overall, WOA was superior to other state-of-the-art meta-heuristic algorithms as it showed superior performance metrics, less run time, and a better convergence behavior. Given the comprehensive comparison made in the previous section, the proposed detection system was generally more satisfactory than other detection systems. Improvements are still required to resolve the previous disadvantages and present reliable and comprehensive diagnostic algorithms. Every step in either the detection of abnormalities or prognosis of disease is highly valuable due to the nature of disease and sensitivities of sufferers. Future works can concentrate on detecting tumour types other than benign or malignant. Moreover, other weighting and optimization techniques such as WOA variants can be tested and compared.
Conflict of Interest
None declared.
References 1. Siegel RL, Miller KD, Jemal A. Cancer Statistics, CA
Cancer J Clin. 2017;67(1):7-30. doi:10.3322/ caac.21387.
2. Cheng HD, Shan J, Ju W, Guo Y, Zhang L. Automated breast cancer detection and classification using ultrasound images: A survey. Pattern Recognition. 2010;43(1):299-317. doi: 10.1016/j.patcog.2009. 05.012.
3. Bozek J, Mustra M, Delac K, Grgic M. A survey of image processing algorithms in digital mammography. In: Grgic M, Delac K, Ghanbari M, editors. Recent advances in multimedia signal processing and
communications. Studies in computational intelligence, Vol. 231. Springer: Berlin, Heidelberg; 2009.p.631-657. doi: 10.1007/978-3-642-02900-4_24.
4. Shao YZ, Liu LZ, Bie MJ, Li CC, Wu YP, Xie XM, et al. Characterizing the clustered microcalcifications on mammograms to predict the pathological classification and grading: a mathematical modeling approach. J Digit Imaging. 2011;24(5):764-71. doi:10.1007/s10278-011-9381-2.
5. Peng L, Chen W, Zhou W, Li F, Yang J, Zhang J. An immune-inspired semi-supervised algorithm for breast cancer diagnosis. Comput Methods Programs Biomed. 2016;134:259-65. doi:10.1016/j.cmpb.2016.07.020.
6. Yip CH, Smith RA, Anderson BO, Miller AB, Thomas DB, Ang ES, et al. Guideline implementation for breast healthcare in low and middle-income countries: early detection resource allocation. Cancer. 2008;113: 2244-56. doi: 10.1002/cncr.23842.
7. Jelen L, Fevens T, Krzyzak A. Classification of breast cancer malignancy using cytological images of fine needle aspiration biopsies. Int J Appl Math Comput Sci. 2008;18(1):75-83. doi: 10.2478/v10006-008-0007-x.
8. Sheikhpour R, Agha Sarram M, Sheikhpour R. Particle swarm optimization for bandwidth determination and feature selection of kernel density estimation based classifiers in diagnosis of breast cancer. Applied Soft Computing. 2016;40:113-31. doi: 10.1016/j.asoc.2015. 10.005.
9. Meng Z, Pan J. HARD-DE: Hierarchical archive based mutation strategy with depth information of evolution for the enhancement of differential evolution on numerical optimization. IEEE Access. 2019;7:12832-54. doi: 10.1109/ACCESS.2019.2893292.
10. Mirjalili S, Lewis A. The whale optimization algorithm. Advances in Engineering Software. 2016; 95:51–67. doi: 10.1016/j.advengsoft.2016.01.008.
11. Ahmad F, Isa N, Noor M, Hussain Z. Intelligent breast cancer diagnosis using hybrid GA-ANN. Proceedings of the 5th International Conference on Computational Intelligence, Communication Systems and Networks; 2013 June 5-7; Madrid, Spain: IEEE Publisher; 2013. P.9-12. doi: 10.1109/CICSYN.2013.67.
12. Elgader HA, Hamza MH. Breast cancer diagnosis using artificial intelligence neural networks. J Sc Tech. 2011;12(1): 159-71.
13. Ibrahim AO, Shamsuddin SM, Saleh A, Abdelmaboud A, and Ali A. Intelligent multi-objective classifier for breast cancer diagnosis based on multilayer perceptron neural network and differential evolution computing. Proceedings of the 2015 International Conference on Computing, Control, Networking, Electronics and Embedded Systems Engineering (ICCNEEE); 2015 Sep 7-9; Khartoum, Sudan. IEEE Publisher; 2015. p.422-427. doi: 10.1109/ICCNEEE.2015.7381405.
14. Li Y, Hu Z, Cai Y, Zhang W. Support vector based prototype selection method for nearest neighbor rules. In: Wang L,
Middle East J Cancer 2021; 12(1): 48-68 67

Somayeh Raiesdana
Chen K, Ong YS, editors. Advances in natural computation. Lecture notes in computer science, Vol. 3610. Springer, Berlin, Heidelberg. 2005. p. 528-535.
15. Zheng B, Yoon SW, Lam SS. Breast cancer diagnosis based on feature extraction using a hybrid of K-means and support vector machine algorithms. Expert Systems with Applications. 2014;41(4):1476-82. doi: 10.1016/j.eswa.2013.08.044.
16. Karabatak M, Ince M C. An expert system for detection of breast cancer based on association rules and neural network. Expert Syst Appl. 2009;36(2): 3465-9. doi:10.1016/j.eswa.2008.02.064.
17. Karabatak M. A new classifier for breast cancer detection based on Naïve Bayesian. Measurement. 2015;72:32-6 . doi: 10.1016/j.measurement.2015. 04.028.
18. Nilashi M, Ibrahim O, Ahmadi H, Shahmoradi L. A knowledge-based system for breast cancer classification using fuzzy logic method. Telematics and Informatics. 2017;34(4):133-44. doi: 10.1016/j.tele.2017.01.007.
19. Sheikhpour R, Agha Sarram M, Zare Mirakabad MR, Sheikhpour R. Breast cancer detection using two-step reduction of features extracted from fine needle aspirate and data mining algorithms. [In Persian] Iranian Journal of Breast Disease (IJBD). 2015;7(4):43-51.
20. Abed BM, Shaker K, Jalab HA, Shaker H, Mansoor AM, Alwan AF, et al. A hybrid classification algorithm approach for breast cancer diagnosis. Proceedings of the 2016 IEEE Industrial Electronics and Applications Conference (IEACon); 2016. Kota Kinabalu, Malaysia. IEEE Publisher; 2016.p. 269-74. doi: 10.1109/ IEACON.2016.8067390.
21. Mafraj M, Mirjalili S. Whale optimization approaches for wrapper feature selection. Applied Soft Computing. 2018; 62(2):441-53. doi:10.1016/j.asoc.2017.11.006.
22. Singh N, Singh SB. A novel hybrid GWO-SCA approach for optimization problems. Engineering Science and Technology, an International Journal. 2017; 20(6): 586-1601. doi: 10.1016/j.jestch.2017. 11.001.
23. Wang P, Hua X, Li Y, Liu Q, Zhu X. Automatic cell nuclei segmentation and classification of breast cancer histopathology images. Signal Processing. 2016;122:1-13. doi:10.1016/j.sigpro.2015.11.011.
24. University of of California [Internet]. Oakland: The University; c1988. Available from: http://archive. ics.uci. edu/ml.
25. Dey P. Fine needle aspiration cytology, interpretation and diagnostic difficulties. India: Jaypee Brothers Medical Publishers; 2015. 572 p.
26. Medjahed SA, Saadi TA, Benyettou A. Breast cancer diagnosis by using k-nearest neighbor with different distances and classification rules. International Journal of Computer Applications. 2013;62(1). doi:10.5120/ 10041-4635.
27. Fiuzy M, Haddadnia J, Mollania N, Hashemian M,
Hassanpour K. Introduction of a new diagnostic method for breast cancer based on fine needle aspiration (FNA) test data and combining intelligent systems. Iran J Cancer Prev. 2012;5(4):169-177.
28. Salman I, Ucan ON, Bayat O, Shaker Kh. Impact of metaheuristic iteration on artificial neural network structure in medical data. Processes. 2018; 6(57):1-17. doi.org/10.3390/pr6050057.
29. Naser A. The history of algorithmic complexity. The Mathematical Enthusiast. 2016;3(3):217-41.
30. Akram M, Iqbal M, Daniyal, M, Ullah-Khan A. Awareness and current knowledge of breast cancer. Biol Res. 2017;50:33. doi: 10.1186/s40659-017-0140-9.
31. Li JB, Peng Y, Liu D. Quasiconformal kernel common locality discriminant analysis with application to breast cancer diagnosis. Information Sciences. 2013;223:256-69. doi: 10.1016/j.ins.2012.10.016.
32. Pashaei E, Ozen M, Aydin N. Improving medical diagnosis reliability using Boosted C5.0 decision tree empowered by Particle Swarm Optimization. Conf Proc IEEE Eng Med Biol Soc. 2015;2015:7230-3. doi:10.1109/EMBC.2015.7320060.
33. Zhang J, Chen L, Abid F. Prediction of breast cancer from imbalance respect using cluster-based under sampling method. J Healthc Eng. 2019;2019:7294582. doi:10.1155/2019/7294582
34. Shen L, Chen H, Yu Z. Evolving support vector machines using fruit fly optimization for medical data classification. Knowledge-Based Systems. 2016;96:61-75. doi: 10.1016/j.knosys.2016.01.002.
35. Ahmad F, Ashidi Mat Isa N, Hussain Z, Osman MK. A GA-based feature selection and parameter optimization of an ANN in diagnosing breast cancer. Pattern Anal Applic. 2015;18:861-70. doi: 10.1007/s10044-014-0375-9.
36. Paul S, Das S. Simultaneous feature selection and weighting-An evolutionary multi-objective optimization approach. Pattern Recognition Letters. 2015;65:51-9. doi:10.1016/j.patrec.2015.07.007.
Middle East J Cancer 2021; 12(1): 48-6868