Embed Size (px)
Citation preview
Breaking Down New York’s Value Based Payment (VBP) Incentives
Jason Ganns, Director, Public Sector Advisory, KPMG
September 2016
2
Introduction to Value Based Payment Reform
September 2016
3
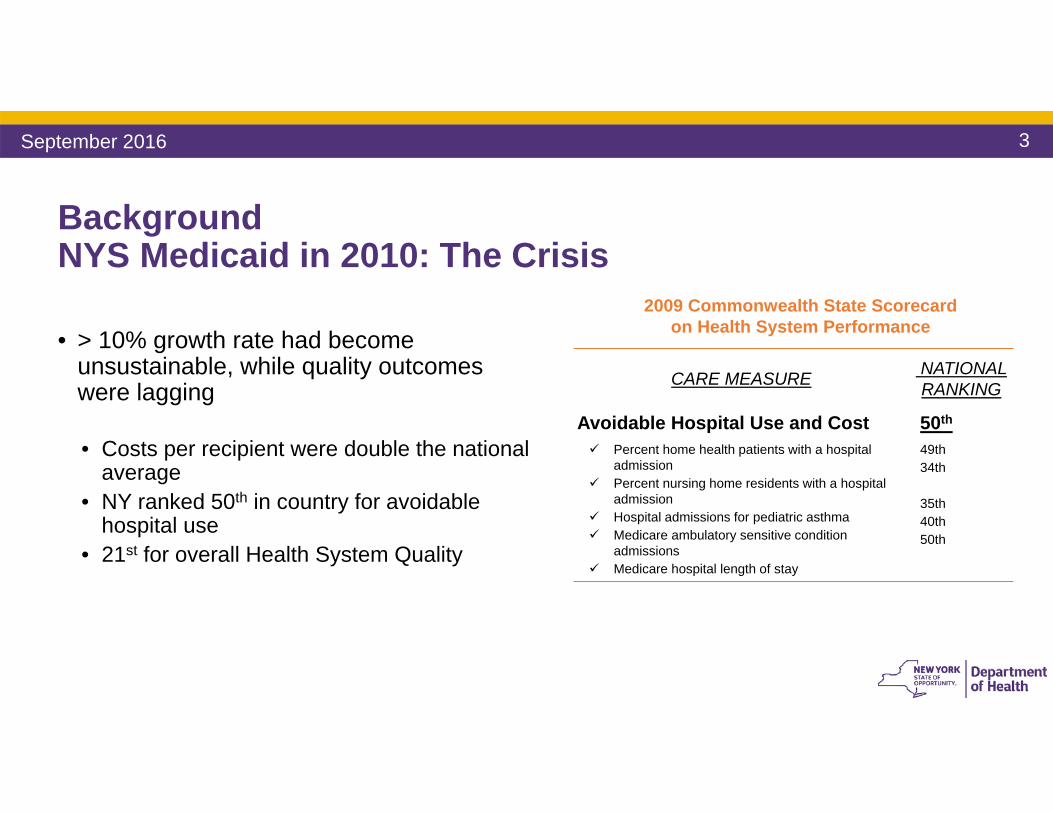
Background NYS Medicaid in 2010: The Crisis
• > 10% growth rate had become unsustainable, while quality outcomes were lagging
• Costs per recipient were double the national average
• NY ranked 50th in country for avoidable hospital use
• 21st for overall Health System Quality
CARE MEASURE NATIONAL RANKING
Avoidable Hospital Use and Cost Percent home health patients with a hospital
admission Percent nursing home residents with a hospital
admission Hospital admissions for pediatric asthma Medicare ambulatory sensitive condition
admissions Medicare hospital length of stay
50th
49th34th
35th40th50th
2009 Commonwealth State Scorecard on Health System Performance
September 2016
4
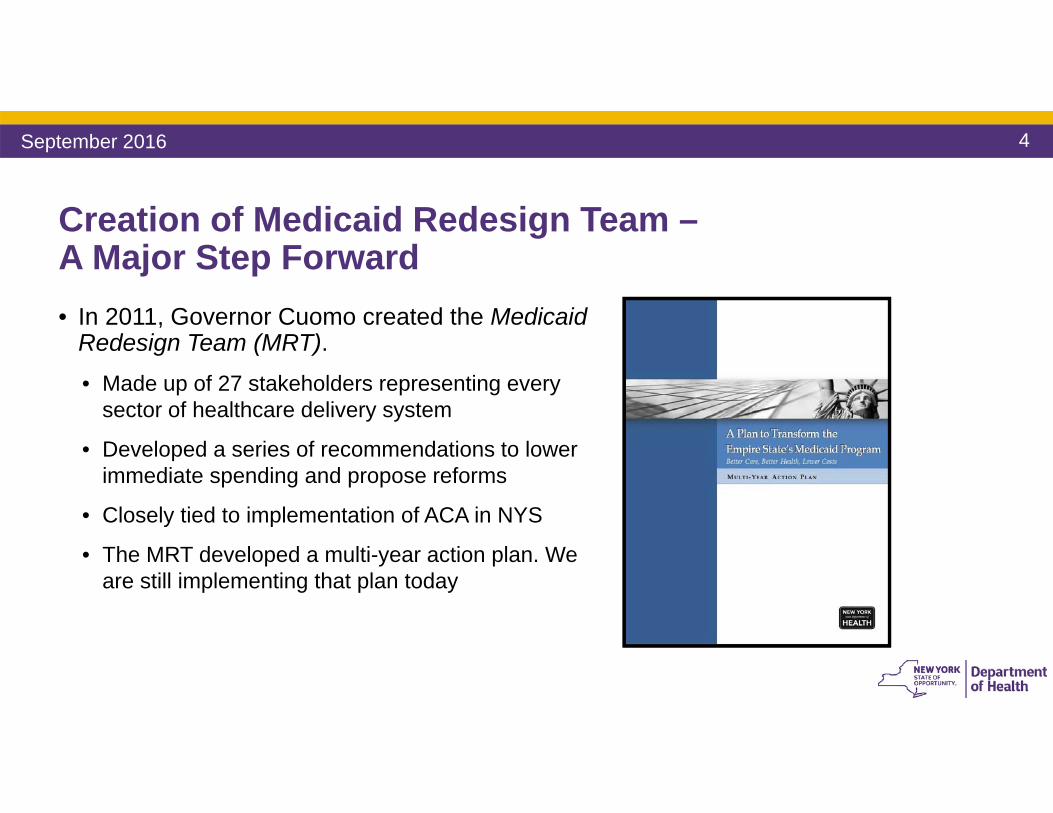
Creation of Medicaid Redesign Team –A Major Step Forward• In 2011, Governor Cuomo created the Medicaid
Redesign Team (MRT).• Made up of 27 stakeholders representing every
sector of healthcare delivery system
• Developed a series of recommendations to lower immediate spending and propose reforms
• Closely tied to implementation of ACA in NYS
• The MRT developed a multi-year action plan. We are still implementing that plan today
September 2016
5
• Part of the MRT plan was to obtain a 1115 Waiver which would reinvest MRT generated federal savings back into New York’s health care delivery system
• In April 2014, New York State and CMS finalized the Waiver Amendment• Allows the State to reinvest $8 billion of $17.1 billion in Federal savings generated by MRT
reforms• $7.3 billion is designated for Delivery System Reform Incentive Payment Program (DSRIP)
• The waiver will:• Transform the State’s health care system • Bend the Medicaid cost curve• Assure access to quality care for all Medicaid members• Create a financial sustainable safety net infrastructure
The 2014 MRT Waiver Amendment furthers New York State’s Reform Goals
September 2016
6
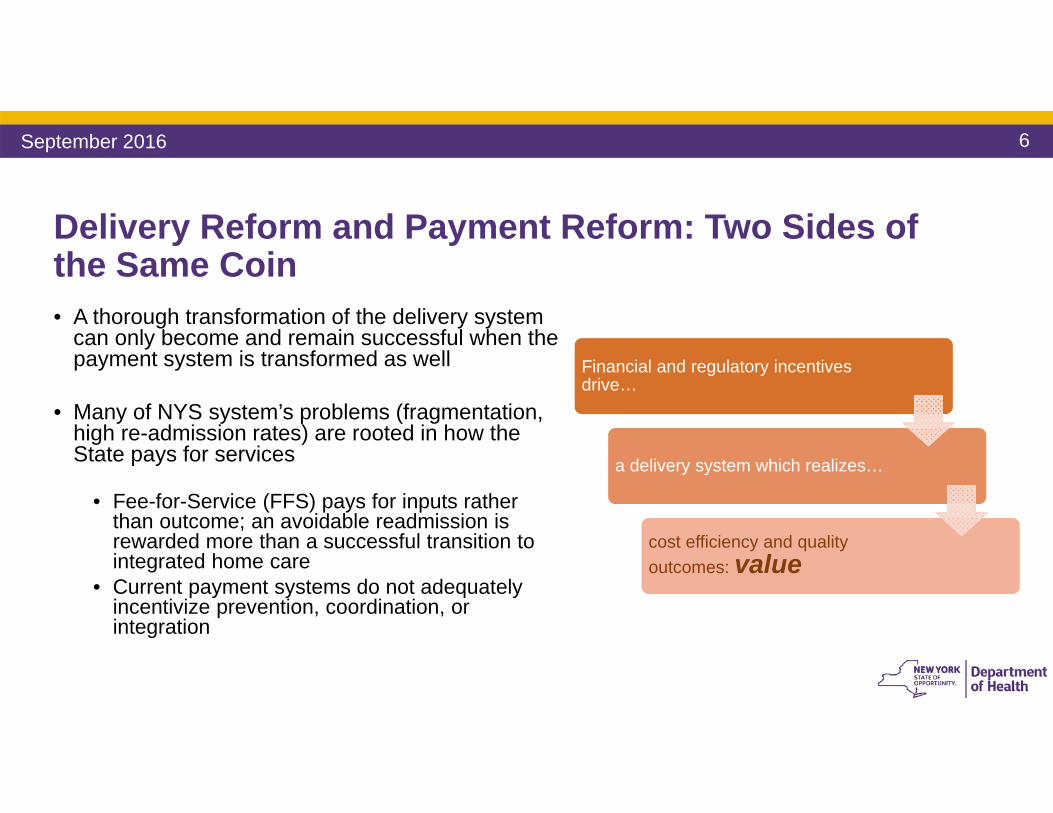
Delivery Reform and Payment Reform: Two Sides of the Same Coin• A thorough transformation of the delivery system
can only become and remain successful when the payment system is transformed as well
• Many of NYS system’s problems (fragmentation, high re-admission rates) are rooted in how the State pays for services
• Fee-for-Service (FFS) pays for inputs rather than outcome; an avoidable readmission is rewarded more than a successful transition to integrated home care
• Current payment systems do not adequately incentivize prevention, coordination, or integration
Financial and regulatory incentives drive…
a delivery system which realizes…
cost efficiency and quality outcomes: value
September 2016
7
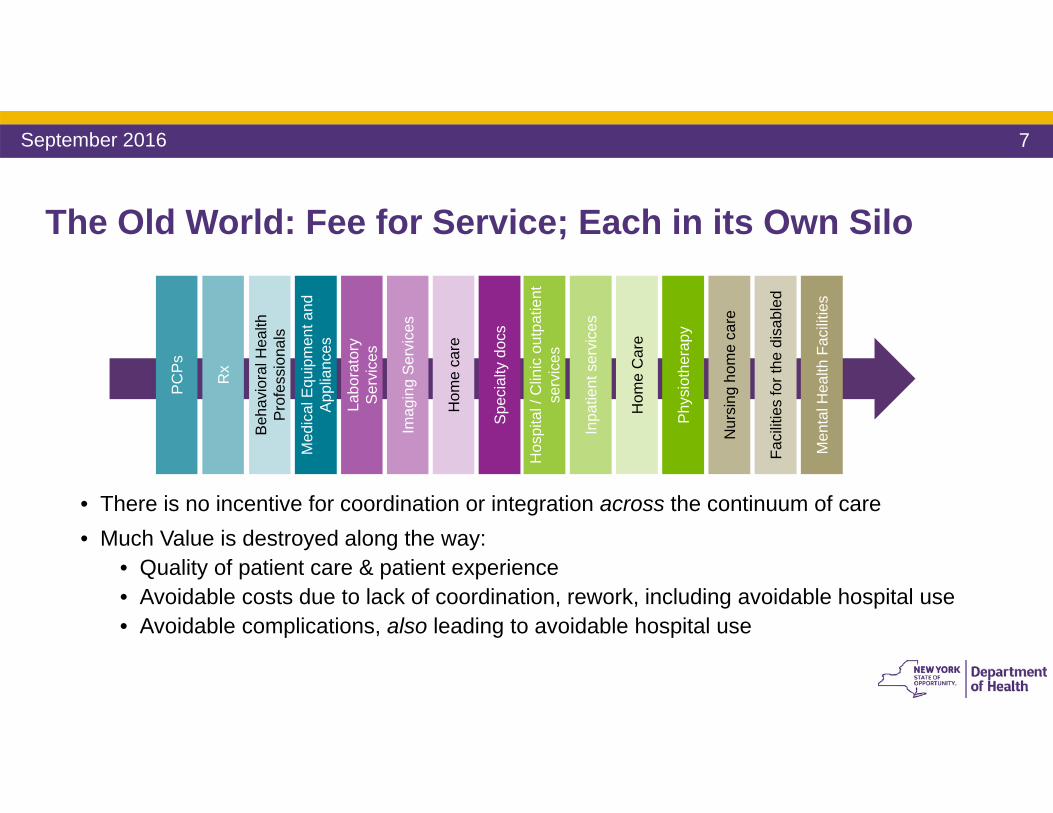
The Old World: Fee for Service; Each in its Own Silo
• There is no incentive for coordination or integration across the continuum of care• Much Value is destroyed along the way:
• Quality of patient care & patient experience• Avoidable costs due to lack of coordination, rework, including avoidable hospital use• Avoidable complications, also leading to avoidable hospital use
Labo
rato
ry
Ser
vice
s
Imag
ing
Ser
vice
s
Hom
e ca
re
Spe
cial
tydo
cs
Faci
litie
s fo
r the
dis
able
d
Nur
sing
hom
e ca
re
Phy
siot
hera
py
Hos
pita
l / C
linic
out
patie
nt
serv
ices
Men
tal H
ealth
Fac
ilitie
s
Inpa
tient
ser
vice
s
Hom
e C
are
Med
ical
Equ
ipm
ent a
nd
App
lianc
es
PC
Ps
Rx
Beh
avio
ral H
ealth
P
rofe
ssio
nals
September 2016
8
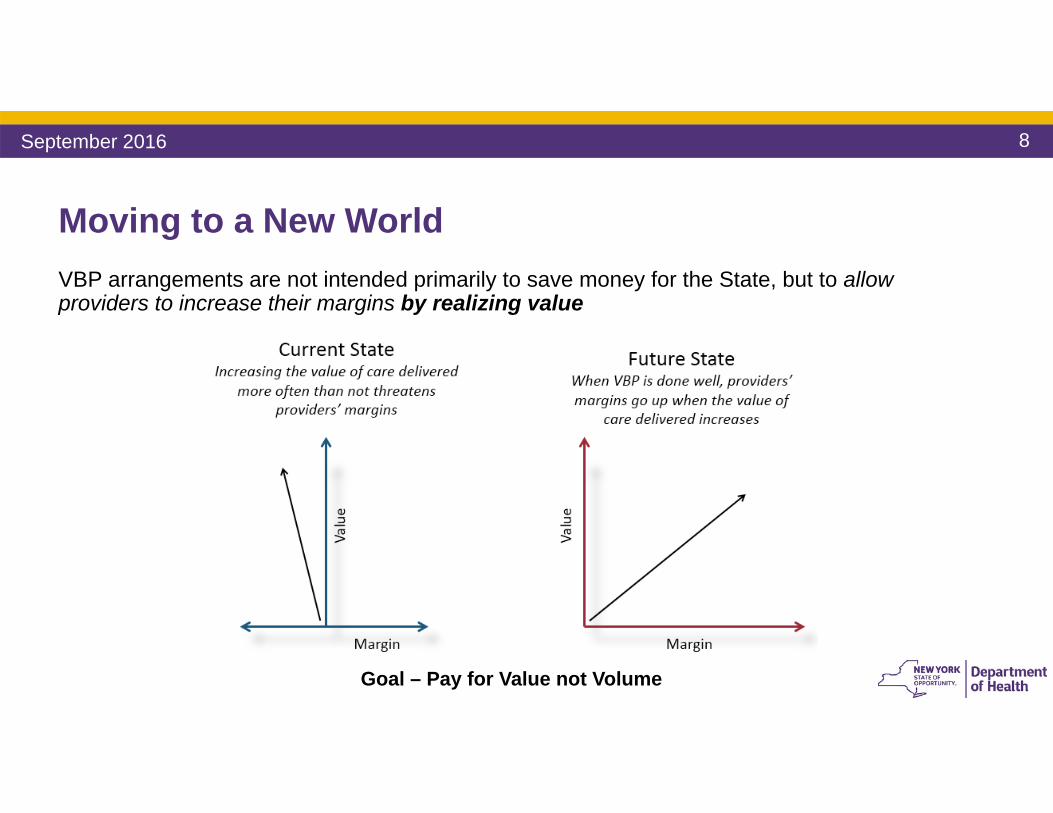
Moving to a New WorldVBP arrangements are not intended primarily to save money for the State, but to allow providers to increase their margins by realizing value
Goal – Pay for Value not Volume
September 2016
9
Payment Reform: Moving Toward VBP
• A Five-Year Roadmap outlining NYS’ plan for Medicaid Payment Reform was required by the MRT Waiver
• By DSRIP Year 5 (2019), all Managed Care Organizations must employ non fee-for-service payment systems that reward value over volume for at least 80-90% of their provider payments (outlined in the Special Terms and Conditions of the waiver)
• The State and CMS are committed to the Roadmap• Core stakeholders (providers, MCOs, unions, patient organizations) have actively
collaborated in the creation of the Roadmap• If Roadmap goals are not met, overall DSRIP dollars from CMS to NYS will be
significantly reduced
September 2016
10
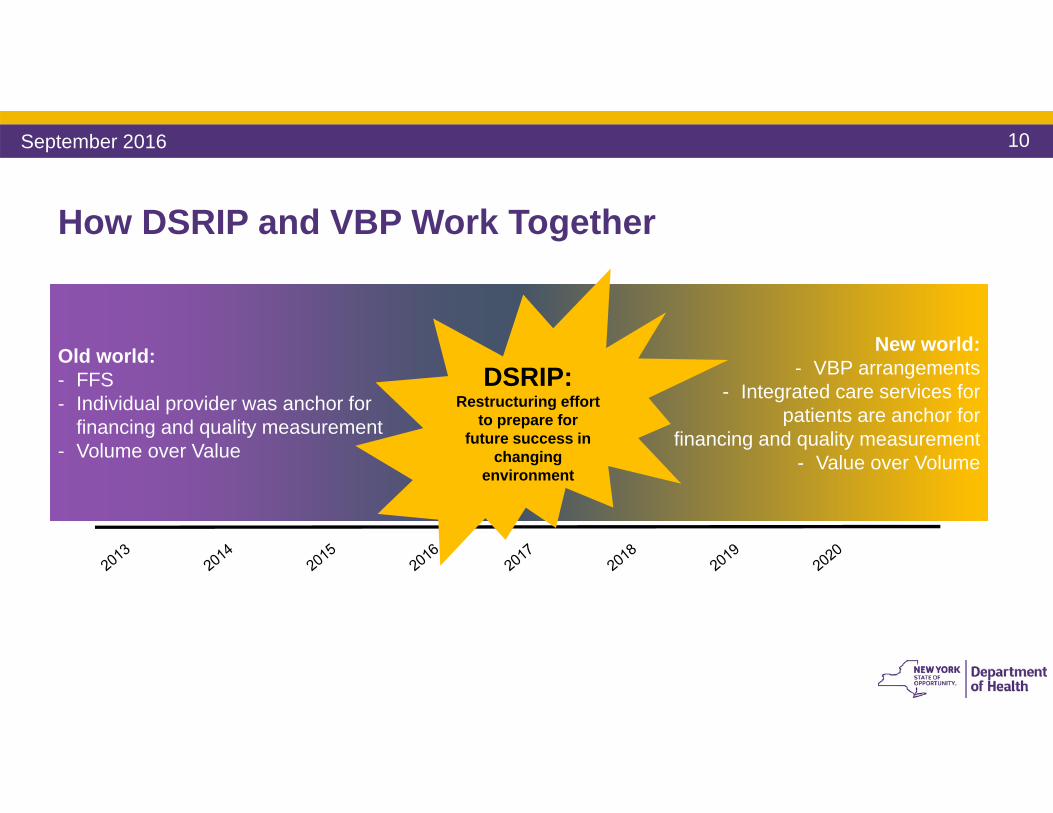
How DSRIP and VBP Work Together
Old world:- FFS- Individual provider was anchor for
financing and quality measurement- Volume over Value
New world:- VBP arrangements
- Integrated care services for patients are anchor for
financing and quality measurement- Value over Volume
DSRIP: Restructuring effort
to prepare for future success in
changing environment
September 2016
11
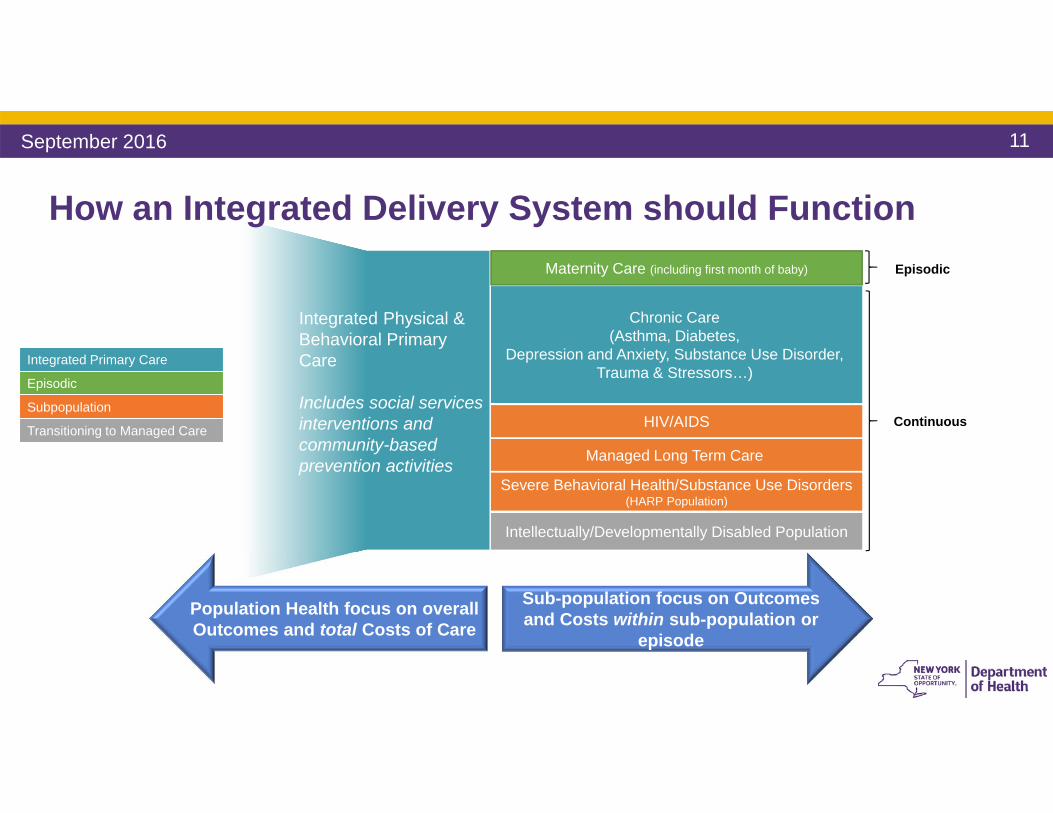
Integrated Physical & Behavioral Primary Care
Includes social services interventions and community-based prevention activities
Chronic Care (Asthma, Diabetes,
Depression and Anxiety, Substance Use Disorder, Trauma & Stressors…)
Managed Long Term Care
Severe Behavioral Health/Substance Use Disorders(HARP Population)
Intellectually/Developmentally Disabled Population
Maternity Care (including first month of baby)
HIV/AIDS
How an Integrated Delivery System should Function
Sub-population focus on Outcomes and Costs within sub-population or
episode
Population Health focus on overall Outcomes and total Costs of Care
Episodic
Continuous
September 2016
Integrated Primary Care
Episodic
Subpopulation
Transitioning to Managed Care
12
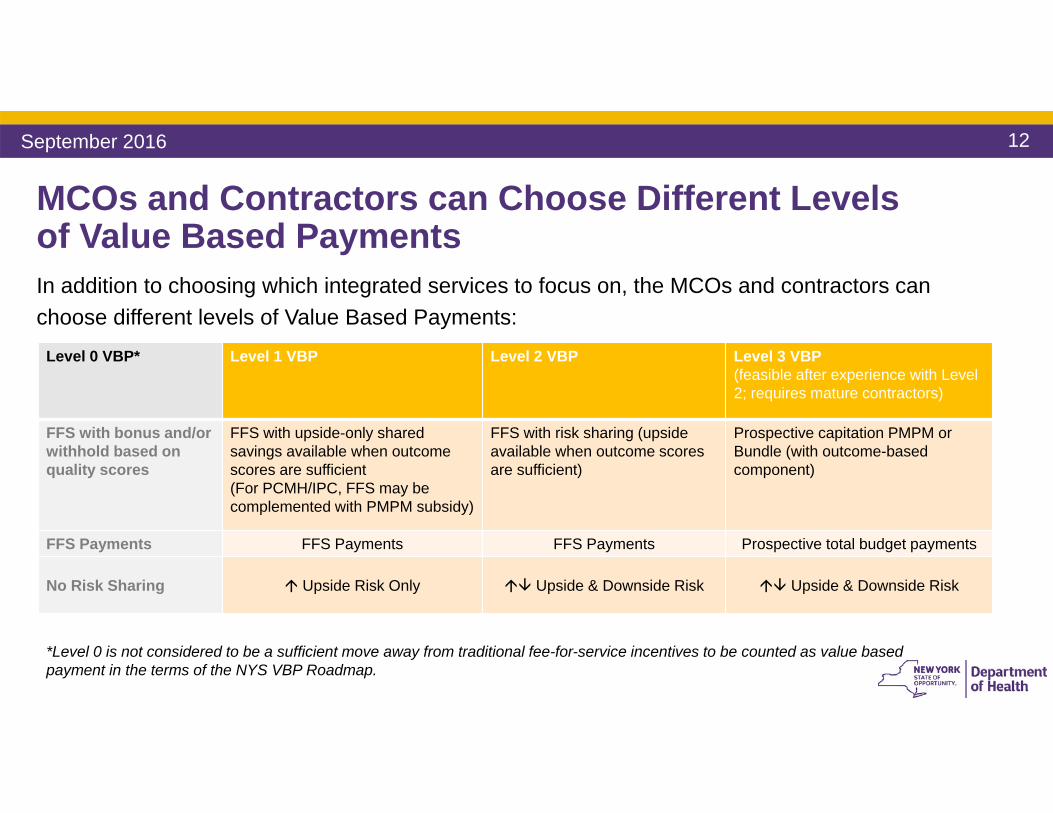
MCOs and Contractors can Choose Different Levels of Value Based PaymentsIn addition to choosing which integrated services to focus on, the MCOs and contractors can choose different levels of Value Based Payments:
Level 0 VBP* Level 1 VBP Level 2 VBP Level 3 VBP (feasible after experience with Level 2; requires mature contractors)
FFS with bonus and/or withhold based on quality scores
FFS with upside-only shared savings available when outcome scores are sufficient(For PCMH/IPC, FFS may be complemented with PMPM subsidy)
FFS with risk sharing (upside available when outcome scores are sufficient)
Prospective capitation PMPM or Bundle (with outcome-based component)
FFS Payments FFS Payments FFS Payments Prospective total budget payments
No Risk Sharing Upside Risk Only Upside & Downside Risk Upside & Downside Risk
*Level 0 is not considered to be a sufficient move away from traditional fee-for-service incentives to be counted as value based payment in the terms of the NYS VBP Roadmap.
September 2016
13
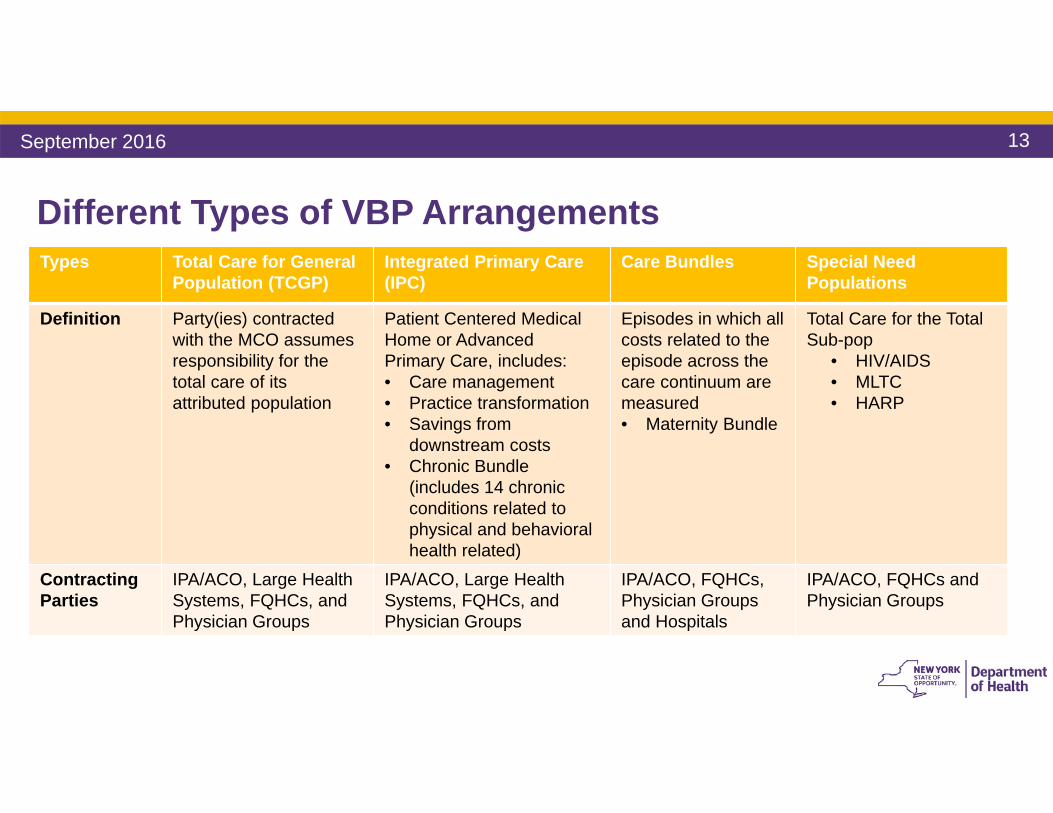
Different Types of VBP Arrangements Types Total Care for General
Population (TCGP)Integrated Primary Care (IPC)
Care Bundles Special Need Populations
Definition Party(ies) contracted with the MCO assumes responsibility for the total care of its attributed population
Patient Centered Medical Home or Advanced Primary Care, includes:• Care management• Practice transformation • Savings from
downstream costs • Chronic Bundle
(includes 14 chronic conditions related to physical and behavioral health related)
Episodes in which all costs related to the episode across the care continuum are measured • Maternity Bundle
Total Care for the Total Sub-pop
• HIV/AIDS• MLTC• HARP
Contracting Parties
IPA/ACO, Large HealthSystems, FQHCs, and Physician Groups
IPA/ACO, Large HealthSystems, FQHCs, and Physician Groups
IPA/ACO, FQHCs, Physician Groups and Hospitals
IPA/ACO, FQHCs and Physician Groups
September 2016
14
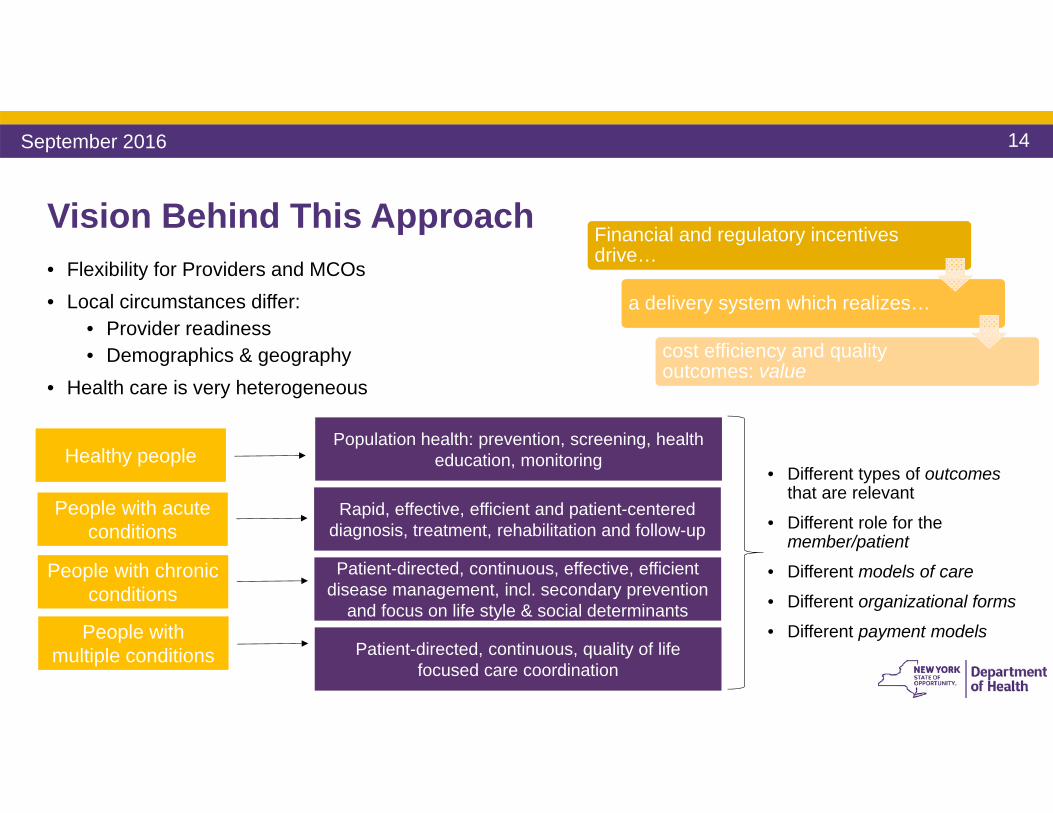
Vision Behind This Approach• Flexibility for Providers and MCOs• Local circumstances differ:
• Provider readiness• Demographics & geography
• Health care is very heterogeneous
Financial and regulatory incentives drive…
a delivery system which realizes…
cost efficiency and quality outcomes: value
Healthy peoplePopulation health: prevention, screening, health
education, monitoring
People with acute conditions
Rapid, effective, efficient and patient-centered diagnosis, treatment, rehabilitation and follow-up
People with chronic conditions
Patient-directed, continuous, effective, efficient disease management, incl. secondary prevention
and focus on life style & social determinantsPeople with
multiple conditions Patient-directed, continuous, quality of life focused care coordination
• Different types of outcomes that are relevant
• Different role for the member/patient
• Different models of care
• Different organizational forms
• Different payment models
September 2016
15
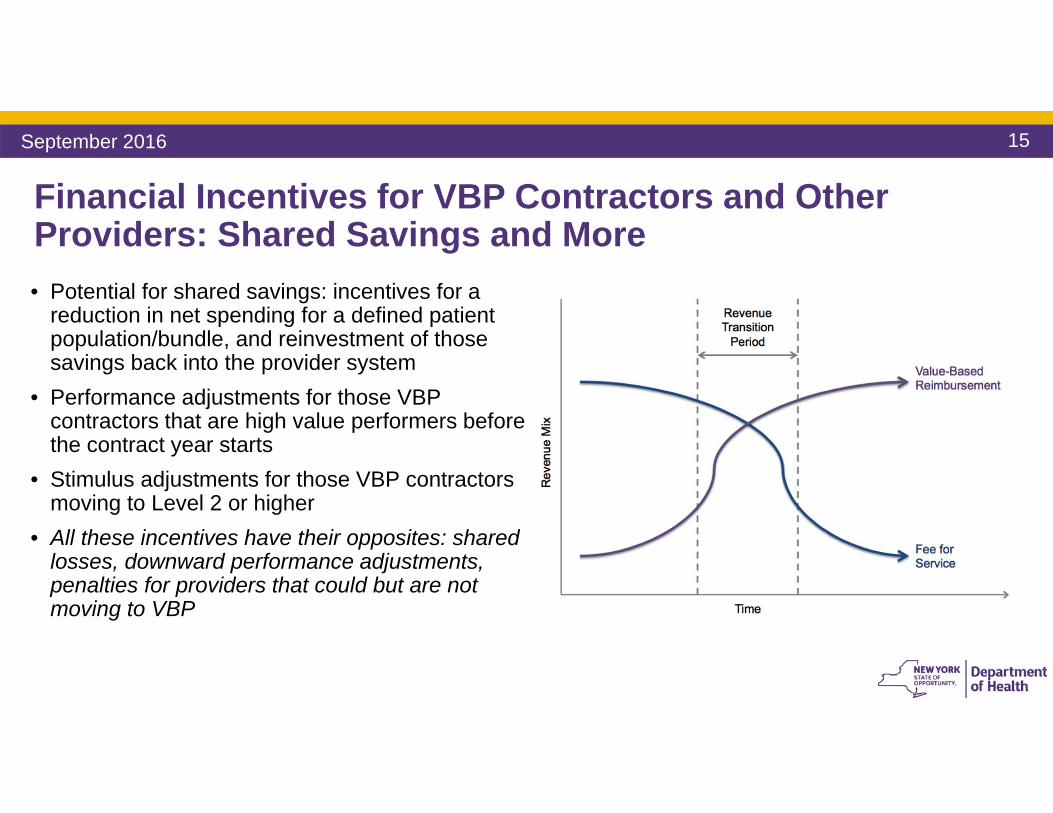
Financial Incentives for VBP Contractors and Other Providers: Shared Savings and More• Potential for shared savings: incentives for a
reduction in net spending for a defined patient population/bundle, and reinvestment of those savings back into the provider system
• Performance adjustments for those VBP contractors that are high value performers before the contract year starts
• Stimulus adjustments for those VBP contractors moving to Level 2 or higher
• All these incentives have their opposites: shared losses, downward performance adjustments, penalties for providers that could but are not moving to VBP
September 2016
16September 2016
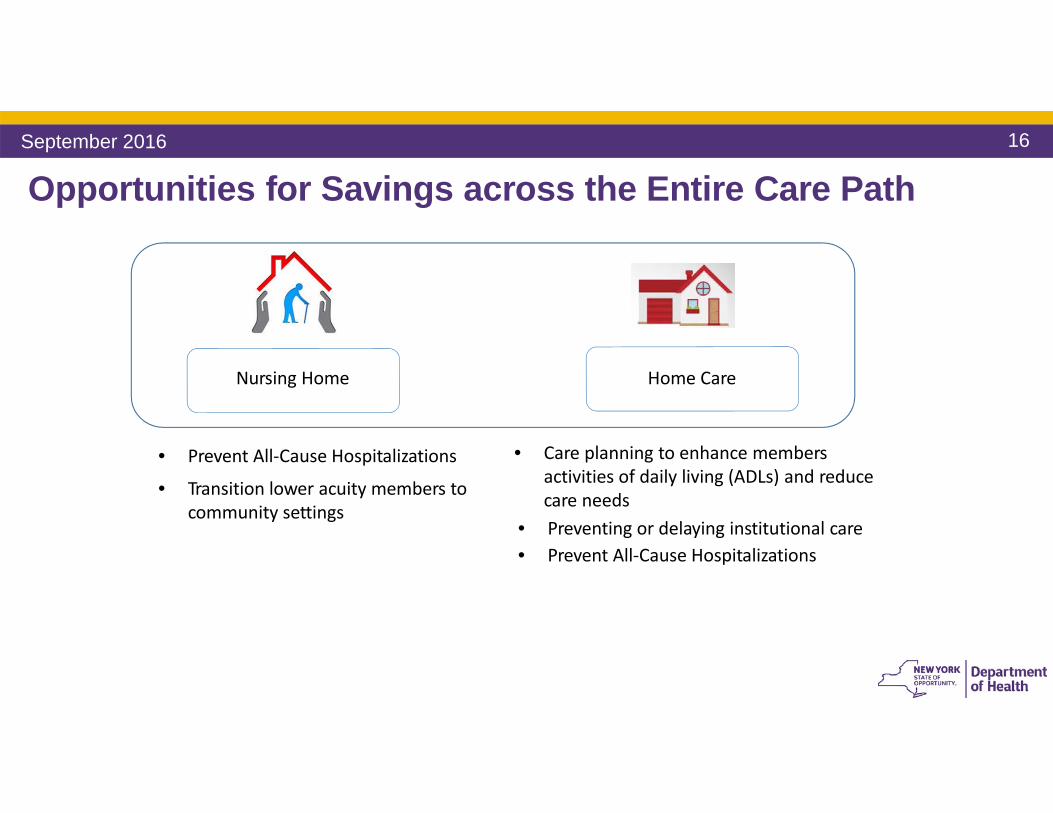
Opportunities for Savings across the Entire Care Path
Nursing Home Home Care
• Prevent All‐Cause Hospitalizations
• Transition lower acuity members to community settings
• Care planning to enhance members activities of daily living (ADLs) and reducecare needs
• Preventing or delaying institutional care• Prevent All‐Cause Hospitalizations
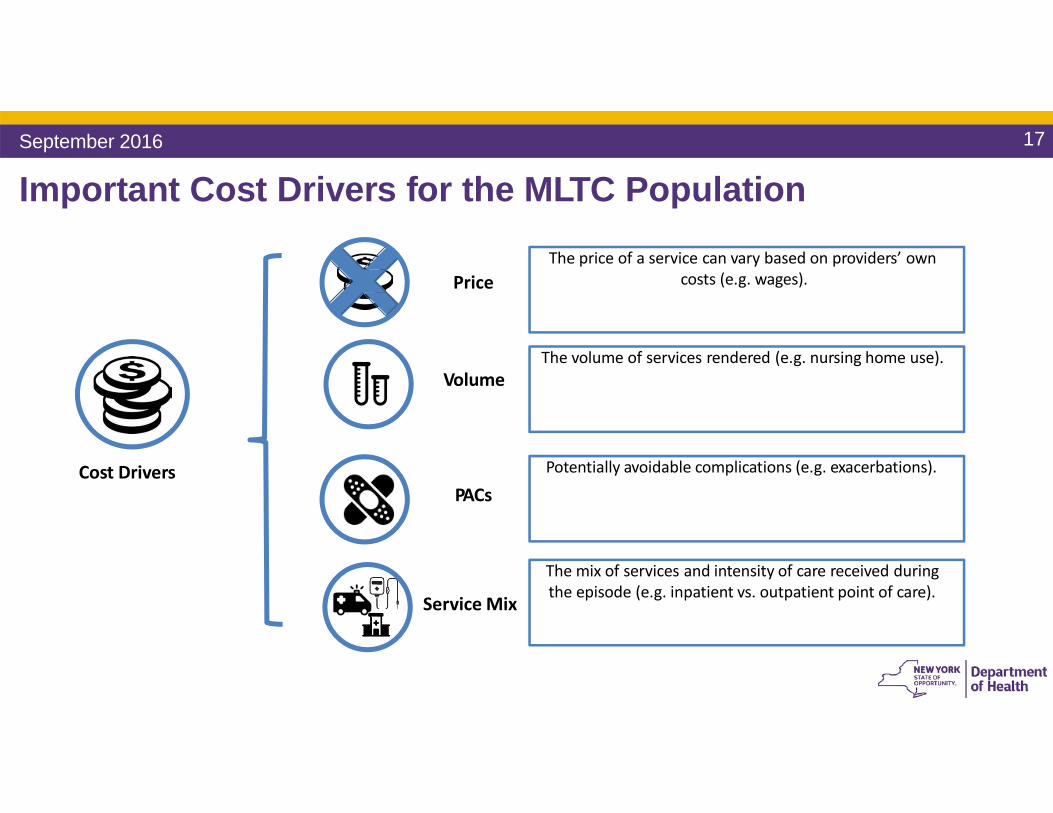
Important Cost Drivers for the MLTC Population
Volume
PACs
Service Mix
Cost Drivers
PriceThe price of a service can vary based on providers’ own
costs (e.g. wages).
The volume of services rendered (e.g. nursing home use).
Potentially avoidable complications (e.g. exacerbations).
The mix of services and intensity of care received duringthe episode (e.g. inpatient vs. outpatient point of care).
September 2016 17
18
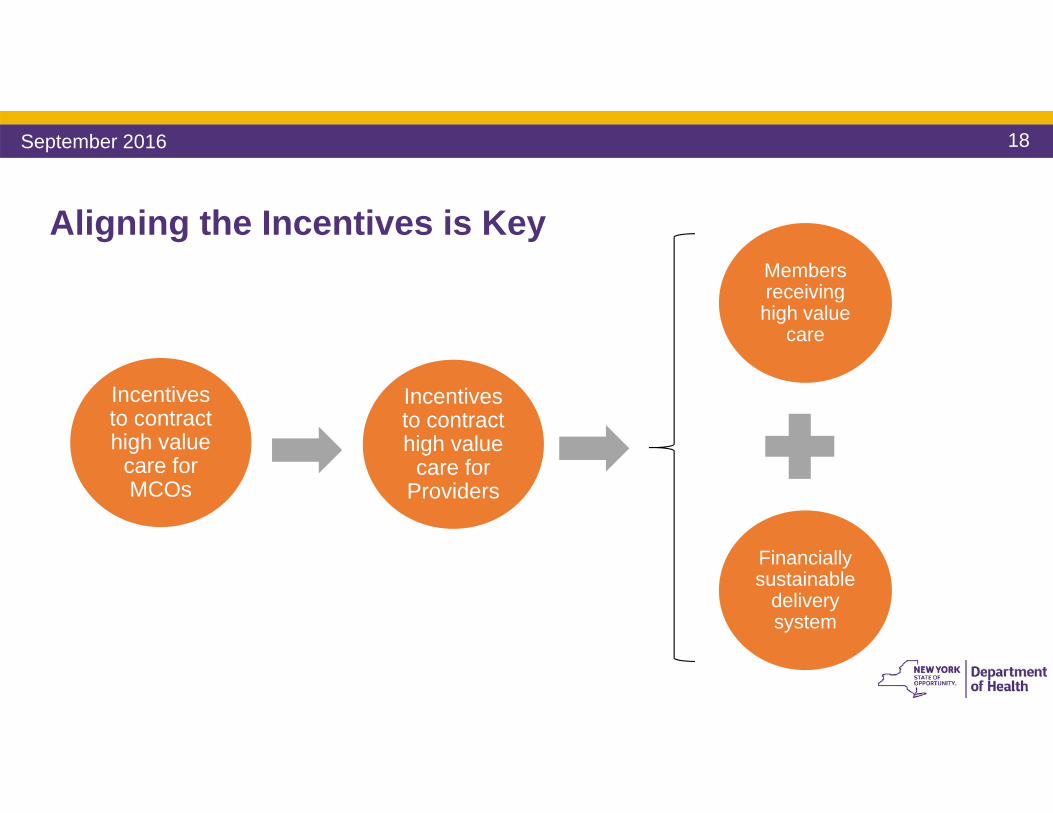
Aligning the Incentives is Key
September 2016
Incentives to contract high value
care for MCOs
Incentives to contract high value
care for Providers
Financially sustainable
delivery system
Members receiving high value
care
19
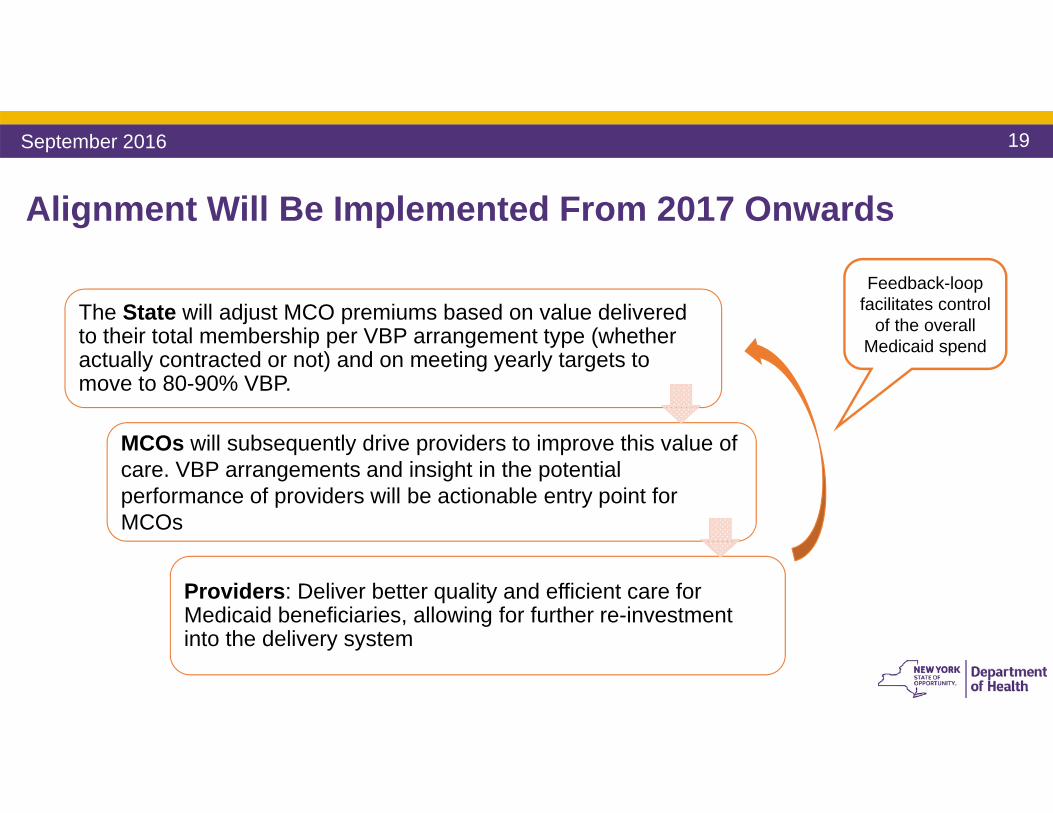
MCOs will subsequently drive providers to improve this value of care. VBP arrangements and insight in the potential performance of providers will be actionable entry point for MCOs
Providers: Deliver better quality and efficient care for Medicaid beneficiaries, allowing for further re-investment into the delivery system
Alignment Will Be Implemented From 2017 Onwards
Feedback-loop facilitates control
of the overall Medicaid spend
The State will adjust MCO premiums based on value delivered to their total membership per VBP arrangement type (whether actually contracted or not) and on meeting yearly targets to move to 80-90% VBP.
September 2016

20
Contracting Entities/VBP Contractors
September 2016
21
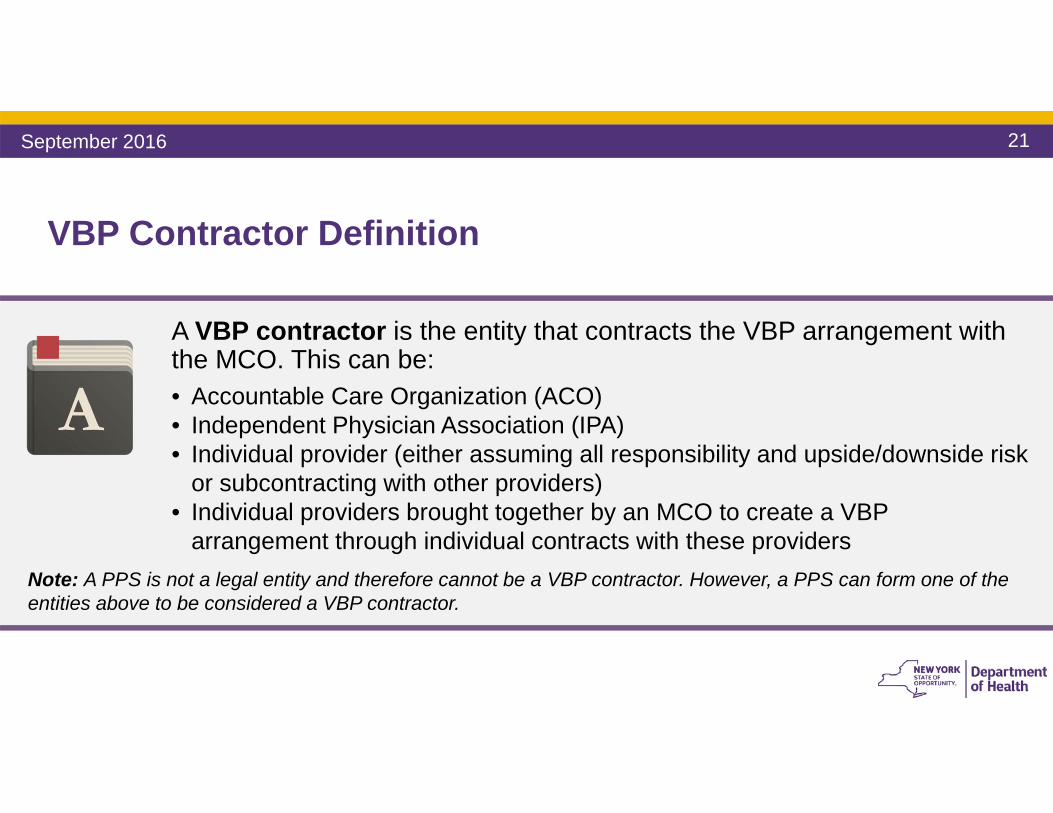
VBP Contractor Definition
A VBP contractor is the entity that contracts the VBP arrangement with the MCO. This can be:• Accountable Care Organization (ACO) • Independent Physician Association (IPA)• Individual provider (either assuming all responsibility and upside/downside risk
or subcontracting with other providers)• Individual providers brought together by an MCO to create a VBP
arrangement through individual contracts with these providersNote: A PPS is not a legal entity and therefore cannot be a VBP contractor. However, a PPS can form one of the entities above to be considered a VBP contractor.
September 2016
22
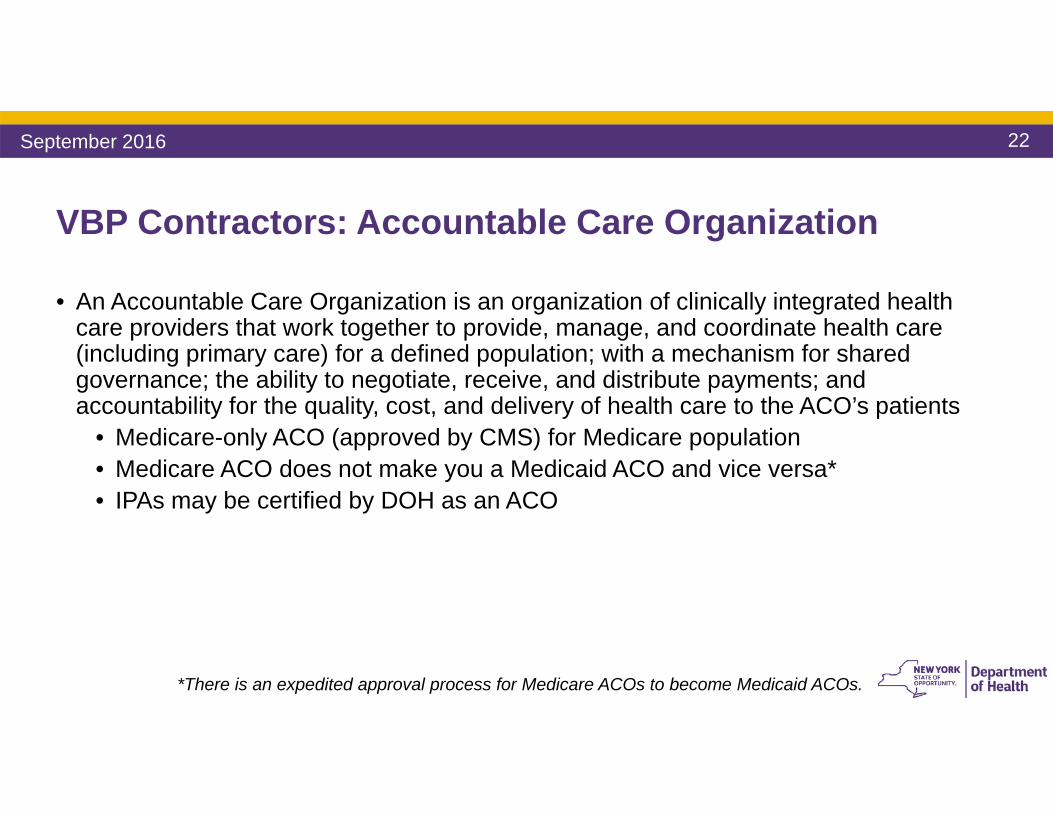
VBP Contractors: Accountable Care Organization
• An Accountable Care Organization is an organization of clinically integrated health care providers that work together to provide, manage, and coordinate health care (including primary care) for a defined population; with a mechanism for shared governance; the ability to negotiate, receive, and distribute payments; and accountability for the quality, cost, and delivery of health care to the ACO’s patients
• Medicare-only ACO (approved by CMS) for Medicare population• Medicare ACO does not make you a Medicaid ACO and vice versa*• IPAs may be certified by DOH as an ACO
*There is an expedited approval process for Medicare ACOs to become Medicaid ACOs.
September 2016
23
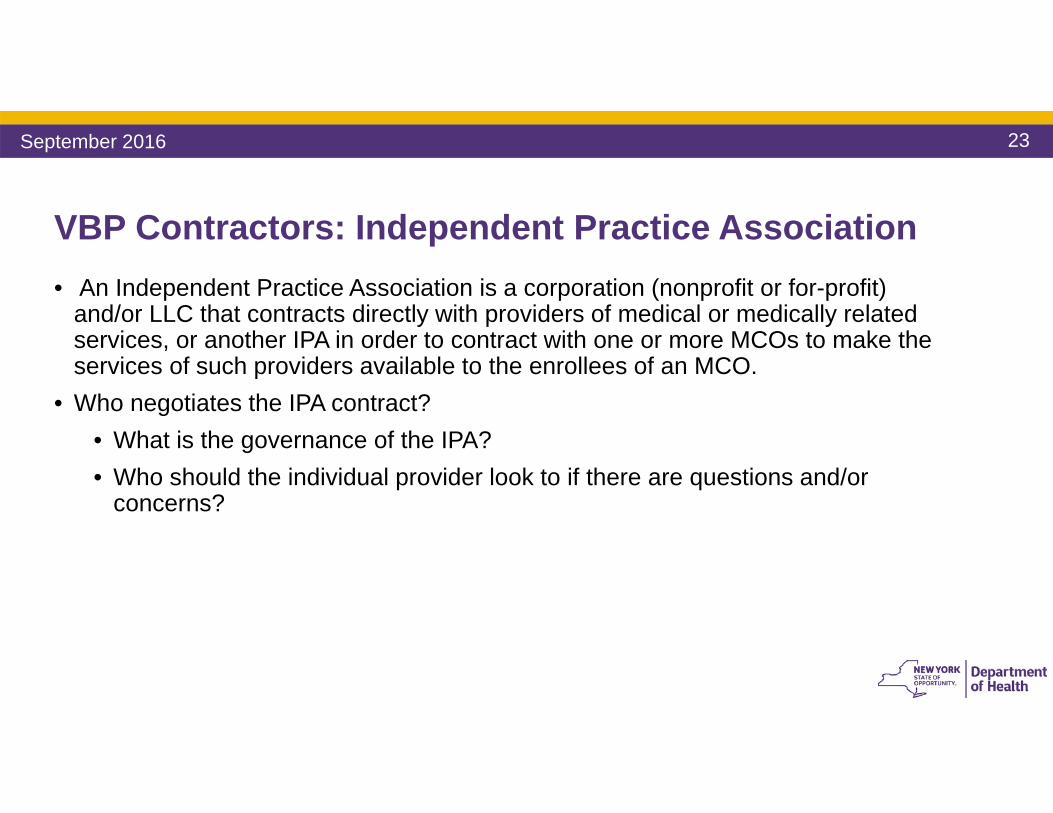
VBP Contractors: Independent Practice Association• An Independent Practice Association is a corporation (nonprofit or for-profit)
and/or LLC that contracts directly with providers of medical or medically related services, or another IPA in order to contract with one or more MCOs to make the services of such providers available to the enrollees of an MCO.
• Who negotiates the IPA contract? • What is the governance of the IPA? • Who should the individual provider look to if there are questions and/or
concerns?
September 2016
24
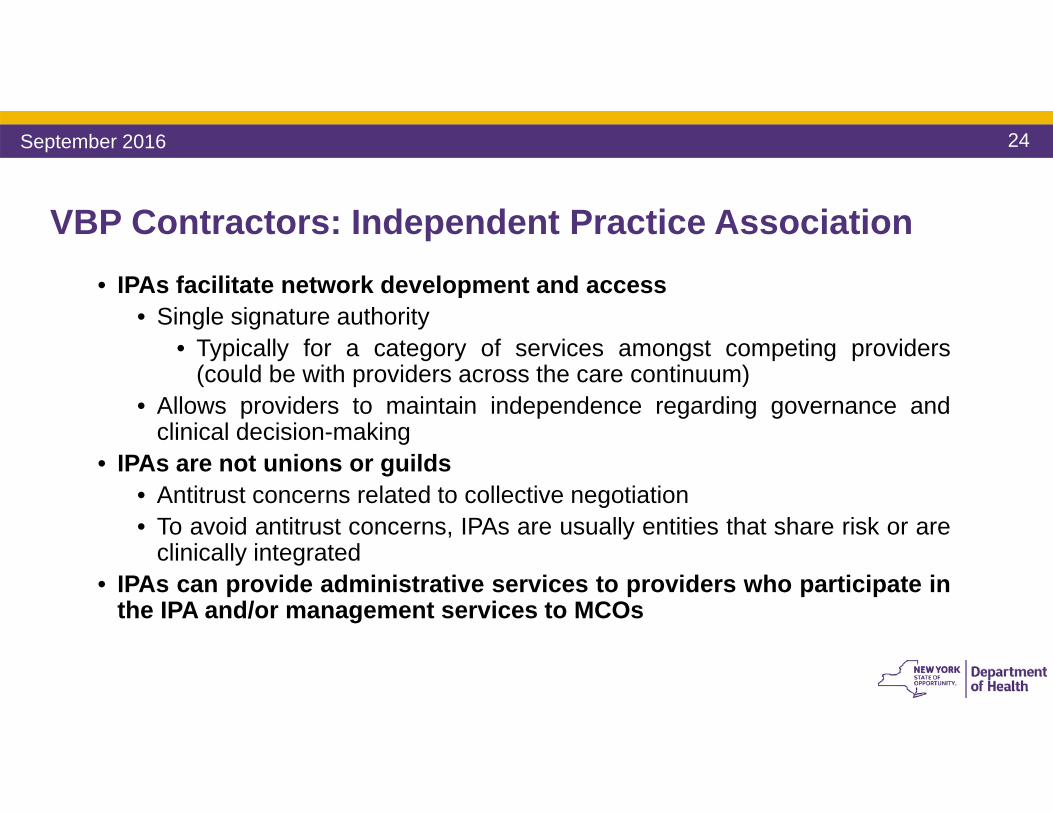
VBP Contractors: Independent Practice Association • IPAs facilitate network development and access
• Single signature authority• Typically for a category of services amongst competing providers
(could be with providers across the care continuum)• Allows providers to maintain independence regarding governance and
clinical decision-making• IPAs are not unions or guilds
• Antitrust concerns related to collective negotiation• To avoid antitrust concerns, IPAs are usually entities that share risk or are
clinically integrated• IPAs can provide administrative services to providers who participate in
the IPA and/or management services to MCOs
September 2016
25
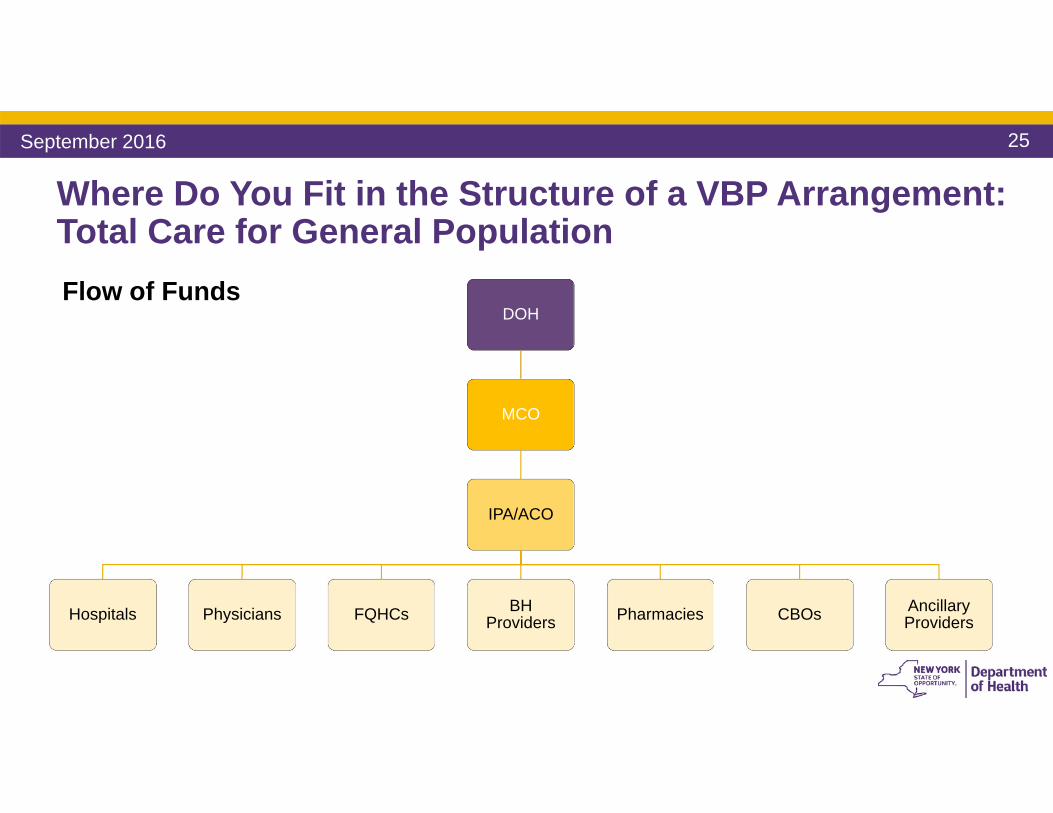
Where Do You Fit in the Structure of a VBP Arrangement:Total Care for General PopulationFlow of Funds
DOH
MCO
IPA/ACO
Hospitals Physicians FQHCs BH Providers Pharmacies CBOs Ancillary
Providers
September 2016
26
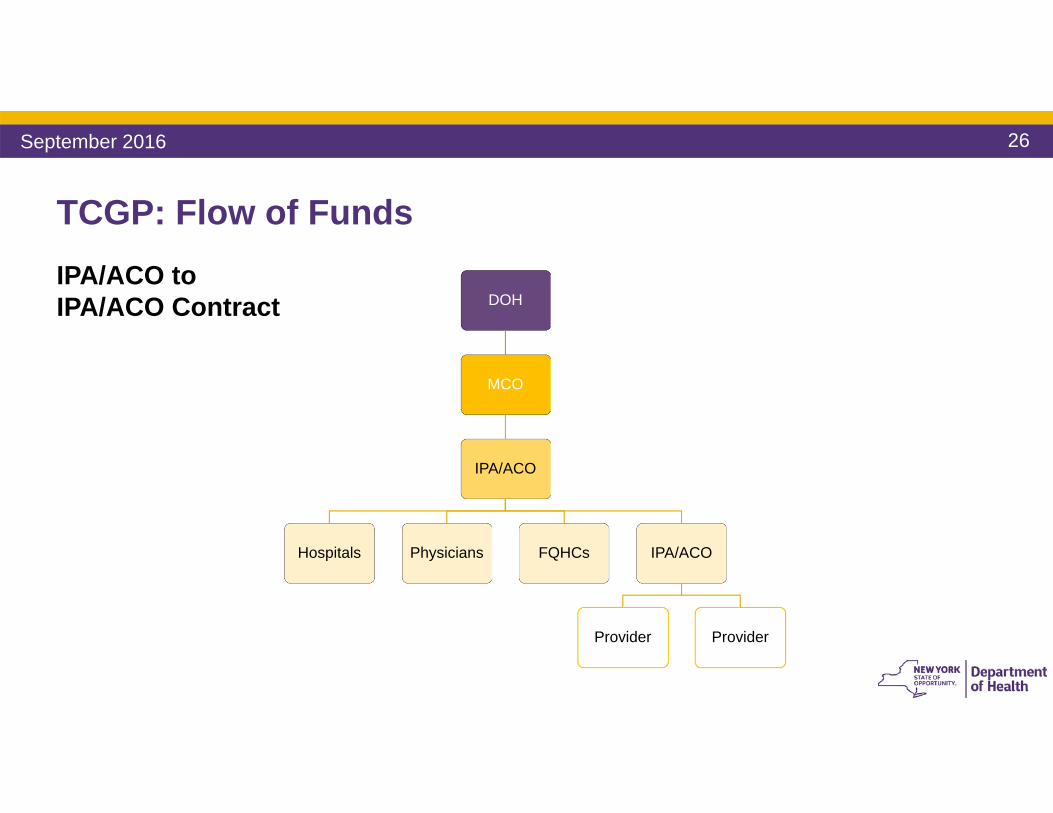
TCGP: Flow of FundsIPA/ACO to IPA/ACO Contract DOH
MCO
IPA/ACO
Hospitals Physicians FQHCs IPA/ACO
Provider Provider
September 2016
27
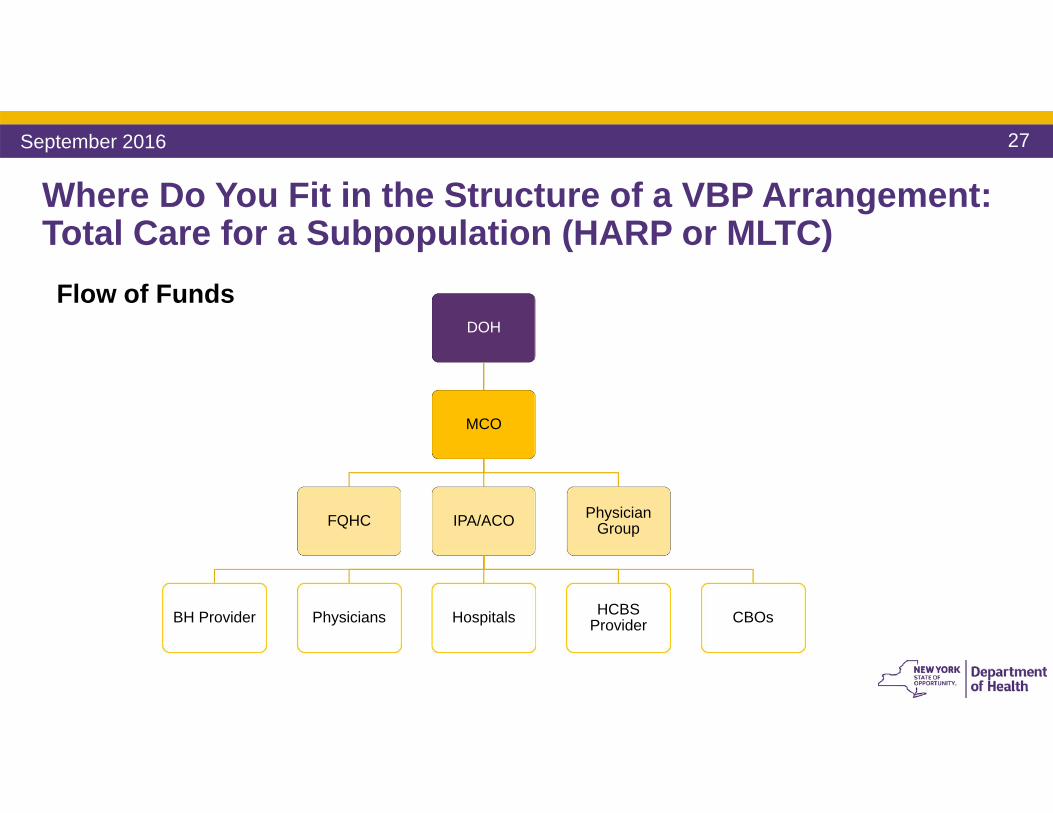
Where Do You Fit in the Structure of a VBP Arrangement:Total Care for a Subpopulation (HARP or MLTC)Flow of Funds
DOH
MCO
FQHC IPA/ACO
BH Provider Physicians Hospitals HCBS Provider CBOs
Physician Group
September 2016
28
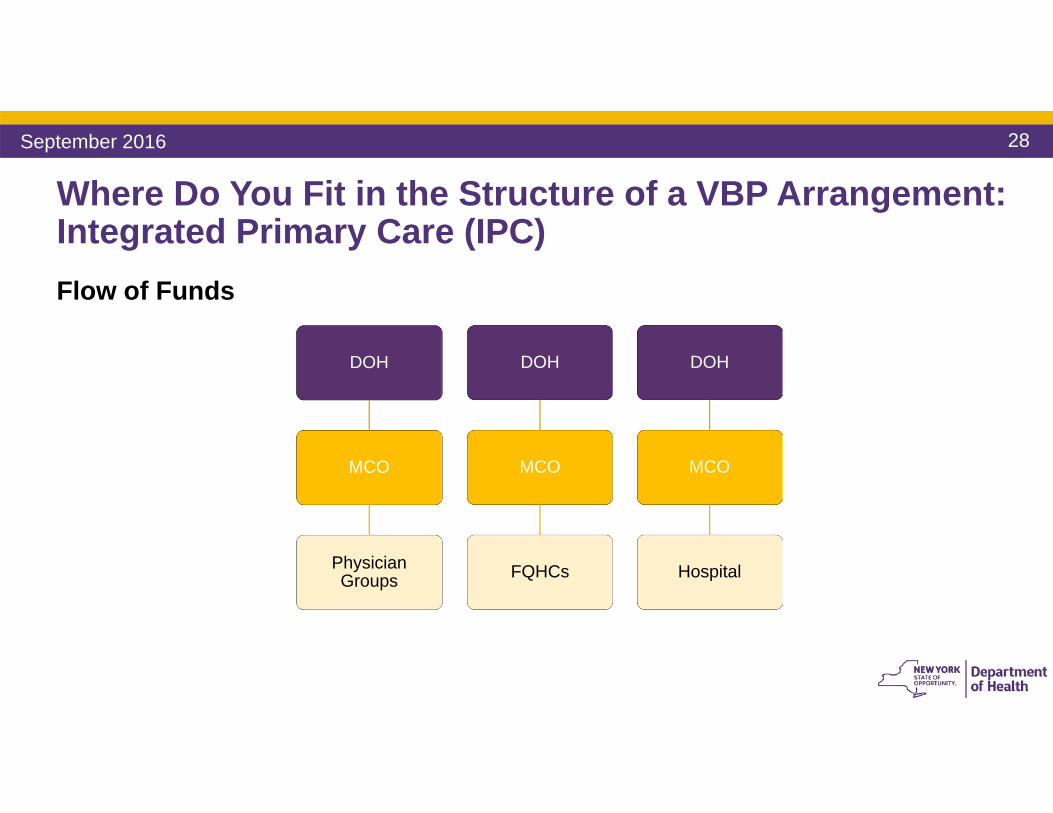
Where Do You Fit in the Structure of a VBP Arrangement:Integrated Primary Care (IPC)Flow of Funds
DOH
MCO
FQHCs
DOH
MCO
Physician Groups
DOH
MCO
Hospital
September 2016

29
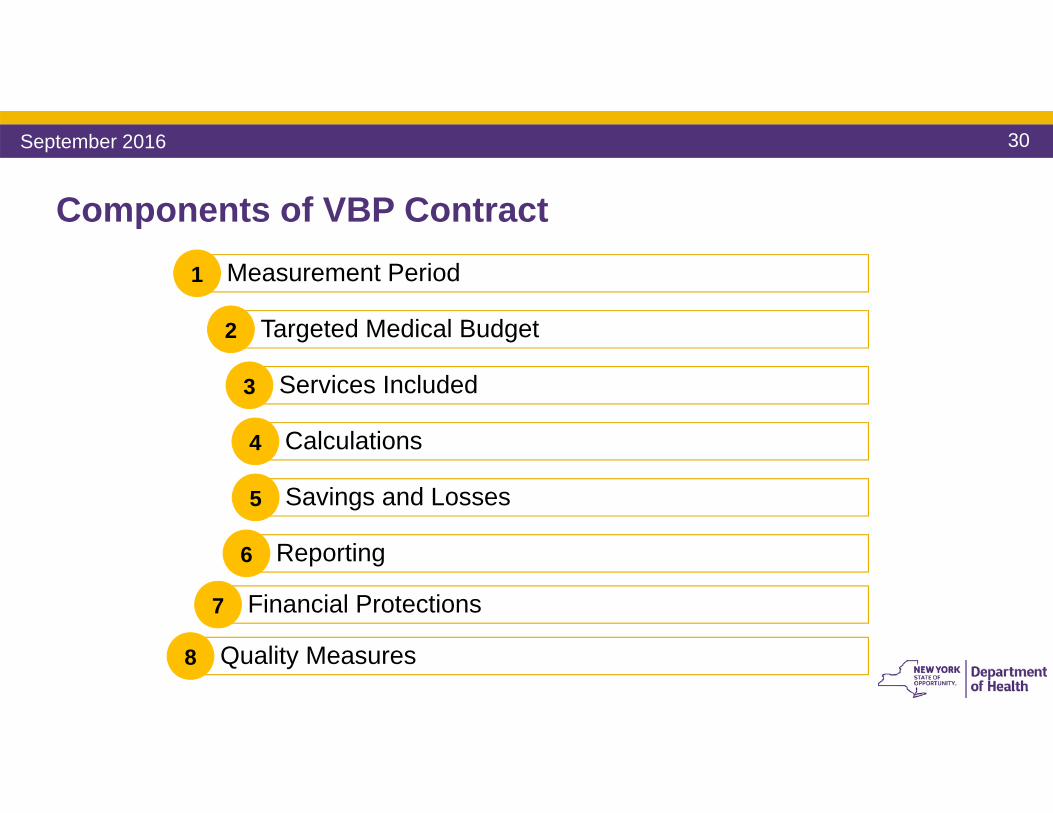
Components of a VBP Contract
September 2016
30
Components of VBP Contract Measurement Period1
Targeted Medical Budget2
Services Included 3
Calculations4
Savings and Losses5
Reporting 6
Financial Protections7
Quality Measures 8
September 2016
31
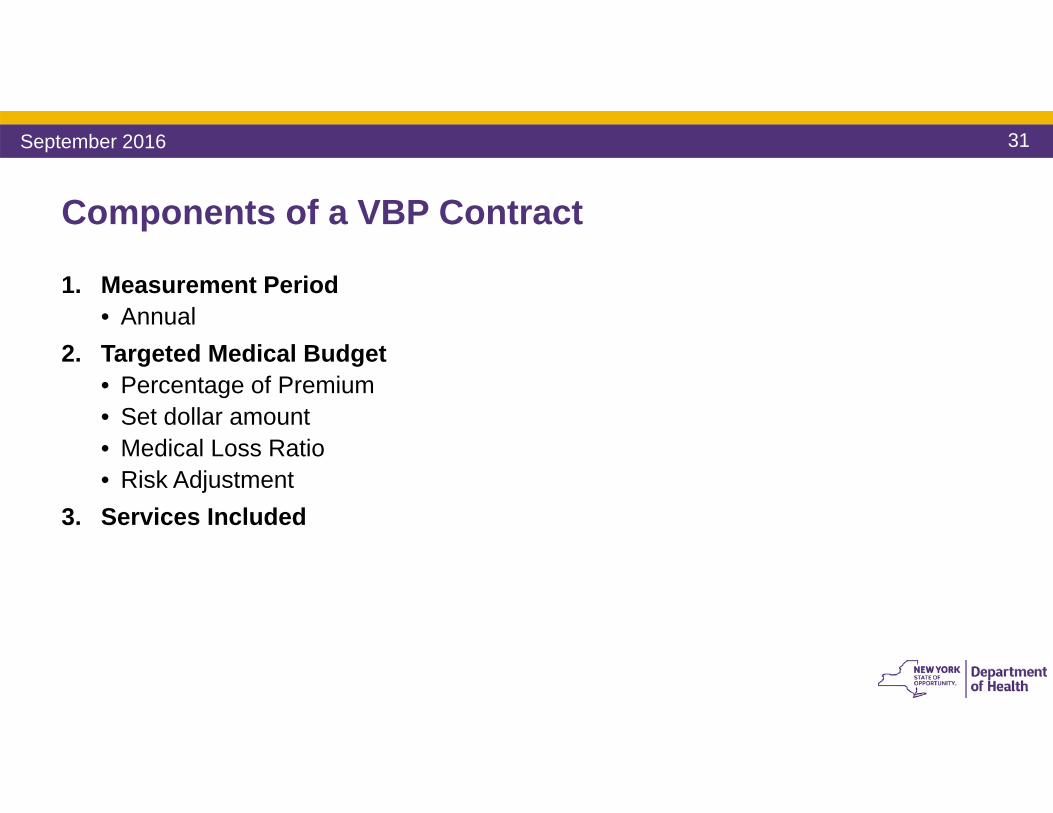
Components of a VBP Contract
1. Measurement Period• Annual
2. Targeted Medical Budget• Percentage of Premium• Set dollar amount• Medical Loss Ratio• Risk Adjustment
3. Services Included
September 2016
32
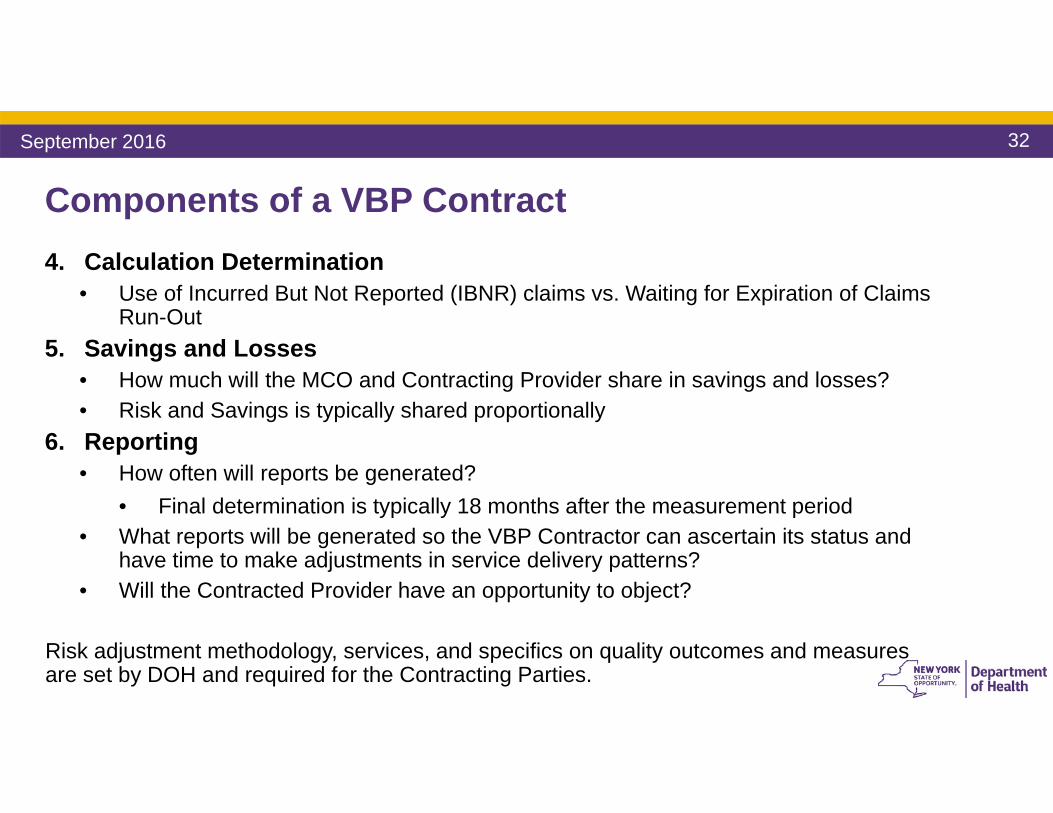
Components of a VBP Contract 4. Calculation Determination
• Use of Incurred But Not Reported (IBNR) claims vs. Waiting for Expiration of Claims Run-Out
5. Savings and Losses • How much will the MCO and Contracting Provider share in savings and losses?• Risk and Savings is typically shared proportionally
6. Reporting • How often will reports be generated?
• Final determination is typically 18 months after the measurement period• What reports will be generated so the VBP Contractor can ascertain its status and
have time to make adjustments in service delivery patterns?• Will the Contracted Provider have an opportunity to object?
Risk adjustment methodology, services, and specifics on quality outcomes and measures are set by DOH and required for the Contracting Parties.
September 2016
33
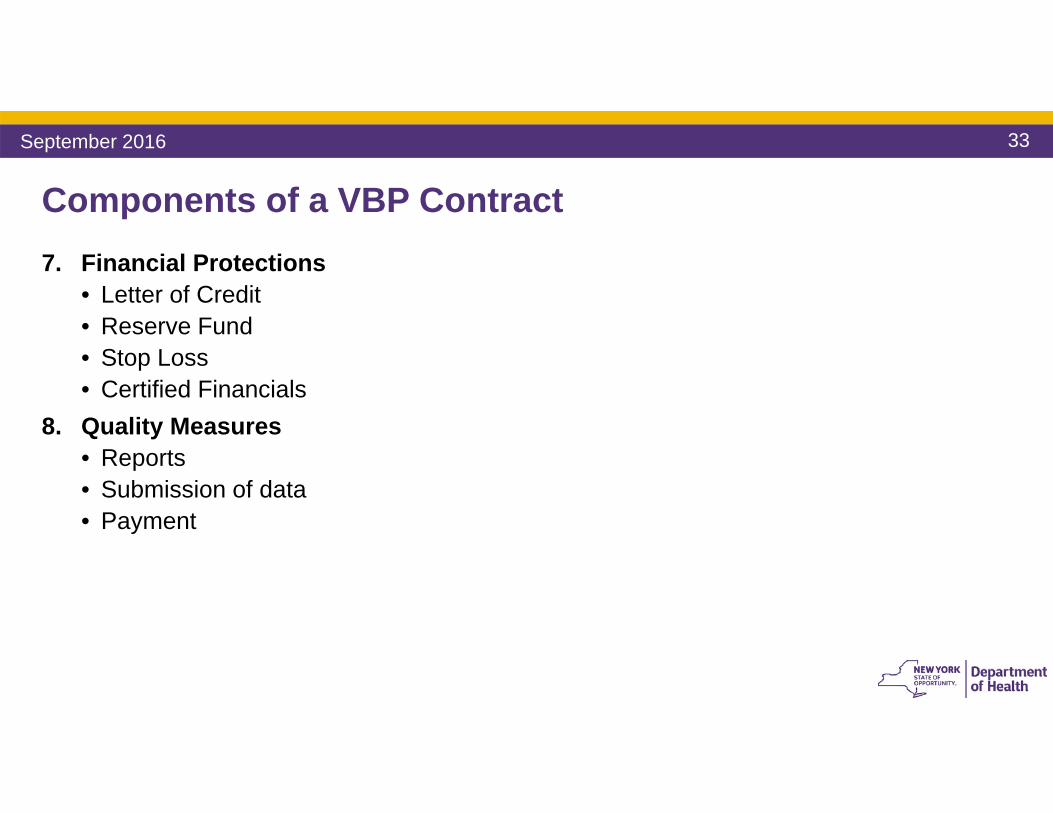
Components of a VBP Contract 7. Financial Protections
• Letter of Credit• Reserve Fund• Stop Loss• Certified Financials
8. Quality Measures• Reports• Submission of data• Payment
September 2016
34
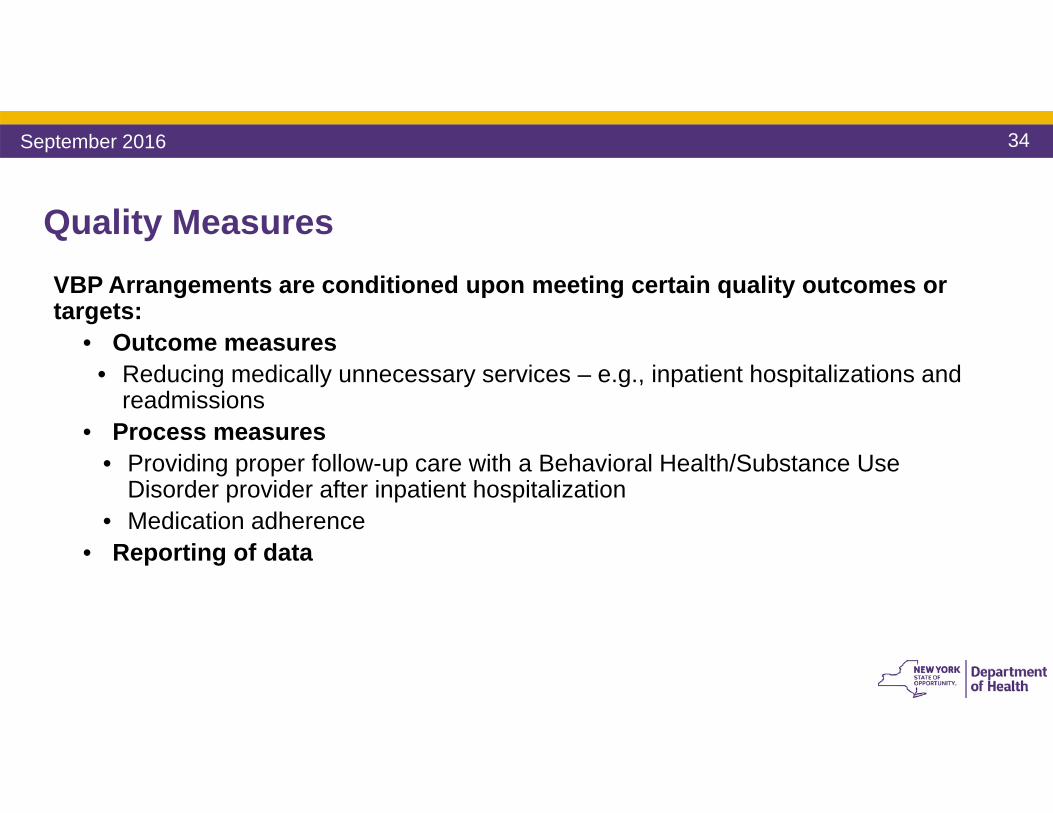
Quality MeasuresVBP Arrangements are conditioned upon meeting certain quality outcomes or targets:
• Outcome measures• Reducing medically unnecessary services – e.g., inpatient hospitalizations and
readmissions• Process measures
• Providing proper follow-up care with a Behavioral Health/Substance Use Disorder provider after inpatient hospitalization
• Medication adherence • Reporting of data
September 2016
35
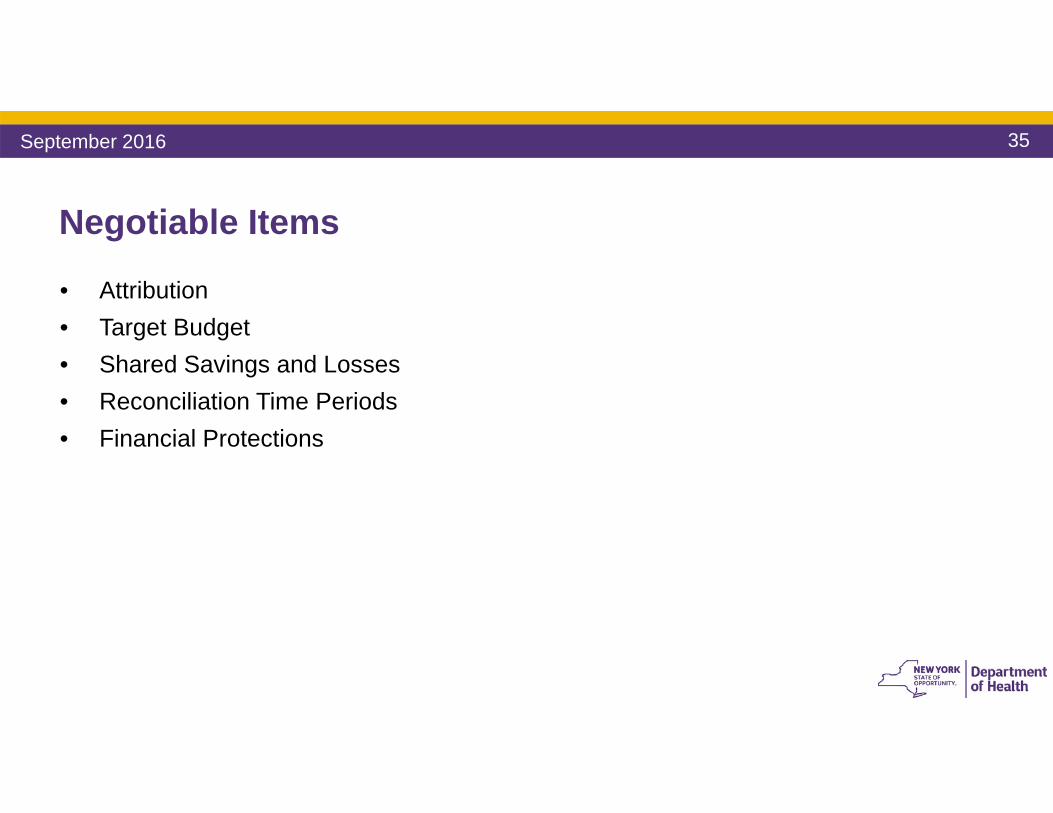
Negotiable Items
• Attribution • Target Budget• Shared Savings and Losses• Reconciliation Time Periods• Financial Protections
September 2016
36
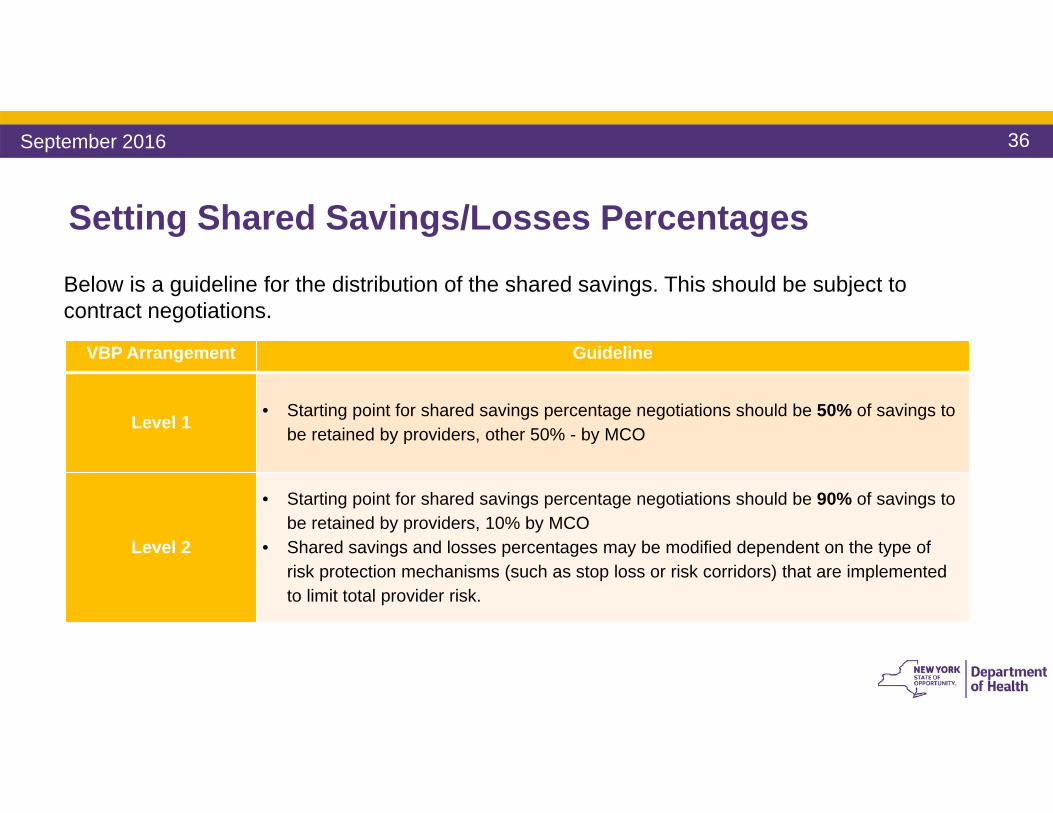
Setting Shared Savings/Losses Percentages
VBP Arrangement Guideline
Level 1 • Starting point for shared savings percentage negotiations should be 50% of savings to be retained by providers, other 50% - by MCO
Level 2
• Starting point for shared savings percentage negotiations should be 90% of savings to be retained by providers, 10% by MCO
• Shared savings and losses percentages may be modified dependent on the type of risk protection mechanisms (such as stop loss or risk corridors) that are implemented to limit total provider risk.
Below is a guideline for the distribution of the shared savings. This should be subject to contract negotiations.
September 2016
37
Financial Risk Management
September 2016
38
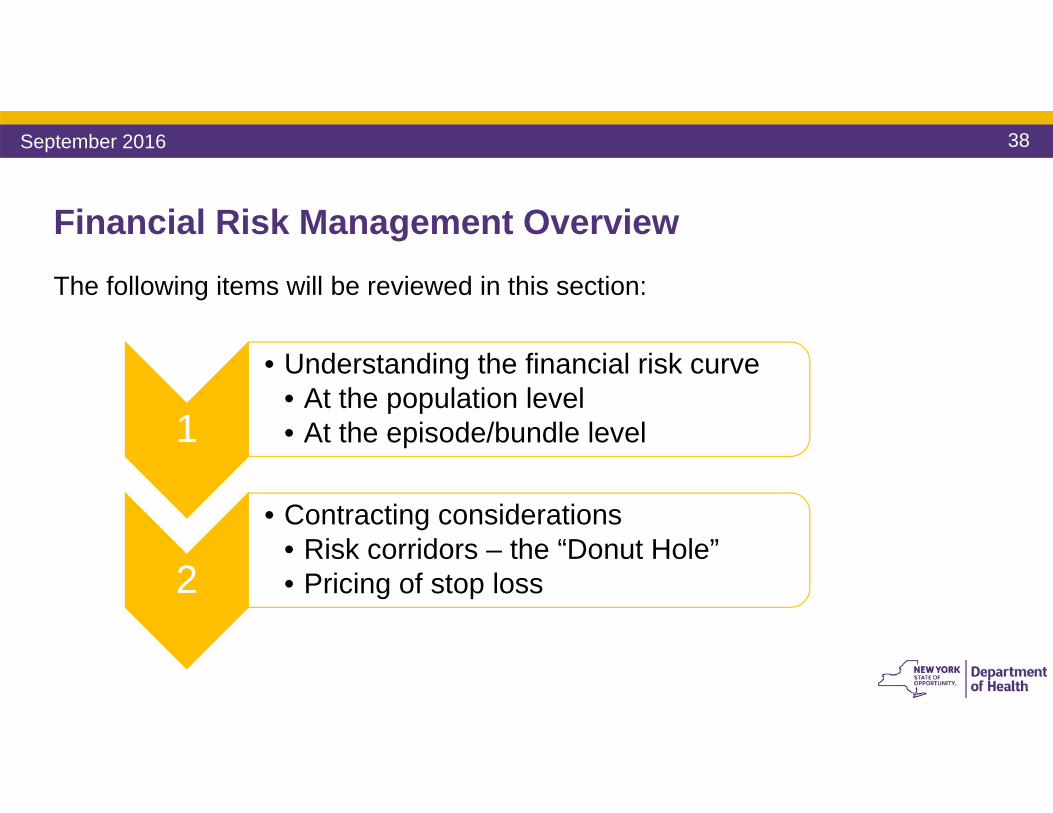
Financial Risk Management OverviewThe following items will be reviewed in this section:
1
• Understanding the financial risk curve• At the population level• At the episode/bundle level
2
• Contracting considerations• Risk corridors – the “Donut Hole”• Pricing of stop loss
September 2016
39
Chronic Illness, Acute Conditions, Procedures
Num
ber o
f Pla
n M
embe
rs
Average Costs Per Member Per Year
Total Cum
ulative Costs
The Different Zones of Health Care Spending
Routine Sick and Preventive Care
Uncommon Conditions & Procedures$
$$
$$$$
Also known as ‘tail end’
September 2016
40
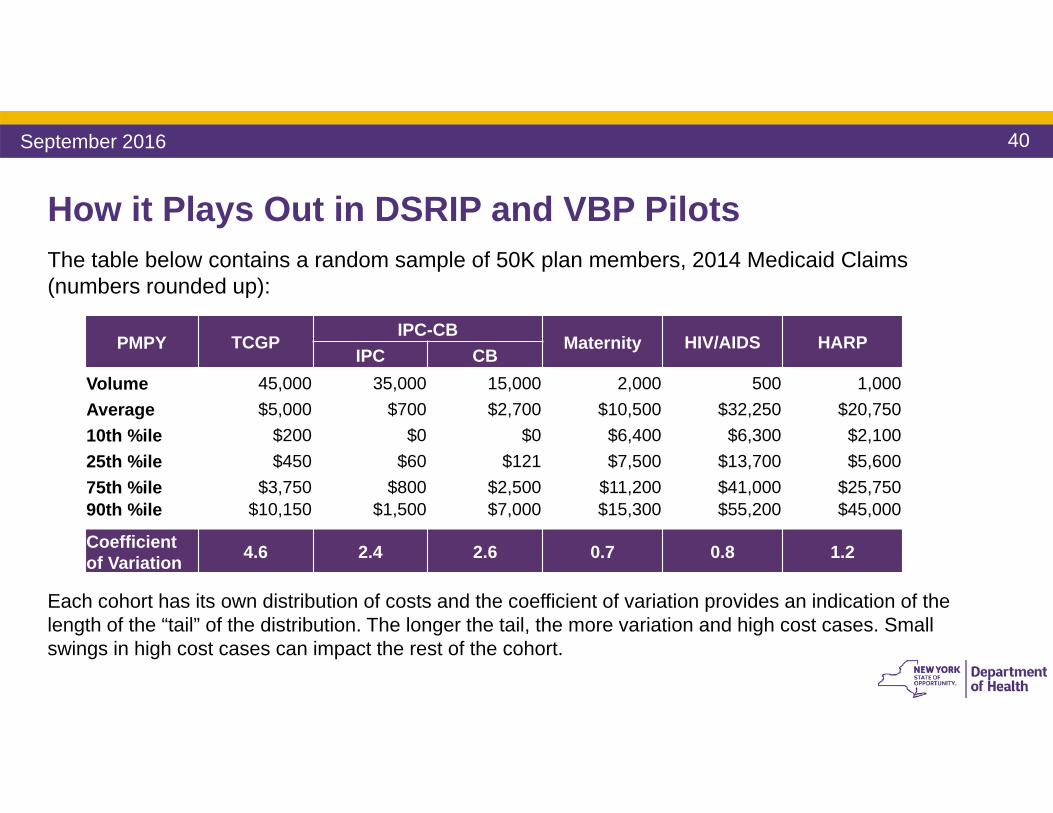
How it Plays Out in DSRIP and VBP Pilots
PMPY TCGPIPC-CB
Maternity HIV/AIDS HARPIPC CB
Volume 45,000 35,000 15,000 2,000 500 1,000Average $5,000 $700 $2,700 $10,500 $32,250 $20,750 10th %ile $200 $0 $0 $6,400 $6,300 $2,10025th %ile $450 $60 $121 $7,500 $13,700 $5,60075th %ile $3,750 $800 $2,500 $11,200 $41,000 $25,75090th %ile $10,150 $1,500 $7,000 $15,300 $55,200 $45,000
Coefficient of Variation 4.6 2.4 2.6 0.7 0.8 1.2
Each cohort has its own distribution of costs and the coefficient of variation provides an indication of the length of the “tail” of the distribution. The longer the tail, the more variation and high cost cases. Small swings in high cost cases can impact the rest of the cohort.
The table below contains a random sample of 50K plan members, 2014 Medicaid Claims (numbers rounded up):
September 2016
41
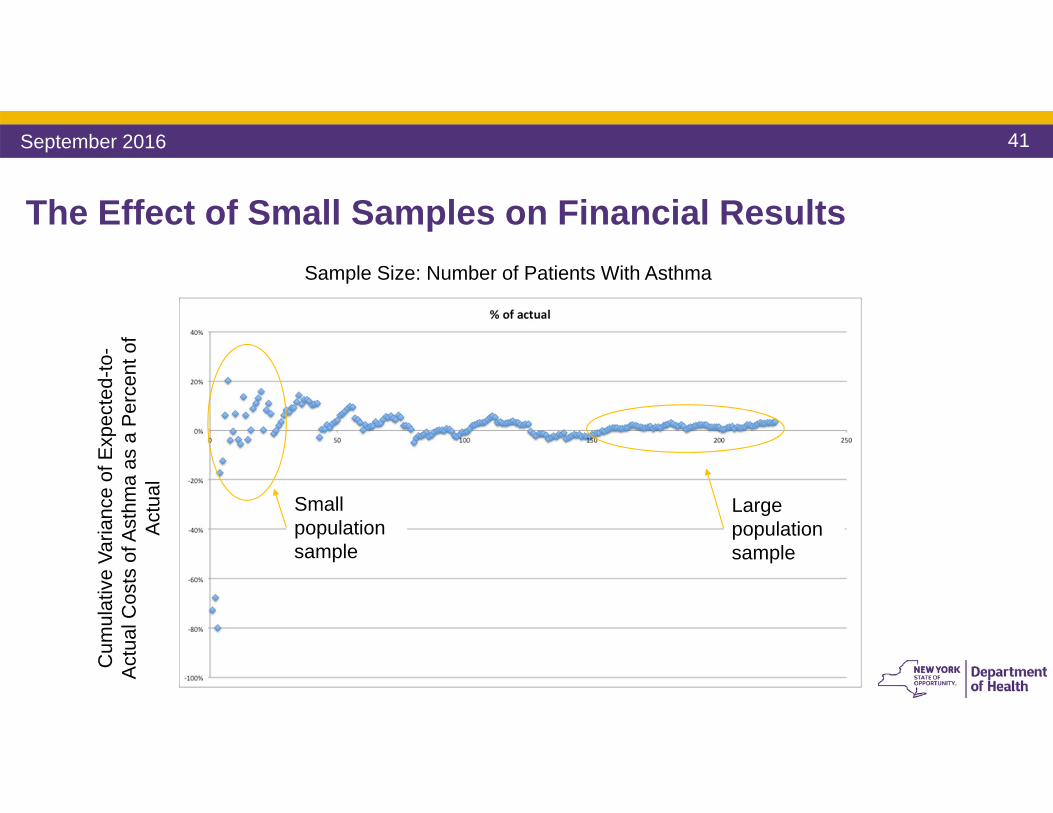
The Effect of Small Samples on Financial ResultsSample Size: Number of Patients With Asthma
Cum
ulat
ive
Varia
nce
of E
xpec
ted-
to-
Act
ual C
osts
of A
sthm
a as
a P
erce
nt o
f A
ctua
l
Small population sample
Large population sample
September 2016
42
Population Size Considerations
• The size of your population matters – larger samples help better understand cost trends and population behaviors
• That said, more people doesn’t mean less individual case variation
• It is not recommended to contract VBP arrangements for small population groups
• Severity adjustment does work when applied properly (on larger population samples)
September 2016
43
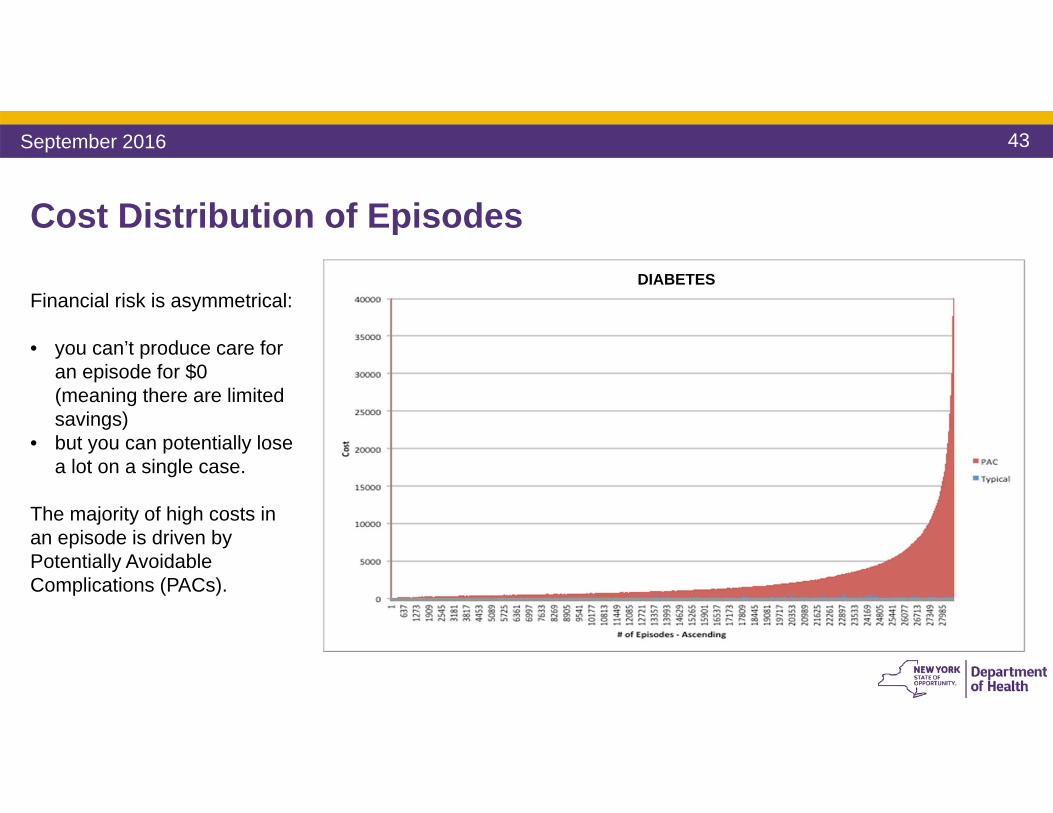
Cost Distribution of Episodes
Financial risk is asymmetrical:
• you can’t produce care for an episode for $0 (meaning there are limited savings)
• but you can potentially lose a lot on a single case.
The majority of high costs in an episode is driven by Potentially Avoidable Complications (PACs).
DIABETES
September 2016
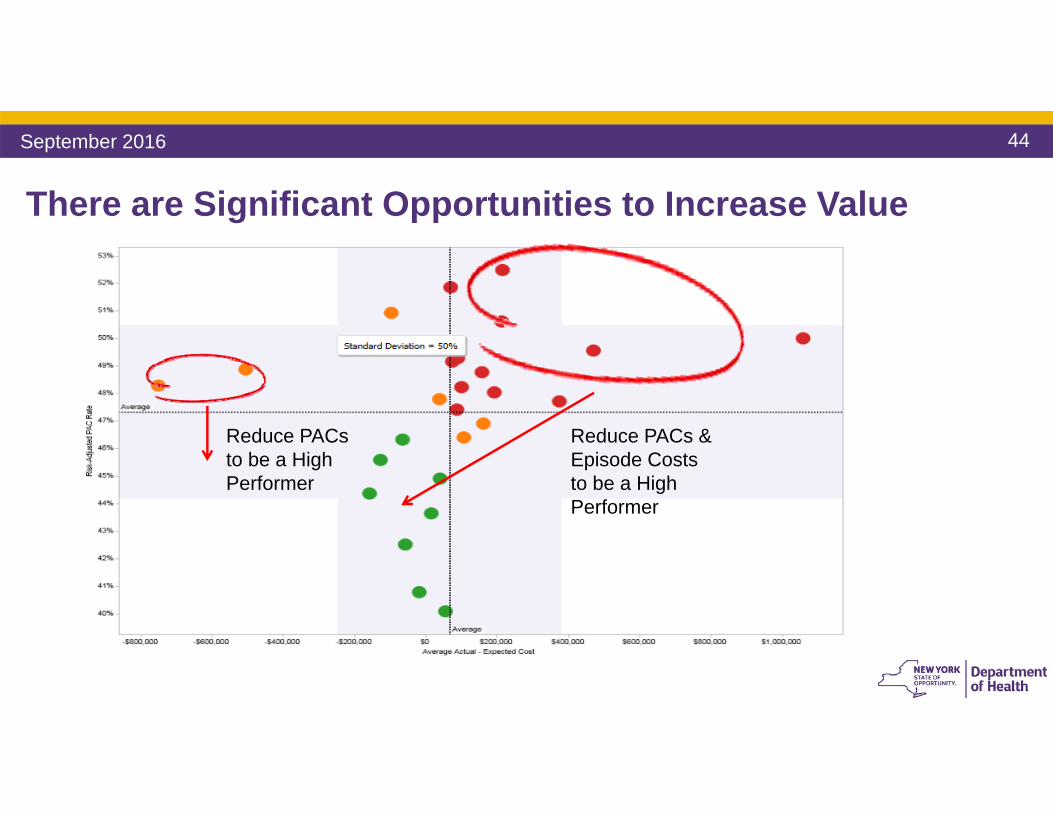
44
There are Significant Opportunities to Increase Value
Reduce PACs & Episode Costs to be a High Performer
Reduce PACs to be a High Performer
September 2016
45
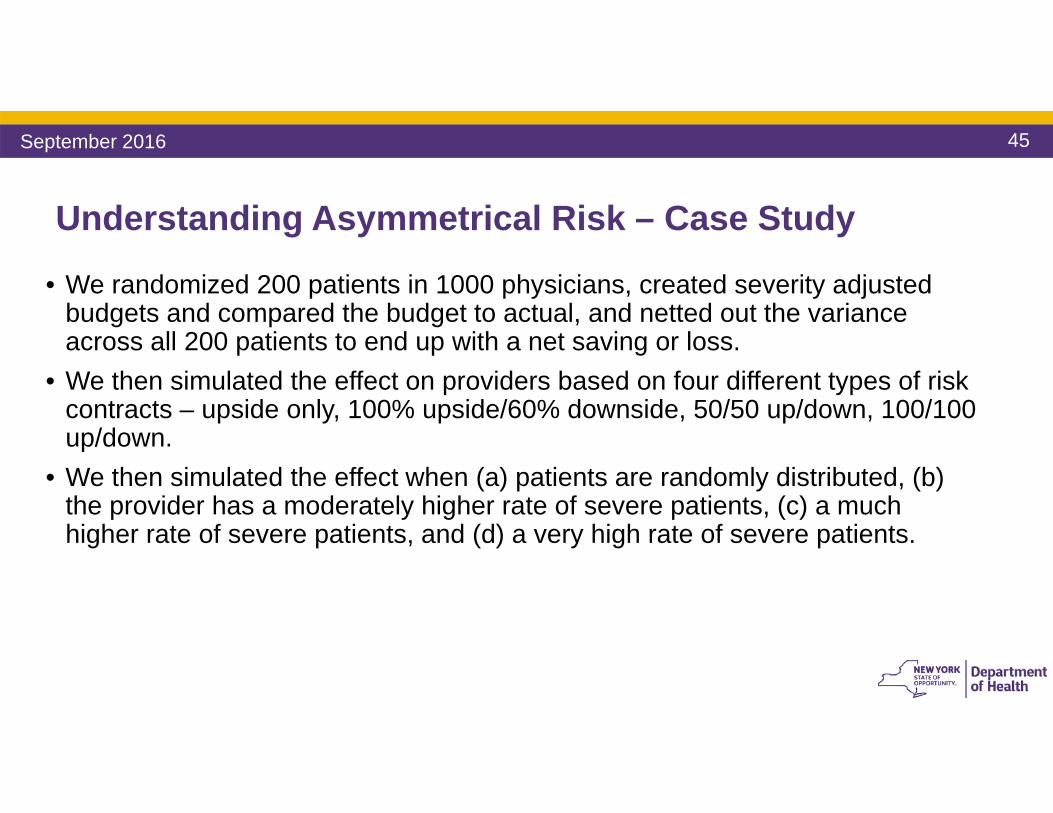
Understanding Asymmetrical Risk – Case Study
• We randomized 200 patients in 1000 physicians, created severity adjusted budgets and compared the budget to actual, and netted out the variance across all 200 patients to end up with a net saving or loss.
• We then simulated the effect on providers based on four different types of risk contracts – upside only, 100% upside/60% downside, 50/50 up/down, 100/100 up/down.
• We then simulated the effect when (a) patients are randomly distributed, (b) the provider has a moderately higher rate of severe patients, (c) a much higher rate of severe patients, and (d) a very high rate of severe patients.
September 2016
46
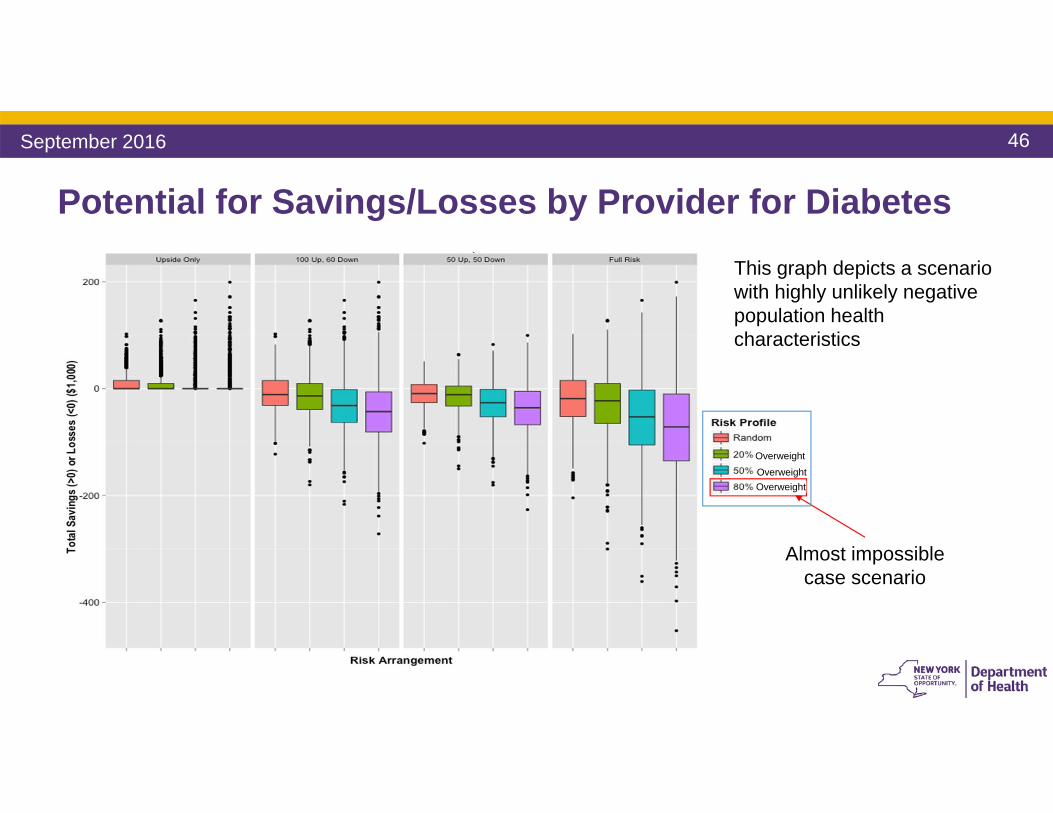
Potential for Savings/Losses by Provider for Diabetes
Almost impossible case scenario
OverweightOverweight
This graph depicts a scenario with highly unlikely negative population health characteristics
Overweight
September 2016
47
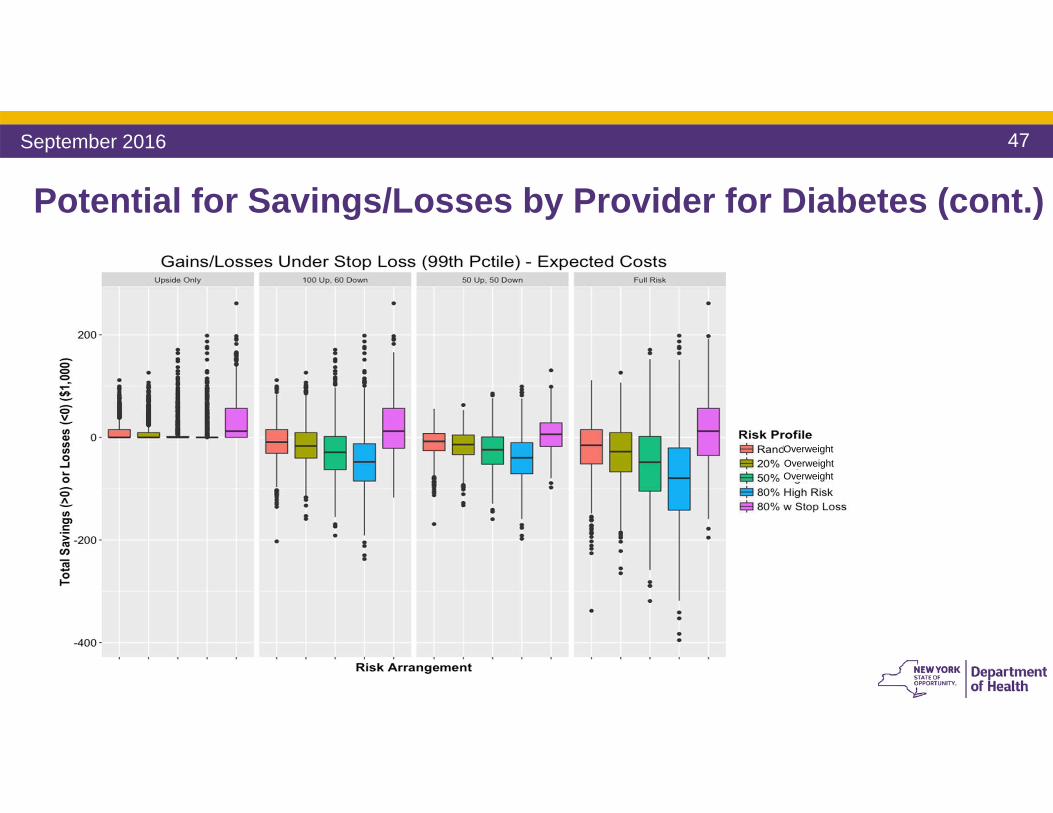
Potential for Savings/Losses by Provider for Diabetes (cont.)
OverweightOverweightOverweight
September 2016
48
Implications for Equal Saving/Loss Sharing
• Even when adjusting for patient severity, a random assignment of patients yields a slightly greater potential for losses than savings because of the asymmetrical nature of savings/losses.
• A slight overweighting of greater than average severe patients can cause a greater imbalance in the potential for savings/losses by provider.
• A large overweighting of very severe patients will almost always result in provider losses. The opposite is also true.
• It’s possible to level the playing field up front, and then provider performance does the rest.
September 2016
49
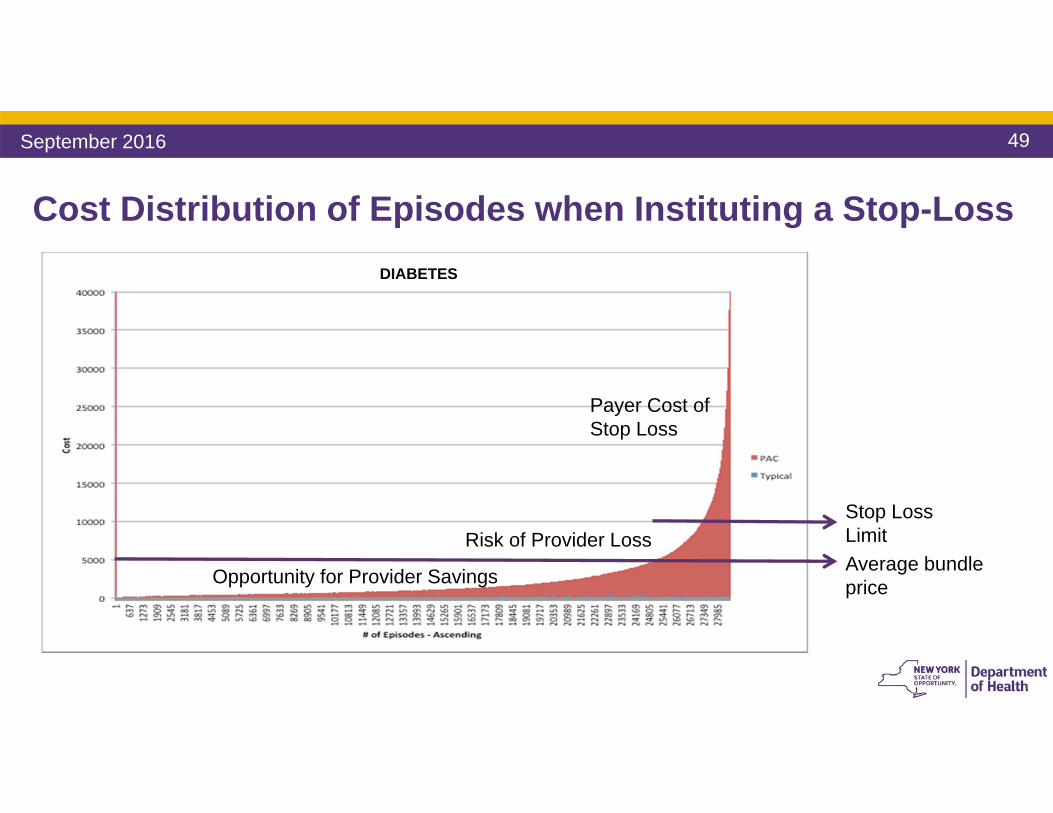
Opportunity for Provider Savings
Risk of Provider Loss
Payer Cost of Stop Loss
Average bundle price
Stop Loss Limit
Cost Distribution of Episodes when Instituting a Stop-LossDIABETES
September 2016
50
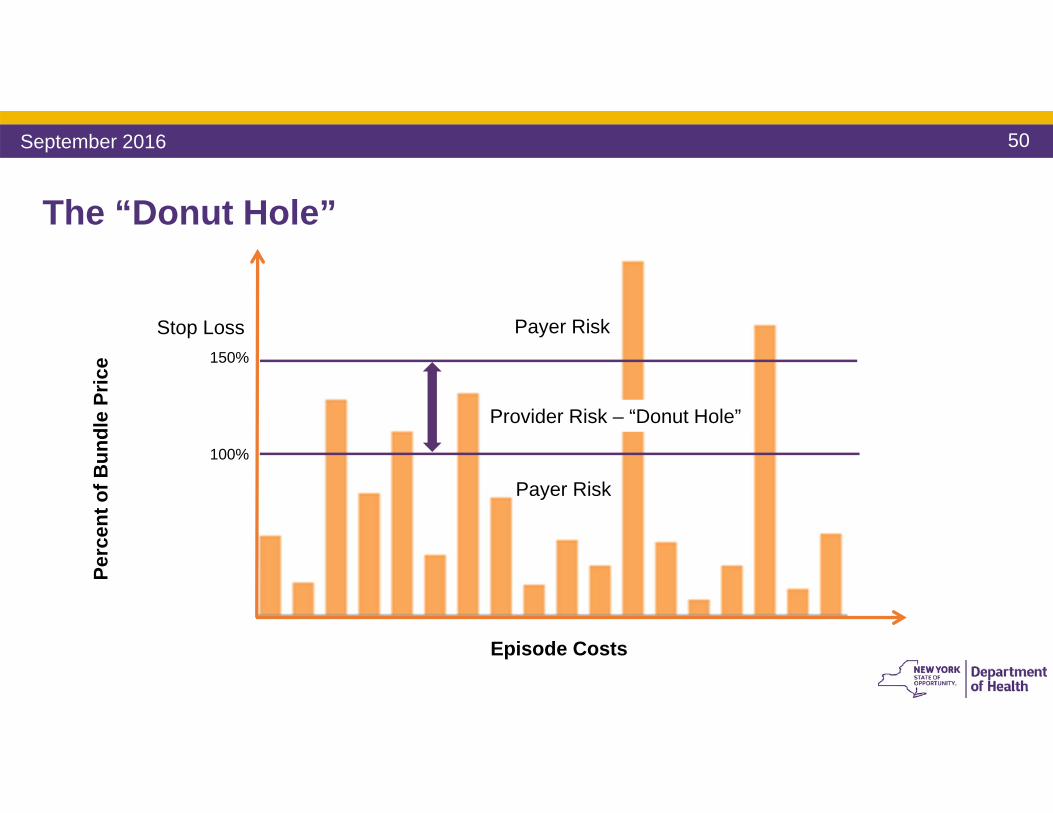
The “Donut Hole”
Payer Risk
Payer Risk
Provider Risk – “Donut Hole”
Perc
ent o
f Bun
dle
Pric
e
100%
Episode Costs
Stop Loss150%
Payer Risk
Provider Risk – “Donut Hole”
Payer Risk
September 2016
51
Managing Financial Risk in a Fixed Price Contract• The provider is at risk for the excess costs over the prospective budget, up to
the stop loss per episode• The budget is severity adjusted• The extent to which a provider is already highly efficient, a margin can be
negotiated• The “Donut Hole” contains manageable risk
• There can be an aggregate stop loss in addition to a per episode stop-loss• In the Level 1 “upside only risk” model, the stop loss = budget
• But there is a cost to stop-loss for the payer
September 2016
52
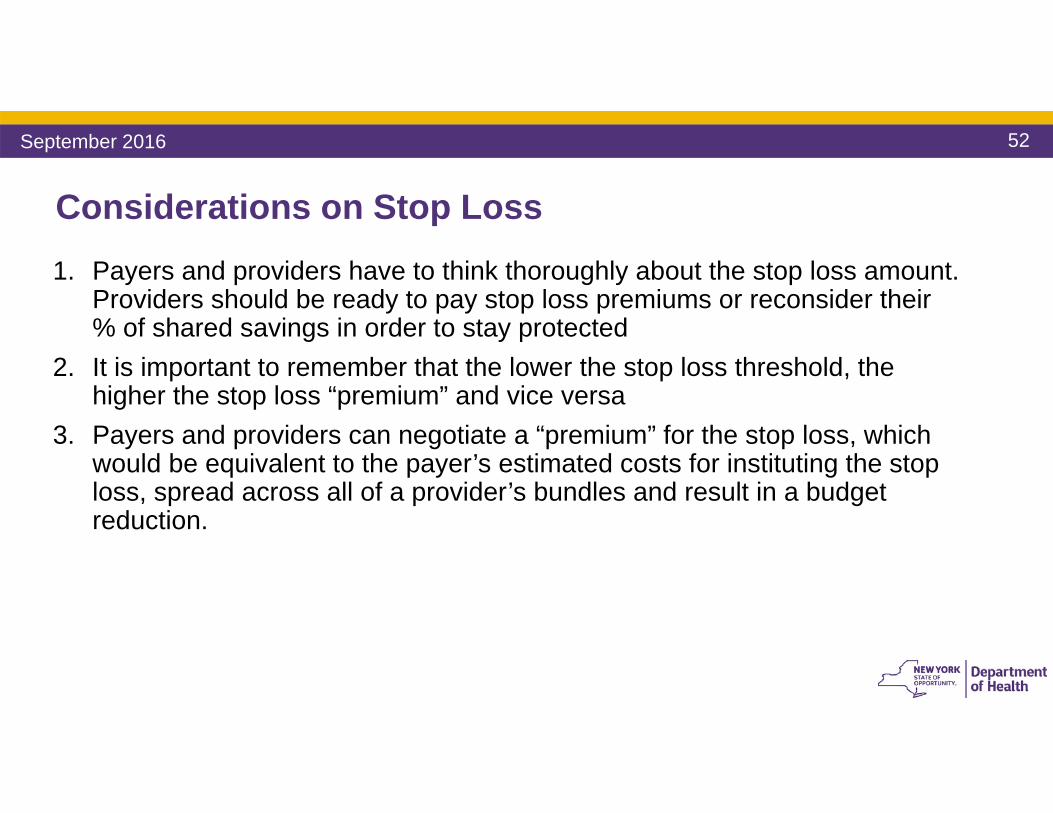
Considerations on Stop Loss1. Payers and providers have to think thoroughly about the stop loss amount.
Providers should be ready to pay stop loss premiums or reconsider their % of shared savings in order to stay protected
2. It is important to remember that the lower the stop loss threshold, the higher the stop loss “premium” and vice versa
3. Payers and providers can negotiate a “premium” for the stop loss, which would be equivalent to the payer’s estimated costs for instituting the stop loss, spread across all of a provider’s bundles and result in a budget reduction.
September 2016
53
Considerations on Stop Loss (cont.)
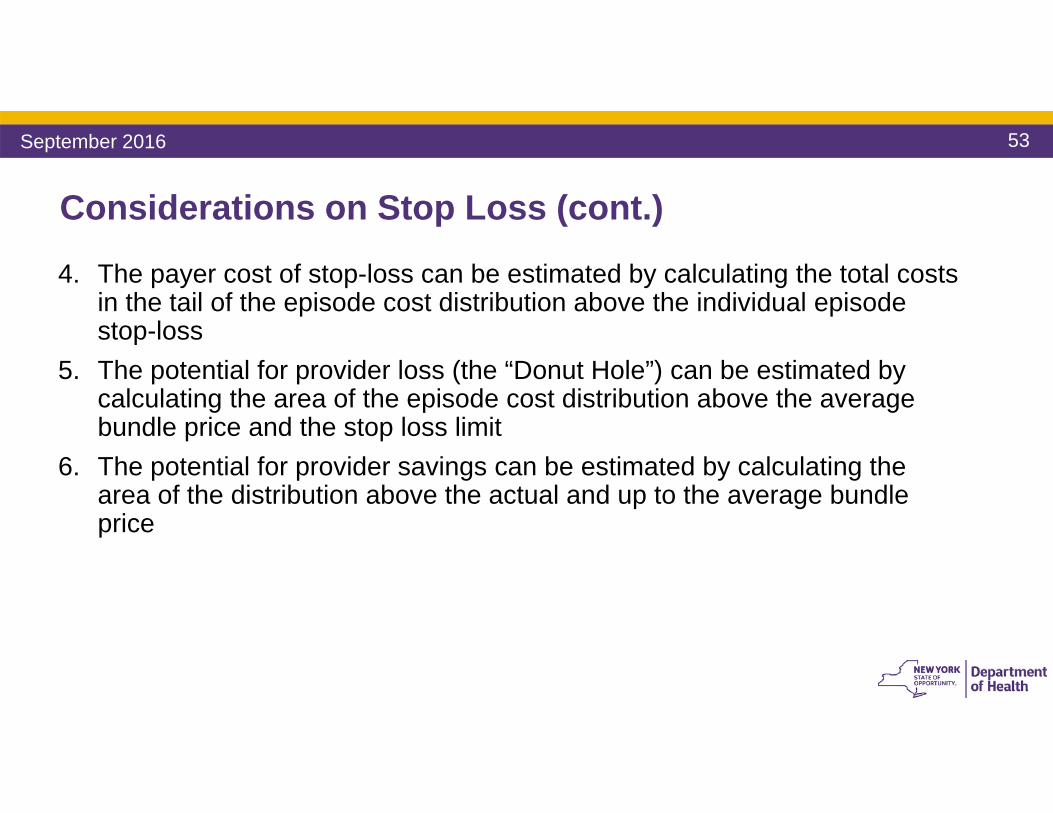
4. The payer cost of stop-loss can be estimated by calculating the total costs in the tail of the episode cost distribution above the individual episode stop-loss
5. The potential for provider loss (the “Donut Hole”) can be estimated by calculating the area of the episode cost distribution above the average bundle price and the stop loss limit
6. The potential for provider savings can be estimated by calculating the area of the distribution above the actual and up to the average bundle price
September 2016
54
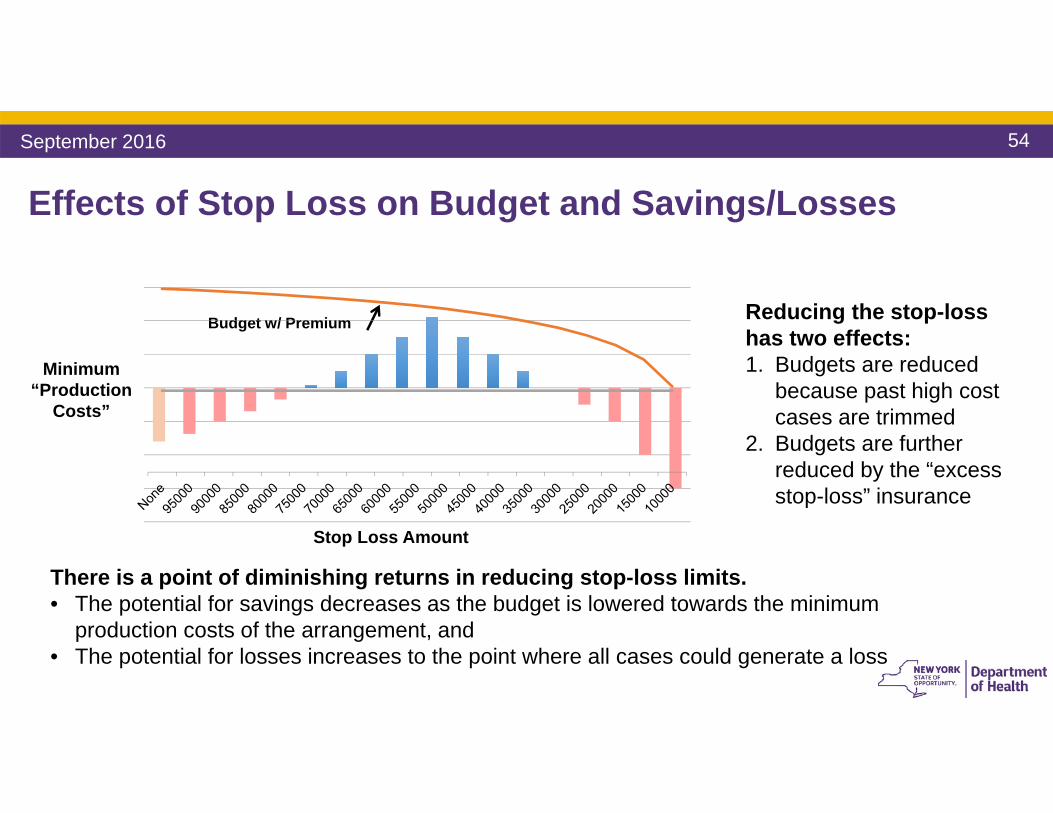
Effects of Stop Loss on Budget and Savings/Losses
Minimum “Production
Costs”
Budget w/ Premium
Stop Loss Amount
Reducing the stop-loss has two effects:1. Budgets are reduced
because past high cost cases are trimmed
2. Budgets are further reduced by the “excess stop-loss” insurance
There is a point of diminishing returns in reducing stop-loss limits. • The potential for savings decreases as the budget is lowered towards the minimum
production costs of the arrangement, and • The potential for losses increases to the point where all cases could generate a loss
September 2016
55
Margins Could be Considered for Highly Efficient Providers
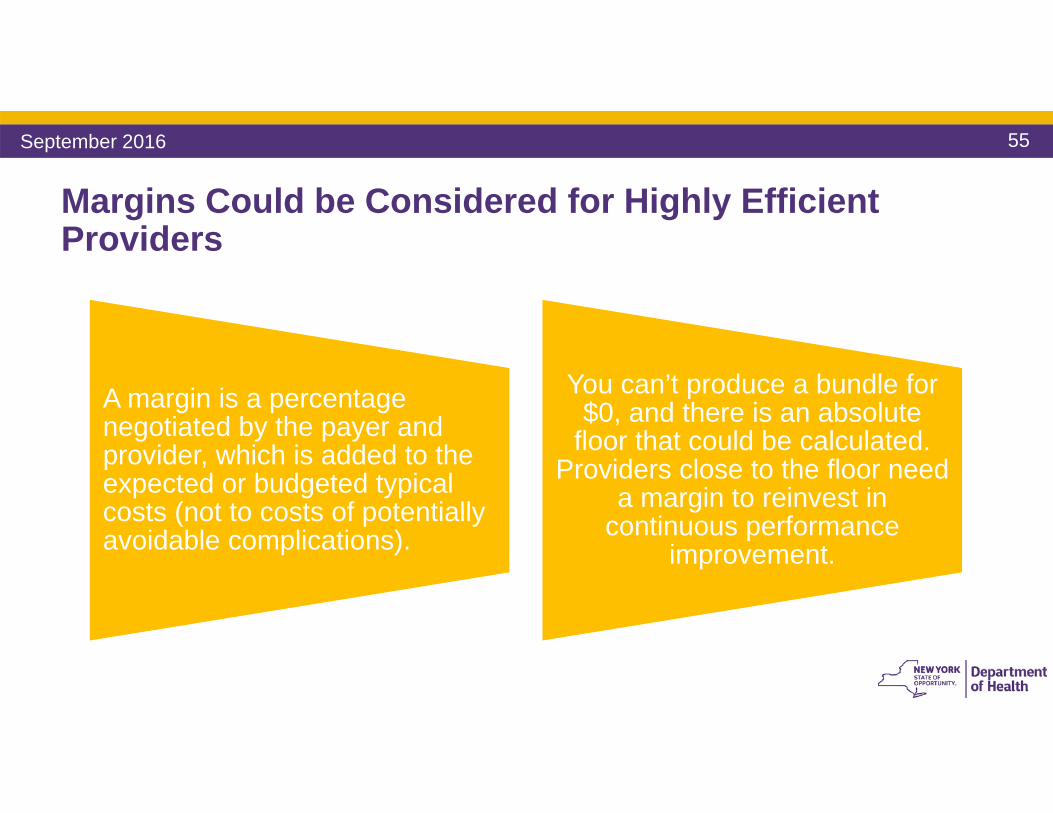
A margin is a percentage negotiated by the payer and provider, which is added to the expected or budgeted typical costs (not to costs of potentially avoidable complications).
You can’t produce a bundle for $0, and there is an absolute
floor that could be calculated. Providers close to the floor need
a margin to reinvest in continuous performance
improvement.
September 2016
56
General Risk Considerations• Because of the asymmetrical distribution of savings and losses, you can’t
produce good care management of a patient with a chronic disease for $0, but you can potentially end up with patients that have very high costs of PACs – consider asymmetrical risk-sharing contracts.
• Using a stop-loss mitigates the asymmetry by limiting the losses.• The specific savings sharing formula can be informed by the shape of the
episode cost distribution and the level of stop-loss.• Once the up front odds have been leveled, the end result is a function of
provider performance, not chance.
September 2016
57
Summary of Financial Risk Management Strategies
1 Upside/downside risk sharing arrangements don’t have to be symmetrical
2 Stop losses are for individual cases and can be in aggregate. There is a cost to a stop loss because the payer assumes the risk. “Excess” stop-loss insurance should come in reduction of the target budget/price
3 Defined margins are important to insulate providers from incurring losses because their potential for achieving further efficiencies is low
4 Quality scorecards can be used to encourage continued quality improvement even when providers have a bad financial year, and can be used to limit upside risk when quality doesn’t improve or fails to meet a certain threshold performance
September 2016
58
What are the Next Steps in VBP Implementation? NYS has developed a 2 year (2016 – 2018) VBP Pilot program, to support providers and
payers in adopting and implementing VBP arrangements, supporting the State’s transition to VBP.
The Managed Long-Term Care Clinical Advisory Group (CAG) will reconvene in 2017(when necessary), to investigate key lessons learned and understand how these lessons may further refine the VBP arrangement.
New Subcommittees and Workgroups will be held to address outstanding issues and keep abreast of needs that may arise during implementation.
The State will run VBP Bootcamps across the State, to share foundational VBP knowledge.
June 2016
59
What are the Next Steps in VBP Implementation? NYS has developed a 2 year (2016 – 2018) VBP Pilot program, to support providers and
payers in adopting and implementing VBP arrangements, supporting the State’s transition to VBP.
The Managed Long-Term Care Clinical Advisory Group (CAG) will reconvene in 2017(when necessary), to investigate key lessons learned and understand how these lessons may further refine the VBP arrangement.
New Subcommittees and Workgroups will be held to address outstanding issues and keep abreast of needs that may arise during implementation.
The State will run VBP Bootcamps across the State, to share foundational VBP knowledge.
September 2016
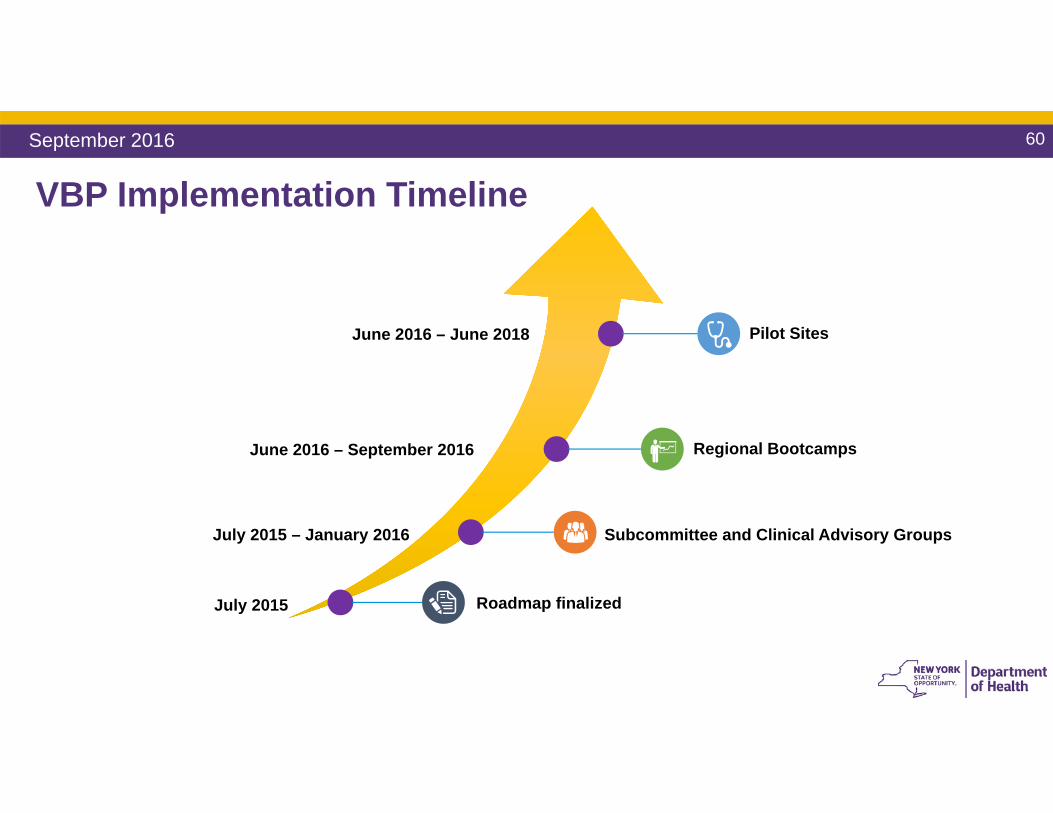
VBP Implementation Timeline
Roadmap finalized
Subcommittee and Clinical Advisory Groups
Regional Bootcamps
Pilot Sites
July 2015
July 2015 – January 2016
June 2016 – September 2016
June 2016 – June 2018
September 2016 60
61
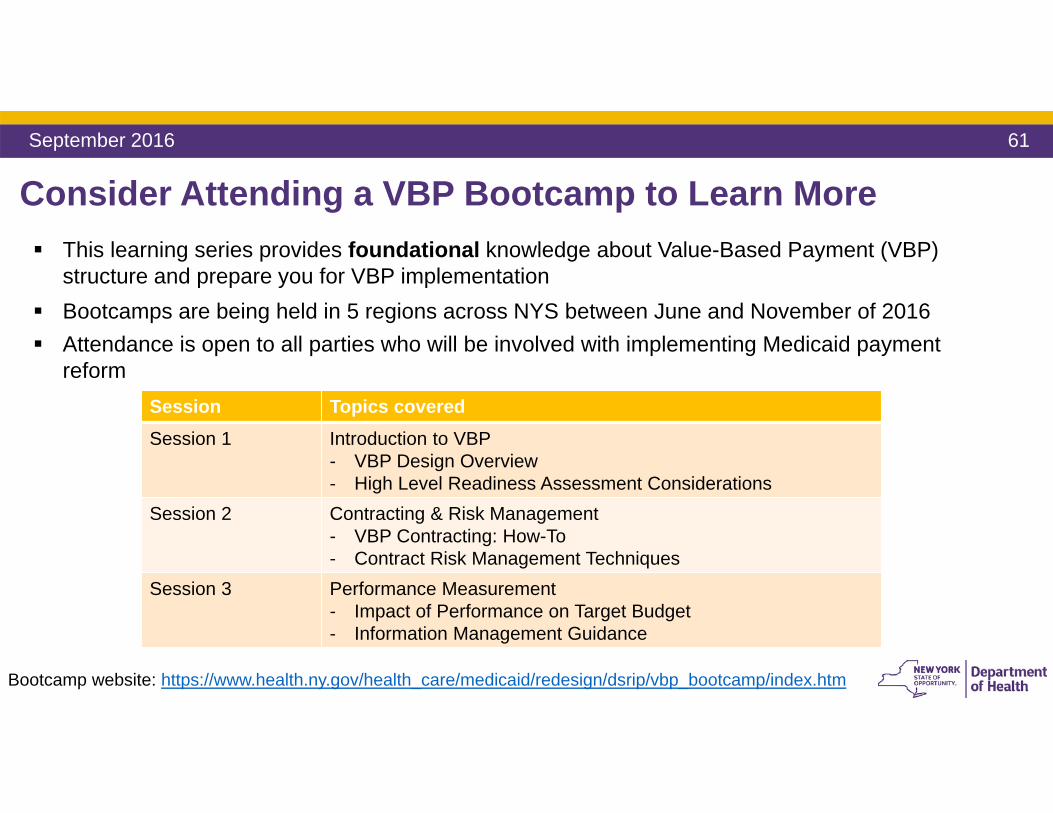
Consider Attending a VBP Bootcamp to Learn More This learning series provides foundational knowledge about Value-Based Payment (VBP)
structure and prepare you for VBP implementation Bootcamps are being held in 5 regions across NYS between June and November of 2016 Attendance is open to all parties who will be involved with implementing Medicaid payment
reformSession Topics covered Session 1 Introduction to VBP
- VBP Design Overview- High Level Readiness Assessment Considerations
Session 2 Contracting & Risk Management - VBP Contracting: How-To - Contract Risk Management Techniques
Session 3 Performance Measurement- Impact of Performance on Target Budget - Information Management Guidance
September 2016
Bootcamp website: https://www.health.ny.gov/health_care/medicaid/redesign/dsrip/vbp_bootcamp/index.htm
Questions?
DSRIP email:[email protected]
For more information:https://www.health.ny.gov/health_care/medicaid/redesign/dsrip/vbp_reform.htm