Embed Size (px)
Citation preview

Breach Analysis and
Inundation Mapping
Springbank Off-Stream Reservoir
(SR1)
Prepared for:
Alberta Transportation
Prepared by:
Stantec Consulting Services Inc.
11687 Lebanon Road
Cincinnati, OH 45241-2012
March 8, 2017

Sign-off Sheet
This document entitled Breach Analysis and Inundation Mapping was prepared by Stantec
Consulting Services Inc. (“Stantec”) for the account of Alberta Transportation (the “Client”). Any
reliance on this document by any third party is strictly prohibited. The material in it reflects Stantec’s
professional judgment in light of the scope, schedule and other limitations stated in the document
and in the contract between Stantec and the Client. The opinions in the document are based on
conditions and information existing at the time the document was published and do not take into
account any subsequent changes. In preparing the document, Stantec did not verify information
supplied to it by others. Any use which a third party makes of this document is the responsibility of
such third party. Such third party agrees that Stantec shall not be responsible for costs or damages
of any kind, if any, suffered by it or any other third party as a result of decisions made or actions
taken based on this document.
Prepared by
(signature)
Enter Name
Reviewed by
(signature)
Enter Name

BREACH ANALYSIS AND INUNDATION MAPPING
Table of Contents
1.0 INTRODUCTION ...........................................................................................................1.1
1.1 BACKGROUND INFORMATION ..................................................................................... 1.1
1.2 SCOPE OF STUDY ............................................................................................................ 1.2
2.0 SOURCE DATA .............................................................................................................2.3
3.0 BREACH ANALYSIS ......................................................................................................3.4
3.1 BREACH SCENARIOS ...................................................................................................... 3.4 3.1.1 Flood-Induced Failure Scenario of Off-Stream Storage Dam ............... 3.4 3.1.2 Post-Flood Failure Scenario of Off-Stream Storage Dam ....................... 3.4 3.1.3 Flood-Induced Failure Scenario of Diversion Structure .......................... 3.4 3.1.4 Post-Flood Failure Scenario of Diversion Structure .................................. 3.5 3.1.5 Cascade Failure Potential .......................................................................... 3.5
3.2 BREACH LOCATION ....................................................................................................... 3.5
3.3 BREACH HYDROGRAPH DEVELOPMENT ..................................................................... 3.5
3.4 HYDRAULIC MODEL DEVELOPMENT ............................................................................ 3.7 3.4.1 Model Geometry ......................................................................................... 3.7 3.4.2 Boundary Conditions ................................................................................... 3.7
4.0 RESULTS AND INUNDATION MAPPING ........................................................................4.9 4.1.1 Flood-Induced Failure of Diversion Structure ........................................... 4.9 4.1.2 Post-Flood Failure of Off-Stream Storage Dam ....................................... 4.9
5.0 REFERENCES ...............................................................................................................5.11
LIST OF TABLES
Table 1 – Summary of Estimated Dam Breach Parameters ................................................. 3.6 Table 2 – Summary of Land Use Types for Extended HEC-RAS Geometry......................... 3.7 Table 3 – Summary of Boundary Conditions .......................................................................... 3.8 Table 4 – Summary of Results for Post-Flood Failure of Off-Stream Storage Dam .......... 4.10
LIST OF FIGURES
Figure 1 - SR1 Location Map .................................................................................................... 1.2
LIST OF APPENDICES
Appendix A – Hydrologic and Breach Data
Appendix B – Breach Routing Results

BREACH ANALYSIS AND INUNDATION MAPPING
Introduction
March 8, 2017
dh u:\110773396\component_work\dams_diversion\hydrotechnical\analysis\breach_analysis\report\sr1_breach_analysis_report_revb_20170307.docx
1
.
1
1.0 INTRODUCTION
1.1 BACKGROUND INFORMATION
The Springbank Off-Stream Reservoir (SR1) is located approximately 12 km west of the City of
Calgary, approximately 28 km upstream of the Glenmore Reservoir on the Elbow River. The
project is comprised of three primary elements: diversion structure, diversion channel and off-
stream storage dam. Both the Diversion Structure and Off-Stream Storage Dam are considered
dams. A location map of SR1 is provided in Figure 1.
The Off-Stream Storage Dam is a flood storage facility comprised of an earthen embankment,
outlet works, and emergency spillway that will store diverted flood waters and release the flow
once the flood has passed. The Off-Stream Storage Dam has a maximum storage capacity at
the Emergency Spillway (Elevation 1210.75 m) of 77900 dam3 and a pool area of 7.8 km2. The
dam embankment has a crest elevation of 1213.5 m corresponding to a maximum height of
approximately 28.5 m and length of approximately 4.4 km. The impoundment area will remain
dry before flood events. Inflow will be controlled to limit the maximum water level to 1210.75 m.
The Diversion Structure is a regulating structure comprised of an earthen Floodplain Berm,
regulating Diversion Inlet and Service Spillway gate structures, and Roller Compacted Concrete
(RCC) Auxiliary Spillway that will be operate during floods to control the flow into the Off-Stream
Storage Dam via the Diversion Channel. The Diversion Structure is designed to safely pass the
Probable Maximum Flood (PMF) with a maximum headwater elevation of 1217.8 m at the
Auxiliary Spillway and gate structures. The Floodplain Berm spans the floodplain for
approximately 1.0 km and has a crest elevation of 1218.3 m at the downstream end and 1221.4
m at the upstream end. The maximum height of the Floodplain Berm is approximately 6 m
which is above the simulated PMF water surface profile. The impoundment created by the
structure is not a well-defined pool, but behaves more like a roadway embankment.

BREACH ANALYSIS AND INUNDATION MAPPING
Introduction
March 8, 2017
dh u:\110773396\component_work\dams_diversion\hydrotechnical\analysis\breach_analysis\report\sr1_breach_analysis_report_revb_20170307.docx
1
.
2
Figure 1 - SR1 Location Map
1.2 SCOPE OF STUDY
The methods and results of these breach analyses and inundation mapping are summarized, but
this report does not provide commentary on dam hazard classification or recommended actions
to be taken on mitigating potential hazards posed by SR1.
Methodology used in this analysis is consistent with guidance outlined by the Canadian Dam
Association (CDA) Dam Safety Guidelines, 2007 (Reference 1).

BREACH ANALYSIS AND INUNDATION MAPPING
Source Data
March 8, 2017
dh u:\110773396\component_work\dams_diversion\hydrotechnical\analysis\breach_analysis\report\sr1_breach_analysis_report_revb_20170307.docx
2
.
3
2.0 SOURCE DATA
The following information was used to perform the breach analyses and develop inundation
mapping for SR1:
Aerial imagery from Amec (dated 2013) (Reference 2)
1m Lidar data from Amec (dated 2013) (Reference 3)
Aerial imagery from Government of Alberta (dated 2014) (Reference 4)
15m Lidar data from AltaLIS (dated 2013) (Reference 5)
0.5m Lidar data from Tarin Resource Services (dated 2015) (Reference 6)
Glenmore Reservoir bathymetric data (dated 2013) (Reference 7)
Golder Working HEC-RAS model for Elbow and Bow Rivers (dated 2014) (Reference 8)
Structure drawings for Highway 8 bridge on Elbow River (dated 2014) (Reference 9)
Structure drawings for Highway 22 bridge on Elbow River (dated 1986) (Reference 10)
Glenmore Dam spillway rating curve data (dated 2014) (Reference 11)
SR1 preliminary design drawings and surfaces

BREACH ANALYSIS AND INUNDATION MAPPING
Breach Analysis
March 8, 2017
dh u:\110773396\component_work\dams_diversion\hydrotechnical\analysis\breach_analysis\report\sr1_breach_analysis_report_revb_20170307.docx
3
.
4
3.0 BREACH ANALYSIS
3.1 BREACH SCENARIOS
The CDA recommends the analysis of two scenarios when conducting a dam breach and
inundation analysis. These would typically be a “sunny-day” failure and a “flood-induced”
failure. In the case of SR1, a “sunny-day” failure is not realistic because neither the Off-Stream
Storage Dam or Diversion Structure is designed to have a permanent pool. The “sunny-date”
scenario has been replaced with a post-flood failure scenario.
3.1.1 Flood-Induced Failure Scenario of Off-Stream Storage Dam
The flood-induced failure scenario assumes a failure of the Off-Stream Storage Dam coincident
with a flood of magnitude greater than the dam can safely pass. The SR1 Off-Stream Storage
Dam has been designed assuming a dam classification of “Extreme” (Reference 1) and
therefore is capable of safely passing an Inflow Design Flood (IDF) equivalent to the portion of
the PMF which would be diverted to SR1 if the Diversion Inlet gates failed to be closed when SR1
reaches its design capacity of 1210.75 m. The pool elevation will maintain 1.5 m freeboard to
the crest of the Off-Stream Storage Dam under this scenario, so a failure by piping would be the
only potential failure mode. Because a flood-induced failure of the Off-Stream Storage Dam
would require the coincident failure of both operation and a piping failure during a transitory
period of elevated flows, Stantec does not consider it a valid failure scenario and no further
analysis was performed to evaluate it.
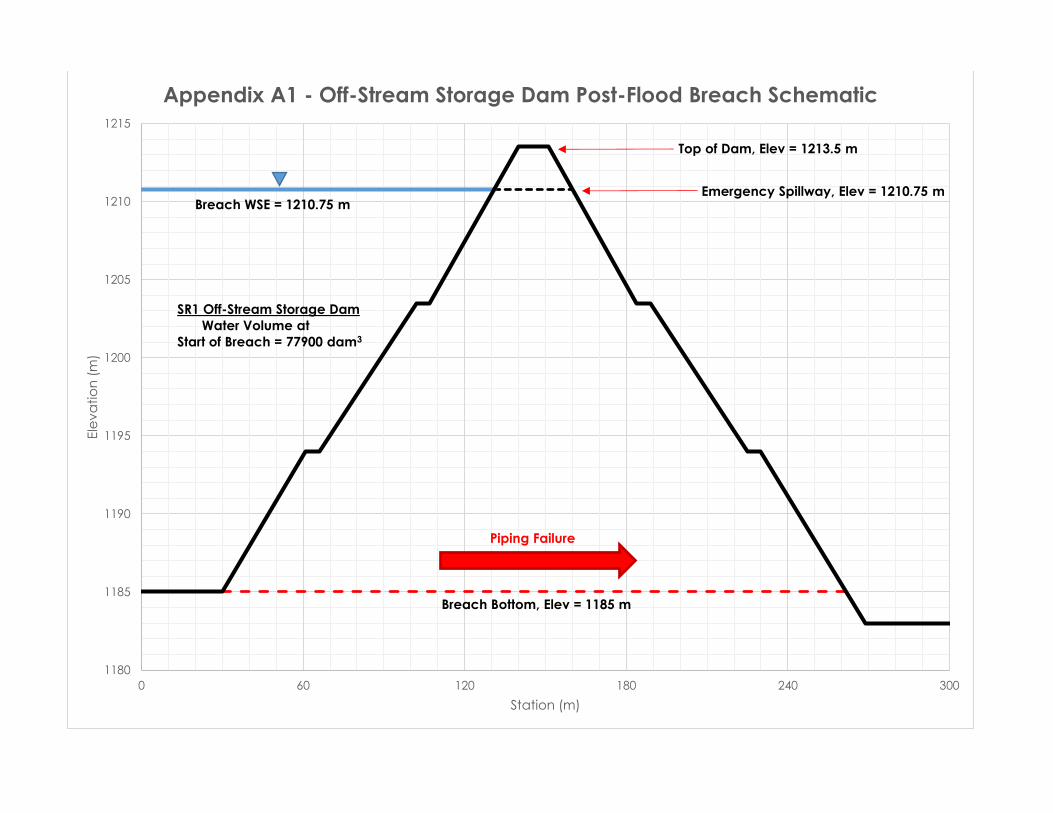
3.1.2 Post-Flood Failure Scenario of Off-Stream Storage Dam
The post-flood failure scenario assumes a failure of the Off-Stream Storage Dam after the IDF
event as the reservoir is being slowly drained. This scenario assumes a piping failure when SR1 is
filled to the emergency spillway at elevation 1210.75 m, representing conditions immediately
after a major flood event, but before significant volume can be released from SR1. The Elbow
River, Glenmore Reservoir, and Bow River are simulated with elevated flows, below the flood
damage threshold, to simulate conditions just after a major flood has occurred but before
significant storage has been recovered from Glenmore Reservoir. Appendix A1 presents a
schematic cross section detailing the assumed configuration of the Off-Stream Storage Dam for
the post-flood failure scenario.
3.1.3 Flood-Induced Failure Scenario of Diversion Structure
The flood-induced failure scenario assumes a failure of the Diversion Structure coincident with a
flood of magnitude greater than the dam can safely pass. The SR1 Diversion Structure has been
designed assuming a dam classification of “High” (Reference 1), however critical components
have been designed to safely pass the PMF event. This structure has been assessed in this
analysis using the PMF as the IDF as a conservative assumption. During this scenario, failure was

BREACH ANALYSIS AND INUNDATION MAPPING
Breach Analysis
March 8, 2017
dh u:\110773396\component_work\dams_diversion\hydrotechnical\analysis\breach_analysis\report\sr1_breach_analysis_report_revb_20170307.docx
3
.
5
assumed to occur in the Auxiliary Spillway by overtopping at the maximum head elevation of
1217.8 m during the PMF event. The Bow River is assumed to be at the 100-year flood flow.
Appendix A2 presents a schematic cross section detailing the assumed configuration of the
Diversion Structure for the post-flood failure scenario.
3.1.4 Post-Flood Failure Scenario of Diversion Structure
The post-flood failure scenario assumes a failure of the Diversion Structure after the IDF event.
The Diversion Structure does not function as a dam except during a flood event, so Stantec does
not consider this a valid failure scenario and no further analysis was performed to evaluate it.
3.1.5 Cascade Failure Potential
Glenmore Reservoir is located approximately 28 km downstream of the SR1 Off-Stream Storage
Dam. The Glenmore Reservoir facility is comprised of Glenmore Dam and the Southeast Dyke. A
failure of the SR1 Off-Stream Storage Dam would release 77,900 dam3 of water and has the
potential to cause a cascade failure at Glenmore Reservoir.
The Glenmore Reservoir Southeast Dyke is an earthen embankment approximately 1.4 km long
with a crest elevation of 1080.4 m and maximum height of approximately 8.4 m. An alternative
post-flood induced failure of the SR1 Off-Stream Storage Dam was considered where the
Southeast Dyke fails by overtopping when Glenmore Reservoir’s pool reaches elevation 1080.4
m.
The Glenmore Dam is a concrete gravity dam approximately 280 m long with a crest elevation
of 1079.92 m and maximum height of approximately 24 m. A detailed structural analysis would
be required to determine whether a cascade failure of Glenmore Dam is probable which is
outside the scope of this study. Therefore, a cascade failure of Glenmore Dam has not been
evaluated.
3.2 BREACH LOCATION
A single breach location was considered for the failure of the SR1 Off-Stream Storage Dam near
the outfall corresponding to the maximum dam height as shown in Appendix A3. The single
breach location is suitable to produce the greatest potential impact to downstream areas.
A single breach location was considered for the failure of the SR1 Diversion Structure in the
Auxiliary Spillway where it is expected to overtop as shown in Appendix A4. The single breach
location is suitable to produce the greatest potential impact to downstream areas.
3.3 BREACH HYDROGRAPH DEVELOPMENT
Breach hydrographs were developed using the “Dam Break” capabilities of the US Army Corps
of Engineers (USACE) Hydrologic Engineering Center Hydrologic Modeling System (HEC-HMS)

BREACH ANALYSIS AND INUNDATION MAPPING
Breach Analysis
March 8, 2017
dh u:\110773396\component_work\dams_diversion\hydrotechnical\analysis\breach_analysis\report\sr1_breach_analysis_report_revb_20170307.docx
3
.
6
software, Version 4.1 (Reference 12) for the Off-Stream Storage Dam. For the Diversion Structure
failure or cascade failures, the breach was simulated within the breach routing model using the
same “Dam Break” functions. The breach function requires the input of estimated dam breach
parameters and impounded volumes. Breach parameters for failures of the SR1 Off-Stream
Storage Dam and Glenmore Reservoir Southeast Dyke were estimated using empirical
equations. Since there is uncertainty in predicting dam breach parameters, Stantec used
several empirical equations and based final breach parameters on the average of the
estimates and engineering judgment (References 13 - 21).
Failure of concrete structures such as the SR1 Diversion Structure Auxilliary Spillway cannot be
evaluated using the same empirical equations. Breach parameters for this structure were
assumed based on engineering judgment to represent a nearly instantaneous failure of
approximately one third of the Auxiliary Spillway length.
Table 1 summarizes the breach parameters estimated for this analysis. These values are based
on the assumed failure conditions, height of breach, impoundment water volume above
breach, and width of the embankment. Bavg is the average width of a breach failure and tf is
the time for the breach to fully develop. The results of the empirical calculations that served as
the basis for the breach parameters estimation are included in Appendix A5-A6.
Table 1 – Summary of Estimated Dam Breach Parameters
SR1 Diversion
Structure Flood-
Induced Failure
Scenario
SR1 Off-Stream
Storage Dam Post-
Flood Failure
Scenario
Glenmore Reservoir
Southeast Dyke
Cascade Failure
Scenario
Range of Breach Width Estimates (m) n/a 49.9 – 119.3 14.7 – 124.5
Range of Failure Time Estimates (hrs) n/a 0.55 – 1.90 0.42 - 3.63
Bavg (m) 72.0 94.4 59.6
Tf (hours) 0.10 1.16 1.50
The IDF used in the flood-induced failure scenario was computed based on a calibrated HEC-
HMS model developed as part of the SR1 project and is documented in detail in the Stantec
report entitled “Springbank Off-Stream Reservoir Project: Probable Maximum Flood Analysis”
(Reference 22). For the flood-induced failure of the SR1 Diversion Structure Auxiliary Spillway, the
IDF is the PMF on the Elbow River with a peak discharge of 2770 cms and a total hydrograph
duration of 7 days. The IDF hydrograph is included as Appendix A7.
Routing of the IDF through the SR1 Off-Stream Storage Dam was not performed because a
flood-induced failure was not considered valid for that structure. For the post-flood failure
scenario of the Off-Stream Storage Dam, a starting pool elevation of 1210.75 m was selected
matching the the Emergency Spillway elevation. The stage-storage curve for the SR1 reservoir
was developed based on 2013 and 2015 LiDAR data and the SR1 design grading. The stage-
storage curve and resulting breach hydrograph is presented in Appendix A8-A9.

BREACH ANALYSIS AND INUNDATION MAPPING
Breach Analysis
March 8, 2017
dh u:\110773396\component_work\dams_diversion\hydrotechnical\analysis\breach_analysis\report\sr1_breach_analysis_report_revb_20170307.docx
3
.
7
3.4 HYDRAULIC MODEL DEVELOPMENT
For routing of the breach hydrograph and development of inundation mapping, Stantec used
the USACE Hydrologic Engineering Center River Analysis System (HEC-RAS) software, Version 5.0.3
(Reference 23). HEC-RAS is an unsteady, one-dimensional (1D) and two-dimensional (2D) flood
routing model. The breach routing model includes approximately 53 km of the Elbow River from
the confluence with the Bow River to approximately 1.2 km upstream of the SR1 Diversion
Structure. The model includes and approximately 49 km of the Bow River from approximately
Centre Street to just upstream of the confluence with Highwood River.
3.4.1 Model Geometry
The routing model geometry for the Elbow River downstream of Glenmore Dam and the Bow
River was based on the 2014 Golder Working Model provided by the City of Calgary (Reference
8). The Golder model is a calibrated steady flow model of the Elbow River and Bow River
designed to simulate up to the 2013 event. Stantec made modifications to the Golder
geometry to make it suitable for an unsteady simulation. These modifications primarily included
converting ineffective flow areas designed to simulate buildings to blocked obstructions,
eliminating unnecessary split flow reaches to improve unsteady model stability and adding 2D
flow areas representing floodplains in the City of Calgary downtown to allow for more accurate
simulation of overland flows.
Stantec revised and extended the Golder model upstream of Glenmore Reservoir to Highway 22
using 1m and 15m LiDAR data, 2013 Glenmore Reservoir bathymetric data, and structure
drawings / rating curves provided by the City of Calgary (References 3, 5, 6, 7, 9, 10, and 11).
The new cross sections have an average spacing of approximately 300 m. Manning’s roughness
values were selected based on land uses determined from aerial imagery and HEC-RAS
guidance as summarized in Table 2.
Table 2 – Summary of Land Use Types for Extended HEC-RAS Geometry
Land Use Type Manning’s Value, n
Woods 0.150
Grass 0.040
Channel 0.038
Brush 0.080
3.4.2 Boundary Conditions
The model uses a normal depth boundary condition at the downstream end of the Bow River
reach from the Golder model.

BREACH ANALYSIS AND INUNDATION MAPPING
Breach Analysis
March 8, 2017
dh u:\110773396\component_work\dams_diversion\hydrotechnical\analysis\breach_analysis\report\sr1_breach_analysis_report_revb_20170307.docx
3
.
8
The PMF event hydrograph is used as inflow at the upstream end of the Elbow River during the
flood-induced failure scenario. During the flood-induced failure scenario, the Bow River was
assumed to be at the 100-year discharge based on flood-frequency data from the Golder and
Associates Report entitled “Bow River and Elbow River Basins: Hydrology of 2013 Flood Event”
(Reference 24). The 100-year flows were distributed as constant flows along the Bow River based
on flow change locations in the original Golder Model.
Inflows at the upstream end of the Bow River and the Elbow River during the post-flood failure
scenario are assumed constant values based on flows observed during the 2013 flood event.
Table 3 summarizes the boundary conditions used in the model for each failure scenario.
To maintain stability of the post-flood failure routing model, a minimum flow of 400 m3/s was
assigned at the location of the breach hydrograph.
Table 3 – Summary of Boundary Conditions
Location Flood-Induced
Failure Scenario
Post-Flood Failure
Scenarios
Elbow River Upstream Inflow PMF Hydrograph 30 m3/s
Bow River Inflow Upstream of Elbow River 2020 m3/s 400 m3/s
Bow River Lateral Inflow at Fish Creek 500 m3/s n/a
Bow River Lateral Inflow at Fish Creek 80 m3/s n/a
Bow River Downstream Normal Depth 0.0022 m/m 0.0022 m/m
BREACH ANALYSIS AND INUNDATION MAPPING
Results and Inundation Mapping
March 8, 2017
dh u:\110773396\component_work\dams_diversion\hydrotechnical\analysis\breach_analysis\report\sr1_breach_analysis_report_revb_20170307.docx
4
.
9
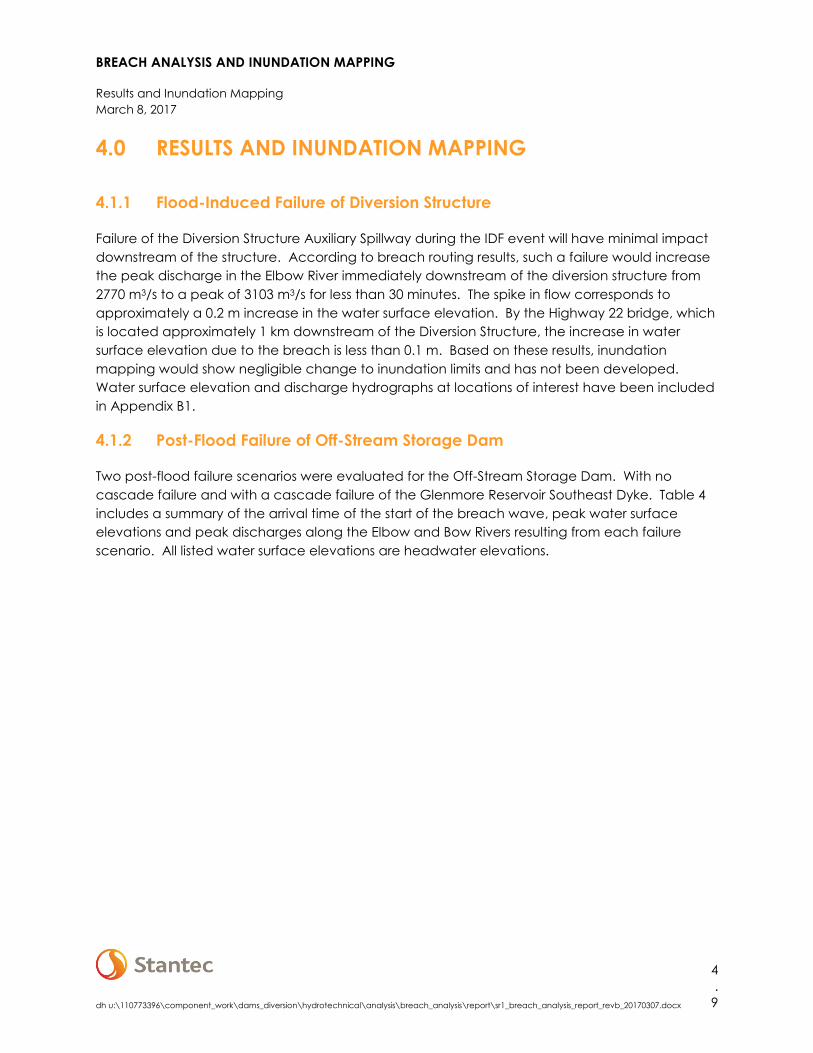
4.0 RESULTS AND INUNDATION MAPPING
4.1.1 Flood-Induced Failure of Diversion Structure
Failure of the Diversion Structure Auxiliary Spillway during the IDF event will have minimal impact
downstream of the structure. According to breach routing results, such a failure would increase
the peak discharge in the Elbow River immediately downstream of the diversion structure from
2770 m3/s to a peak of 3103 m3/s for less than 30 minutes. The spike in flow corresponds to
approximately a 0.2 m increase in the water surface elevation. By the Highway 22 bridge, which
is located approximately 1 km downstream of the Diversion Structure, the increase in water
surface elevation due to the breach is less than 0.1 m. Based on these results, inundation
mapping would show negligible change to inundation limits and has not been developed.
Water surface elevation and discharge hydrographs at locations of interest have been included
in Appendix B1.
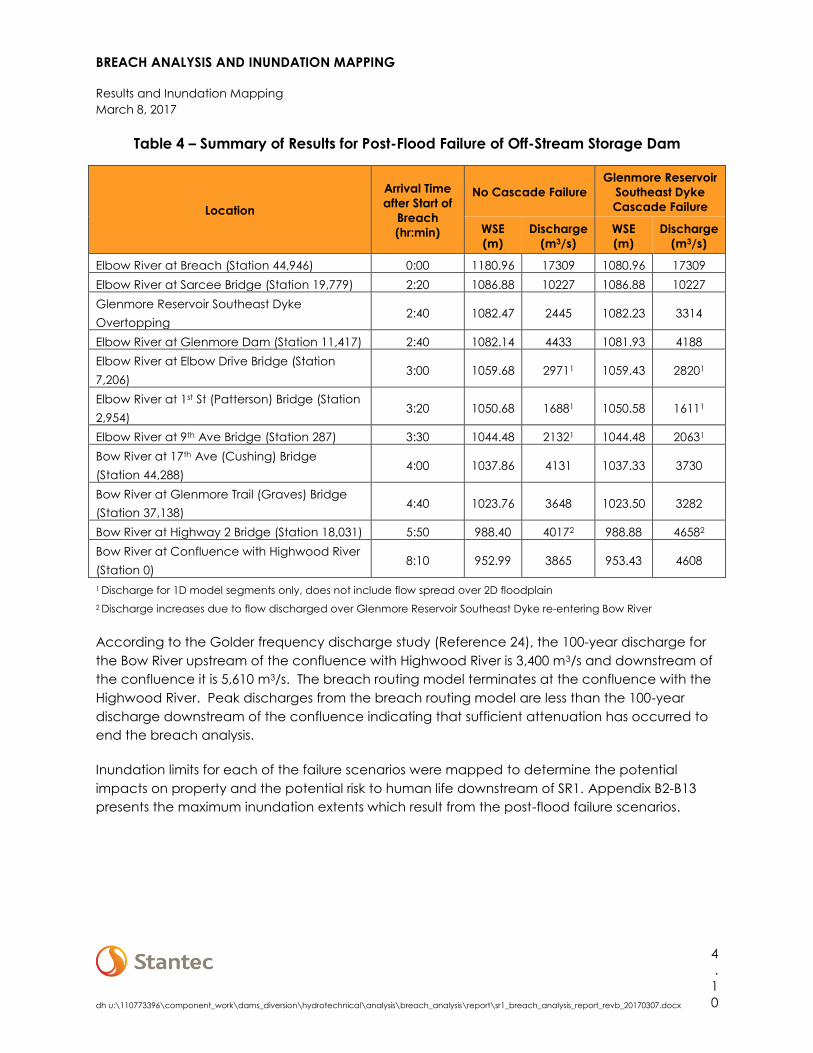
4.1.2 Post-Flood Failure of Off-Stream Storage Dam
Two post-flood failure scenarios were evaluated for the Off-Stream Storage Dam. With no
cascade failure and with a cascade failure of the Glenmore Reservoir Southeast Dyke. Table 4
includes a summary of the arrival time of the start of the breach wave, peak water surface
elevations and peak discharges along the Elbow and Bow Rivers resulting from each failure
scenario. All listed water surface elevations are headwater elevations.
BREACH ANALYSIS AND INUNDATION MAPPING
Results and Inundation Mapping
March 8, 2017
dh u:\110773396\component_work\dams_diversion\hydrotechnical\analysis\breach_analysis\report\sr1_breach_analysis_report_revb_20170307.docx
4
.
1
0
Table 4 – Summary of Results for Post-Flood Failure of Off-Stream Storage Dam
Location
Arrival Time
after Start of
Breach
(hr:min)
No Cascade Failure
Glenmore Reservoir
Southeast Dyke
Cascade Failure
WSE
(m)
Discharge
(m3/s)
WSE
(m)
Discharge
(m3/s)
Elbow River at Breach (Station 44,946) 0:00 1180.96 17309 1080.96 17309
Elbow River at Sarcee Bridge (Station 19,779) 2:20 1086.88 10227 1086.88 10227
Glenmore Reservoir Southeast Dyke
Overtopping 2:40 1082.47 2445 1082.23 3314
Elbow River at Glenmore Dam (Station 11,417) 2:40 1082.14 4433 1081.93 4188
Elbow River at Elbow Drive Bridge (Station
7,206) 3:00 1059.68 29711 1059.43 28201
Elbow River at 1st St (Patterson) Bridge (Station
2,954) 3:20 1050.68 16881 1050.58 16111
Elbow River at 9th Ave Bridge (Station 287) 3:30 1044.48 21321 1044.48 20631
Bow River at 17th Ave (Cushing) Bridge
(Station 44,288) 4:00 1037.86 4131 1037.33 3730
Bow River at Glenmore Trail (Graves) Bridge
(Station 37,138) 4:40 1023.76 3648 1023.50 3282
Bow River at Highway 2 Bridge (Station 18,031) 5:50 988.40 40172 988.88 46582
Bow River at Confluence with Highwood River
(Station 0) 8:10 952.99 3865 953.43 4608
1 Discharge for 1D model segments only, does not include flow spread over 2D floodplain
2 Discharge increases due to flow discharged over Glenmore Reservoir Southeast Dyke re-entering Bow River
According to the Golder frequency discharge study (Reference 24), the 100-year discharge for
the Bow River upstream of the confluence with Highwood River is 3,400 m3/s and downstream of
the confluence it is 5,610 m3/s. The breach routing model terminates at the confluence with the
Highwood River. Peak discharges from the breach routing model are less than the 100-year
discharge downstream of the confluence indicating that sufficient attenuation has occurred to
end the breach analysis.
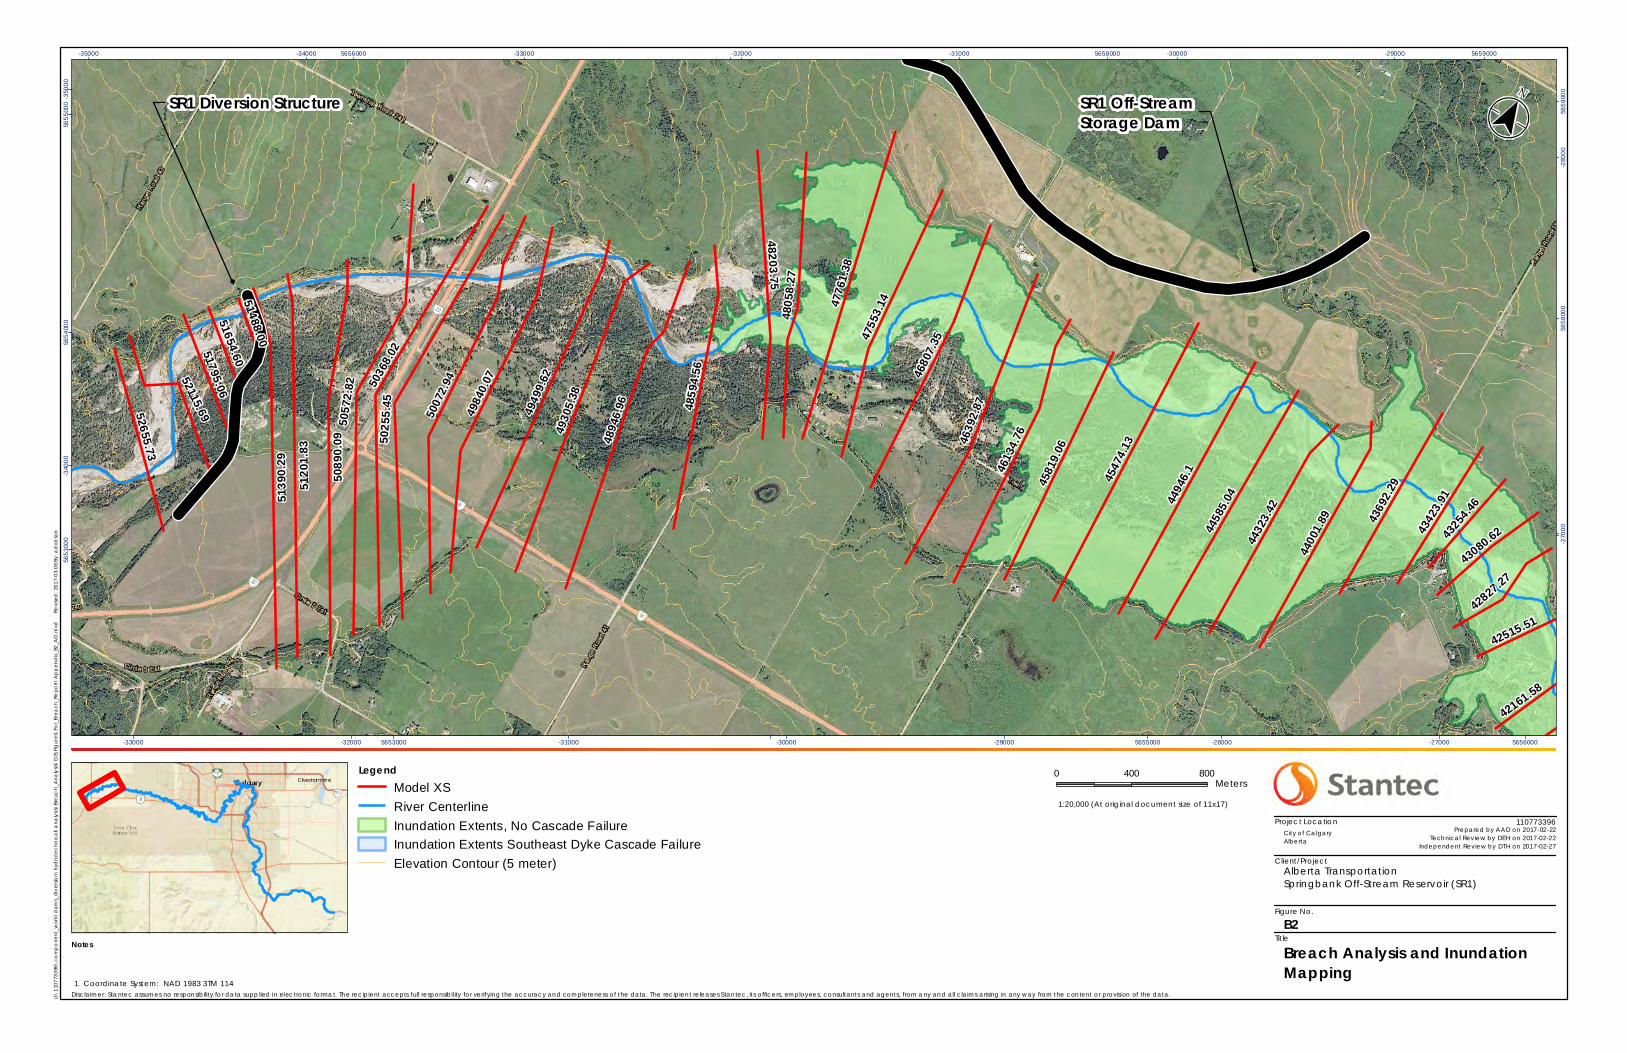
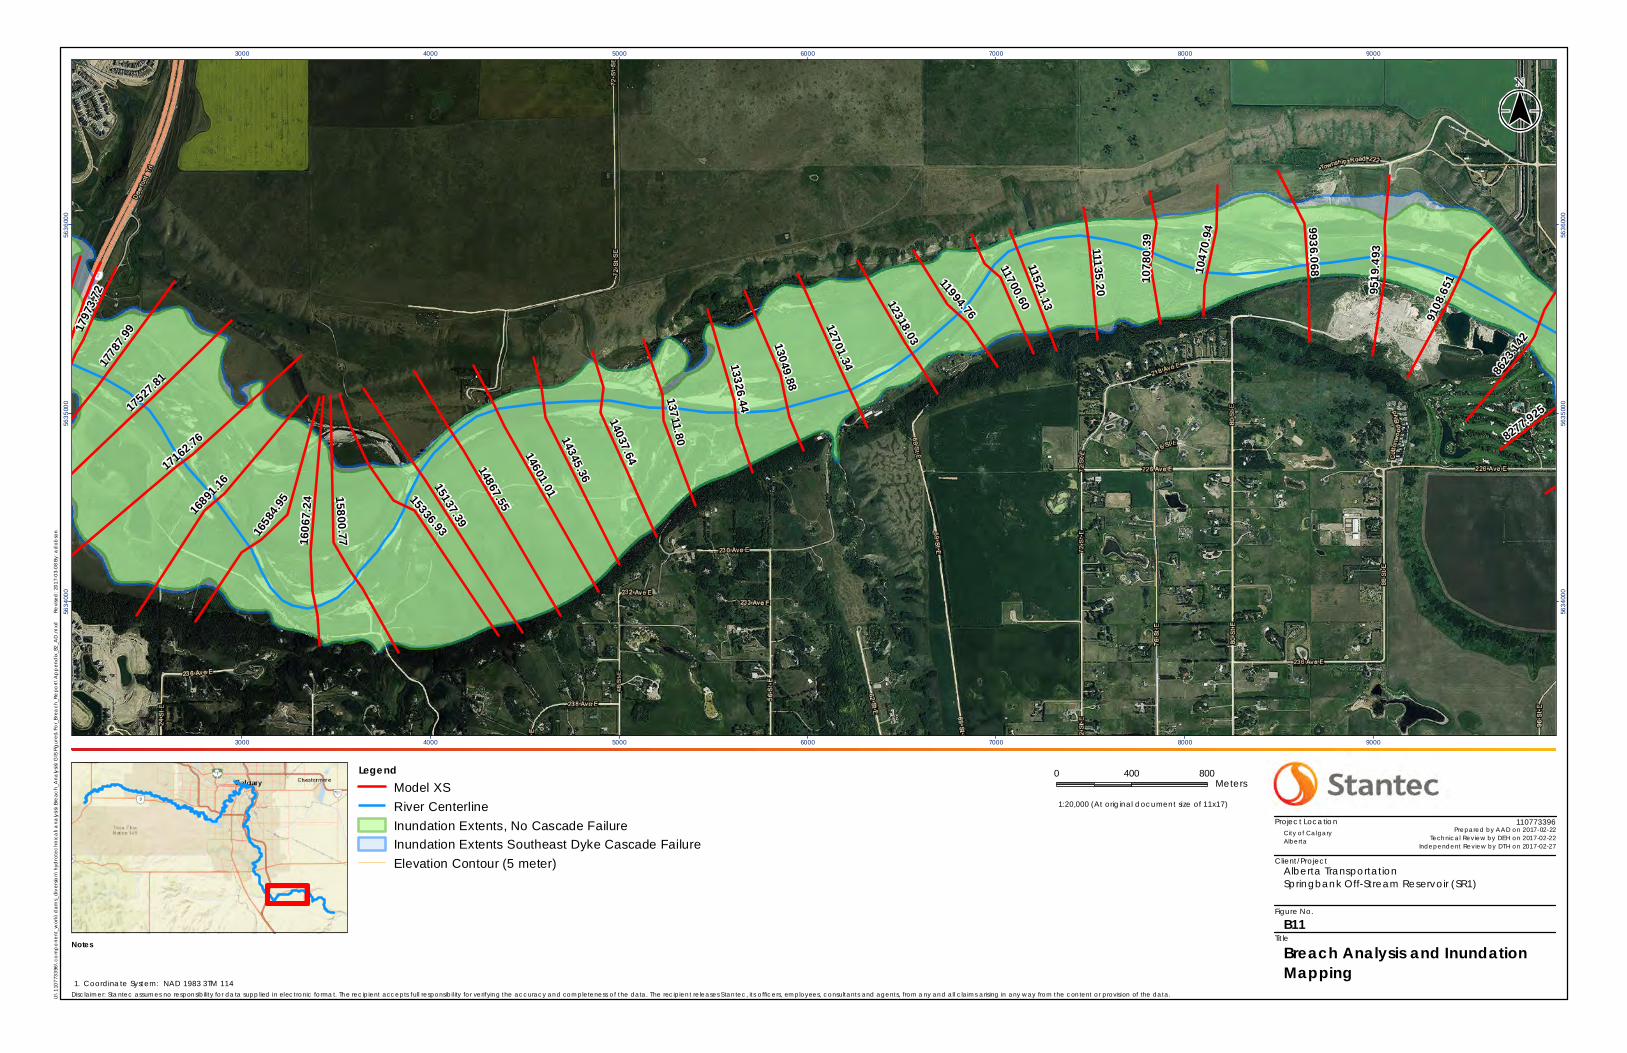
Inundation limits for each of the failure scenarios were mapped to determine the potential
impacts on property and the potential risk to human life downstream of SR1. Appendix B2-B13
presents the maximum inundation extents which result from the post-flood failure scenarios.

BREACH ANALYSIS AND INUNDATION MAPPING
References
March 8, 2017
dh u:\110773396\component_work\dams_diversion\hydrotechnical\analysis\breach_analysis\report\sr1_breach_analysis_report_revb_20170307.docx
5
.
1
1
5.0 REFERENCES
1. Canadian Dam Association. (2007). Dam Safety Guidelines.
2. Amec. (2013). 30 cm Resolution Orthophotography flown in October 2013 by Valtus Imagery Services.
Provided to Stantec at in August 2014 by Alberta Transportation.
3. Amec. (2013). 1M LiDAR Topographic Data Flown in September, 2013. Provided to Stantec in August
2014 by Alberta Transportation.
4. Government of Alberta. (2014). Orthophotography of Elbow River Area, Post-2013 Flood Event.
Provided to Stantec in October 2014 by Alberta Transportation.
5. AltaLIS. (2013). AltaLIS LiDAR15 DEM 15M LiDAR with 2013 Vintage in Study Area.
6. Tarin Resource Services. (2015). 0.5M LiDAR Flown in November 2015.
7. Challenger Geomatics Ltd. (2013). Calgary Glenmore Reservoir Bathymetric Survey, September, 2013.
Prepared for Klohn Crippen Berger Ltd, October, 2013.
8. Golder and Associates Ltd. (2014). Bow and Elbow River Working Hydraulic Model (HEC-RAS format).
Provided to Stantec by City of Calgary in November 2014.
9. Alberta Transportation. (2014). Elbow River Bridge on HWY 8, Near Calgary, Flood Repair, Drawing
41174-P.
10. Alberta Transportation. (1986). Elbow River Bridge 17 km South of Cochrane General Layout, Drawing
11622-C.
11. City of Calgary. Glenmore Spillway Curves (Microsoft Excel format). Provided to Stantec by City of
Calgary in October 2014.
12. US Army Corps of Engineers. (2015). Hydrologic Modeling System (HEC-HMS), Version 4.1. Hydrologic
Engineering Center, Davis, California.
13. Johnson, F.A and Illes, P. (1976). “A Classification of Dam Failures.” Water Power Dam Construction, 28,
43-45.
14. Singh, Krishan P. and Snorrason, A. (1982). SWS Contract Report 288: Sensitivity of Outflow Peaks and
Flood Stages to the Selection of Dam Breach Parameters and Simulation Models. Illinois Department of
Energy and Natural Resources, State Water Survey Division.
15. Singh, Krishan P. and Snorrason, A. (1984). “Sensitivity of Outflow Peaks and Flood Stages to the
Selection of Dam Breach Parameters and Simulation Models.” Journal of Hydrology, 68, 295-310.
16. MacDonald, T. C., and Langridge-Monopolis, J. (1984). “Breaching Characteristics of Dam Failures.”
Journal of Hydraulic Engineering, 110 (5), 567-586.
17. Federal Energy Regulatory Commission (FERC). (1987). FERC 0119-1: Engineering Guidelines for the
Evaluation of Hydropower Projects. Office of Hydropower Licensing.
18. Froehlich, D. C. (1987). “Embankment Dam Breach Parameters.” Proceedings of the 1987 National
Conference on Hydraulic Engineering, ASCE, Williamsburg Virginia, 570-575.
19. US Bureau of Reclamation (USBR). (1988). ACER Technical Memorandum No. 11: Downstream Hazard
Classification Guidelines. Assistant Commissioner-Engineering and Research, Denver, Colorado, 57.
20. Von Thun, Lawrence J. and D. R. Gillette. (1990). Guidance on Breach Parameters, unpublished internal
document, USBR, Denver, Colorado, 17. (Referenced in Wahl 1998).
21. Froehlich, D. C. (1995). “Embankment Dam Breach Parameters Revisited.” Proceedings of the 1995
ASCE Conference on Water Resources Engineering, ASCE, San Antonio, Texas, 887-891.
22. Stantec Consulting Ltd. (2015). Spring Bank Off-Stream Reservoir Project: Probable Maximum Flood
Analysis. August 2015 Draft.
23. US Army Corps of Engineers. (2016). River Analysis System (HEC-RAS), Version 5.0.3. Hydrologic
Engineering Center, Davis, California.
24. Golder and Associates. (2016). Bow River and Elbow River Basins: Hydrology of 2013 Flood Event,
Report Number 13-1326-0054.9000. Prepared for City of Calgary, February 2016.

APPENDIX A – HYDROLOGIC AND
BREACH DATA
1180
1185
1190
1195
1200
1205
1210
1215
0 60 120 180 240 300
Ele
va
tio
n (
m)
Station (m)
Appendix A1 - Off-Stream Storage Dam Post-Flood Breach Schematic
Top of Dam, Elev = 1213.5 m
Emergency Spillway, Elev = 1210.75 mBreach WSE = 1210.75 m
SR1 Off-Stream Storage Dam
Water Volume at
Start of Breach = 77900 dam3
Breach Bottom, Elev = 1185 m
Piping Failure

1211
1212
1213
1214
1215
1216
1217
1218
1219
0 10 20 30 40 50 60 70 80 90 100
Ele
va
tio
n (
m)
Station (m)
Appendix A2 - Diversion Structure Flood-Induced Breach Schematic
Top of Adjacent Floodplain Berm, Elev = 1218.3 m
RCC Auxiliary Spillway Crest, Elev = 1215.8 m
Breach WSE = 1217.8 m
Breach Bottom, Elev = 1212.5 m
Overtopping Failure

1069
1071
1073
1075
1077
1079
1081
1083
0 20 40 60 80 100 120
Ele
va
tio
n (
m)
Station (m)
Appendix A3 - Southeast Dyke Post-Flood Cascade Breach Schematic
SE Dyke Crest Elevation, Elev = 1080.4 mBreach WSE = 1080.4 m
Breach Bottom, Elev = 1072.0 m
Overtopping Failure
Glenmore Reservoir

Appendix A4 – Off-Stream Storage Dam Breach Location
Simulated Off-Stream Storage
Dam Breach Location

Appendix A5 – Diversion Structure Breach Location
Simulated Diversion
Structure Breach Location

Appendix A6 - Dam Breach Parameter EstimationEarthen Embankment Breach Parameter Comparative Spreadsheet
Project Data:
Dam: SR1 Off-Stream Storage Dam, Preliminary Design
Location: City of Calgary, Alberta, Canada
Notes: Post-flood breach scenario
Inputs:
Data Convention:
Height of dam hd 93.5 feet 28.5 meters User Input Data
Height of breach hb 93.5 feet 28.5 meters
Height/depth of water at breach hw 84.5 feet 25.8 meters
Storage S 63172.0 ac-feet 77921514.6 m3 Calculated value.
Volume of water at breach Vw 63172.0 ac-feet 77921514.6 m3
Width of dam at base Wbase 765.0 feet 233.2 meters
Width of dam at crest Wcrest 33.0 feet 10.1 meters
Estimated breach side slope Z 1.0 1.0
Baseflow Qbase 0.0 ft3/s 0.00 m3/s
Type of Failure Piping
Dam has core wall? Yes
Erosion resistant embankment? Yes
Average of Calculated Values:
Breach width BAVG 309.6 feet 94.4 meters
Breach bottom width BW 232.4 feet 70.8 meters
Breach formation time tf 1.2 hours 1.16 hours
Peak discharge Qp 510,141 ft3/s 14446.1 m3/s
Breach side slope Z 0.83 0.83
Volume of embankment eroded Ver 11560327.9 ft3 327364.0 m3
Volume of water discharged Vo,Vout 63172.00 ac-feet 77921514.6 m3
Source Equation B B Z Ver Ko Kc Cb
(m) (ft) (m3) (m)
1 - Johnson and Illes 1976 49.9 163.6
2 - Singh and Snorrason 1982, 1984 99.8 327.3
3 - MacDonald and Langridge-Monopolis 1984 107.2 351.7 371787.0
4 - MacDonald and Langridge-Monopolis 1984 0.500
5 - FERC 1987 85.5 280.5
6 - FERC 1987 0.625
7 - Froehlich 1987 102.0 334.7 1.0
8 - Froehlich 1987 1.107 121.6 0.6
9 - USBR 1988 77.3 253.4
10 - Von Thun and Gillette 1990 1.000
11 - Von Thun and Gillette 1990 119.3 391.3 54.9
12 - Froehlich 1995 114.2 374.7 1.0
13 - Froehlich 1995 0.900
Default
calculation, user
can change.
English Units SI Units
Estimates of Breach Width & Dimensions
𝑊
U:\110773396\component_work\dams_diversion\hydrotechnical\analysis\Breach_Analysis\Report\Appendixes\Appendix_A\A5_SR1_Breach_Parameters.xlsx Page 1 of 3

Appendix A6 - Dam Breach Parameter EstimationEarthen Embankment Breach Parameter Comparative Spreadsheet
Project Data:
Dam: SR1 Off-Stream Storage Dam, Preliminary Design
Location: City of Calgary, Alberta, Canada
Notes: Post-flood breach scenario
Inputs:
Data Convention:
Height of dam hd 93.5 feet 28.5 meters User Input Data
Height of breach hb 93.5 feet 28.5 meters
Height/depth of water at breach hw 84.5 feet 25.8 meters
Storage S 63172.0 ac-feet 77921514.6 m3 Calculated value.
Volume of water at breach Vw 63172.0 ac-feet 77921514.6 m3
Width of dam at base Wbase 765.0 feet 233.2 meters
Width of dam at crest Wcrest 33.0 feet 10.1 meters
Estimated breach side slope Z 1.0 1.0
Baseflow Qbase 0.0 ft3/s 0.00 m3/s
Type of Failure Piping
Dam has core wall? Yes
Erosion resistant embankment? Yes
Average of Calculated Values:
Breach width BAVG 309.6 feet 94.4 meters
Breach bottom width BW 232.4 feet 70.8 meters
Breach formation time tf 1.2 hours 1.16 hours
Peak discharge Qp 510,141 ft3/s 14446.1 m3/s
Breach side slope Z 0.83 0.83
Volume of embankment eroded Ver 11560327.9 ft3 327364.0 m3
Volume of water discharged Vo,Vout 63172.00 ac-feet 77921514.6 m3
Default
calculation, user
can change.
English Units SI Units
Source Equation tf
(hours)
14 - Singh and Snorrason 1982, 1984 0.625
15 - MacDonald and Langridge-Monopolis 1984 1.821
16 - FERC 1987 0.550
17 - Froehlich 1987 1.701
18 - USBR 1988 1.038
19 - Von Thun and Gillette 1990 0.765
20 - Von Thun and Gillette 1990 0.916
21 - Von Thun and Gillette 1990
22 - Von Thun and Gillette 1990
23 - Froehlich 1995 1.897
Estimates of Failure Time
U:\110773396\component_work\dams_diversion\hydrotechnical\analysis\Breach_Analysis\Report\Appendixes\Appendix_A\A5_SR1_Breach_Parameters.xlsx Page 2 of 3
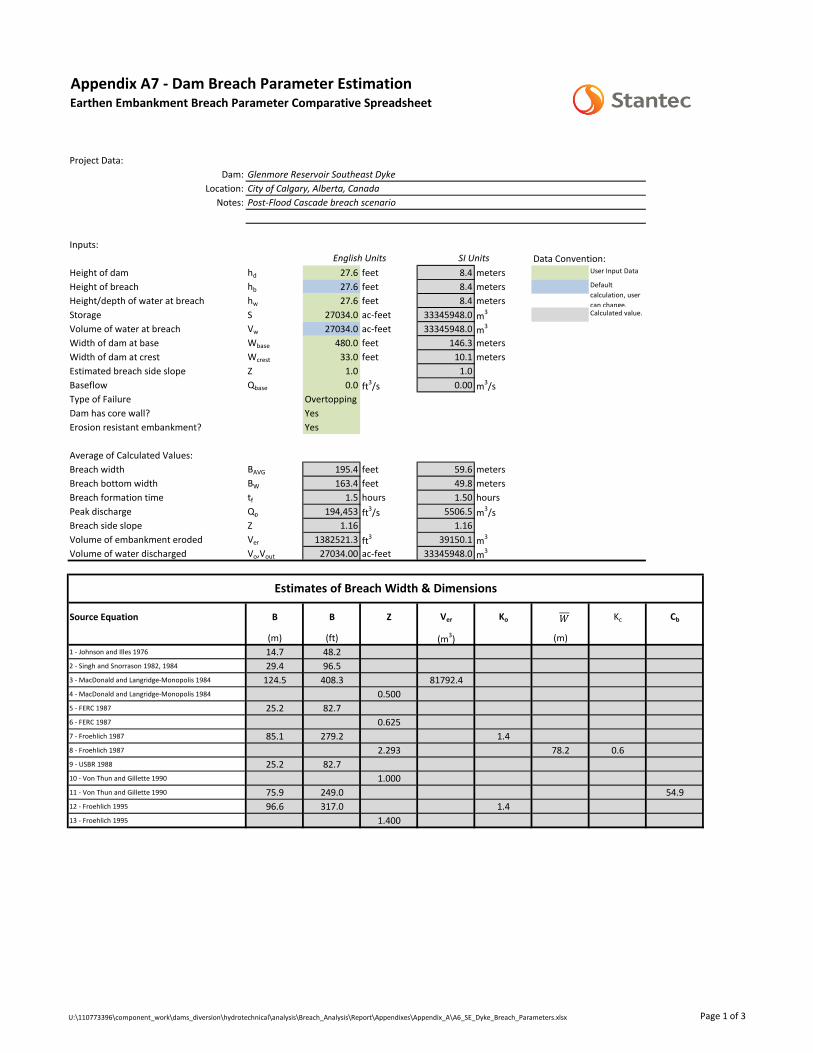
Appendix A7 - Dam Breach Parameter EstimationEarthen Embankment Breach Parameter Comparative Spreadsheet
Project Data:
Dam: Glenmore Reservoir Southeast Dyke
Location: City of Calgary, Alberta, Canada
Notes: Post-Flood Cascade breach scenario
Inputs:
Data Convention:
Height of dam hd 27.6 feet 8.4 meters User Input Data
Height of breach hb 27.6 feet 8.4 meters
Height/depth of water at breach hw 27.6 feet 8.4 meters
Storage S 27034.0 ac-feet 33345948.0 m3 Calculated value.
Volume of water at breach Vw 27034.0 ac-feet 33345948.0 m3
Width of dam at base Wbase 480.0 feet 146.3 meters
Width of dam at crest Wcrest 33.0 feet 10.1 meters
Estimated breach side slope Z 1.0 1.0
Baseflow Qbase 0.0 ft3/s 0.00 m3/s
Type of Failure Overtopping
Dam has core wall? Yes
Erosion resistant embankment? Yes
Average of Calculated Values:
Breach width BAVG 195.4 feet 59.6 meters
Breach bottom width BW 163.4 feet 49.8 meters
Breach formation time tf 1.5 hours 1.50 hours
Peak discharge Qp 194,453 ft3/s 5506.5 m3/s
Breach side slope Z 1.16 1.16
Volume of embankment eroded Ver 1382521.3 ft3 39150.1 m3
Volume of water discharged Vo,Vout 27034.00 ac-feet 33345948.0 m3
Source Equation B B Z Ver Ko Kc Cb
(m) (ft) (m3) (m)
1 - Johnson and Illes 1976 14.7 48.2
2 - Singh and Snorrason 1982, 1984 29.4 96.5
3 - MacDonald and Langridge-Monopolis 1984 124.5 408.3 81792.4
4 - MacDonald and Langridge-Monopolis 1984 0.500
5 - FERC 1987 25.2 82.7
6 - FERC 1987 0.625
7 - Froehlich 1987 85.1 279.2 1.4
8 - Froehlich 1987 2.293 78.2 0.6
9 - USBR 1988 25.2 82.7
10 - Von Thun and Gillette 1990 1.000
11 - Von Thun and Gillette 1990 75.9 249.0 54.9
12 - Froehlich 1995 96.6 317.0 1.4
13 - Froehlich 1995 1.400
Default
calculation, user
can change.
English Units SI Units
Estimates of Breach Width & Dimensions
𝑊
U:\110773396\component_work\dams_diversion\hydrotechnical\analysis\Breach_Analysis\Report\Appendixes\Appendix_A\A6_SE_Dyke_Breach_Parameters.xlsx Page 1 of 3

Appendix A7 - Dam Breach Parameter EstimationEarthen Embankment Breach Parameter Comparative Spreadsheet
Project Data:
Dam: Glenmore Reservoir Southeast Dyke
Location: City of Calgary, Alberta, Canada
Notes: Post-Flood Cascade breach scenario
Inputs:
Data Convention:
Height of dam hd 27.6 feet 8.4 meters User Input Data
Height of breach hb 27.6 feet 8.4 meters
Height/depth of water at breach hw 27.6 feet 8.4 meters
Storage S 27034.0 ac-feet 33345948.0 m3 Calculated value.
Volume of water at breach Vw 27034.0 ac-feet 33345948.0 m3
Width of dam at base Wbase 480.0 feet 146.3 meters
Width of dam at crest Wcrest 33.0 feet 10.1 meters
Estimated breach side slope Z 1.0 1.0
Baseflow Qbase 0.0 ft3/s 0.00 m3/s
Type of Failure Overtopping
Dam has core wall? Yes
Erosion resistant embankment? Yes
Average of Calculated Values:
Breach width BAVG 195.4 feet 59.6 meters
Breach bottom width BW 163.4 feet 49.8 meters
Breach formation time tf 1.5 hours 1.50 hours
Peak discharge Qp 194,453 ft3/s 5506.5 m3/s
Breach side slope Z 1.16 1.16
Volume of embankment eroded Ver 1382521.3 ft3 39150.1 m3
Volume of water discharged Vo,Vout 27034.00 ac-feet 33345948.0 m3
Default
calculation, user
can change.
English Units SI Units
Source Equation tf
(hours)
14 - Singh and Snorrason 1982, 1984 0.625
15 - MacDonald and Langridge-Monopolis 1984 0.841
16 - FERC 1987 0.550
17 - Froehlich 1987 3.470
18 - USBR 1988 0.655
19 - Von Thun and Gillette 1990 0.418
20 - Von Thun and Gillette 1990 1.773
21 - Von Thun and Gillette 1990
22 - Von Thun and Gillette 1990
23 - Froehlich 1995 3.632
Estimates of Failure Time
U:\110773396\component_work\dams_diversion\hydrotechnical\analysis\Breach_Analysis\Report\Appendixes\Appendix_A\A6_SE_Dyke_Breach_Parameters.xlsx Page 2 of 3

0
500
1000
1500
2000
2500
3000
0 24 48 72 96 120 144 168
Dis
ch
arg
e (
m3/s
)
Time (hrs)
Appendix A8 - PMF Hydrograph Developed by Stantec

Appendix A9 - Off-Stream Storage Dam Stage-Storage CurveDeveloped for Preliminary Design
Elevation (m) Volume (dam3)
1185.0 0
1187.5 11
1190.0 104
1192.5 778
1195.0 3994
1197.5 9515
1200.0 17337
1201.0 21175
1202.0 25411
1203.0 30008
1204.0 34957
1205.0 40271
1206.0 45953
1207.0 51999
1208.0 58397
1209.0 65164
1210.0 72292
1211.0 79799
1212.0 87684
1213.0 95952
1214.0 104596
1215.0 113586
1185
1190
1195
1200
1205
1210
1215
0 20000 40000 60000 80000 100000 120000
Ele
va
tio
n (
m)
Volume (dam3)
Dam Crest,
Elev 1213.5 m
EM Spillway,
Elev 1210.75 m

0
5000
10000
15000
20000
25000
0 60 120 180 240 300
Dis
ch
arg
e (
m3/s
)
Simulation Time (min)
Appendix A10 - Off-Stream Storage Dam Breach Hydrograph from HEC-HMS
Peak Discharge = 19793 m3/s
42 minutes after start of breach
Beginning of breach
Dip in hydrograph caused by
transition from orifice to weir flow

APPENDIX B – BREACH ROUTING RESULTS

1206
1208
1210
1212
1214
1216
1218
1220
0
500
1,000
1,500
2,000
2,500
3,000
3,500
0 4 8 12 16 20 24 28 32 36
Ele
va
tio
n (
m)
Dis
ch
arg
e (
m3/s
)
Simulation Time (hrs)
Appendix B1 - Diversion Structure Flood-Induced Breach Hydrograph Routing
Discharge Downstream of Auxiliary Spillway
Discharge at Hwy 22 Bridge
Stage Downstream of Auxiliary Spillway
Headwater at Hwy 22 Bridge
Flow Spike Caused by Breach of SR1
Diversion Structure Auxiliary Spillway
Increase in Flood Stage Caused
by Breach of SR1 Diversion
Structure Auxiliary Spillway
Project Location
Client/Project
Figure No.
Title
51488.00
42161.58
51654.60
42515.51
43254.
46
42827.2743080.62
51795.06434
23.91
52115.6952655.73
4369
2.29
4432
3.42
4581
9.06
4400
1.89
4755
3.14
4494
6.1
4805
8.27
4458
5.04
4859
4.56
48203.75
4680
7.35
4613
4.76
4547
4.1346
392.8
7
4776
1.38
4949
9.62
4930
5.38
4894
6.96
4984
0.07
5120
1.83
5139
0.29
5089
0.09
5007
2.94
5025
5.45
50368
.02
5057
2.82
-35000-35
000
-34000-34
000
-33000
-33000
-32000
-32000
-31000
-31000
-30000
-30000
-29000
-29000 -28000
-2800
0
-27000
-2700
0
5653
000
5653000
5654
000
5655
000
5655000
5656000
5656000
5658000
5658
000
5659000
5659
000
Breach Analysis and Inundation Mapping
B2
Alberta TransportationSpringbank Off-Stream Reservoir (SR1)
Notes
1. Coordinate System: NAD 1983 3TM 114
0 400 800Meters
LegendModel XS
River Centerline
Inundation Extents, No Cascade Failure
Inundation Extents Southeast Dyke Cascade Failure
Elevation Contour (5 meter)
U:\11
0773
396\
comp
onen
t_wor
k\da
ms_
diver
sion\
hydr
otec
hnica
l\ana
lysis\
Breac
h_An
alysis
\GIS
Figur
es\F
or_B
reac
h_Re
port\
Appe
ndix_
B2_A
D.m
xd
Rev
ised:
2017
-03-0
8 By:
adob
son
($$¯
1:20,000 (At original document size of 11x17)110773396
Disclaimer: Stantec assumes no responsibility for data supplied in electronic format. The recipient accepts full responsibil ity for verifying the accuracy and completeness of the data. The recipient releases Stantec, its officers, employees, consultants and agents, from any and all claims arising in any way from the content or provision of the data.
City of CalgaryAlberta
Prepared by AAD on 2017-02-22Technical Review by DEH on 2017-02-22
Independent Review by DTH on 2017-02-27
SR1 Diversion Structure SR1 Off-StreamStorage Dam

Project Location
Client/Project
Figure No.
Title
3317
8.05
42515
.514282
7.27
4216
1.58
4195
7.66
3851
8.42
3715
0.25
4162
1.57
3754
6.24
38722.
08
3814
5.23
3791
2.56
39073
.38
4126
1.23
3679
8.06
4098
1.74
3972
7.5
3639
6.67
3601
5.07
4047
6.69
4029
3.61
39458.
51
3537
3.46
3516
9.38
3429
2.85
3383
6.05
4008
3.15
3578
6.25
3358
4.13408
5.45
3491
0.23
3455
4.58
-27000
-27000
-26000
-26000
-25000
-25000
-24000
-24000
-23000
-23000
-22000
-22000
-21000
-21000
-20000
-20000
5654
000
5654
000
5655
000
5655
000
5656
000
5656
000
5657
000
5657
000
Breach Analysis and Inundation Mapping
B3
Alberta TransportationSpringbank Off-Stream Reservoir (SR1)
Notes
1. Coordinate System: NAD 1983 3TM 114
0 400 800Meters
LegendModel XS
River Centerline
Inundation Extents, No Cascade Failure
Inundation Extents Southeast Dyke Cascade Failure
Elevation Contour (5 meter)
U:\11
0773
396\
comp
onen
t_wor
k\da
ms_
diver
sion\
hydr
otec
hnica
l\ana
lysis\
Breac
h_An
alysis
\GIS
Figur
es\F
or_B
reac
h_Re
port\
Appe
ndix_
B2_A
D.m
xd
Rev
ised:
2017
-03-0
8 By:
adob
son
($$¯
1:20,000 (At original document size of 11x17)110773396
Disclaimer: Stantec assumes no responsibility for data supplied in electronic format. The recipient accepts full responsibil ity for verifying the accuracy and completeness of the data. The recipient releases Stantec, its officers, employees, consultants and agents, from any and all claims arising in any way from the content or provision of the data.
City of CalgaryAlberta
Prepared by AAD on 2017-02-22Technical Review by DEH on 2017-02-22
Independent Review by DTH on 2017-02-27

Project Location
Client/Project
Figure No.
Title
2998
1.25
2967
4.7
3025
0.02
24583.52
2960
5.6
35786.25
3052
8.5733178.05
33001.82
31168.38
35373.46
30881.4
25996.79
35169.38
25174.94
26460.34
32742.86
34292.85
33836.05
26806.44
33584.1
27212.37
28109.28
32591.95
27044.95
2946
5.31
29218.8
34085.45
28382.52
34910.23
28983.98
34554.58
28796.69
31426.04
31874.53
32234.67
-2100
0
-21000
-2000
0
-20000
-19000
-19000
-18000
-18000
-17000
-17000
-16000
-16000
-15000
-15000
-14000
-1400
056
5100
0
56520005653000
5653
000
5654000
565500056
5500
05656000
5656
000
565700056
5700
0
Breach Analysis and Inundation Mapping
B4
Alberta TransportationSpringbank Off-Stream Reservoir (SR1)
Notes
1. Coordinate System: NAD 1983 3TM 114
0 400 800Meters
LegendModel XS
River Centerline
Inundation Extents, No Cascade Failure
Inundation Extents Southeast Dyke Cascade Failure
Elevation Contour (5 meter)
U:\11
0773
396\
comp
onen
t_wor
k\da
ms_
diver
sion\
hydr
otec
hnica
l\ana
lysis\
Breac
h_An
alysis
\GIS
Figur
es\F
or_B
reac
h_Re
port\
Appe
ndix_
B2_A
D.m
xd
Rev
ised:
2017
-03-0
8 By:
adob
son
($
$ ¯
1:20,000 (At original document size of 11x17)110773396
Disclaimer: Stantec assumes no responsibility for data supplied in electronic format. The recipient accepts full responsibil ity for verifying the accuracy and completeness of the data. The recipient releases Stantec, its officers, employees, consultants and agents, from any and all claims arising in any way from the content or provision of the data.
City of CalgaryAlberta
Prepared by AAD on 2017-02-22Technical Review by DEH on 2017-02-22
Independent Review by DTH on 2017-02-27

Project Location
Client/Project
Figure No.
Title
26806.44
13292.31
13546.68
13787.54
13965.7913899.98
14270.05
14142.09
1578
7.08
1589
9.43
1606
0.0619989.84
1537
8.37
1564
1.45
1617
6.43
1551
3.18 14925.88
15096.111524
8.93
2122
2.71 16
323.5
5
14480.64
14624.09
14762.521759
3.67
20348.99
1736
1.58
1733
9.86
17805.42
21959.45
1719
1.45 170
04.62
16543.27
18840.2125996.79
22966.88
25174.94
24583.52
26460.34
23472.8
24294.64
18067.6623835.88
19796.12 19760.97-1500
0
-15000
-14000
-14000
-13000
-13000
-12000
-12000
-11000
-11000
-10000
-10000
-9000
-9000
-8000
-8000
5648000
5648
000
56490005650000
5650
000
565100056
5100
05652000
5652
000
565300056
5300
056
5400
0
Breach Analysis and Inundation Mapping
B5
Alberta TransportationSpringbank Off-Stream Reservoir (SR1)
Notes
1. Coordinate System: NAD 1983 3TM 114
0 400 800Meters
LegendModel XS
River Centerline
Inundation Extents, No Cascade Failure
Inundation Extents Southeast Dyke Cascade Failure
Elevation Contour (5 meter)
U:\11
0773
396\
comp
onen
t_wor
k\da
ms_
diver
sion\
hydr
otec
hnica
l\ana
lysis\
Breac
h_An
alysis
\GIS
Figur
es\F
or_B
reac
h_Re
port\
Appe
ndix_
B2_A
D.m
xd
Rev
ised:
2017
-03-0
8 By:
adob
son
($
$ ¯
1:20,000 (At original document size of 11x17)110773396
Disclaimer: Stantec assumes no responsibility for data supplied in electronic format. The recipient accepts full responsibil ity for verifying the accuracy and completeness of the data. The recipient releases Stantec, its officers, employees, consultants and agents, from any and all claims arising in any way from the content or provision of the data.
City of CalgaryAlberta
Prepared by AAD on 2017-02-22Technical Review by DEH on 2017-02-22
Independent Review by DTH on 2017-02-27

Project Location
Client/Project
Figure No.
Title
4223
.474 4167.869
3808.896
3931.360
3297
.058
6286.6006180.651
6426.953
4323
.412
11343.
01
6111.64110796.886033.910
6520.9675952.600
10888.59
8854.004
4082.5757180.710
5784.9278957.185 5887.031
5658.388
8745.164
11098.59
10704.837104.483
9083.054
9872
.662
12166.84 1115
2.62
7425.9835392.009
10012.
66
2468.865
8485.661 8067
.700
7321.0167518.278
3568.25
4365.1
51
7984
.517
7915
.787
7812
.588
11437
.47
6601
.994
9791
.103
7709.5
82
5303.4068250
.792
12242.76
1030
7.29
12006.22
9707
.108
12378.09
4983
.768
11871.84 6985.463
9540.124
6710
.158
4829.8
39441
7.275
1329
2.31
6935.4
52 6880.8
341151
3.74
6836
.832
4651.532 4573.228
1300
8.97
4708.3
12
12568.68
13546.68
16176.43
13787.54
16323.55
16060.06
11694.59 1160
4.04
15899.43
15787.08
17191.45
12763.59
17004.6216543.27
15641.45
14270
.05
15513.18
15378.37
15248.93
15096.11
14925.88
14762.52
14624.09
14480.64
13899.98
1414
2.09 13965.79
-10000-10
000
-9000-90
00-8000
-8000
-7000
-7000
-6000
-6000 -5000
-5000
-4000
-4000
-3000
-3000
5648
000
5649
000
5649000
5650
000
5651000
5651000 5652000
5653000
5653000
5654000
5654
000
5655000
5655
000
5656000
Breach Analysis and Inundation Mapping
B6
Alberta TransportationSpringbank Off-Stream Reservoir (SR1)
Notes
1. Coordinate System: NAD 1983 3TM 114
0 400 800Meters
LegendModel XS
River Centerline
Inundation Extents, No Cascade Failure
Inundation Extents Southeast Dyke Cascade Failure
Elevation Contour (5 meter)
U:\11
0773
396\
comp
onen
t_wor
k\da
ms_
diver
sion\
hydr
otec
hnica
l\ana
lysis\
Breac
h_An
alysis
\GIS
Figur
es\F
or_B
reac
h_Re
port\
Appe
ndix_
B2_A
D.m
xd
Rev
ised:
2017
-03-0
8 By:
adob
son
($
$¯
1:20,000 (At original document size of 11x17)110773396
Disclaimer: Stantec assumes no responsibility for data supplied in electronic format. The recipient accepts full responsibil ity for verifying the accuracy and completeness of the data. The recipient releases Stantec, its officers, employees, consultants and agents, from any and all claims arising in any way from the content or provision of the data.
City of CalgaryAlberta
Prepared by AAD on 2017-02-22Technical Review by DEH on 2017-02-22
Independent Review by DTH on 2017-02-27

Project Location
Client/Project
Figure No.
Title
4223.474
2636
.383
3808.8
96
2536
.347
1448.382
4778
4.74
3931.360
3072.717
1530.444
1928.071
1374.079
659.0451
1238.401
1844.155
3146.362
1132.153
1740.489
3224.472
754.5057858.0198
4323.412
1085.344
1620.941
4819
9.89
3385.971
883.9458
588.4315
2766
.218
978.5546
1477.87148430.80
4082.575
707.7057
2146.081
2331.512
1754.691
464.2836
4804
9.87
3568
.25
420.3724
4795
5.00
1861.469
48602.46
213.8709
4727
1.82
2468.865
47047.15
48730.03
275.1028
4677
4.9748911.67
4656
3.80
170.9389
155.6
76
4510
4.63
44309.26 44264.89
83.75642
4523
5.17
4519
0.07
44792.97
44456.87
40452.9646024.37
46328.92
45479.06
41758.58
41642.84
41903.18
4559
8.16
45580.37
41493.0141302.68
45560.96
4398
0.16
44138
.52
40543.33
42229.79
4380
8.40
43657.
23
45743.16
42408.71
41038.04
42662.33
40983.66
40984.66
40852.38
40853.38
40786.74
43493.01
42899.5943060.51
43115.
08
4327
1.91
40702.94
-6000
-6000
-5000
-5000
-4000
-4000
-3000
-3000
-2000
-2000
-1000
-1000
0
0
1000
1000
5652000 5652
000
5653000
5653
000
5654000
5654
000
5655000
5655
000
565600056
5600
05657000
5657
000
565800056
5800
0
Breach Analysis and Inundation Mapping
B7
Alberta TransportationSpringbank Off-Stream Reservoir (SR1)
Notes
1. Coordinate System: NAD 1983 3TM 114
0 400 800Meters
LegendModel XS
River Centerline
Inundation Extents, No Cascade Failure
Inundation Extents Southeast Dyke Cascade Failure
Elevation Contour (5 meter)
U:\11
0773
396\
comp
onen
t_wor
k\da
ms_
diver
sion\
hydr
otec
hnica
l\ana
lysis\
Breac
h_An
alysis
\GIS
Figur
es\F
or_B
reac
h_Re
port\
Appe
ndix_
B2_A
D.m
xd
Rev
ised:
2017
-03-0
8 By:
adob
son
($
$ ¯
1:20,000 (At original document size of 11x17)110773396
Disclaimer: Stantec assumes no responsibility for data supplied in electronic format. The recipient accepts full responsibil ity for verifying the accuracy and completeness of the data. The recipient releases Stantec, its officers, employees, consultants and agents, from any and all claims arising in any way from the content or provision of the data.
City of CalgaryAlberta
Prepared by AAD on 2017-02-22Technical Review by DEH on 2017-02-22
Independent Review by DTH on 2017-02-27

Project Location
Client/Project
Figure No.
Title
3734
7.97
37185.33
37111.79
36966.
62
32136.26
37646.80
37789.9537862.17
34445.53
36379
.25
39362.
51392
51.68
39101.
1438
978.0
334423.53
38031.47
37947.74
3991
9.03
3892
7.23
39506.
42
34552.9838
785.2
5
3973
0.15
4010
5.43
38177.78
4018
2.93
4003
5.71
36547
.14
39662
.61
34221.83
3245
6.18
36693.
99
3596
7.96
32931.48
3239
7.15
39607.52
32588.4432776.14
38529.67
35267.4935388.09
4149
3.01
3341
8.71
38390.25
4130
2.68
33736.61 3351
8.5434061.42
34801.33
38347.58
3322
1.82
35672.98
35084.03
4032
7.90
34940.01
41038.04 40983.66
40984.6640
452.9
640852.38
40853.38
40786.7440
543.3
3
4070
2.94
-3000
-3000
-2000
-2000
-1000
-1000
5646000
5646000
5647000
5647000
5648000
5648000
5649000
5649000
5650000
5650000
5651000
5651000
5652000
5652000
5653000
5653000
Breach Analysis and Inundation Mapping
B8
Alberta TransportationSpringbank Off-Stream Reservoir (SR1)
Notes
1. Coordinate System: NAD 1983 3TM 114
0 400 800Meters
LegendModel XS
River Centerline
Inundation Extents, No Cascade Failure
Inundation Extents Southeast Dyke Cascade Failure
Elevation Contour (5 meter)
U:\11
0773
396\
comp
onen
t_wor
k\da
ms_
diver
sion\
hydr
otec
hnica
l\ana
lysis\
Breac
h_An
alysis
\GIS
Figur
es\F
or_B
reac
h_Re
port\
Appe
ndix_
B2_A
D.m
xd
Rev
ised:
2017
-03-0
8 By:
adob
son
($
$ ¯
1:20,000 (At original document size of 11x17)110773396
Disclaimer: Stantec assumes no responsibility for data supplied in electronic format. The recipient accepts full responsibil ity for verifying the accuracy and completeness of the data. The recipient releases Stantec, its officers, employees, consultants and agents, from any and all claims arising in any way from the content or provision of the data.
City of CalgaryAlberta
Prepared by AAD on 2017-02-22Technical Review by DEH on 2017-02-22
Independent Review by DTH on 2017-02-27

Project Location
Client/Project
Figure No.
Title
33518
.54
31013.02
31293.79
31594.91
2321
2.06
2334
8.77 22988.65
3199
6.1
30851.283213
6.26
2350
8.66
27219.64
33418
.71
2354
9.27
2358
9.50
27518.10
2364
1.65
26870.25
26651.78
27669.
05
2377
4.35
25787.16
2784
9.16
26044.77
26381.07 26397.29
30639.50
26304.69
32456.
183293
1.48
32397.15
3258
8.44
25558.45
3277
6.14
2818
4.42
24008.
28
3322
1.82
2533
6.67
30421.99
2513
4.05
2477
9.29
2465
3.2625
047.6
9
24360.
95
24506.
902490
9.77
2851
2.8830090.31
29872.7429654.60 29
312.0
629
053.2
428
790.2
1
-4000
-4000
-3000
-3000
-2000
-2000
-1000
-1000
0
0
1000
1000
2000
2000
5639
000
5640000
5640
000
5641000
5641000
56420005643000
56430005644000
5645000
5645000
5646000564700056
4700
0
Breach Analysis and Inundation Mapping
B9
Alberta TransportationSpringbank Off-Stream Reservoir (SR1)
Notes
1. Coordinate System: NAD 1983 3TM 114
0 400 800Meters
LegendModel XS
River Centerline
Inundation Extents, No Cascade Failure
Inundation Extents Southeast Dyke Cascade Failure
Elevation Contour (5 meter)
U:\11
0773
396\
comp
onen
t_wor
k\da
ms_
diver
sion\
hydr
otec
hnica
l\ana
lysis\
Breac
h_An
alysis
\GIS
Figur
es\F
or_B
reac
h_Re
port\
Appe
ndix_
B2_A
D.m
xd
Rev
ised:
2017
-03-0
8 By:
adob
son
($
$ ¯
1:20,000 (At original document size of 11x17)110773396
Disclaimer: Stantec assumes no responsibility for data supplied in electronic format. The recipient accepts full responsibil ity for verifying the accuracy and completeness of the data. The recipient releases Stantec, its officers, employees, consultants and agents, from any and all claims arising in any way from the content or provision of the data.
City of CalgaryAlberta
Prepared by AAD on 2017-02-22Technical Review by DEH on 2017-02-22
Independent Review by DTH on 2017-02-27

Project Location
Client/Project
Figure No.
Title
15800.77
26381.0726304.69
26044.77
25787.16
18101.1318016.16
18017.16
17973.72
16891.16
25558.45
2533
6.67
17787.99
2513
4.05
2477
9.29
24008.
28
2465
3.2625
047.6
9
2334
8.77
2490
9.77
2350
8.6623
641.6
523
549.2
7
24506.
90243
60.95
23774
.3523
589.5
0
2359
0.50
2321
2.06
17527.81
18349.67
1948
0.10
19001.922298
8.65 19229.17
18715.76
1975
4.86
17162.76
2231
1.57
2218
0.17
2011
6.18
2191
3.67
2259
7.34
2048
6.26
2147
3
2083
9.52
2120
4.09
-3000
-3000
-2000
-2000
-1000
-1000
0
0
1000
1000
2000
2000
3000
3000
56340005635000
5635
000
5636000
5636000
5637000
5637000
5638000
5638000
5639000
5639000
5640000564100056
4100
0
Breach Analysis and Inundation Mapping
B10
Alberta TransportationSpringbank Off-Stream Reservoir (SR1)
Notes
1. Coordinate System: NAD 1983 3TM 114
0 400 800Meters
LegendModel XS
River Centerline
Inundation Extents, No Cascade Failure
Inundation Extents Southeast Dyke Cascade Failure
Elevation Contour (5 meter)
U:\11
0773
396\
comp
onen
t_wor
k\da
ms_
diver
sion\
hydr
otec
hnica
l\ana
lysis\
Breac
h_An
alysis
\GIS
Figur
es\F
or_B
reac
h_Re
port\
Appe
ndix_
B2_A
D.m
xd
Rev
ised:
2017
-03-0
8 By:
adob
son
($
$ ¯
1:20,000 (At original document size of 11x17)110773396
Disclaimer: Stantec assumes no responsibility for data supplied in electronic format. The recipient accepts full responsibil ity for verifying the accuracy and completeness of the data. The recipient releases Stantec, its officers, employees, consultants and agents, from any and all claims arising in any way from the content or provision of the data.
City of CalgaryAlberta
Prepared by AAD on 2017-02-22Technical Review by DEH on 2017-02-22
Independent Review by DTH on 2017-02-27
Project Location
Client/Project
Figure No.
Title
8277.925
1797
3.72
11521.13
1047
0.94
11135.20 1078
0.39
11700.60
11994.76
12318.03
8623.1
42
13326.44
12701.34
13049.88
17787.
99
9108
.651
13711.80
9936.068
9519
.493
14037.64
17527.81
14345.36
1606
7.24
14601.01
16584.
95 15800.77
16891.16
14867.55
15137.39
15336.93
17162.76
3000
3000
4000
4000
5000
5000
6000
6000
7000
7000
8000
8000
9000
9000
5634
000
5634
000
5635
000
5635
000
5636
000
5636
000
Breach Analysis and Inundation Mapping
B11
Alberta TransportationSpringbank Off-Stream Reservoir (SR1)
Notes
1. Coordinate System: NAD 1983 3TM 114
0 400 800Meters
LegendModel XS
River Centerline
Inundation Extents, No Cascade Failure
Inundation Extents Southeast Dyke Cascade Failure
Elevation Contour (5 meter)
U:\11
0773
396\
comp
onen
t_wor
k\da
ms_
diver
sion\
hydr
otec
hnica
l\ana
lysis\
Breac
h_An
alysis
\GIS
Figur
es\F
or_B
reac
h_Re
port\
Appe
ndix_
B2_A
D.m
xd
Rev
ised:
2017
-03-0
8 By:
adob
son
($$¯
1:20,000 (At original document size of 11x17)110773396
Disclaimer: Stantec assumes no responsibility for data supplied in electronic format. The recipient accepts full responsibil ity for verifying the accuracy and completeness of the data. The recipient releases Stantec, its officers, employees, consultants and agents, from any and all claims arising in any way from the content or provision of the data.
City of CalgaryAlberta
Prepared by AAD on 2017-02-22Technical Review by DEH on 2017-02-22
Independent Review by DTH on 2017-02-27

Project Location
Client/Project
Figure No.
Title
5307.660
2570.5
27
1991
.140
5643.281
2337.8
42
1535
.900
3565.569
1171
.545
2910.116
5142.17*
0
3840.3
39
6046.648
825.1624
385.6672
3194.539
4976.69* 4323
.063
6300
.200
8623
.142
8277
.925
6559
.558
4811.213
7927
.637
7675
.805
6931.8597246.0
71
9000
9000
1000
0
10000
11000
11000
12000
12000
13000
13000
14000
14000
15000
15000
16000
1600
0
17000
1700
0
5631000
5632
000
5633000
5633
000
563400056
3400
056
3500
05636000
5636
000
563700056
3700
0
Breach Analysis and Inundation Mapping
B12
Alberta TransportationSpringbank Off-Stream Reservoir (SR1)
Notes
1. Coordinate System: NAD 1983 3TM 114
0 400 800Meters
LegendModel XS
River Centerline
Inundation Extents, No Cascade Failure
Inundation Extents Southeast Dyke Cascade Failure
Elevation Contour (5 meter)
U:\11
0773
396\
comp
onen
t_wor
k\da
ms_
diver
sion\
hydr
otec
hnica
l\ana
lysis\
Breac
h_An
alysis
\GIS
Figur
es\F
or_B
reac
h_Re
port\
Appe
ndix_
B2_A
D.m
xd
Rev
ised:
2017
-03-0
8 By:
adob
son
($
$ ¯
1:20,000 (At original document size of 11x17)110773396
Disclaimer: Stantec assumes no responsibility for data supplied in electronic format. The recipient accepts full responsibil ity for verifying the accuracy and completeness of the data. The recipient releases Stantec, its officers, employees, consultants and agents, from any and all claims arising in any way from the content or provision of the data.
City of CalgaryAlberta
Prepared by AAD on 2017-02-22Technical Review by DEH on 2017-02-22
Independent Review by DTH on 2017-02-27

Project Location
Client/Project
Figure No.
Title
11343.01
9031.276
7180.710
8957.185
8601
.464
8745.164
10704.83
8534
.981
10091.40
9872.6
62
11152
.627425.983
10012.66
1061
1.40
8067.700
7321.016
8423
.292
7577.166
7984.5177915.787
11437.47
6601.994
9791.103
7709.582
7063.149
1237
8.09
8250.7
92
12242
.76
10307.29
12006.22
13965
.79
12763.
59
1256
8.68
1389
9.98
11871.84
6985.463
9540
.124
6710.1
58
1169
4.59
6747.8
71
6935.4526880.834
11513.74
6836.832
11604.
04-7000
-7000
-6000
-6000
-5000
-5000
-4000
-4000
5646000
5646000
5647000
5647000
5648000
5648000
5649000
5649000
5650000
5650000
5651000
5651000
5652000
5652000
5653000
5653000
Breach Analysis and Inundation Mapping
B13
Alberta TransportationSpringbank Off-Stream Reservoir (SR1)
Notes
1. Coordinate System: NAD 1983 3TM 114
0 400 800Meters
LegendModel XS
River Centerline
Inundation Extents, No Cascade Failure
Inundation Extents Southeast Dyke Cascade Failure
Elevation Contour (5 meter)
U:\11
0773
396\
comp
onen
t_wor
k\da
ms_
diver
sion\
hydr
otec
hnica
l\ana
lysis\
Breac
h_An
alysis
\GIS
Figur
es\F
or_B
reac
h_Re
port\
Appe
ndix_
B2_A
D.m
xd
Rev
ised:
2017
-03-0
8 By:
adob
son
($
$ ¯
1:20,000 (At original document size of 11x17)110773396
Disclaimer: Stantec assumes no responsibility for data supplied in electronic format. The recipient accepts full responsibil ity for verifying the accuracy and completeness of the data. The recipient releases Stantec, its officers, employees, consultants and agents, from any and all claims arising in any way from the content or provision of the data.
City of CalgaryAlberta
Prepared by AAD on 2017-02-22Technical Review by DEH on 2017-02-22
Independent Review by DTH on 2017-02-27