Embed Size (px)
Citation preview

BRE Client Report BRE Integrated Dwelling Level Housing Stock Modelling and
Database for Bedford Borough Council
Prepared for: Sarah Cropley, Housing Strategy Officer
Date: 22 October 2018
Report Number: QUO-01528-F6X3H0 Issue: 2
BRE Watford, Herts WD25 9XX Customer Services 0333 321 8811 From outside the UK: T + 44 (0) 1923 664000 F + 44 (0) 1923 664010 E [email protected] www.bre.co.uk
Prepared for: Sarah Cropley, Housing Strategy Officer Bedford Borough Council 4th Floor Borough Hall Cauldwell Street Bedford MK42 9AP

Integrated Dwelling Level Housing Stock Modelling and Database
Commercial in Confidence
Template Version V2-082014
© Building Research Establishment Ltd
Report No. QUO-01528-F6X3H0
Page 1 of 110
This report is made on behalf of Building Research Establishment Ltd. (BRE) and may only be distributed in its entirety, without amendment, and with attribution to BRE to the extent permitted by the terms and conditions of the contract. BRE’s liability in respect of this report and reliance thereupon shall be as per the terms and conditions of contract with the client and BRE shall have no liability to third parties to the extent permitted in law.
Prepared by
Name Chris Johnes
Position Principal Consultant, Housing and Health
Date 22 October 2018
Signature
Authorised by
Name Rob Flynn
Position Director, Housing and Health
Date 22 October 2018
Signature

Integrated Dwelling Level Housing Stock Modelling and Database
Commercial in Confidence
Template Version V2-082014
© Building Research Establishment Ltd
Report No. QUO-01528-F6X3H0
Page 2 of 110
• Bedford Borough Council commissioned BRE to undertake a series of modelling exercises on their housing stock which required BRE to produce an integrated stock model which incorporates Energy Performance Certificate (EPC)1 data. As a result of this, 33,100 addresses have had their imputed energy characteristics replaced with observed characteristics from the EPC data for the purposes of the energy model. The use of this observed data will lead to more accurate energy models for these cases, which account for 43.9% of the total stock in Bedford.
• This report describes the work and the results obtained from the integrated model and Housing Stock Condition Database (HSCD). The database is also provided to the council to enable them to obtain specific information whenever required.
• The detailed housing stock information provided in this report will facilitate the delivery of Bedford Borough Council’s housing strategy and enable a targeted intervention approach, within a Private Sector Housing Strategy, to improving housing. In addition to this there are also several relevant government policies – the Housing Act 2004, Housing Strategy Policy, Local Authority Housing Statistics (LAHS) and the Energy Companies Obligation (ECO).
• The main aims of this work were to provide estimates of:
o The percentage of dwellings meeting each of the key indicators2 for Bedford overall and broken down by tenure and then mapped by Census Output Area (COA) (private sector stock only)
o Information relating to LAHS reporting for the private sector stock - category 1 hazards and Houses in Multiple Occupation (HMOs) as well as information on EPC ratings
o Energy efficiency variables for the private sector stock (wall and loft insulation) o Energy planning variables (SimpleCO2, energy and heat demand, energy and heat cost) o Improvement scenarios
• BRE Housing Stock Models were used to provide such estimates at dwelling level and focussing on
private sector housing. The key indicators provide Bedford with detailed information on the likely condition of the stock and the geographical distribution of properties of interest.
• A stock modelling approach has been developed and used by BRE for many years and the most recent 2017 models have been updated to make use of the results of the 2014 English Housing
1 EPCs are an indication of how energy efficient a building is - with a rating from A (very efficient) to G (inefficient). They are required whenever a property is built, sold or rented.
2 Presence of a HHSRS category 1 hazard, presence of a category 1 hazard for excess cold, presence of a category 1 hazard for falls, dwellings in disrepair, fuel poverty (10% and Low Income High Cost definitions), dwelling occupied by a low income household and SimpleSAP rating.
Executive summary

Integrated Dwelling Level Housing Stock Modelling and Database
Commercial in Confidence
Template Version V2-082014
© Building Research Establishment Ltd
Report No. QUO-01528-F6X3H0
Page 3 of 110
Survey (EHS)3. The models also make use of Experian and Ordnance Survey (OS) data. OS AddressBase Plus is used as a basis for the list of all dwellings in the authority, and applying improved geo-modelling4 is used to determine the dwelling type and floor area from OS Mastermap. The energy model that lies at the heart of the modelling process are based on the 2012 version of SAP, and the methods for imputing the inputs to this model incorporate information sources from additional sources. These include the age of postcodes (to improve dwelling age data) and data from Xoserve to determine whether the dwelling is on the gas network. These dwelling level models are used to estimate the likelihood of a particular dwelling meeting the criteria for each of the key indicators. These outputs can then be mapped to provide the authority with a geographical distribution of each of the key indicators which can then be used to target resources for improving the housing stock.
• The Energy Performance Certificate (EPC) data is integrated into the Housing Stock Model by BRE resulting in the production of an integrated Housing Stock Condition Database (HSCD).
• The headline results are provided on the following page:
3 2014 is the latest available data. Prior to the 2017 models EHS 2012 data was used. 4 The OS data has been used to update a number of the model inputs – the main value of the OS data is the ability to determine the dwelling type with much greater confidence – see Appendix B for more information.

Integrated Dwelling Level Housing Stock Modelling and Database
Commercial in Confidence
Template Version V2-082014
© Building Research Establishment Ltd
Report No. QUO-01528-F6X3H0
Page 4 of 110
Headline results for Bedford
There are 75,382 dwellings in Bedford, 60% are owner occupied, 23% private rented and 17% social rented.
8,711 dwellings in the private sector are estimated to have category 1 Housing Health and Safety Rating System (HHSRS) hazards. This equates to 14% of properties. See full results
2,845 dwellings in the private rented sector are estimated to have category 1 HHSRS hazards. This equates to 16% of properties in the private rented sector. See full results
The highest concentrations of all HHSRS hazards in the private sector are estimated to be found in the wards of Wyboston, Riseley and Queens Park. See full results
The highest concentrations of fuel poverty (Low Income High Costs definition) in the private sector are estimated to be found in the wards of Wyboston, Riseley and Queens
Park and for excess cold the highest concentrations are in Wyboston, Riseley and Harrold. See full results
The average SimpleSAP rating for all private sector dwellings in Bedford is 59, which is worse than England (60) but the same as East of England. For owner occupied stock the
figure is 58 and for private rented stock it is 61. See full results
Maps by Census Output Area (COA) have been provided for the above key indicators. See maps
The total cost of mitigating the estimated category 1 hazards in Bedford’s private sector stock is estimated to be £51.7 million – with £28.3 million in the owner occupied sector, and
£23.4 million in the private rented sector. See full results
There are an estimated 2,476 HMOs in Bedford, of which approximately 75 come under the current mandatory licensing scheme, and 364 would come under the proposed new definition. See full
results
6.7% (4,162) of private sector dwellings and 6.9% (1,219) of private rented dwellings in Bedford are estimated to have an EPC rating below band E. See full results
In the private sector stock, there are an estimated 12,662 dwellings with un-insulated cavity walls and 9,265 dwellings with less than 100mm of loft insulation. See full results
Analysis of the energy efficiency variables indicates that the owner occupied stock has the highest average figures for the majority of variables (SimpleCO2, energy and heat demand,
energy and heat cost). See full results
An improvement scenario involving a package of work with low cost measures, heating, double glazing, solid wall insulation and solar hot water provides high levels of savings –
around a 31% reduction in energy demand. However, simply implementing low cost measures and heating would provide an estimated reduction of around 16%. See full results

Integrated Dwelling Level Housing Stock Modelling and Database
Commercial in Confidence
Template Version V2-082014
© Building Research Establishment Ltd
Report No. QUO-01528-F6X3H0
Page 5 of 110
Key illustrations of headline results
• The table below shows the results for 7 of the key indicators in Bedford compared to regional data and England (EHS 2014) - split into all stock and private sector stock. The data shows that the performance of the housing stock in Bedford compared to the EHS England average is mixed with Bedford performing slightly better for disrepair, fuel poverty (both definitions) and low income households, but slightly worse or the same for all hazards, excess cold and fall hazards. Compared to the regional average Bedford generally performs similarly or slightly better, with the exception of low income households where there is a slightly higher proportion in Bedford compared to the East of England average.
Estimates of the percentage of dwellings meeting the key indicator criteria assessed by the housing stock models and database for all stock and private sector stock – Bedford compared to the East of England and England (EHS 2014)
0% 10% 20% 30%
Low incomehouseholds
Fuel poverty (LowIncome High Costs)
Fuel poverty (10%)
Disrepair
Fall hazards
Excess cold
All hazards
% of dwellings
Ke
y in
dic
ato
rs
Bedford all stock
EHS East of England Region 2014all stock
EHS England 2014 all stock
Bedford private stock
EHS East of England Region 2014private stock
EHS England 2014 private stock

Integrated Dwelling Level Housing Stock Modelling and Database
Commercial in Confidence
Template Version V2-082014
© Building Research Establishment Ltd
Report No. QUO-01528-F6X3H0
Page 6 of 110
• The table below shows the number and percentage of Bedford’s private rented stock falling into each of the EPC ratings bands (based on SimpleSAP). The number of private rented dwellings in Bedford with a rating below band E (i.e. bands F and G), is estimated to be 1,219 (6.9%). Compared to England, there are a greater proportion of dwellings in band A/B, C and F and lower proportions in the other bands.
Number and percentage of Bedford’s private rented stock falling into each of the EPC ratings bands (based on SimpleSAP)
2014 EHS England
Count Percent Percent
(92-100) A 0 0.0%
322 1.8%
5,844 33.3% 23.8%
7,054 40.1% 48.9%
3,136 17.8% 18.3%
998 5.7% 5.4%
221 1.3% 2.1%
Bedford
1.4%
(1-20) G
(81-91) B
(69-80) C
(55-68) D
(39-54) E
(21-38) F
• The map overleaf shows the estimate distribution of category 1 hazards, as defined by the Housing Health and Safety Rating System (HHSRS). The highest concentrations are mainly to the north of the area in particular in the wards of Wyboston and Riseley, but the third highest concentrations are towards more central parts of Bedford in Queens Park ward.

Integrated Dwelling Level Housing Stock Modelling and Database
Commercial in Confidence
Template Version V2-082014
© Building Research Establishment Ltd
Report No. QUO-01528-F6X3H0
Page 7 of 110
Percentage of private sector dwellings in Bedford estimated to have a HHSRS category 1 hazard

Integrated Dwelling Level Housing Stock Modelling and Database
Commercial in Confidence
Template Version V2-082014
© Building Research Establishment Ltd
Report No. QUO-01528-F6X3H0
Page 8 of 110
Contents
1 Introduction 12
1.1 Project aims 14
2 Policy background 15
2.1 Housing Act 2004 15
2.2 Key housing strategy policy areas and legislation 15
2.3 Other policy areas 18
2.4 Local Authority Housing Statistics (LAHS) and EPC ratings 19
2.5 The Energy Company Obligation (ECO) 20
3 Overview of the BRE Dwelling Level Housing Stock Modelling approach 22
3.1 Overview 22
3.2 Breakdown of the housing stock by tenure - validation 25
4 Results from the BRE Dwelling Level Housing Stock Models and Housing Stock Condition Database (HSCD) 29
4.1 Overview of Bedford 30
4.2 Key indicators 31
4.3 Information relating to LAHS reporting and EPC ratings 60
4.4 Energy efficiency variables for Bedford 69
4.5 Energy planning variables for Bedford 74
4.6 Improvement scenarios for Bedford 79
5 Conclusion and recommendations 82
5.1 Conclusion 82
5.2 Recommendations 82
Appendix A Definitions of the key indicators 84
Appendix B Methodology for the BRE Integrated Dwelling Level Housing Stock Modelling approach 87
Appendix C Using the BRE Integrated Dwelling Level Housing Stock Database 95
Appendix D Additional Maps 97
Glossary of terms 108

Integrated Dwelling Level Housing Stock Modelling and Database
Commercial in Confidence
Template Version V2-082014
© Building Research Establishment Ltd
Report No. QUO-01528-F6X3H0
Page 9 of 110
List of tables
Table 1: Key indicators split into categories 13
Table 2: Comparison of MHCLG, ONS and BRE Database figures on tenure split for Bedford N.B. DCLG data does not break down private sector into owner occupied and private rented and ONS data does not provide an estimate for social stock 28
Table 3: Estimates of the numbers and percentage of dwellings meeting the key indicator criteria assessed by the Housing Stock Models and Housing Stock Condition Database for all stock and private sector stock – Bedford compared to the East of England and England (EHS 2014) 31
Table 4: Estimates of the numbers and percentage of dwellings meeting the key indicator criteria assessed by the Housing Stock Models and Housing Stock Condition Database by tenure for Bedford 33
Table 5: Total stock – estimated number and percentage of dwellings for each of the key indicators, and average SimpleSAP ratings by ward 52
Table 6: Private sector stock – estimated number and percentage of dwellings for each of the key indicators, and average SimpleSAP ratings by ward 54
Table 7: Owner occupied sector stock – estimated number and percentage of dwellings for each of the key indicators, and average SimpleSAP ratings by ward 56
Table 8: Private rented sector stock – estimated number and percentage of dwellings for each of the key indicators, and average SimpleSAP ratings by ward 58
Table 9: Estimated costs to mitigate all category 1 hazards in private sector stock, split into tenure 60
Table 10: Summary of estimated HMOs within the Bedford private sector stock 62
Table 11: Estimates of the numbers and percentage of dwellings for each of the energy efficiency variables for walls assessed for the private sector stock in Bedford and compared to the East of England region and national figure (EHS 2014) 70
Table 12: Estimates of the numbers and percentage of dwellings for each of the energy efficiency variables for lofts assessed for the private sector stock in Bedford and compared to the East of England region and national figure (EHS 2014) 70
Table 13: Modelled data for average energy efficiency variables per dwelling by tenure in Bedford 74
Table 14: Results of the improvement scenarios analysis – showing the estimated average change in energy output variables compared to the baseline for the total housing stock in Bedford 81

Integrated Dwelling Level Housing Stock Modelling and Database
Commercial in Confidence
Template Version V2-082014
© Building Research Establishment Ltd
Report No. QUO-01528-F6X3H0
Page 10 of 110
List of figures
Figure 1: Simplified flow diagram of overall BRE housing stock modelling approach (N.B. the EHS data is only used to inform the mathematical algorithms of the model – it does not provide data) 24
Figure 2: Tenure split – comparison of BRE Housing Stock Condition Database outputs with 2011 Census figures for Bedford 25
Figure 3: Estimates of the percentage of dwellings meeting the key indicator criteria assessed by the Housing Stock Models and Housing Stock Condition Database for all stock and private sector stock – Bedford compared to the East of England and England (EHS 2014) 32
Figure 4: Average SimpleSAP ratings for all stock and private sector stock – Bedford compared to the East of England and England (EHS 2014) 32
Figure 5: Estimates of the percentage of dwellings meeting the key indicator criteria assessed by the Housing Stock Models and Housing Stock Condition Database by tenure for Bedford 34
Figure 6: Average SimpleSAP ratings by tenure for Bedford 34
Figure 7: A representation of the Low Income High Costs definition of fuel poverty 42
Figure 8: Aggregated fuel poverty gap figures for the private sector stock in Bedford by SAP band 43
Figure 9: Aggregated fuel poverty gap figures for the private rented sector stock in Bedford by SAP band44
Figure 10: Number and percentage of Bedford’s private sector stock falling into each of the EPC ratings bands (based on SimpleSAP), compared to England (EHS) figures N.B. England figures report band A and B together 66
Figure 11: Number and percentage of Bedford’s private rented stock falling into each of the EPC ratings bands (based on SimpleSAP), compared to England (EHS) figures N.B. England figures report band A and B together 67
Figure 12: Estimated change in energy cost by scenario, including percentage change compared to the baseline 81

Integrated Dwelling Level Housing Stock Modelling and Database
Commercial in Confidence
Template Version V2-082014
© Building Research Establishment Ltd
Report No. QUO-01528-F6X3H0
Page 11 of 110
List of maps
Map 1: Distribution of estimated percentage of private rented dwellings in Bedford – based on database26
Map 2: Distribution of estimated percentage of private rented dwellings in Bedford – based on 2011 Census Data (Neighbourhood Statistics) 26
Map 3: The wards in Bedford 30
Map 4: Percentage of private sector dwellings in Bedford with an estimated presence of a HHSRS category 1 hazard 37
Map 5: Percentage of private sector dwellings in Bedford with an estimated presence of a HHSRS category 1 hazard for excess cold 38
Map 6: Percentage of private sector dwellings in Bedford with an estimated presence of a HHSRS category 1 hazard for falls 39
Map 7: Percentage of private sector dwellings in Bedford estimated to be in disrepair 41
Map 8: Percentage of private sector dwellings in Bedford estimated to be occupied by households in fuel poverty - Low Income High Costs definition 45
Map 9: Percentage of private sector dwellings in Bedford estimated to be occupied by households in fuel poverty – 10% definition 46
Map 10: Percentage of private sector dwellings in Bedford estimated to be occupied by low income households 48
Map 11: Percentage of private sector dwellings in Bedford with both an estimated presence of a HHSRS category 1 hazard for excess cold and estimated to be occupied by low income households 49
Map 12: Estimated average SimpleSAP ratings per dwelling in Bedford private sector stock 51
Map 13: Estimated distribution of count of HMOs 63
Map 14: Estimated distribution of count of licensable HMOs 64
Map 15: Estimated distribution of count of licensable HMOs under proposed 2018 definition 65
Map 16: Estimated distribution of dwellings with F or G EPC ratings in the private rented stock 68
Map 17: Energy efficiency variables – estimated percentage of private sector dwellings in Bedford with un-insulated cavity walls 71
Map 18: Energy efficiency variables - estimated percentage of private sector dwellings in Bedford with solid walls 72
Map 19: Energy efficiency variables – estimated percentage of private sector dwellings in Bedford with less than 100mm or no loft insulation 73
Map 20: Estimated average total energy demand (kWh/year) – private sector stock 75
Map 21: Estimated average total energy cost (£/year) – private sector stock 76
Map 22: Estimated average total heat demand (kWh/year) – private sector stock 77
Map 23: Estimated average total heat cost (£/year) – private sector stock 78

Integrated Dwelling Level Housing Stock Modelling and Database
Commercial in Confidence
Template Version V2-082014
© Building Research Establishment Ltd
Report No. QUO-01528-F6X3H0
Page 12 of 110
1 Introduction
Bedford Borough Council commissioned BRE to undertake a series of modelling exercises on their housing stock. BRE have integrated Energy Performance Certificate (EPC)5 data into the models to produce an integrated database and corresponding report. This report describes the modelling work and provides details of the results obtained from the integrated dwelling level model and database.
This current report covers the BRE Integrated Dwelling Level Stock Models and Database. The BRE Model integrates Energy Performance Certificate (EPC) data and as a result of this, 33,100 addresses have had their imputed energy characteristics replaced with observed characteristics from the EPC data for the purposes of the energy model. The use of this observed data will lead to more accurate energy models for these cases, which account for 43.9% of the total housing stock in Bedford.
This report describes that work and the results obtained from the integrated model and database. The integrated database is also provided to the council to enable them to obtain specific information whenever required. This database is now in an online format.
The stock models and database provide the council with dwelling level information on various key housing indicators, focussing on private sector housing. The key indicators provide Bedford Borough Council with detailed information on the likely condition of the stock and the geographical distribution of properties of interest. These properties are likely to be suitable targets for energy efficiency improvements or other forms of intervention, such as mitigating Housing Health and Safety Rating System (HHSRS) hazards. The key indicators are split into categories related to house condition, energy efficiency and household vulnerability as shown in Table 1 (see Appendix A for full definitions).
5 EPCs are an indication of how energy efficient a building is - with a rating from A (very efficient) to G (inefficient). They are required whenever a property is built, sold or rented.

Integrated Dwelling Level Housing Stock Modelling and Database
Commercial in Confidence
Template Version V2-082014
© Building Research Establishment Ltd
Report No. QUO-01528-F6X3H0
Page 13 of 110
Table 1: Key indicators split into categories
Indicator House condition indicators
Energy efficiency indicators
Household vulnerability indicators
Estimated presence of HHSRS cat 1 hazard
Estimated presence of cat 1 hazard for excess cold
Estimated presence of cat 1 hazard for falls
Estimated dwellings in disrepair
Estimated fuel Poverty (10% and Low income, High cost definitions)
Estimated dwellings occupied by low income households
Estimated SimpleSAP rating
N.B. Presence of estimated category 1 hazard for falls does NOT include the hazard of falling between levels
The single indicators shown in Table 1 can also be combined within the database to provide powerful information on the housing stock, for example dwellings suffering from excess cold and also occupied by households on a low income. The true potential of the database lies in its ability to produce combined indicators such as this, as it allows council officers to explore the stock and to assess the likely scope of any programmes they might wish to implement.
It is also possible to extract other information from the database which is of use to local authorities. This information includes estimates relating to the Ministry of Housing, Communities and Local Government’s (MHCLG) Local Authority Housing Statistics (LAHS) reporting of costs of mitigating hazards, numbers of Houses in Multiple Occupation (HMOs) as well as providing information relating to Energy Performance Certificate (EPC) ratings.
The key indicators and other information are derived from the Housing Stock Condition Database (HSCD) which is made up of a series of Dwelling Level Stock Models. The BRE Dwelling Level Stock Models have been used for many years to provide key housing indicators to local authorities. The most recent 2017 models have been updated to make use of the results of the 2014 English Housing Survey (EHS)6. The models also make use of Experian and Ordnance Survey (OS) data. OS AddressBase Plus is used as a basis for the list of all dwellings in the authority, and applying improved geo-modelling7 is used to determine the dwelling type and floor area from OS Mastermap. The energy model that lies at the heart of the modelling process is based on the 2012 version of SAP, and the methods for imputing the inputs to
6 2014 is the latest available data. Prior to the 2017 models EHS 2012 data was used.
7 The OS data has been used to update a number of the model inputs – the main value of the OS data is the ability to determine the dwelling type with much greater confidence – see Appendix B for more information.
Integrated Dwelling Level Housing Stock Modelling and Database
Commercial in Confidence
Template Version V2-082014
© Building Research Establishment Ltd
Report No. QUO-01528-F6X3H0
Page 14 of 110
this model incorporate information sources from additional sources. These include the age of postcodes (to improve dwelling age data) and data from Xoserve to determine whether the dwelling is on the gas network. These dwelling level models are used to estimate the likelihood of a particular dwelling meeting the criteria for each of the key indicators. These outputs can then be mapped to provide the authority with a geographical distribution of each of the key indicators which can then be used to target resources for improving the housing stock.
As described above, in this particular case, the database was further enhanced by the addition of local data sources which were identified by Bedford Borough Council. These local data sources were incorporated into the stock models to produce the integrated database.
The information in the database can be used to ensure the council meets various policy and reporting requirements. For example, local housing authorities are required to review housing conditions in their districts in accordance with the Housing Act 20048.
Furthermore, having this information available will also help to facilitate the delivery of Bedford Borough Council’s housing strategy. It will enable a targeted intervention approach to improving housing; therefore allowing the council to concentrate their resources on housing in the poorest condition or with the greatest health impact.
1.1 Project aims The main aim of this project was to provide data on key private sector housing indicators for Bedford. The main aims of this work were therefore to provide estimates of:
• The percentage of dwellings meeting each of the key indicators for Bedford overall and broken down by tenure and then mapped by Census Output Area (COA) (private sector stock only)
• Information relating to LAHS reporting for the private sector stock - category 1 hazards and HMOs, plus information on EPC ratings
• Energy efficiency variables for the private sector stock (wall and loft insulation) • Energy planning variables (SimpleCO2, energy and heat demand, energy and heat cost) • Improvement scenarios
This report looks firstly at the policy background and why such information is important for local authorities. Secondly, it provides a brief description of the overall stock modelling approach and the integration of the local data sources. Finally, this report provides the modelling results for Bedford covering each of the main aims above.
8 http://www.legislation.gov.uk/ukpga/2004/34/contents

Integrated Dwelling Level Housing Stock Modelling and Database
Commercial in Confidence
Template Version V2-082014
© Building Research Establishment Ltd
Report No. QUO-01528-F6X3H0
Page 15 of 110
2 Policy background
The detailed housing stock information provided in this report will facilitate the delivery of Bedford Borough Council’s housing strategy and enable a targeted intervention approach to improving housing. This strategy needs to be set in the context of relevant government policy and legislative requirements. These policies either require reporting of housing-related data by local authorities, or the use of such data to assist in meeting policy requirements. The main policies and legislative requirements are summarised in the following sub-sections.
2.1 Housing Act 2004 The Housing Act 20048 requires local housing authorities to review housing statistics in their district. The requirements of the Act are wide-ranging and also refer to other legislation which between them covers the following:
• Dwellings that fail to meet the minimum standard for housings (i.e. dwellings with HHSRS category 1 hazards)
• Houses in Multiple Occupation (HMOs) • Selective licensing of other houses • Demolition and slum clearance • The need for provision of assistance with housing renewal • The need to assist with adaptation of dwellings for disabled persons
2.2 Key housing strategy policy areas and legislation
2.2.1 Private rented sector In the report “Laying the Foundations: A Housing Strategy for England”9 Chapters 4 and 5 focus on the private rented sector and empty homes.
New measures are being developed to deal with rogue landlords and to encourage local authorities to make full use of enforcement powers for tackling dangerous and poorly maintained dwellings. The report encourages working closely with landlords whilst still operating a robust enforcement regime (e.g. Landlord Forums and Panels across the country).
There has been significant growth in the private rented sector in Bedford in recent years from 9% of the total stock in 2001 to 17% in 201110 - so that 8% of the stock has changed over that time period to now be private rented. This is similar to the change of 9% seen in England as a whole. The analysis for this current report estimates that 23% of the stock in Bedford is now privately rented, implying a further increase since 2011.
9 Laying the Foundations: A Housing Strategy for England, CLG, 2011
10 https://www.ons.gov.uk/census#censusdataandbackground

Integrated Dwelling Level Housing Stock Modelling and Database
Commercial in Confidence
Template Version V2-082014
© Building Research Establishment Ltd
Report No. QUO-01528-F6X3H0
Page 16 of 110
2.2.2 Health inequalities The government’s white paper “Choosing Health”11 states that the key to success in health inequalities will be effective local partnerships led by local government and the NHS working to a common purpose and reflecting local needs. Housing is a key determinant of health, and poor housing conditions continue to cause preventable deaths and contribute to health inequalities12. An example in this area is the work carried out by Liverpool City Council in partnership with Liverpool Primary Care Trust – the “Healthy Homes Programme”. This has identified over 3,800 hazards and led to an estimated £4.8 million investment by landlords, delivering sustainable health improvements and enhancing community wellbeing.
2.2.3 Integrated care It has been recognised by central government that to fully address the health needs of the population, services need to become more integrated and there needs to be better communication between different providers. Housing is a key aspect of this:
“Many people with mental and physical disabilities, complex needs, long-term conditions and terminal illness also need to access different health care, social care, housing and other services, such as education, and often simultaneously”13.
It is therefore essential that departments providing or regulating housing work with other council departments and health organisations to provide services that are integrated and take full account of the needs of the individual.
2.2.4 Public Health Outcomes Framework The Public Health Outcomes Framework “Healthy lives, healthy people: Improving outcomes and supporting transparency”14 sets out desired outcomes for public health and how they will be measured. Many of the measurements have links to housing, some of the more relevant being:
• Falls and injuries in over 65’s • Fuel poverty • Excess winter deaths
2.2.5 Joint Strategic Needs Assessment (JSNA) and Joint Health and Wellbeing Strategies
The JSNA and joint health and wellbeing strategy allow health and wellbeing boards to analyse the health needs of their local population and to decide how to make best use of collective resources to achieve the priorities that are formed from these. The Department of Health document “Joint Strategic Needs Assessment and joint health and wellbeing strategies explained - Commissioning for populations” says
11 Choosing Health: Making healthy choices easier, Department of Health, 2004
12 The health impacts of poor private sector housing, LACORS, 2010
13 Integrated Care: Our Shared Commitment, Department of Health, 2013
14 Healthy lives, healthy people: Improving outcomes and supporting transparency, Department of Health, 2013

Integrated Dwelling Level Housing Stock Modelling and Database
Commercial in Confidence
Template Version V2-082014
© Building Research Establishment Ltd
Report No. QUO-01528-F6X3H0
Page 17 of 110
“This will ensure better integration between public health and services such as housing and education that have considerable impact on the wider determinants of health”15.
2.2.6 Energy Act 2011 The Energy Act 2011 requires that from 2016 reasonable requests by tenants for energy efficiency improvements will not be able to be refused. Furthermore, from 2018 it will be unlawful for landlords to rent out properties that do not reach a minimum standard of energy efficiency (set at Energy Performance Certificate rating E16). While there will be various caveats to these powers, they will provide a new minimum standard for rented accommodation. Part of this current project for Bedford Borough Council includes provision of a private rented sector variable that should assist in identifying such dwellings.
2.2.7 Empty homes The need to bring empty private sector dwellings back into use is a key government objective that is part of a wider strategy to tackle housing affordability. It is generally accepted that in a time of housing shortage, empty dwellings represent a wasted resource.
Empty homes brought back into use will qualify for the New Homes Bonus where, for the following 6 years, the government will match fund the Council Tax on long term empty properties brought back into use. Between 2012-15, £100 million of capital funding was available from within the Affordable Homes Programme to tackle problematic17 empty homes. There is no longer any separate funding for empty homes under the 2015-18 Affordable Homes Programme, although they are legitimate forms of Affordable Rent provision that could be included in bids for the 2015-18 Affordable Homes Programme18.
There are a number of issues in dealing with private sector vacant dwellings including the transient nature of vacant dwellings and their difficulty of identification. Properties are being continually bought and sold, let and modernised, which means that at any given time a proportion of the stock will be naturally vacant. The only dwellings that tend to be of most interest to local authorities are those that are not turning over in the normal way.
Whilst the data provided by this project cannot necessarily assist with the actual identification of empty homes, the database provided would be the logical place for such information to be stored should it be gathered from other sources.
The latest available information for Bedford for 2017, collected by MHCLG19, identifies 1,885 vacant dwellings across all tenures. In 2014 the number of vacant dwellings was 1,684. These figures represent a vacancy rate of approximately 2% in Bedford. Furthermore, around 431 (0.6%) dwellings are long-term vacant (6 months or more) in Bedford (2017 figures).
15 Joint Strategic Needs Assessment and joint health and wellbeing strategies explained: Commissioning for populations, Department of Health, 2011
16 http://www.legislation.gov.uk/uksi/2015/962/contents/made
17 Properties that are likely to remain empty without direct financial support from government.
18 https://www.gov.uk/government/uploads/system/uploads/attachment_data/file/343896/affordable-homes-15-18-framework.pdf
19 https://www.gov.uk/government/collections/dwelling-stock-including-vacants

Integrated Dwelling Level Housing Stock Modelling and Database
Commercial in Confidence
Template Version V2-082014
© Building Research Establishment Ltd
Report No. QUO-01528-F6X3H0
Page 18 of 110
2.3 Other policy areas The following policy areas, whilst not directly relating to environmental health services, will have an effect on demand and local authorities will need to be aware of the possible impact in their area.
2.3.1 The Housing and Planning Act 2016 The Housing and Planning Act 201620 introduces legislation for government to implement the sale of higher value local authority homes, starter homes, pay to stay and a number of other measures, mainly intended to promote home ownership and boost levels of housebuilding in England. Although many of the measures have yet to be implemented or come into effect, the following policy changes will have a significant impact on the way councils deliver their Housing Services:
• The introduction of Pay to Stay where households earning over £31,000 have to pay higher levels of rent for their social housing
• Extension of the Right-to-Buy scheme to housing associations through a voluntary agreement, funded by the sale of higher value council properties when they become vacant
• The ending of lifetime tenancies – all new tenants will have to sign tenancies for a fixed term up to 10 years although there will be exemptions for people with disabilities and victims of domestic abuse, and families with children under nine years old can have a tenancy that lasts until the child’s 19th birthday
• Changes to planning measures so that the government can intervene where councils have not adopted a Local Plan
• To replace the need for social rented and intermediate housing on new sites with the provision of Starter Homes that are sold at a reduced cost to first time buyers
• Changing the definition of ‘affordable homes’ to include starter homes • Increasing the site size threshold before affordable housing can be requested
The Act also includes a package of measures to help tackle rogue landlords in the private rented sector. This includes:
• Allowing local authorities to apply for a banning order to prevent a particular landlord/letting agent from continuing to operate where they have committed certain housing offences
• Creating a national database of rogue landlords/letting agents, which will be maintained by local authorities
• Allowing tenants or local authorities to apply for a rent repayment order where a landlord has committed certain offences (for example continuing to operate while subject to a banning order or ignoring an improvement notice). If successful the tenant (or the authority if the tenant was receiving universal credit) may be repaid up to a maximum of 12 months’ rent
• Introducing a new regime giving local authorities an alternative to prosecution for offences committed under the Housing Act 2004, including all HMO offences. Effectively, local authorities will have a choice whether to prosecute or impose a penalty with a maximum fine of £30,000. The local authority can also retain the money recovered, which is not currently the case with fines imposed in the magistrates’ court
2.3.2 The Welfare Reform and Work Act 2016 and the Welfare Reform Act 2012 The Welfare Reform and Work Act 201621 gained royal assent in March 2016. The Act introduces a duty to report to Parliament on progress made towards achieving full employment and the three million
20 http://www.legislation.gov.uk/ukpga/2016/22/contents/enacted/data.htm
21 http://www.legislation.gov.uk/ukpga/2016/7/contents/enacted

Integrated Dwelling Level Housing Stock Modelling and Database
Commercial in Confidence
Template Version V2-082014
© Building Research Establishment Ltd
Report No. QUO-01528-F6X3H0
Page 19 of 110
apprenticeships target in England. The Act also ensures reporting on the effect of support for troubled families and provision for social mobility, the benefit cap, social security and tax credits, loans for mortgage interest, and social housing rents. These include the following:
• Overall reduction in benefits – a four year freeze on a number of social security benefits • Benefit cap reduction – the total amount of benefit which a family on out of work benefits can be
entitled to in a year will not exceed £20,000 for couples and lone parents, and £13,400 for single claimants, except in Greater London where the cap is set at £23,000 and £15,410 respectively
• Local Housing Allowance rent cap – this is the locally agreed maximum benefit threshold for a dwelling or household type within a defined geographical area. Therefore, if rises in rent outstrip growth in income, renters may find it increasingly difficult to pay
• A 1% reduction in social rents per year for 4 years from 1 April 2016 to reduce the housing benefit bill
In addition, the Welfare Reform Act 201222 (which is in parts amended by the 2016 Act discussed above) covers areas of environmental health services – in particular the sections relating to the under occupation of social housing, and the benefit cap. Whilst this will mainly affect tenants in the social rented sector it will undoubtedly have an impact on private sector services. Social tenants may find themselves being displaced into the private sector, increasing demand in this area, and the tenants of Registered Providers (RP’s) and some private landlords may have greater trouble affording rent payments. If tenants are in arrears on their rental payments then authorities may be met with reluctance from landlords when requiring improvements to properties.
2.3.3 Localism Act 2011 The Localism Act allows social housing providers to offer fixed term, rather than secure lifetime, tenancies. As with the Welfare Reform Act, this has a greater direct impact on the social rented sector, however, there is some concern this may lead to greater turnover of tenancies meaning such that some traditional social tenants may find themselves in the private rented sector.
Both of these policy changes above may increase the number of vulnerable persons in private sector properties. If this occurs any properties in this sector in poor condition are likely to have a far greater negative impact on the health of those occupiers.
2.3.4 Potential increase in private rented sector properties Policies such as the Build to Rent and the New Homes Bonus are aimed at increasing the supply of properties. As the private rented sector is already growing, it is reasonable to assume that many of the new properties being built will be rented to private tenants. Local authorities will need to be aware of the potential impact on the demand for their services and how their perception of their local area may have to change if large numbers of properties are built.
2.4 Local Authority Housing Statistics (LAHS)23 and EPC ratings The purpose of these statistics is twofold – firstly to provide central government with data with which to inform and monitor government strategies, policies and objectives as well as contributing to national statistics on housing, secondly, to the local authorities themselves to help manage their housing stock.
22 http://www.legislation.gov.uk/ukpga/2012/5/contents/enacted
23 https://www.gov.uk/government/publications/completing-local-authority-housing-statistics-2012-to-2013-guidance-notes

Integrated Dwelling Level Housing Stock Modelling and Database
Commercial in Confidence
Template Version V2-082014
© Building Research Establishment Ltd
Report No. QUO-01528-F6X3H0
Page 20 of 110
Local authorities are required to complete an annual return which covers a wide range of housing-related issues. Of particular relevance to this current project is “Section F: Condition of dwelling stock” which, amongst other things, requests the following information:
• Estimates of the number of HMOs and the number of mandatory licensable HMOs Whilst the LAHS no longer requires reporting of total number of dwellings and number of private sector dwellings with category 1 HHSRS hazards and the estimated costs of mitigating these, this information is still of use to understand the extent of these hazards within a local authority.
The LAHS no longer requires reporting of average EPC ratings of the private sector stock and the proportion below a certain rating; however, this information remains pertinent due to the Energy Act 2011. Under this act new rules mean that from 2018 landlords must ensure that their properties meet a minimum energy efficiency standard - which has been set at band E - by 1 April 201824, 25. Furthermore, from 1 April 2016, tenants in F and G rated dwellings may legally request an upgrade to the dwelling to a minimum of a band E. Results relating to LAHS statistics and EPC ratings can be found in Section 4.2.
2.5 The Energy Company Obligation (ECO) The Energy Companies Obligation (ECO) requires energy companies to assist in the installation of energy efficiency measures in Great Britain to low income and vulnerable households or those living in hard-to-treat (HTT) properties. Under the ECO, energy companies are obliged to meet targets expressed as carbon or costs saved. There have been several ECO schemes to date, with a new scheme set to start in October 2018:
• ECO1 - ran from January 2013 to March 2015 • ECO2 - launched on 1 April 2015 and ended on 31 March 2017 • ECO2t - was an 18 month extension to the ECO2 scheme until September 201826, 27 as a
transition period between the end of ECO2 and a new scheme. • ECO328- the new scheme is still at consultation phase but it is planned to start in October 2018
and run for 3.5 years to the end of March 2022
2.5.1 Current scheme – ECO2t The 2 different ECO obligations under the current scheme are:
• Carbon Emissions Reduction Obligation (CERO)
24 http://www.legislation.gov.uk/uksi/2015/962/contents/made
25 Although landlords will still be able to rent out F and G rated properties after this date they will not be able to renew or sign a new contract.
26 Energy Company Obligation (ECO): Help to Heat: https://www.gov.uk/government/consultations/energy-company-obligation-eco-help-to-heat
27 https://www.gov.uk/government/uploads/system/uploads/attachment_data/file/586266/ECO_Transition_Final_Stage_IA__For_Publication_.pdf
28 https://beisgovuk.citizenspace.com/home-local-energy/eco3-2018-2022/supporting_documents/ECO3%20consultation.pdf

Integrated Dwelling Level Housing Stock Modelling and Database
Commercial in Confidence
Template Version V2-082014
© Building Research Establishment Ltd
Report No. QUO-01528-F6X3H0
Page 21 of 110
• Home Heating Cost Reduction Obligation (HHCRO) or Affordable Warmth The ECO obligation known as the Carbon Saving Community Obligation (CSCO) was terminated on 31st March 2017.
An understanding of the ECO criteria is pivotal to building a local authority’s strategy for levering in finance to improve the energy efficiency of the stock. Of particular interest under ECO2t are properties with solid walls. There is an expectation that around 32,000 solid wall properties will be insulated over the 18 month period of ECO2t. A new ‘Rural Safeguard’ requirement is also introduced to ensure that 15% of each Energy Company’s CERO obligation is delivered in rural areas. From 1 April 2017 a deemed scoring system has been introduced29 to determine the level of carbon and cost savings from ECO installations. Deemed scoring uses a matrix to estimate the carbon savings that can be achieved from energy efficiency improvements, replacing the previous system whereby RdSAP was used to produce an EPC. The deemed scores are “lifetime scores” which means that they include all applicable lifetimes, in-use factors, relevant HHCRO multipliers and a 30% uplift for all scores.
Other changes of note for ECO2t:
• The HHCRO funding stream will become the scheme’s primary obligation and will account for 70% of all activity. Energy companies must collectively achieve £2.76 billion in life time savings.
• The CERO funding stream will account for the remaining 30% of activity. Energy companies must collectively achieve savings of 7.3MtCO2.
• Local authorities will be able to refer certain vulnerable residents for support under HHCRO regardless of their benefit entitlements through ‘Flexible Eligibility’.
• For solid wall insulation projects, local authorities can also refer non-vulnerable residents for support through HHCRO providing at least two thirds of the project consist of vulnerable residents.
2.5.2 New scheme – ECO3 While the new scheme is currently still at consultation phase, the following is a summary of what was put forward in the consultation. ECO3 will focus on Affordable Warmth (the Carbon Emissions Reduction Obligation – CERO – will be removed) so that low income and vulnerable households are the recipients of the main benefits. The scope of the Affordable Warmth group will be expanded to include other benefits (e.g. Child Benefit, Personal Independence Payment, etc.).
In terms of measures and improvements, the focus will be on replacing electric storage heaters with central heating, improve 17,000 solid wall dwellings every year, replace broken heating systems (maximum of 35,000 per year), encourage the replacement of heating systems only when also installing certain types of insulation. In addition, Renewable Heat Incentive measures would not be eligible under ECO3, and suppliers would be able to meet up to 10 – 20% of their obligation through “innovative measures”.
The results for the basic energy efficiency variables are covered in this report and assist in the identification of dwellings which may benefit from energy efficiency improvements. Such information also provides a valuable contribution to the evidence base increasingly being required to support competitive funding bids to central government for housing improvements.
29 https://www.ofgem.gov.uk/system/files/docs/2016/05/deemed_scores_consultation_-_main_0.pdf

Integrated Dwelling Level Housing Stock Modelling and Database
Commercial in Confidence
Template Version V2-082014
© Building Research Establishment Ltd
Report No. QUO-01528-F6X3H0
Page 22 of 110
3 Overview of the BRE Dwelling Level Housing Stock Modelling approach
3.1 Overview This section provides a simplified overview of the BRE dwelling level housing stock modelling approach. More detail on the methodology is provided in Appendix B.
A stock modelling approach has been developed and used by BRE for many years and dwelling level models are used to estimate the likelihood of a particular dwelling meeting the criteria for each of the key indicators (and other outputs of interest). These outputs can then be mapped to provide the council with a geographical distribution of each of the key indicators which can then be used to target resources for improving the housing stock. The process itself is actually made up of a variety of data sources, calculations and models.
The models are principally informed by the Ministry of Housing, Communities and Local Government’s (MHCLG) English Housing Survey (EHS)30. The survey is not used to supply data for the database, but rather it allows the identification of patterns in the housing stock, so that this knowledge can be applied, in the form of mathematical algorithms, to impute key indicators and energy characteristics from other data available at the national level. The particular approach for Bedford, however, makes significant use of the Experian UK Consumer Dynamics Database of dwelling and household indicators as inputs to the models. One example is the BRE SimpleCO2 Model which is based on dwelling level inputs from Experian and expands on these using imputation techniques to provide sufficient information to calculate the likely energy efficiency of each dwelling in the stock. Some of the key housing indicators, such as HHSRS excess cold category 1 hazards and BRE’s SimpleSAP31, can be directly inferred from this data.
The BRE Housing Stock Model and Database, incorporates EPC data, to produce an integrated housing stock model and database. The additional data provided and how it was used is as follows:
• EPC data – EPCs contain data on key dwelling energy characteristics (e.g. wall type and insulation, loft insulation, heating types etc.) and where these were available they were used in preference to the modelled data. It should be noted that to comply with bulk EPC data licencing requirements the EPC data is only used to inform the energy efficiency aspects of the model.
Figure 1 shows a simplified flow diagram of the overall BRE housing stock modelling approach and how the additional data is incorporated to produce the integrated Housing Stock Condition Database (HSCD).
The process is made up of a series of data sources and models which, combined with various imputation and regression techniques and the application of other formulae, make up the final database. The database is essentially the main output of the modelling and provides information on the key indicators and other data requirements (e.g. energy efficiency variables). More detailed information on the data sources and models is provided in Appendix B, but to summarise:
30 The most recent survey used in the housing stock models is 2014.
31 A Simplified version of the SAP model that produces an output broadly comparable to SAP. The SimpleSAP model is distinct from both full SAP and RD SAP in that uses a smaller, simplified set of inputs.

Integrated Dwelling Level Housing Stock Modelling and Database
Commercial in Confidence
Template Version V2-082014
© Building Research Establishment Ltd
Report No. QUO-01528-F6X3H0
Page 23 of 110
The data sources are: EHS, EPC, Experian, Ordnance Survey (OS) MasterMap, other local data (if available)
The Models are: SimpleSAP, Fuel Poverty, HHSRS (all hazards, falls hazards and excess cold), Disrepair and Low Income Households.
The data sources and models are linked as shown in the flow diagram and the modelling process itself can be divided into “energy inputs” and “other inputs”, which are summarised as follows:
Energy inputs - are developed from Experian, EPC and other local data sources (if available). The EHS data is used to impute (using cold deck imputation32) and interpolate where there are gaps in the data. The “energy inputs” are then fed into the SimpleCO2 Model to produce the “energy outputs” for the database plus information on excess cold for the HHSRS Model and information on energy costs for the Fuel Poverty Model.
Other inputs – are developed from Experian, OS MasterMap and other local data sources. The EHS data is used to impute (using cold deck imputation32) and interpolate where there are gaps in the data. The “other inputs” are then fed into the HHSRS, Disrepair, and Low Income Models (note that tenure data is fed directly into the database). Information from the EHS also feeds into the Fuel Poverty, HHSRS, Disrepair and Low Income Models.
32 Cold deck imputation is a process of assigning values in accordance with their known proportions in the stock.

Integrated Dwelling Level Housing Stock Modelling and Database
Commercial in Confidence
Template Version V2-082014
© Building Research Establishment Ltd
Report No. QUO-01528-F6X3H0
Page 24 of 110
Figure 1: Simplified flow diagram of overall BRE housing stock modelling approach (N.B. the EHS data is only used to inform the mathematical algorithms of the model – it does not provide data)
BRE housing stock modelling process Data
Integration of additional data Imputed (cold deck)
Data used for imputation & interpolation Information
Outputs
Experian data
EHS data Energy inputs
BRE SimpleCO2 Model (BREDEM-based model)
Energy outputs:
SimpleCO2 SimpleSAP Excess cold
Energy demand Energy cost
Other inputs
Local data
OS MasterMap data EPC data
Fuel Poverty Model
HHSRS ‘Falls’ & ‘Other’ Model
Disrepair Model
Low Income Model
BRE Integrated Housing Stock Database (dwelling level)
Key indicators: House condition Energy efficiency
Household vulnerability +
EPC, category 1 hazards, HMOs Energy efficiency variables, energy
planning variables
tenure Loft & wall insulation
formula
formulae

Integrated Dwelling Level Housing Stock Modelling and Database
Commercial in Confidence
Template Version V2-082014
© Building Research Establishment Ltd
Report No. QUO-01528-F6X3H0
Page 25 of 110
3.2 Breakdown of the housing stock by tenure - validation Providing the results split by tenure is useful since it can have an effect on how resources and improvement policies are targeted. This report is particularly focussed on private sector stock which is made up of owner occupied and private rented dwellings. The remainder of the housing stock consists of social housing.
The total number of dwellings in Bedford from the integrated housing stock condition database is based on OS AddressBase data; therefore the model is based on this value. The tenure split within the integrated database is derived from the purchased Experian tenure variable for addresses where tenure has not been supplied by the council.
Since it is possible for private rented dwellings to become owner occupied and vice versa relatively easily, it is difficult to accurately predict the actual tenure split at any given point in time. A validation process was undertaken to compare the tenure split from the database to the 2011 Census figures33. The results of the validation exercise show the differences between the tenure split from the database compared to the Census figures. There has been a noticeable increase in the size of the stock, mainly comprised of an increase in the size of the private rented tenure (see Figure 2). Furthermore, Maps 1 and 2 show the geographical distributions of the private rented sector which look similar, again giving confidence that the integrated database provides a good overview of the housing stock in Bedford.
Figure 2: Tenure split – comparison of BRE Housing Stock Condition Database outputs with 2011 Census figures for Bedford
Owner occupied Private rented Social Total
Database 44,991 17,575 12,816 75,382
2011 Census 42,602 10,958 10,252 63,812
0
10,000
20,000
30,000
40,000
50,000
60,000
70,000
80,000
No
. o
f d
we
llin
gs
Tenure
33 http://www.ons.gov.uk/ons/datasets-and-tables/index.html

Integrated Dwelling Level Housing Stock Modelling and Database
Commercial in Confidence
Template Version V2-082014
© Building Research Establishment Ltd
Report No. QUO-01528-F6X3H0
Page 26 of 110
Map 1: Distribution of estimated percentage of private rented dwellings in Bedford – based on database
Map 2: Distribution of estimated percentage of private rented dwellings in Bedford – based on 2011 Census Data (Neighbourhood Statistics)

Integrated Dwelling Level Housing Stock Modelling and Database
Commercial in Confidence
Template Version V2-082014
© Building Research Establishment Ltd
Report No. QUO-01528-F6X3H0
Page 27 of 110
3.2.1 Other national datasets relating to tenure In addition to the Census data there are other national datasets available which provide information on tenure; these are MHCLG returns34 and Office for National Statistics (ONS) data35. These datasets are not used directly in the model but are reported here for the purposes of comparison.
The MHCLG returns provide estimates of the tenure split by private sector and social sector only, with the former being based on projections from the 2011 census as a starting point, and the latter being based on Local Authority Housing Statistics. The tenure split used in the BRE Housing Stock Model is compared to this at an early stage of the project in order to ensure the tenure split is consistent36.
The ONS data provides subnational (local authority level) data on the dwelling stock broken down into tenure. The ONS split between owner occupied and private rented stock is based on their Annual Population Survey (APS)37 which is then benchmarked to the MHCLG returns. The APS is based on “persons who regard the sample address as their main address and also those who have lived in the dwelling for more than 6 consecutive months, even if they do not regard this as their principal dwelling”. This methodology may under-estimate the proportion of private rented dwellings for several reasons:
1. By only including those people who have lived in a dwelling for more than 6 consecutive months, the number of private rented households may be under-estimated as there tends to be a higher turnover in this sector.
2. By only including persons who regard the sample address as their main address there are two groups where this may have an impact on the estimated figures:
a. Students renting away from home who assume their parents’ address to be their main residence.
b. Commuter areas where households may have a city flat during the week and also have a suburban family home which they class as their first residence. Commuter towns close to large cities may also have higher levels of private rented stock with a high turnover of tenants near rail stations for example.
In addition, the ONS dataset uses EHS data but this is limited to using the occupancy rate to allow for vacant dwellings as their APS is based on individuals and therefore does not account for vacant dwellings.
34 https://www.gov.uk/government/statistical-data-sets/live-tables-on-dwelling-stock-including-vacants
35 https://www.ons.gov.uk/peoplepopulationandcommunity/housing/articles/researchoutputssubnationaldwellingstockbytenureestimatesengland2012to2015/2017-12-04#methodology
36 This comparison is checked early on in the project through email correspondence with the authority.
37 https://www.ons.gov.uk/employmentandlabourmarket/peopleinwork/employmentandemployeetypes/methodologies/annualpopulationsurveyapsqmi

Integrated Dwelling Level Housing Stock Modelling and Database
Commercial in Confidence
Template Version V2-082014
© Building Research Establishment Ltd
Report No. QUO-01528-F6X3H0
Page 28 of 110
It is important to note that the ONS data is not an official statistic and that a disclaimer38 must be used when reproducing the data (note that the “dwelling stock by tenure” in the disclaimer refers to the MHCLG returns data).
Table 2 shows the latest tenure splits for the DCLG and the ONS data for Bedford. Since the ONS data is benchmarked to the MHCLG returns, the figures for the private sector stock match. Both the numbers, and the proportions, are very similar to the BRE Model estimates.
Table 2: Comparison of MHCLG, ONS and BRE Database figures on tenure split for Bedford N.B. DCLG data does not break down private sector into owner occupied and private rented and ONS data does not provide an estimate for social stock
2015 MHCLG 2015 ONS BRE Database 2015 MHCLG 2015 ONS BRE Database
Owner occupied 46,973 44,991 66% 60%
Private rented 11,407 17,575 16% 23%
Social 12,350 - 12,816 17% - 17%
Tenure
58,380
Number of dwellings % of all stock
83%
38 ONS Disclaimer: “We are producing these Research Outputs to provide the tenure breakdown of dwellings within the private sector at the subnational level, which are currently only available at the country level. However, these Research Outputs are not official statistics and must not be reproduced without this disclaimer. Research Outputs are produced to provide information about new methods and data sources being investigated. There are official statistics available on dwelling stock by tenure34 for local authorities, which you should refer to if you require official statistics. These provide the total private sector stock for each area, but do not provide a breakdown of owner-occupied and privately-rented dwellings.”

Integrated Dwelling Level Housing Stock Modelling and Database
Commercial in Confidence
Template Version V2-082014
© Building Research Establishment Ltd
Report No. QUO-01528-F6X3H0
Page 29 of 110
4 Results from the BRE Dwelling Level Housing Stock Models and Housing Stock Condition Database (HSCD)
As described in the previous section, the housing stock modelling process consists of a series of different stock models with the main output being the database. The results in this section have been obtained from interrogating the database at the level of the local authority as a whole to give a useful overview for Bedford. Information at ward level, however, is provided in the maps, in Section 4.2.4 and can also be obtained from the database which has been supplied as part of this project (see Appendix C for instructions). The database can be interrogated at local authority, ward, medium super output area (MSOA), lower super output area (LSOA), census output area (COA), postcode or dwelling level.
The first sub-section below provides a map of the wards in Bedford. The results are then displayed in the following sub-sections:
• Key indicators: o Bedford – regional and national comparisons o Key indicators by tenure for Bedford o Key indicators mapped by COA for Bedford private sector stock o Ward level results for the key indicators
• Information relating to LAHS reporting and EPC ratings – estimates of:
o Category 1 hazards o HMOs o EPC ratings
• Energy efficiency variables for Bedford (wall and loft insulation)
• Energy planning variables for Bedford
• Improvement scenarios

Integrated Dwelling Level Housing Stock Modelling and Database
Commercial in Confidence
Template Version V2-082014
© Building Research Establishment Ltd
Report No. QUO-01528-F6X3H0
Page 30 of 110
4.1 Overview of Bedford Map 3 below shows the 27 wards in Bedford. The data in the report is separated into wards and then further divided into Census Output Areas (COAs). These typically comprise around 125 households and usually include whole postcodes, which have populations that are largely similar. Where the COAs are smaller in size on the map this typically represents a more densely populated area since each COA represents a similar number of dwellings.
It should be noted that some residential addresses are not considered suitable for modelling and these have been removed. These include caravans and house boats which, whilst covered by the EHS, are quite uncommon, and the energy models and other housing indicators were not developed with dwellings such as these in mind. Residential institutions (e.g. care homes) have also been removed as it is not entirely appropriate to apply the usual models to these dwellings. The removal of these addresses may result in a COA not appearing to contain any dwellings due to the fact that all c.125 households are made up of caravans for example.
Map 3: The wards in Bedford

Integrated Dwelling Level Housing Stock Modelling and Database
Commercial in Confidence
Template Version V2-082014
© Building Research Establishment Ltd
Report No. QUO-01528-F6X3H0
Page 31 of 110
4.2 Key indicators
4.2.1 Bedford – regional and national comparisons Table 3 and Figure 3 show the results for each of the key indicators in Bedford compared to the East of England region and to England (EHS 2014) and split into all stock and private sector stock. Figure 4 shows the results of the SimpleSAP ratings.
For all stock, the performance of the housing stock in Bedford compared to the EHS England average is mixed. Bedford performs better for disrepair (3% compared to 5%), fuel poverty (10% definition) (11% compared to 12%), fuel poverty (Low Income High Costs definition) (9% compared to 11%), and low income households (23% compared to 27%). However, Bedford performs worse for excess cold (4% compared to 3%). When comparing Bedford to the East of England region, the picture is slightly different with Bedford performing similarly for most indicators, with the exception of low income households where there are a higher proportion in Bedford compared to the regional average. Comparing Bedford to the EHS England average figures for the private sector stock, Bedford has similar levels of excess cold but slightly higher levels of all hazards and fall hazards. However, levels of disrepair, fuel poverty (Low Income High Costs definition) and low income housholds are lower than the England average for the private sector stock. Compared with the regional average, the private stock in Bedford is generally better or the same for all indicators, with the exception of fall hazards which is slightly higher in Bedford. The average SimpleSAP ratings in Bedford (Figure 4) are slightly lower than the England averages, and the same as the regional averages, for both all stock and the private sector stock.
Table 3: Estimates of the numbers and percentage of dwellings meeting the key indicator criteria assessed by the Housing Stock Models and Housing Stock Condition Database for all stock and private sector stock – Bedford compared to the East of England and England (EHS 2014)
Bedford (no.) Bedford (%)2014 EHS
Regional (%)
2014 EHS
England (%)Bedford (no.) Bedford (%)
2014 EHS
Regional (%)
2014 EHS
England (%)
75,382 - - - 62,566 - - -
All hazards 9,320 12% 13% 12% 8,711 14% 14% 13%
Excess cold 2,966 4% 5% 3% 2,779 4% 6% 4%
Fall hazards 5,435 7% 7% 7% 5,147 8% 8% 7%
2,175 3% 3% 5% 1,899 3% 3% 5%
7,933 11% 11% 12% 6,783 11% 11% 11%
6,416 9% 9% 11% 5,281 8% 9% 10%
16,996 23% 21% 27% 8,689 14% 13% 18%
Private sector stock
No. of dwellings
Fuel poverty (10%)
Indicator
All stock
HHSRS
category 1
hazards
Disrepair
Fuel poverty (Low Income High Costs)
Low income households
N.B. the information on estimated hazards refers to the number of dwellings with a hazard of the stated type. Because of this there is likely to be some overlap – for example, some dwellings are likely to have excess cold and fall hazards but this dwelling would only be represented once under ‘all hazards’. The number of dwellings under ‘all hazards’ can therefore be less than the sum of the excess cold plus fall hazards.

Integrated Dwelling Level Housing Stock Modelling and Database
Commercial in Confidence
Template Version V2-082014
© Building Research Establishment Ltd
Report No. QUO-01528-F6X3H0
Page 32 of 110
Figure 3: Estimates of the percentage of dwellings meeting the key indicator criteria assessed by the Housing Stock Models and Housing Stock Condition Database for all stock and private sector stock – Bedford compared to the East of England and England (EHS 2014)
0% 10% 20% 30%
Low incomehouseholds
Fuel poverty (LowIncome High Costs)
Fuel poverty (10%)
Disrepair
Fall hazards
Excess cold
All hazards
% of dwellings
Ke
y in
dic
ato
rs
Bedford all stock
EHS East of England Region 2014all stock
EHS England 2014 all stock
Bedford private stock
EHS East of England Region 2014private stock
EHS England 2014 private stock
Figure 4: Average SimpleSAP ratings for all stock and private sector stock – Bedford compared to the East of England and England (EHS 2014)
60 60 61 59 59 60
0
10
20
30
40
50
60
70
Bedford all stock EHS East ofEngland Region2014 all stock
EHS 2014 allstock
Bedford privatestock
EHS East ofEngland Region
2014 privatestock
EHS 2014 privatestock
Sim
ple
SA
P r
ati
ng

Integrated Dwelling Level Housing Stock Modelling and Database
Commercial in Confidence
Template Version V2-082014
© Building Research Establishment Ltd
Report No. QUO-01528-F6X3H0
Page 33 of 110
4.2.2 Key indicators by tenure – Bedford The private sector stock can be further split by tenure – owner occupied and private rented - with the difference between total private sector stock and total housing stock being the social housing stock. Table 4 and Figure 5 below show the results for each of the key indicators split by tenure and Figure 6 shows the SimpleSAP ratings by tenure.
The social stock is generally better than the private sector stock across the majority of indicators including SimpleSAP. Social stock tends be more thermally efficient than the private stock partly due to the prevalence of flats, and partly due to being better insulated owing to the requirements placed on social housing providers, for example through the Decent Homes Programme. As would be expected, the social stock is significantly worse than the private sector stock for the low income households indicator. For fuel poverty, however, the owner occupied and private rented tenures have the highest levels for the 10% definition, and the private rented tenure has the highest levels for the Low Income High Costs definition.
The social data should be treated with some caution as the social rented stock, particularly when largely comprising stock owned by a single landlord, is more difficult to model than the private sector. This is because the decisions of an individual property owner usually only affect a single dwelling out of the thousands of private sector stock whereas the policies and decisions of a single landlord can have a very great effect on a large proportion of the social stock. The social rented results are therefore best considered as a benchmark which takes account of the age, type, size and tenure against which the landlord’s own data could be compared.
Focussing on the tenures within the private sector stock, the private rented stock and the owner occupied stock have similar levels of fuel poverty (10% definition). The private rented stock has higher levels for all the other indicators – in particular low income households.
Table 4: Estimates of the numbers and percentage of dwellings meeting the key indicator criteria assessed by the Housing Stock Models and Housing Stock Condition Database by tenure for Bedford
No. % No. % No. %
44,991 - 17,575 - 12,816 -
All hazards 5,866 13% 2,845 16% 609 5%
Excess cold 1,946 4% 833 5% 187 1%
Fall hazards 3,580 8% 1,567 9% 288 2%
1,147 3% 752 4% 276 2%
4,769 11% 2,014 11% 1,150 9%
3,456 8% 1,825 10% 1,135 9%
4,698 10% 3,991 23% 8,307 65%
Owner occupiedSocial stock
No. of dwellings
Private rented
Low income households
HHSRS
category 1
hazards
Disrepair
Fuel poverty (10%)
Fuel poverty (Low Income High Costs)
Indicator
Private sector stock
N.B. the information on estimated hazards refers to the number of dwellings with a hazard of the stated type. Because of this there is likely to be some overlap – for example, some dwellings are likely to have excess cold and fall hazards but this dwelling would only be represented once under ‘all hazards’. The number of dwellings under ‘all hazards’ can therefore be less than the sum of the excess cold plus fall hazards.

Integrated Dwelling Level Housing Stock Modelling and Database
Commercial in Confidence
Template Version V2-082014
© Building Research Establishment Ltd
Report No. QUO-01528-F6X3H0
Page 34 of 110
Figure 5: Estimates of the percentage of dwellings meeting the key indicator criteria assessed by the Housing Stock Models and Housing Stock Condition Database by tenure for Bedford
0% 20% 40% 60% 80%
Low incomehouseholds
Fuel poverty (LowIncome High Costs)
Fuel poverty (10%)
Disrepair
Fall hazards
Excess cold
All hazards
% of dwellings
Ke
y in
dic
ato
rs
Private sector stock -owner occupied
Private sector stock -private rented
Social stock
Figure 6: Average SimpleSAP ratings by tenure for Bedford
5861 63
0
10
20
30
40
50
60
70
Private sector stock -owner occupied
Private sector stock -private rented
Social stock
Sim
ple
SAP
Sco
re

Integrated Dwelling Level Housing Stock Modelling and Database
Commercial in Confidence
Template Version V2-082014
© Building Research Establishment Ltd
Report No. QUO-01528-F6X3H0
Page 35 of 110
4.2.3 Key indicators mapped by Census Output Area (COA) – Bedford private sector stock
Some of the key indicators are also provided in map form below along with a brief description of each indicator39, thus enabling quick observation of the geographical distribution of properties of interest. The maps show the percentages of private sector dwellings in each Census Output Area (COA) that are estimated to have each of the key indicators.
The ranges shown in the map keys are defined based on the Jenks’ Natural Breaks algorithm of the COA statistics40. The outputs in the lightest and darkest colours on the maps show the extreme ends of the range, highlighting the best and the worst areas.
Maps at COA level are provided for the following key indicators in Map 4 to Map 12 below:
• HHSRS o The estimated presence of a category 1 HHSRS hazard o The estimated presence of a category 1 hazard for excess cold o The estimated presence of a category 1 hazard for falls
• Estimated levels of disrepair • Estimated levels of fuel poverty (Low Income High Costs and 10% definitions) • Estimated low income households
o Dwellings occupied by low income households o Dwellings with a category 1 excess cold hazard that are occupied by a low income household
• The estimated average SimpleSAP41 rating
In addition, maps have been provided for HMOs, EPC ratings, energy efficiency variables (uninsulated cavity walls, solid walls, loft insulation) and energy planning variables (energy demand/cost and heat demand/cost).
These maps are extremely useful in showing the geographical distribution for single key indicators. Maps can also be produced for a combination of indicators, such as dwellings with an excess cold hazard which
39 See Appendix A for full definitions.
40 The natural breaks classification method is a data clustering method determining the best arrangement of values into different classes. It is achieved through minimising each class’s average deviation from the class mean while maximising each class’s deviation from the means of the other groups. The method seeks to reduce the variance within classes and maximise variance between classes thus ensuring groups are distinctive.
41 Important note: Whilst it is possible to provide “SimpleSAP” ratings from the "SimpleCO2” software, under no circumstances must these be referred to as “SAP” as the input data is insufficient to produce an estimate of SAP or even RdSAP for an individual dwelling that meets the standards required by these methodologies.

Integrated Dwelling Level Housing Stock Modelling and Database
Commercial in Confidence
Template Version V2-082014
© Building Research Establishment Ltd
Report No. QUO-01528-F6X3H0
Page 36 of 110
are also occupied by low income households, as shown in Map 11. Appendix D provides close up maps for each indicator, focussing on the urban area of Bedford.
The maps are produced at COA level, which is typically made up of 125 households, usually including whole postcodes and having similar sized populations. Using the first map below (Map 4) as an example, it can be seen that each ward is split into several COAs and, in this instance there are 15 COAs that have 39 - 63% of private sector dwellings estimated to have the presence of a category 1 hazard.
The maps also highlight the differences between areas, showing that the results for some areas are much worse than for others and these are the specific areas which might warrant attention. The maps also show that even within wards there can be large differences between the results at COA level.
4.2.3.1 HHSRS The Housing Health and Safety Rating System (HHSRS) is a risk-based evaluation tool to help local authorities identify and protect against potential risks and hazards to health and safety from any deficiencies identified in dwellings. It was introduced under the Housing Act 20048 and applies to residential properties in England and Wales.
The HHSRS assesses 29 categories of housing hazard. Each hazard has a weighting which will help determine whether the property is rated as having a category 1 (serious) hazard42.
The HHSRS estimated category 1 hazards map (Map 4) shows that there are concentrations of high levels of category 1 hazards scattered across the area but with higher concentrations generally towards northern parts of the area. The data behind the map shows that the wards with the highest levels overall are Wyboston, Riseley and Queens Park. Maps D.1 focusses in on the north of Bedford and it can be seen that in Queens Park ward the highest levels are in COAs to the south east of this ward.
Looking at the estimated distribution of excess cold hazards in Bedford there are again higher concentrations towards the north of the area – see Map 5. The data behind the map shows that the highest levels overall are in Wyboston, Riseley and Harrold but there are also higher concentrations elsewhere – for example to the south west of Great Barford ward. Map D.2 looks more closely at the urban area of Bedford and shows that levels of excess cold are relatively low here.
The estimated distribution of fall hazards is shown in Map 6 which indicates that the high concentrations are scattered across the district, with some of the higher concentrations found in the urban area of Bedford across central and northern areas. The data behind this shows that the wards with the highest levels of fall hazards are Queens Park, Cauldwell and Kempston Central and East. Map D.3 zooms in on the urban parts of Bedford. Some of the highest levels are to the centre of Queens Park ward, central parts of Cauldwell ward and to the north of Kempston Central and East ward. There are COAs with higher concentrations of fall hazards elsewhere; for example to the east of Castle ward and to the north of Kingsbrook ward.
42 Housing Health and Safety Rating System Operating Guidance, ODPM, 2006

Com
mercial in confidence
©
Building Research E
stablishment Ltd
R
eport No. Q
UO
-01528-F6X3H
0
Template V
ersion V2-082014
Page 37 of 110
Integrated Dw
elling Level Housing Stock M
odelling and Database
Map 4: Percentage of private sector dwellings in Bedford with an estimated presence of a HHSRS category 1 hazard

Com
mercial in confidence
©
Building Research E
stablishment Ltd
R
eport No. Q
UO
-01528-F6X3H
0
Template V
ersion V2-082014
Page 38 of 110
Integrated Dw
elling Level Housing Stock M
odelling and Database
Map 5: Percentage of private sector dwellings in Bedford with an estimated presence of a HHSRS category 1 hazard for excess cold

Com
mercial in confidence
©
Building Research E
stablishment Ltd
R
eport No. Q
UO
-01528-F6X3H
0
Template V
ersion V2-082014
Page 39 of 110
Integrated Dw
elling Level Housing Stock M
odelling and Database
Map 6: Percentage of private sector dwellings in Bedford with an estimated presence of a HHSRS category 1 hazard for falls

Integrated Dwelling Level Housing Stock Modelling and Database
Commercial in Confidence
Template Version V2-082014
© Building Research Establishment Ltd
Report No. QUO-01528-F6X3H0
Page 40 of 110
4.2.3.2 Disrepair
The disrepair indicator used in this report is based on the disrepair component of the Decent Homes Standard43,44. Other rating systems including the HHSRS are also available. Under the Decent Homes standard, a dwelling fails the disrepair component if:
• One or more key building components are old and, because of their condition, need replacing or major repair; or
• Two or more other building components are old and, because of their condition, need replacement or major repair.
Key building components are those which, if in poor condition, could have an immediate impact on the integrity of the building and cause further deterioration in other components. They are the external components plus internal components that have potential safety implications and include:
• External walls • Roof structure and covering • Windows/doors • Chimneys • Central heating boilers • Electrics
If any of these components are old, and need replacing or require major repair, then the dwelling is not in a reasonable state of repair.
Other building components are those that have a less immediate impact on the integrity of the dwelling. Their combined effect is therefore considered, with a dwelling failing the disrepair standard if two or more elements are old and need replacing or require immediate major repair.
Map 7 shows the distribution of dwellings estimated to be in disrepair in Bedford and indicates that there are pockets of higher levels of disrepair across the area, particularly towards the centre of Bedford. The data behind the map shows that the highest levels overall are in the wards of Castle, Queens Park and Cauldwell. Map D.4 zooms in on the urban area of Bedford and shows that the highest levels of disrepair are seen in northern parts of Castle ward, to the south east of Queens Park ward and to the to the north of Cauldwell ward. There are COAs with high concentrations of disrepair elsewhere, for example to the west of De Parys ward and the north west of Newnham ward.
43 https://www.gov.uk/government/publications/a-decent-home-definition-and-guidance
44 There are 4 components to the Decent Homes Standard – HHSRS, disrepair, modernisation and thermal comfort

Com
mercial in confidence
©
Building Research E
stablishment Ltd
R
eport No. Q
UO
-01528-F6X3H
0
Template V
ersion V2-082014
Page 41 of 110
Integrated Dw
elling Level Housing Stock M
odelling and Database
Map 7: Percentage of private sector dwellings in Bedford estimated to be in disrepair

Integrated Dwelling Level Housing Stock Modelling and Database
Commercial in Confidence
Template Version V2-082014
© Building Research Establishment Ltd
Report No. QUO-01528-F6X3H0
Page 42 of 110
4.2.3.3 Fuel poverty
The current fuel poverty definition is known as the Low Income High Costs indicator. This is a dual indicator which firstly provides an indication of the number of households in fuel poverty and secondly an indication of the cost (in £) to remove households from fuel poverty – this cost is referred to as the Fuel Poverty Gap45.
A household is said to be in fuel poverty if they have required fuel costs that are above average (the national median level) and were they to spend that amount they would be left with a residual income below the official poverty line (see the shaded area in Figure 7 below). For the purposes of this report this is termed “fuel poverty (Low Income High Costs)”.
Figure 7: A representation of the Low Income High Costs definition of fuel poverty46
As the Low Income High Cost fuel poverty indicator is a relative measure, it provides a steady trend in the number of fuel poor households over time. A change in income will only have an impact on fuel poverty if households with low incomes and high costs see relatively larger income changes (increases or decreases) than the overall average change in income.
In contrast, the fuel poverty gap is more responsive to changes in energy prices and the economy, therefore providing a clearer measure of the depth of fuel poverty among those fuel poor households. This measure is therefore more useful for identifying trends in fuel poverty over time.
45 DECC, Annual Fuel Poverty Statistics Report, 2016 – England (National Statistics), 20 June 2016
46 Hills, J. Getting the measure of fuel poverty – Final Report of the Fuel Poverty Review, London: LSE., 2012

Integrated Dwelling Level Housing Stock Modelling and Database
Commercial in Confidence
Template Version V2-082014
© Building Research Establishment Ltd
Report No. QUO-01528-F6X3H0
Page 43 of 110
Map 8 shows that, based on the Low Income High Costs definition, there are areas of higher concentrations towards the north of the area. The wards with the highest concentrations overall are Wyboston, Riseley and Queens Park. The highest concentrations of fuel poverty are in COAs to the east and west of Wyboston ward, to the north and south of Riseley ward and to the highest concentrations are in COAs to the north and the south of the ward, and COAs to the south east of Queens Park ward. Map D.5 provides more detail for the urban area of Bedford.
The national indicators for the fuel poverty gap are expressed as the average fuel poverty gap, which is the average amount of money required to lift a fuel poor household out of fuel poverty (£371 in England in 2014). The aggregated fuel poverty gap – i.e. the total amount of money required to lift all fuel poor households out of fuel poverty in England is £882 million (in 2014).
Figure 8 provides the national average fuel poverty gap figures by SAP band for private sector stock. By using the bandings based on the SimpleSAP model it is possible to estimate the aggregated fuel poverty gap within each band for the fuel poor households in Bedford. Figure 9 shows similar estimates for the private rented sector. The estimated aggregated fuel poverty gap for fuel poor households in the private sector in Bedford is just over £2 million, of which almost £1 million is from the private rented sector.
The 532 private rented housholds in fuel poverty living in dwellings with a SimpleSAP rating of F or G would require increases in income totalling around £0.5 million per year to lift them out of fuel poverty.
Figure 8: Aggregated fuel poverty gap figures for the private sector stock in Bedford by SAP band
Fuel Poor Households
Aggregated Fuel Poverty
Gap
£ Count £
(92-100) A
217 707 153,419
(39-54) E 481 1,842 886,002
(21-38) F (1-20) G
1,090 907 988,630
Bedford
(81-91) B (69-80) C (55-68) D
215
Average Fuel Poverty Gap
(England 2014)
0 0

Integrated Dwelling Level Housing Stock Modelling and Database
Commercial in Confidence
Template Version V2-082014
© Building Research Establishment Ltd
Report No. QUO-01528-F6X3H0
Page 44 of 110
Figure 9: Aggregated fuel poverty gap figures for the private rented sector stock in Bedford by SAP band
Fuel Poor Households
Aggregated Fuel Poverty
Gap
£ Count £
(92-100) A
188 280 52,640
(39-54) E 387 1,013 392,031
(1-20) G
Bedford
0 (81-91) B (69-80) C
1,033 532 549,556
0
Average Fuel Poverty Gap
(England 2014)
192
(21-38) F
(55-68) D
For completeness of information, and comparison with previous data, this report also includes an analysis of fuel poverty using the original definition. This states that a housholds is said to be in fuel poverty if it spends more than 10% of its income on fuel to maintain an adequate level of warmth (defined as 21oC for the main living area, and 18oC for other occupied rooms in the 2012 Hills Fuel Poverty Review47). For the purposes of this report this is referred to as “fuel poverty (10% definition)”.
Map 9 and Map D. 6 show the distribution of households in fuel poverty using the 10% definition. There is a similar pattern to the distribution of fuel poverty using the Low Income High Costs definition.
47 Hills J, Getting the measure of fuel poverty – Final Report of the Fuel Poverty Review, London: LSE, 2012

Com
mercial in confidence
©
Building Research E
stablishment Ltd
R
eport No. Q
UO
-01528-F6X3H
0
Template V
ersion V2-082014
Page 45 of 110
Integrated Dw
elling Level Housing Stock M
odelling and Database
Map 8: Percentage of private sector dwellings in Bedford estimated to be occupied by households in fuel poverty - Low Income High Costs definition

Com
mercial in confidence
©
Building Research E
stablishment Ltd
R
eport No. Q
UO
-01528-F6X3H
0
Template V
ersion V2-082014
Page 46 of 110
Integrated Dw
elling Level Housing Stock M
odelling and Database
Map 9: Percentage of private sector dwellings in Bedford estimated to be occupied by households in fuel poverty – 10% definition

Integrated Dwelling Level Housing Stock Modelling and Database
Commercial in Confidence
Template Version V2-082014
© Building Research Establishment Ltd
Report No. QUO-01528-F6X3H0
Page 47 of 110
4.2.3.4 Low income households
A low income household is defined as a household in receipt of:
• Income support • Housing benefit • Attendance allowance • Disability living allowance • Industrial injuries disablement benefit • War disablement pension • Pension credit • Child tax credit • Working credit
For child tax credit and working tax credit, the household is only considered a low income household if it has a relevant income of less than £15,860.
The definition also includes households in receipt of Council Tax reduction and income based Job Seekers Allowance.
Map 10 shows that concentrations of low income households are clustered towards the urban area of Bedford. The highest levels overall are found in Cauldwell, Kingsbrook and Queens Park. Map D. 7 provides more detail, showing, for example, that in Cauldwell ward most COAs have relatively high levels of low income households, with the highest concentrations being to the south east of this ward.
Map 11 provides an additional layer of information, with the data for low income households being combined with HHSRS excess cold data. This provides a vital picture of where vulnerable people are likely to be living in poor housing. The map indicates that there are pockets of both low income and excess cold mainly towards the north of the area. Map D.8 zooms in to provide more detail on the urban area of Bedford.

Com
mercial in confidence
©
Building Research E
stablishment Ltd
R
eport No. Q
UO
-01528-F6X3H
0
Template V
ersion V2-082014
Page 48 of 110
Integrated Dw
elling Level Housing Stock M
odelling and Database
Map 10: Percentage of private sector dwellings in Bedford estimated to be occupied by low income households

Com
mercial in confidence
©
Building Research E
stablishment Ltd
R
eport No. Q
UO
-01528-F6X3H
0
Template V
ersion V2-082014
Page 49 of 110
Integrated Dw
elling Level Housing Stock M
odelling and Database
Map 11: Percentage of private sector dwellings in Bedford with both an estimated presence of a HHSRS category 1 hazard for excess cold and estimated to be occupied by low income households

Integrated Dwelling Level Housing Stock Modelling and Database
Commercial in Confidence
Template Version V2-082014
© Building Research Establishment Ltd
Report No. QUO-01528-F6X3H0
Page 50 of 110
4.2.3.5 SimpleSAP
The average SimpleSAP map (Map 12) shows that areas with lower average SimpleSAP ratings are clustered throughout the Bedford area with a tendency towards the north of the area. Whilst no particular ward obviously dominates, the data behind the map shows that the wards with the lowest average SimpleSAP ratings are Wyboston, Riseley and Harrold. Map D.9 provides more details for the urban area of Bedford.
Lower SimpleSAP ratings can occur in areas with larger, older homes where little work has been done by the occupiers to improve energy performance. The size of the home itself is not a factor in SimpleSAP, but these homes are more likely to be semi-detached or detached, and therefore have larger heat loss areas.

Com
mercial in confidence
©
Building Research E
stablishment Ltd
R
eport No. Q
UO
-01528-F6X3H
0
Template V
ersion V2-082014
Page 51 of 110
Integrated Dw
elling Level Housing Stock M
odelling and Database
Map 12: Estimated average SimpleSAP ratings per dwelling in Bedford private sector stock

Integrated Dwelling Level Housing Stock Modelling and Database
Commercial in Confidence
Template Version V2-082014
© Building Research Establishment Ltd
Report No. QUO-01528-F6X3H0
Page 52 of 110
4.2.4 Ward level results for the key indicators The previous maps have provided a visual representation of the key indicators at Census Output Area (COA) level. The following tables provide the complete set of figures at ward level for the key indicators; firstly, for the total stock (Table 5) and secondly, for the private sector stock (Table 6), owner occupied sector stock (Table 7) and private rented sector stock (Table 8). This allows a direct comparison between the wards in Bedford.
Table 5: Total stock – estimated number and percentage of dwellings for each of the key indicators, and average SimpleSAP ratings by ward
All hazards
Excess cold
Fall hazards 10% LIHC
235 31 185 46 256 216 721( 6% ) ( 1% ) ( 5% ) ( 1% ) ( 7% ) ( 6% ) ( 20% )194 51 133 45 110 116 180
( 6% ) ( 2% ) ( 4% ) ( 1% ) ( 4% ) ( 4% ) ( 6% )726 164 413 228 593 387 1,262
( 15% ) ( 3% ) ( 9% ) ( 5% ) ( 12% ) ( 8% ) ( 26% )563 53 363 182 468 467 1,574
( 13% ) ( 1% ) ( 8% ) ( 4% ) ( 11% ) ( 11% ) ( 36% )215 45 157 47 169 144 350
( 12% ) ( 2% ) ( 8% ) ( 3% ) ( 9% ) ( 8% ) ( 19% )495 128 285 130 336 226 374
( 16% ) ( 4% ) ( 9% ) ( 4% ) ( 11% ) ( 7% ) ( 12% )210 82 126 48 197 171 589
( 9% ) ( 4% ) ( 6% ) ( 2% ) ( 9% ) ( 8% ) ( 26% )312 205 123 42 319 202 490
( 15% ) ( 10% ) ( 6% ) ( 2% ) ( 15% ) ( 10% ) ( 23% )351 37 264 87 392 389 1,623
( 8% ) ( 1% ) ( 6% ) ( 2% ) ( 9% ) ( 9% ) ( 39% )454 214 246 74 335 249 456
( 13% ) ( 6% ) ( 7% ) ( 2% ) ( 10% ) ( 7% ) ( 13% )584 124 344 183 537 404 1,168
( 14% ) ( 3% ) ( 8% ) ( 4% ) ( 12% ) ( 9% ) ( 27% )316 197 136 58 280 204 228
( 17% ) ( 11% ) ( 8% ) ( 3% ) ( 15% ) ( 11% ) ( 13% )419 57 290 99 387 325 856
( 13% ) ( 2% ) ( 9% ) ( 3% ) ( 12% ) ( 10% ) ( 27% )108 9 83 25 139 118 571
( 6% ) ( 1% ) ( 5% ) ( 1% ) ( 8% ) ( 7% ) ( 33% )393 196 193 82 299 222 630
( 12% ) ( 6% ) ( 6% ) ( 2% ) ( 9% ) ( 7% ) ( 19% )168 16 132 37 153 129 304
( 10% ) ( 1% ) ( 8% ) ( 2% ) ( 9% ) ( 7% ) ( 18% )225 23 169 80 181 150 650
( 11% ) ( 1% ) ( 8% ) ( 4% ) ( 9% ) ( 7% ) ( 31% )405 33 284 117 440 393 1,662
( 10% ) ( 1% ) ( 7% ) ( 3% ) ( 11% ) ( 10% ) ( 41% )Kingsbrook 4,054 62
Kempston West 2,086 63
Kempston North 1,721 63
Kempston Central and East 3,203 59
Kempston South 1,724 60
Kempston Rural 3,403 63
Great Barford 3,397 59
Goldington 4,164 62
Harrold 1,810 54
Harpur 4,297 61
De Parys 3,104 58
Clapham 1,867 59
Elstow 2,111 56
Eastcotts 2,257 63
Brickhill 3,687 61
Average SimpleSAPWard Dwellings
HHSRS category 1 hazardsDisrepair
Cauldwell 4,326 61
Castle 4,800 62
Fuel poverty Low income households
Bromham and Biddenham 3,075 61

Integrated Dwelling Level Housing Stock Modelling and Database
Commercial in Confidence
Template Version V2-082014
© Building Research Establishment Ltd
Report No. QUO-01528-F6X3H0
Page 53 of 110
Table 5 cont.: Total stock – estimated number and percentage of dwellings for each of the key indicators, and average SimpleSAP ratings by ward
All hazards
Excess cold
Fall hazards 10% LIHC
298 33 232 99 248 267 512( 9% ) ( 1% ) ( 7% ) ( 3% ) ( 7% ) ( 8% ) ( 15% )246 140 115 41 183 149 119
( 16% ) ( 9% ) ( 8% ) ( 3% ) ( 12% ) ( 10% ) ( 8% )240 16 196 54 205 193 428
( 8% ) ( 1% ) ( 6% ) ( 2% ) ( 7% ) ( 6% ) ( 14% )581 66 344 136 347 381 821
( 19% ) ( 2% ) ( 12% ) ( 5% ) ( 12% ) ( 13% ) ( 28% )326 242 108 44 308 211 229
( 22% ) ( 16% ) ( 7% ) ( 3% ) ( 21% ) ( 14% ) ( 15% )323 195 138 51 261 188 170
( 19% ) ( 11% ) ( 8% ) ( 3% ) ( 15% ) ( 11% ) ( 10% )165 55 112 34 124 100 366
( 9% ) ( 3% ) ( 6% ) ( 2% ) ( 7% ) ( 5% ) ( 19% )202 65 126 48 182 165 433
( 8% ) ( 2% ) ( 5% ) ( 2% ) ( 7% ) ( 6% ) ( 17% )566 489 138 58 484 250 230
( 36% ) ( 31% ) ( 9% ) ( 4% ) ( 30% ) ( 16% ) ( 14% )Wyboston 1,593 45
Sharnbrook 1,734 54
Riseley 1,490 52
Wootton 2,624 63
Wilshamstead 1,903 64
Oakley 1,530 55
Newnham 3,315 59
Queens Park 2,982 57
Putnoe 3,125 60
Ward Dwellings HHSRS category 1 hazards
DisrepairFuel poverty Low income
householdsAverage
SimpleSAP
N.B. the information on estimated hazards refers to the number of dwellings with a hazard of the stated type. Because of this there is likely to be some overlap – for example, some dwellings are likely to have excess cold and fall hazards but this dwelling would only be represented once under ‘all hazards’. The number of dwellings under ‘all hazards’ can therefore be less than the sum of the excess cold plus fall hazards.

Integrated Dwelling Level Housing Stock Modelling and Database
Commercial in Confidence
Template Version V2-082014
© Building Research Establishment Ltd
Report No. QUO-01528-F6X3H0
Page 54 of 110
Table 6: Private sector stock – estimated number and percentage of dwellings for each of the key indicators, and average SimpleSAP ratings by ward
All hazards
Excess cold
Fall hazards 10% LIHC
212 24 175 40 190 156 273( 7% ) ( 1% ) ( 6% ) ( 1% ) ( 6% ) ( 5% ) ( 9% )191 51 131 43 101 106 133
( 6% ) ( 2% ) ( 4% ) ( 1% ) ( 3% ) ( 4% ) ( 4% )683 152 395 202 470 326 743
( 18% ) ( 4% ) ( 10% ) ( 5% ) ( 12% ) ( 8% ) ( 19% )511 47 335 153 368 360 732
( 16% ) ( 1% ) ( 11% ) ( 5% ) ( 12% ) ( 11% ) ( 23% )206 41 152 43 152 124 214
( 12% ) ( 2% ) ( 9% ) ( 3% ) ( 9% ) ( 7% ) ( 13% )473 117 278 122 321 209 285
( 16% ) ( 4% ) ( 10% ) ( 4% ) ( 11% ) ( 7% ) ( 10% )191 76 117 39 173 134 322
( 10% ) ( 4% ) ( 6% ) ( 2% ) ( 9% ) ( 7% ) ( 17% )272 170 115 35 277 152 250
( 16% ) ( 10% ) ( 7% ) ( 2% ) ( 16% ) ( 9% ) ( 15% )294 31 230 62 262 234 536
( 11% ) ( 1% ) ( 9% ) ( 2% ) ( 10% ) ( 9% ) ( 20% )439 207 238 68 324 227 288
( 14% ) ( 7% ) ( 8% ) ( 2% ) ( 11% ) ( 7% ) ( 9% )534 107 323 155 409 331 583
( 16% ) ( 3% ) ( 10% ) ( 5% ) ( 12% ) ( 10% ) ( 17% )305 191 131 53 269 184 148
( 19% ) ( 12% ) ( 8% ) ( 3% ) ( 16% ) ( 11% ) ( 9% )395 49 279 89 317 274 470
( 15% ) ( 2% ) ( 11% ) ( 3% ) ( 12% ) ( 10% ) ( 18% )97 8 77 20 91 75 174
( 8% ) ( 1% ) ( 6% ) ( 2% ) ( 7% ) ( 6% ) ( 14% )383 192 188 78 288 201 473
( 13% ) ( 6% ) ( 6% ) ( 3% ) ( 9% ) ( 7% ) ( 15% )162 15 129 35 146 117 223
( 10% ) ( 1% ) ( 8% ) ( 2% ) ( 9% ) ( 7% ) ( 14% )201 21 154 68 135 96 262
( 13% ) ( 1% ) ( 10% ) ( 4% ) ( 9% ) ( 6% ) ( 17% )340 29 247 80 311 281 611
( 13% ) ( 1% ) ( 9% ) ( 3% ) ( 12% ) ( 11% ) ( 23% )
Low income households
Average SimpleSAP
Brickhill 3,039 60
Ward Dwellings HHSRS category 1 hazards
DisrepairFuel poverty
Cauldwell 3,168 60
Castle 3,861 61
Bromham and Biddenham 2,974 61
Eastcotts 1,853 63
De Parys 2,881 57
Clapham 1,660 59
Great Barford 3,048 59
Goldington 2,691 62
Elstow 1,683 56
Kempston Central and East 2,652 59
Harrold 1,631 54
Harpur 3,373 60
Kempston South 1,607 60
Kempston Rural 3,064 62
Kempston North 1,216 62
Kingsbrook 2,668 61
Kempston West 1,544 63

Integrated Dwelling Level Housing Stock Modelling and Database
Commercial in Confidence
Template Version V2-082014
© Building Research Establishment Ltd
Report No. QUO-01528-F6X3H0
Page 55 of 110
Table 6 cont.: Private sector stock – estimated number and percentage of dwellings for each of the key indicators, and average SimpleSAP ratings by ward
All hazards
Excess cold
Fall hazards 10% LIHC
290 31 227 93 229 246 331( 10% ) ( 1% ) ( 7% ) ( 3% ) ( 8% ) ( 8% ) ( 11% )
240 136 113 39 179 142 84( 17% ) ( 9% ) ( 8% ) ( 3% ) ( 12% ) ( 10% ) ( 6% )
230 16 189 49 173 169 188( 8% ) ( 1% ) ( 7% ) ( 2% ) ( 6% ) ( 6% ) ( 7% )542 57 328 121 310 331 508
( 22% ) ( 2% ) ( 13% ) ( 5% ) ( 13% ) ( 13% ) ( 21% )310 233 102 40 297 187 130
( 24% ) ( 18% ) ( 8% ) ( 3% ) ( 23% ) ( 15% ) ( 10% )310 185 134 47 251 172 110
( 20% ) ( 12% ) ( 8% ) ( 3% ) ( 16% ) ( 11% ) ( 7% )158 53 107 30 115 87 244
( 9% ) ( 3% ) ( 6% ) ( 2% ) ( 7% ) ( 5% ) ( 15% )193 64 119 40 155 131 225
( 9% ) ( 3% ) ( 5% ) ( 2% ) ( 7% ) ( 6% ) ( 10% )549 476 134 55 470 229 149
( 38% ) ( 33% ) ( 9% ) ( 4% ) ( 33% ) ( 16% ) ( 10% )
Newnham 3,035 58
Ward Dwellings HHSRS category 1 hazards
DisrepairFuel poverty Low income
householdsAverage
SimpleSAP
Queens Park 2,463 56
Putnoe 2,780 59
Oakley 1,442 55
Wilshamstead 1,681 64
Sharnbrook 1,588 54
Riseley 1,284 51
Wyboston 1,429 44
Wootton 2,251 62
N.B. the information on estimated hazards refers to the number of dwellings with a hazard of the stated type. Because of this there is likely to be some overlap – for example, some dwellings are likely to have excess cold and fall hazards but this dwelling would only be represented once under ‘all hazards’. The number of dwellings under ‘all hazards’ can therefore be less than the sum of the excess cold plus fall hazards.

Integrated Dwelling Level Housing Stock Modelling and Database
Commercial in Confidence
Template Version V2-082014
© Building Research Establishment Ltd
Report No. QUO-01528-F6X3H0
Page 56 of 110
Table 7: Owner occupied sector stock – estimated number and percentage of dwellings for each of the key indicators, and average SimpleSAP ratings by ward
All hazards
Excess cold
Fall hazards 10% LIHC
189 14 163 38 164 137 227( 7% ) ( 1% ) ( 6% ) ( 1% ) ( 6% ) ( 5% ) ( 8% )177 45 124 40 91 92 114
( 6% ) ( 2% ) ( 4% ) ( 1% ) ( 3% ) ( 3% ) ( 4% )231 43 146 60 170 91 129
( 20% ) ( 4% ) ( 12% ) ( 5% ) ( 14% ) ( 8% ) ( 11% )219 19 150 57 195 143 282
( 15% ) ( 1% ) ( 10% ) ( 4% ) ( 13% ) ( 10% ) ( 19% )174 32 132 39 128 97 169
( 12% ) ( 2% ) ( 9% ) ( 3% ) ( 9% ) ( 7% ) ( 12% )249 57 163 54 177 117 111
( 14% ) ( 3% ) ( 9% ) ( 3% ) ( 10% ) ( 7% ) ( 6% )102 26 73 22 89 72 167
( 8% ) ( 2% ) ( 6% ) ( 2% ) ( 7% ) ( 6% ) ( 14% )212 144 81 21 198 104 146
( 17% ) ( 11% ) ( 6% ) ( 2% ) ( 16% ) ( 8% ) ( 11% )227 23 179 47 212 180 340
( 11% ) ( 1% ) ( 9% ) ( 2% ) ( 10% ) ( 9% ) ( 17% )345 146 201 55 254 171 229
( 13% ) ( 5% ) ( 7% ) ( 2% ) ( 9% ) ( 6% ) ( 8% )159 24 109 41 157 120 121
( 13% ) ( 2% ) ( 9% ) ( 3% ) ( 13% ) ( 10% ) ( 10% )259 159 113 44 224 151 108
( 18% ) ( 11% ) ( 8% ) ( 3% ) ( 16% ) ( 11% ) ( 8% )301 29 225 67 249 204 316
( 14% ) ( 1% ) ( 11% ) ( 3% ) ( 12% ) ( 10% ) ( 15% )88 8 70 18 84 62 127
( 8% ) ( 1% ) ( 7% ) ( 2% ) ( 8% ) ( 6% ) ( 12% )200 122 84 33 161 105 127
( 14% ) ( 8% ) ( 6% ) ( 2% ) ( 11% ) ( 7% ) ( 9% )139 10 115 31 127 98 179
( 10% ) ( 1% ) ( 8% ) ( 2% ) ( 9% ) ( 7% ) ( 12% )144 15 113 36 107 75 163
( 13% ) ( 1% ) ( 10% ) ( 3% ) ( 10% ) ( 7% ) ( 15% )247 19 186 57 244 195 389
( 13% ) ( 1% ) ( 10% ) ( 3% ) ( 13% ) ( 10% ) ( 21% )
Average SimpleSAP
Brickhill 2,793 61
Bromham and Biddenham 2,773 60
Ward Dwellings HHSRS category 1 hazards
DisrepairFuel poverty Low income
households
Clapham 1,448 58
De Parys 1,731 56
Castle 1,176 57
Cauldwell 1,478 58
Goldington 2,045 61
Great Barford 2,707 59
Eastcotts 1,224 63
Elstow 1,274 56
Kempston Central and East 2,108 58
Kempston North 1,050 62
Harpur 1,186 58
Harrold 1,407 54
Kempston West 1,109 61
Kingsbrook 1,887 60
Kempston Rural 1,459 57
Kempston South 1,433 60

Integrated Dwelling Level Housing Stock Modelling and Database
Commercial in Confidence
Template Version V2-082014
© Building Research Establishment Ltd
Report No. QUO-01528-F6X3H0
Page 57 of 110
Table 7 cont.: Owner occupied sector stock – estimated number and percentage of dwellings for each of the key indicators, and average SimpleSAP ratings by ward
All hazards
Excess cold
Fall hazards 10% LIHC
241 27 189 73 185 174 223( 10% ) ( 1% ) ( 8% ) ( 3% ) ( 7% ) ( 7% ) ( 9% )
216 121 102 34 161 125 67( 16% ) ( 9% ) ( 8% ) ( 3% ) ( 12% ) ( 10% ) ( 5% )
216 16 178 49 161 149 165( 8% ) ( 1% ) ( 7% ) ( 2% ) ( 6% ) ( 6% ) ( 6% )315 21 211 69 191 178 237
( 20% ) ( 1% ) ( 14% ) ( 4% ) ( 12% ) ( 11% ) ( 15% )254 191 86 33 250 150 95
( 23% ) ( 17% ) ( 8% ) ( 3% ) ( 23% ) ( 14% ) ( 9% )251 148 112 38 203 137 80
( 18% ) ( 11% ) ( 8% ) ( 3% ) ( 15% ) ( 10% ) ( 6% )105 29 78 21 78 57 145
( 8% ) ( 2% ) ( 6% ) ( 2% ) ( 6% ) ( 4% ) ( 11% )128 38 84 26 107 86 133
( 7% ) ( 2% ) ( 5% ) ( 1% ) ( 6% ) ( 5% ) ( 8% )478 420 113 44 402 186 109
( 39% ) ( 34% ) ( 9% ) ( 4% ) ( 33% ) ( 15% ) ( 9% )
Putnoe 2,624 59
Queens Park 1,557 56
Average SimpleSAP
Newnham 2,483 58
Oakley 1,314 55
Ward Dwellings HHSRS category 1 hazards
DisrepairFuel poverty Low income
households
Wilshamstead 1,268 64
Wootton 1,748 61
Riseley 1,109 51
Sharnbrook 1,378 54
Wyboston 1,222 44
N.B. the information on estimated hazards refers to the number of dwellings with a hazard of the stated type. Because of this there is likely to be some overlap – for example, some dwellings are likely to have excess cold and fall hazards but this dwelling would only be represented once under ‘all hazards’. The number of dwellings under ‘all hazards’ can therefore be less than the sum of the excess cold plus fall hazards.

Integrated Dwelling Level Housing Stock Modelling and Database
Commercial in Confidence
Template Version V2-082014
© Building Research Establishment Ltd
Report No. QUO-01528-F6X3H0
Page 58 of 110
Table 8: Private rented sector stock – estimated number and percentage of dwellings for each of the key indicators, and average SimpleSAP ratings by ward
All hazards
Excess cold
Fall hazards 10% LIHC
23 10 12 2 26 19 46( 9% ) ( 4% ) ( 1% ) ( 1% ) ( 11% ) ( 8% ) ( 19% )
14 6 7 3 10 14 19( 7% ) ( 3% ) ( 1% ) ( 1% ) ( 5% ) ( 7% ) ( 9% )452 109 249 142 300 235 614
( 17% ) ( 4% ) ( 5% ) ( 5% ) ( 11% ) ( 9% ) ( 23% )292 28 185 96 173 217 450
( 17% ) ( 2% ) ( 6% ) ( 6% ) ( 10% ) ( 13% ) ( 27% )32 9 20 4 24 27 45
( 15% ) ( 4% ) ( 9% ) ( 2% ) ( 11% ) ( 13% ) ( 21% )224 60 115 68 144 92 174
( 19% ) ( 5% ) ( 10% ) ( 6% ) ( 13% ) ( 8% ) ( 15% )89 50 44 17 84 62 155
( 14% ) ( 8% ) ( 7% ) ( 3% ) ( 13% ) ( 10% ) ( 25% )60 26 34 14 79 48 104
( 15% ) ( 6% ) ( 8% ) ( 3% ) ( 19% ) ( 12% ) ( 25% )67 8 51 15 50 54 196
( 10% ) ( 1% ) ( 8% ) ( 2% ) ( 8% ) ( 8% ) ( 30% )94 61 37 13 70 56 59
( 28% ) ( 18% ) ( 11% ) ( 4% ) ( 21% ) ( 16% ) ( 17% )375 83 214 114 252 211 462
( 17% ) ( 4% ) ( 10% ) ( 5% ) ( 12% ) ( 10% ) ( 21% )46 32 18 9 45 33 40
( 21% ) ( 14% ) ( 8% ) ( 4% ) ( 20% ) ( 15% ) ( 18% )94 20 54 22 68 70 154
( 17% ) ( 4% ) ( 10% ) ( 4% ) ( 13% ) ( 13% ) ( 28% )9 0 7 2 7 13 47
( 5% ) ( 0% ) ( 4% ) ( 1% ) ( 4% ) ( 8% ) ( 28% )183 70 104 45 127 96 346
( 11% ) ( 4% ) ( 6% ) ( 3% ) ( 8% ) ( 6% ) ( 22% )23 5 14 4 19 19 44
( 13% ) ( 3% ) ( 8% ) ( 2% ) ( 11% ) ( 11% ) ( 25% )57 6 41 32 28 21 99
( 13% ) ( 1% ) ( 9% ) ( 7% ) ( 6% ) ( 5% ) ( 23% )93 10 61 23 67 86 222
( 12% ) ( 1% ) ( 8% ) ( 3% ) ( 9% ) ( 11% ) ( 28% )
Kempston West 435 68
Kingsbrook 781 63
Kempston Rural 1,605 67
Kempston South 174 59
Kempston Central and East 544 60
Kempston North 166 65
Harpur 2,187 61
Harrold 224 54
Goldington 646 65
Great Barford 341 54
Eastcotts 629 61
Elstow 409 58
Clapham 212 60
De Parys 1,150 59
Castle 2,685 63
Cauldwell 1,690 62
Average SimpleSAP
Brickhill 246 58
Bromham and Biddenham 201 61
Ward Dwellings HHSRS category 1 hazards
DisrepairFuel poverty Low income
households

Integrated Dwelling Level Housing Stock Modelling and Database
Commercial in Confidence
Template Version V2-082014
© Building Research Establishment Ltd
Report No. QUO-01528-F6X3H0
Page 59 of 110
Table 8 cont.: Private rented sector stock – estimated number and percentage of dwellings for each of the key indicators, and average SimpleSAP ratings by ward
All hazards
Excess cold
Fall hazards 10% LIHC
49 4 38 20 44 72 108( 9% ) ( 1% ) ( 7% ) ( 4% ) ( 8% ) ( 13% ) ( 20% )
24 15 11 5 18 17 17( 19% ) ( 12% ) ( 9% ) ( 4% ) ( 14% ) ( 13% ) ( 13% )
14 0 11 0 12 20 23( 9% ) ( 0% ) ( 7% ) ( 0% ) ( 8% ) ( 13% ) ( 15% )227 36 117 52 119 153 271
( 25% ) ( 4% ) ( 13% ) ( 6% ) ( 13% ) ( 17% ) ( 30% )56 42 16 7 47 37 35
( 32% ) ( 24% ) ( 9% ) ( 4% ) ( 27% ) ( 21% ) ( 20% )59 37 22 9 48 35 30
( 28% ) ( 18% ) ( 10% ) ( 4% ) ( 23% ) ( 17% ) ( 14% )53 24 29 9 37 30 99
( 13% ) ( 6% ) ( 7% ) ( 2% ) ( 9% ) ( 7% ) ( 24% )65 26 35 14 48 45 92
( 13% ) ( 5% ) ( 7% ) ( 3% ) ( 10% ) ( 9% ) ( 18% )71 56 21 11 68 43 40
( 34% ) ( 27% ) ( 10% ) ( 5% ) ( 33% ) ( 21% ) ( 19% )Wyboston 207 47
Wilshamstead 413 64
Wootton 503 66
Riseley 175 48
Sharnbrook 210 52
Putnoe 156 61
Queens Park 906 57
Average SimpleSAP
Newnham 552 59
Oakley 128 55
Ward Dwellings HHSRS category 1 hazards
DisrepairFuel poverty Low income
households
N.B. the information on estimated hazards refers to the number of dwellings with a hazard of the stated type. Because of this there is likely to be some overlap – for example, some dwellings are likely to have excess cold and fall hazards but this dwelling would only be represented once under ‘all hazards’. The number of dwellings under ‘all hazards’ can therefore be less than the sum of the excess cold plus fall hazards.

Integrated Dwelling Level Housing Stock Modelling and Database
Commercial in Confidence
Template Version V2-082014
© Building Research Establishment Ltd
Report No. QUO-01528-F6X3H0
Page 60 of 110
4.3 Information relating to LAHS reporting and EPC ratings
4.3.1 Cost of mitigating category 1 hazards in the Bedford private sector stock Table 9 shows the total number of dwellings with an estimated HHSRS category 1 hazards in Bedford’s private sector stock, the average cost of mitigating hazards per dwelling and the total cost for mitigating all hazards within those dwellings. The costs are based on the average cost of mitigating category 1 hazards for the region using EHS 2014 data. The EHS costs are determined following a surveyor’s assessment of the hazard. For each hazard the surveyor is given a range of common treatments that they can specify in order to treat the hazard. Where quantities are required the surveyor may specify them. The treatment recommended by the surveyor is then costed using a standard set of prices.
Table 9: Estimated costs to mitigate all category 1 hazards in private sector stock, split into tenure
Tenure No. of hazards Total cost (£) Total cost (£)
Private Sector 28,116 51,683,393 51,683,393
Owner occupied 15,977 28,321,209 28,321,209
Private rented 12,139 23,362,184 23,362,184
4.3.2 Houses in Multiple Occupation (HMOs) in the Bedford private sector stock The Housing Act 2004 introduced a new set of definitions for HMOs in England from 6 April 200648. The definition is a complex one and the bullet points below, which are adapted from web pages provided by the National HMO Network49, provide a summary:
• An entire house or flat which is let to 3 or more tenants who form 2 or more households and who share a kitchen, bathroom or toilet
• A house which has been converted entirely into bedsits or other non-self-contained accommodation and which is let to 3 or more tenants who form two or more households and who share kitchen, bathroom or toilet facilities
• A converted house which contains one or more flats which are not wholly self-contained (i.e. the flat does not contain within it a kitchen, bathroom and toilet) and which is occupied by 3 or more tenants who form two or more households
• A building which is converted entirely into self-contained flats if the conversion did not meet the standards of the 1991 Building Regulations and more than one-third of the flats are let on short-term tenancies
The recently published “Houses in Multiple Occupation and residential property licensing reform”50 provides guidance to local authorities on changes to rules on licensing HMOs. From 1 October 2018, mandatory
48 See Sections 254-258 of the Housing Act (http://www.legislation.gov.uk/ukpga/2004/34/contents)
49 National HMO Network http://www.nationalhmonetwork.com/definition.php

Integrated Dwelling Level Housing Stock Modelling and Database
Commercial in Confidence
Template Version V2-082014
© Building Research Establishment Ltd
Report No. QUO-01528-F6X3H0
Page 61 of 110
licensing of HMOs will be extended to cover all relevant HMOs regardless of the number of storeys (compared to the previous definition which limited this to buildings of 3 or more storeys). Purpose built flats will only require a licence where there are fewer than 3 flats in the block. The requirement for the HMO to be occupied by five or more persons in two or more households will remain51. From 1 October 2018, the extension will come into effect and those dwellings that fall under the new definition will require a licence. As this reform is due to come into force later this year, the figures for the updated definition have been included in this report. To be classified as an HMO the property must be used as the tenants’ only or main residence and it should be used solely or mainly to house tenants. Properties let to students and migrant workers will be treated as their only or main residence and the same will apply to properties which are used as domestic refuges.
The LAHS requires estimates of the number of HMOs and the number of mandatory licensable HMOs.
• Number of private sector HMOs o Modelled using specific criteria from a number of Experian data sources and information
derived from the SimpleCO2 model. The criteria include privately rented dwellings with 3 or more bedrooms occupied by male/female/mixed home sharers, mixed occupancy dwellings or classified as the following Experian Mosaic classifications:
▪ Renting a room ▪ Career Builders ▪ Flexible Workforce ▪ Bus Route Renters ▪ Learners and earners ▪ Student scene
• Number of mandatory licensing scheme HMOs o This has been modelled using the above criteria for HMOs plus the dwelling must have 3 or
more storeys and 4 or more bedrooms. Four bedrooms is used as a proxy for 5 or more persons to allow for the use of a living room as a bedroom or sharing of bedrooms.
o Flats where there are 4 or more bedrooms and two or more storeys in the dwelling which is within a building of 3 or more storeys containing a non-residential element.
• Number of licensable HMOs under the Government’s new definition, as of 1 October 2018 o This has been modelled using the above criteria for HMOs plus the dwelling must have 4 or
more bedrooms. This will apply to both houses and converted flats. o Purpose built flats where there are up to two flats in the block and one or both have 4 or
more bedrooms. Table 10 summarises the results for the private sector stock in Bedford, while Map 13 shows the geographic distribution of HMOs, Map 14 shows the distribution of licensable HMOs and Map 15 shows the distribution of licensable HMOs under the proposed definition. The table contains the estimated number of HMOs predicted by the stock model and shows the predicted number of mandatory licensable HMOs to be
50 https://assets.publishing.service.gov.uk/government/uploads/system/uploads/attachment_data/file/670536/HMO_licensing_reforms_response.pdf
51 In addition, new mandatory licence conditions will be introduced relating to national minimum sleeping room sizes and provision of waste disposal.

Integrated Dwelling Level Housing Stock Modelling and Database
Commercial in Confidence
Template Version V2-082014
© Building Research Establishment Ltd
Report No. QUO-01528-F6X3H0
Page 62 of 110
75. Information from the Local Authority Housing Statistics returns for 2016 to 2017 show that the local authority estimates the number of mandatory licensable HMOs to be 9452. The maps show the majority of HMOs to be concentrated towards south western parts of the town of Bedford and some areas further out of Bedford town, again to the south west. There are notable concentrations to the north of Cauldwell ward, the south and west of Castle ward, the north west of Kingsbrook ward and the south of Harpur ward. Licensable HMOs (both under the current and proposed definitions) are mainly found in and around the town of Bedford. Maps D.10 to Map D. 13 zoom in on the urban area of Bedford for HMOs, licensable HMOs (current definition) and licensable HMOs (proposed definition), respectively. As previously mentioned, ward level data on HMOs is available in the accompanying Housing Stock Condition Database (HSCD) and Appendix C provides guidance on how to use the database.
Table 10: Summary of estimated HMOs within the Bedford private sector stock
No. of private
sector dwellingsHMOs
Mandatory
Licensing Scheme
HMOs
Proposed
Licensing Scheme
HMOs
62,566 2,476 75 364
Bedford
52 https://www.gov.uk/government/statistical-data-sets/local-authority-housing-statistics-data-returns-for-2016-to-2017

Com
mercial in confidence
©
Building Research E
stablishment Ltd
R
eport No. Q
UO
-01528-F6X3H
0
Template V
ersion V2-082014
Page 63 of 110
Integrated Dw
elling Level Housing Stock M
odelling and Database
Map 13: Estimated distribution of count of HMOs

Com
mercial in confidence
©
Building Research E
stablishment Ltd
R
eport No. Q
UO
-01528-F6X3H
0
Template V
ersion V2-082014
Page 64 of 110
Integrated Dw
elling Level Housing Stock M
odelling and Database
Map 14: Estimated distribution of count of licensable HMOs

Com
mercial in confidence
©
Building Research E
stablishment Ltd
R
eport No. Q
UO
-01528-F6X3H
0
Template V
ersion V2-082014
Page 65 of 110
Integrated Dw
elling Level Housing Stock M
odelling and Database
Map 15: Estimated distribution of count of licensable HMOs under proposed 2018 definition

Integrated Dwelling Level Housing Stock Modelling and Database
Commercial in Confidence
Template Version V2-082014
© Building Research Establishment Ltd
Report No. QUO-01528-F6X3H0
Page 66 of 110
4.3.3 EPC ratings in the Bedford private sector stock An Energy Performance Certificate (EPC) is required whenever a new building is constructed, or an existing building is sold or rented out. An EPC is a measure of the energy efficiency performance of a building and is rated from band A – G, with A representing the best performance. The EPC ratings correspond to a range of SAP ratings from 1 – 100, with 100 being the best. It is possible, therefore, to give a dwelling an EPC rating based on the SAP rating.
Figure 10 below shows the bands A – G and corresponding SAP ratings in brackets. The first two columns show the number and percentage of Bedford’s private sector stock falling into each of the EPC ratings bands. The third column shows the comparable figures for the private sector stock in England.
The estimated average SimpleSAP for the private sector stock in Bedford is 59 which corresponds to an EPC rating of D. The number of private sector dwellings with an EPC rating below band E is estimated to be 4,162 (6.7%). Bedford has a higher proportion of dwellings in band E and F and lower proportions in the other bands.
Figure 10: Number and percentage of Bedford’s private sector stock falling into each of the EPC ratings bands (based on SimpleSAP), compared to England (EHS) figures N.B. England figures report band A and B together
2014 EHS England
Count Percent Percent
(92-100) A 0 0.0%
537 0.9%
13,374 21.4% 20.9%
30,658 49.0% 52.6%
13,835 22.1% 19.1%
3,444 5.5% 5.0%
718 1.1% 1.5%
Bedford
1.0% (81-91) B
(69-80) C
(55-68) D
(39-54) E
(21-38) F
(1-20) G

Integrated Dwelling Level Housing Stock Modelling and Database
Commercial in Confidence
Template Version V2-082014
© Building Research Establishment Ltd
Report No. QUO-01528-F6X3H0
Page 67 of 110
Under the Energy Act 2011, new rules mean that from 2018 landlords must ensure that their properties meet a minimum energy efficiency standard - which has been set at band E - by 1 April 201816, 53.
Figure 11 shows the estimated breakdown of SimpleSAP results into the A – G bands for the private rented stock only and compared to the figures for this tenure in England as a whole. The number of private rented dwellings in Bedford with a rating below band E (i.e. bands F and G), is estimated to be 1,219 (6.9%). Compared to England, there are a greater proportion of dwellings in band A/B, C and F and lower proportions in the other bands.
The distribution of dwellings with EPC ratings below band E is shown in Map 16 and maps zooming in on each of the areas of Bedford are provided in Map D.13 and Map D. 14. These are for the private rented stock only, since this is affected by the new rules on minimum standards. Under the legislation these properties would not be eligible to be rented out after 2018.
Figure 11: Number and percentage of Bedford’s private rented stock falling into each of the EPC ratings bands (based on SimpleSAP), compared to England (EHS) figures N.B. England figures report band A and B together
2014 EHS England
Count Percent Percent
(92-100) A 0 0.0%
322 1.8%
5,844 33.3% 23.8%
7,054 40.1% 48.9%
3,136 17.8% 18.3%
998 5.7% 5.4%
221 1.3% 2.1%
Bedford
1.4%
(1-20) G
(81-91) B
(69-80) C
(55-68) D
(39-54) E
(21-38) F
53 Although landlords will still be able to rent out F and G rated properties after this date they will not be able to renew or sign a new contract.

Com
mercial in confidence
©
Building Research E
stablishment Ltd
R
eport No. Q
UO
-01528-F6X3H
0
Template V
ersion V2-082014
Page 68 of 110
Integrated Dw
elling Level Housing Stock M
odelling and Database
Map 16: Estimated distribution of dwellings with F or G EPC ratings in the private rented stock

Integrated Dwelling Level Housing Stock Modelling and Database Report Number: QUO-01528-F6X3H0
Issue: 2
Commercial in Confidence
Template Version V2-082014
© Building Research Establishment Ltd
Report No. QUO-01528-F6X3H0
Page 69 of 110
4.4 Energy efficiency variables for Bedford Section 2.5 provides an overview of the ECO policy – two of the main energy efficiency improvements that fall under these policies are insulation of cavity walls and lofts. An understanding of the numbers and geographical distribution of dwellings which would be suitable for such improvements is a useful step in targeting resources in Bedford. The BRE Models have been used to determine the following variables for Bedford:
• Wall type and presence of cavity wall insulation o Solid wall o Insulated cavity wall o Un-insulated cavity wall
• Presence and level of loft insulation
o No loft o Loft with no insulation o Level of loft insulation – 50, 100, 150, 200, 250+ mm loft insulation
Table 11 and Table 12 show the modelled results in terms of the numbers and percentages of dwellings in Bedford’s private sector stock for walls and lofts respectively (ward level data can be obtained from the housing stock condition database supplied alongside this report). They also show the percentage figures for the East of England region and for England overall to enable comparison. The results indicate that a proportion of the private sector stock in Bedford could benefit from energy efficiency improvements with an estimated 12,662 dwellings (20%) having un-insulated cavity walls. Furthermore, there are an estimated 9,265 dwellings (15% of Bedford’s private sector stock) which have less than 100mm of loft insulation with 3,820 (6%) having no loft insulation at all. In Bedford, it is estimated that 69% of the housing stock have cavity walls; this is similar to the regional and national figures and there are still opportunities for implementing ECO in dwellings without cavity wall insulation which still represent almost a third of the housing stock. These types of dwellings are likely to be of particular interest to ECO providers and the distribution of these dwellings is shown in Map 17 to Map 19 with maps zooming in on the urban area of Bedford provided in Appendix D.
Map 17 shows that the prevalence of un-insulated cavities is scattered across Bedford. Map D.14 zooms in on the urban area of Bedford to provide more detail.
Map 18 shows that there are pockets of areas with solid walls distributed throughout the area with a slight tendency towards COAs in the town of Bedford. Map D.15 zooms in on the Bedford area to provide more detail.
Map 19 shows that areas with lower levels of loft insulation (100mm or less) are scattered throughout the area, again with a slight tendency towards the town of Bedford. Map D.16 shows the Bedford area in more detail.

Integrated Dwelling Level Housing Stock Modelling and Database Report Number: QUO-01528-F6X3H0
Issue: 2
Commercial in Confidence
Template Version V2-082014
© Building Research Establishment Ltd
Report No. QUO-01528-F6X3H0
Page 70 of 110
Table 11: Estimates of the numbers and percentage of dwellings for each of the energy efficiency variables for walls assessed for the private sector stock in Bedford and compared to the East of England region and national figure (EHS 2014)
2014 EHS Regional
(private stock)
2014 EHS England
(private stock)
No. % % %
62,566 - - -
Solid 18,031 29% 30% 30%
Insulated cavity 30,673 49% 42% 43%
Un-insulated cavity 12,662 20% 26% 25%
- 29% 38% 37%
Private stockVariable
Wall type
% of cavity walls only that are uninsulated
No. of private sector dwellings
N.B. the different wall types do not add up to the total number of private sector dwellings due to the small number of timber-frame and stone buildings
Table 12: Estimates of the numbers and percentage of dwellings for each of the energy efficiency variables for lofts assessed for the private sector stock in Bedford and compared to the East of England region and national figure (EHS 2014)
2014 EHS Regional
(private stock)
2014 EHS England
(private stock)
No. % % %
62,566 - - -
No loft 5,597 9% 7% 10%
No insulation 3,820 6% 3% 3%
50mm 5,445 9% 6% 6%
100mm 13,373 21% 26% 23%
150mm 8,957 14% 16% 19%
200mm 7,479 12% 13% 14%
250+mm 17,895 29% 29% 24%
9,265 15% 9% 9%
No. of private sector dwellings
Less than 100mm
Private stock
Level of loft
insulation
Variable

Com
mercial in confidence
©
Building Research E
stablishment Ltd
R
eport No. Q
UO
-01528-F6X3H
0
Template V
ersion V2-082014
Page 71 of 110
Integrated Dw
elling Level Housing Stock M
odelling and Database
Map 17: Energy efficiency variables – estimated percentage of private sector dwellings in Bedford with un-insulated cavity walls

Com
mercial in confidence
©
Building Research E
stablishment Ltd
R
eport No. Q
UO
-01528-F6X3H
0
Template V
ersion V2-082014
Page 72 of 110
Integrated Dw
elling Level Housing Stock M
odelling and Database
Map 18: Energy efficiency variables - estimated percentage of private sector dwellings in Bedford with solid walls

Com
mercial in confidence
©
Building Research E
stablishment Ltd
R
eport No. Q
UO
-01528-F6X3H
0
Template V
ersion V2-082014
Page 73 of 110
Integrated Dw
elling Level Housing Stock M
odelling and Database
Map 19: Energy efficiency variables – estimated percentage of private sector dwellings in Bedford with less than 100mm or no loft insulation

Integrated Dwelling Level Housing Stock Modelling and Database Report Number: QUO-01528-F6X3H0
Issue: 2
Commercial in Confidence
Template Version V2-082014
© Building Research Establishment Ltd
Report No. QUO-01528-F6X3H0
Page 74 of 110
4.5 Energy planning variables for Bedford In addition to the energy efficiency key indicators, the “energy outputs” part of the housing stock modelling approach (see Figure 1) provides the database with estimates of a number of other energy efficiency variables. These variables are: SimpleSAP, notional SimpleCO2, notional energy demand and cost, notional heat demand and cost. Table 13 shows the energy efficiency variables in terms of the average figure per dwelling in Bedford, split by tenure. It is clear that the owner occupied stock has the highest average figures for the majority of the variables which may, in part, be due to owner occupied dwellings being larger than those in the other tenures. Such information provides a useful picture of the local housing stock and can also be useful in planning infrastructure projects such as district heating schemes, or for projects seeking to lever in ECO funding.
Table 13: Modelled data for average energy efficiency variables per dwelling by tenure in Bedford
Owner occupied Private rented Social
44,991 17,575 12,816
58 61 63
4.53 3.89 3.06
18,251 14,215 11,597
887 767 625
1,420 2,463 1,611
158 246 166
10,054 8,315 5,957
526 448 312
SimpleCO2 (t/yr)
Heat demand (kWh/yr)
SimpleSAP
No. of dwellings
Tenure
Heat cost (£/yr)
Energy cost (£/yr)
Electricity demand (KWh)
Electricity cost (£)
Variable
Energy demand (kWh/yr)
Map 20 and Map 21 show the average total energy demand and the average total energy cost per year for Bedford. Both maps show similar patterns since higher energy demand is generally likely to result in higher energy costs. In general, higher levels of energy demand and cost seem to be scattered across the area with a slight tendency towards more rural parts. This may be a result of there being larger detached houses in these areas. Map D.17 focusses in on the urban area of Bedford.
Map 22 and Map 23 show the average total heat demand and the average total heating cost per year for Bedford. These show a similar pattern to the energy demand and energy cost maps. Map D.19 focusses in on the northern and southern parts of the Bedford area, respectively.

Com
mercial in confidence
©
Building Research E
stablishment Ltd
R
eport No. Q
UO
-01528-F6X3H
0
Template V
ersion V2-082014
Page 75 of 110
Integrated Dw
elling Level Housing Stock M
odelling and Database
Map 20: Estimated average total energy demand (kWh/year) – private sector stock

Com
mercial in confidence
©
Building Research E
stablishment Ltd
R
eport No. Q
UO
-01528-F6X3H
0
Template V
ersion V2-082014
Page 76 of 110
Integrated Dw
elling Level Housing Stock M
odelling and Database
Map 21: Estimated average total energy cost (£/year) – private sector stock

Com
mercial in confidence
©
Building Research E
stablishment Ltd
R
eport No. Q
UO
-01528-F6X3H
0
Template V
ersion V2-082014
Page 77 of 110
Integrated Dw
elling Level Housing Stock M
odelling and Database
Map 22: Estimated average total heat demand (kWh/year) – private sector stock

Com
mercial in confidence
©
Building Research E
stablishment Ltd
R
eport No. Q
UO
-01528-F6X3H
0
Template V
ersion V2-082014
Page 78 of 110
Integrated Dw
elling Level Housing Stock M
odelling and Database
Map 23: Estimated average total heat cost (£/year) – private sector stock

Integrated Dwelling Level Housing Stock Modelling and Database
Commercial in Confidence
Template Version V2-082014
© Building Research Establishment Ltd
Report No. QUO-01528-F6X3H0
Page 79 of 110
4.6 Improvement scenarios for Bedford For strategic planning purposes it is helpful for local authorities to have some idea as to what energy efficiency improvements could be made to the local housing stock, what the impact of those improvements would be, and what they would cost. A total of eight improvement scenarios - examining the possibilities of improving the energy efficiency of the stock - have been produced. The improvement scenarios use various combinations of the following measures:
• Low cost measures (LCM) • Double glazing (DG) • Solid wall insulation (SW) • Heating (H) • Solar hot water (SHW) • Photovoltaics (PV)
Eight scenarios were constructed which use various combinations of these measures and have been selected by BRE as representative of likely packages of work undertaken to improve a property. The eight scenarios are as follows:
• Scenario 1: Low cost measures • Scenario 2: Low cost measures + double glazing • Scenario 3: low cost measures + double glazing + solid wall insulation • Scenario 4: Low cost measures + heating • Scenario 5: Low cost measures + heating + double glazing • Scenario 6: Low cost measures + heating + double glazing + solid wall insulation • Scenario 7: Low cost measures + heating + double glazing + solid wall insulation + solar hot water • Scenario 8: Photovoltaics
The details of the individual measures are as follows:
Low cost measures: • Where the dwelling has a loft but there is less than 200mm of loft insulation, add loft insulation to
bring the level to 250mm • Where the dwelling has un-insulated cavity walls, insulate them • Where the dwelling has an un-insulated hot water cylinder, insulate it with a foam jacket • Where the heating system does not have the most effective controls
Double glazing: The dwelling will be upgraded to have double glazing throughout.
Solid wall insulation: Where the dwelling has solid walls, these will be insulated with external wall insulation.
Heating: A heating system deemed to be inefficient will be replaced by a more efficient one where possible. The method for determining which systems should be replaced and what they need to be replaced with is complex, but in summary the following factors are taken into account:
• Whether the dwelling is on the gas network • The current heating system • The current fuel

Integrated Dwelling Level Housing Stock Modelling and Database
Commercial in Confidence
Template Version V2-082014
© Building Research Establishment Ltd
Report No. QUO-01528-F6X3H0
Page 80 of 110
• The size of the dwelling
Solar hot water: This measure involves installing solar hot water panels to supplement hot water supply. Due to the difficulty in assessing the suitability of each dwelling roof the methodology simply assumes that the dwellings are suitable – therefore, the results reported here will be an over-estimate. Photovoltaics: This involves installing 2.5kW photovoltaic panels. As for solar hot water, the methodology assumes all dwellings are suitable, thus resulting in an over-estimate of the savings available. The savings estimated from each scenario are calculated by comparing them to the baseline situation for each of the energy variables (shown in Section 4.5, Table 13 ) and a revised SAP rating and energy consumption figures are calculated for each scenario.
Table 14 shows the impact of each of the improvement scenarios on the energy variables considered in the stock model and Figure 12 focusses on the change in energy cost, compared to the baseline, which can be expected from each of the scenarios. It can be seen that scenario 7, which is based on the package of work with low cost measures, heating, double glazing, solid wall insulation and solar hot water, provides a large percentage of estimated savings as follows:
• 31% reduction in average annual heating cost • 25% reduction in average annual energy cost • 30% reduction in average annual SimpleCO2 emissions • 10 point improvement in average SimpleSAP rating
It is interesting to note, however, that looking at scenario 4, which only involves low cost measures and heating, still offers reasonable levels of savings.
The results provided here are for the total housing stock in Bedford; however, more detailed results can be generated at ward or dwelling level by using the Housing Stock Condition Database (HSCD) provided as part of this project.

Integrated Dwelling Level Housing Stock Modelling and Database
Commercial in Confidence
Template Version V2-082014
© Building Research Establishment Ltd
Report No. QUO-01528-F6X3H0
Page 81 of 110
Table 14: Results of the improvement scenarios analysis – showing the estimated average change in energy output variables compared to the baseline for the total housing stock in Bedford
(SimpleSAP
points)
SimpleSAPSimpleCO2
(tonnes/year)
Energy demand
(kWh/year)
Energy cost
(£/year)
Heat demand
(kWh/year)Heat cost (£/year)
- 60 4.13 16,179 814 8,952 472
1 +2 -7% -7% -6% -10% -10%
2 +3 -8% -8% -7% -11% -12%
3 +5 -16% -17% -13% -23% -23%
4 +5 -15% -16% -14% -11% -19%
5 +5 -16% -17% -14% -12% -21%
6 +8 -24% -25% -20% -24% -31%
7 +10 -30% -31% -25% -23% -31%
8 +5 -11% 0% -14% 0% 0%
Scenario Improvement measure(s)
LCM + heating + DG + SW + SHW
LCM + heating + DG + SW
(%)
Average improvement per property compared to baseline
PV
PV + SW
LCM + heating + DG
(Baseline)
LCM
LCM + SW
LCM + heating
Figure 12: Estimated change in energy cost by scenario, including percentage change compared to the baseline
0%
-6%
-7%
-13%
-14%
-14%
-20%
-25%
-14%
0 200 400 600 800 1,000 1,200
Baseline
1
2
3
4
5
6
7
8
Energy cost per dwelling (£/year)
Impr
ovem
ent
scen
ario

Integrated Dwelling Level Housing Stock Modelling and Database
Commercial in Confidence
Template Version V2-082014
© Building Research Establishment Ltd
Report No. QUO-01528-F6X3H0
Page 82 of 110
5 Conclusion and recommendations
5.1 Conclusion Bedford Borough Council commissioned BRE to undertake a series of modelling exercises on their housing stock to provide an integrated housing stock condition database, making use of the EPC data which has been integrated into BRE’s standard housing stock condition database. The integration of this data source serves to further increase the accuracy of the models by removing the need to rely on imputed data for the 33,100 cases where EPC data is available, and instead using observed data from the surveys. This leads to more accurate SimpleSAP ratings, more accurate excess cold data (and therefore HHSRS data), and more accurate fuel poverty data for around 43.9% of the stock in Bedford.
This report describes the modelling work and provides details of the results obtained from the dwelling level model and database. The housing stock condition database is also provided to the council to enable them to obtain specific information whenever required. This database is now in an online format.
The integrated stock models and database provide the council with dwelling level information, focussing on private sector housing, for the following:
• The percentage of dwellings meeting each of the key indicators for Bedford overall and broken down by tenure and then mapped by COA (private sector stock only)
• Information relating to LAHS reporting for the private sector stock – estimated of category 1 hazards and HMOs as well as information on EPC ratings
• Energy efficiency for the private sector stock (wall and loft insulation) • Energy planning variables • Improvement scenarios
Some of the key findings of this report are as follows:
• Looking at the key indicators, the housing stock in Bedford compared to the EHS England average Bedford performs similarly or slightly better for the majority of indicators, but worse for excess cold.
• The performance of the private rented sector is generally worse than the owner occupied sector, in particular for low income housholds.
• 6.9% of dwellings in the private rented sector are estimated to have an EPC below band E. Under proposed legislation these properties would not be eligible to be rented out after 2018.
Such information will facilitate the decision making process for targeting resources to improve the condition of housing and to prevent ill health resulting from poor housing conditions. Furthermore, the results of this project provide Bedford with information which will assist in housing policy and strategy development whether these are inspired locally, arise from obligations under the Housing Act 2004 or as responses to government initiatives such as MHCLG’s Housing Strategy Policy and ECO.
5.2 Recommendations Programmes designed to tackle disrepair for example group repair schemes, regeneration or enforcement interventions could be considered with a focus on areas of greatest disrepair such as Queens Park ward with an estimated 5% disrepair and 22% estimated to contain category 1 hazards, or Castle ward with an estimated 5% of private sector homes in disrepair and 18% estimated to have category 1 hazards. These findings could be combined with local intelligence to help identify areas for targeting assistance for physical improvements to private sector stock and the environment. Furthermore,

Integrated Dwelling Level Housing Stock Modelling and Database
Commercial in Confidence
Template Version V2-082014
© Building Research Establishment Ltd
Report No. QUO-01528-F6X3H0
Page 83 of 110
programmes aimed at increasing household income through job creation, benefit entitlement checks and other initiatives should also be considered, with a particular focus on areas containing high proportions of low income households like Kingsbrook and Cauldwell (both 23%) and Goldington (20%).
The use of additional local data in this project has enhanced the housing stock models and Housing Stock Condition Database (HSCD). The addition of any further local data, were it to become available, would potentially further enhance the models and database.
Examples of such data are:
• Local Land and Property Gazetteer (LLPG) data
The Unique Property Reference Number (UPRN) from the LLPG can be used to uniquely identify all properties and address match the properties in the BRE Models with those in the LLPG and EPC data.
• Tenure data
Data may be available relating to addresses subject to mandatory HMO licensing, or from Tenancy Deposit Schemes (TDS) which can be used to help identify HMOs and private rented properties.
• Households on benefits
Data regarding any households in receipt of either Council Tax reduction or Housing Allowance could be used to enhance the low income model, making the targeting of individual low income households more accurate. Such data may also assist in the identification of households which could benefit from the ECO3 scheme.
• Local repair schemes
Data from any local repair schemes, including the use of repair grants, could be used to enhance the Disrepair Model.
• Local energy improvement schemes
Any local schemes to improve the energy efficiency of dwellings, including national schemes for which local data has been made available to the council, could be used to further enhance the energy models (SimpleSAP, excess cold, fuel poverty).
Furthermore, it would also be possible for BRE to carry out an analysis of the condition of the housing stock and its health impact, through a Health Impact Assessment (HIA). The results of this would be provided in a separate report which would provide a cost benefit analysis of mitigating Housing Health and Safety hazards within the stock for Bedford.

Integrated Dwelling Level Housing Stock Modelling and Database
Commercial in Confidence
Template Version V2-082014
© Building Research Establishment Ltd
Report No. QUO-01528-F6X3H0
Page 84 of 110
Appendix A Definitions of the key indicators
1. House condition indicators a. The presence of a category 1 hazard under the Housing Health and Safety Rating
System (HHSRS) – reflecting both condition and thermal efficiency Homes posing a category 1 hazard under the HHSRS – the system includes 29 hazards in the home categorised into category 1 – band A to C (serious) or category 2 – band D onwards (other) based on a weighted evaluation tool. Note that this includes the hazard of excess cold which is also included as one of the energy efficiency indicators.
The 29 hazards are:
1 Damp and mould growth 16 Food safety2 Excess cold 17 Personal hygiene, Sanitation and Drainage3 Excess heat 18 Water supply4 Asbestos 19 Falls associated with baths etc.5 Biocides 20 Falling on level surfaces etc.6 Carbon Monoxide and fuel combustion products 21 Falling on stairs etc.7 Lead 22 Falling between levels8 Radiation 23 Electrical hazards9 Uncombusted fuel gas 24 Fire10 Volatile Organic Compounds 25 Flames, hot surfaces etc.11 Crowding and space 26 Collision and entrapment12 Entry by intruders 27 Explosions13 Lighting 28 Position and operability of amenities etc.14 Noise 29 Structural collapse and falling elements15 Domestic hygiene, Pests and Refuse
b. The presence of a category 1 hazard for falls (includes “falls associated with baths”, “falling on the level” and “falling on stairs”) The HHSRS Falls Model includes the 3 different falls hazards where the vulnerable person is over 60 as listed above.
c. Dwellings in disrepair (based on the former Decent Homes Standard criteria for Disrepair) The previous Decent Homes Standard states that a dwelling fails this criterion if it is not found to be in a reasonable state of repair. This is assessed by looking at the age of the dwelling and the condition of a range of building components including walls, roofs, windows, doors, electrics and heating systems).
2. Energy efficiency indicators: a. The presence of a category 1 hazard for excess cold (using SAP ratings as a proxy
measure in the same manner as the English House Condition Survey) This hazard looks at households where there is a threat to health arising from sub-optimal indoor temperatures. The HHSRS assessment is based on the most low income group for this hazard – persons aged 65 years or over (note that the assessment requires the hazard to

Integrated Dwelling Level Housing Stock Modelling and Database
Commercial in Confidence
Template Version V2-082014
© Building Research Establishment Ltd
Report No. QUO-01528-F6X3H0
Page 85 of 110
be present and potentially affect a person in the low income age group should they occupy that dwelling. The assessment does not take account of the age of the person actually occupying that dwelling at that particular point in time).
The English Housing Survey (EHS) does not measure the actual temperatures achieved in each dwelling and therefore the presence of this hazard is measured by using the SAP rating as a proxy. Dwellings with a SAP rating of less than 33.52 (SAP 2012 methodology) are considered to be suffering from a category 1 excess cold hazard.
b. An estimate of the SAP rating which, to emphasise its origin from a reduced set of input variables, is referred to as “SimpleSAP” The Standard Assessment Procedure (SAP) is the UK Government’s standard methodology for home energy cost ratings. SAP ratings allow comparisons of energy efficiency to be made, and can show the likely improvements to a dwelling in terms of energy use. The Building Regulations require a SAP assessment to be carried out for all new dwellings and conversions. Local authorities, housing associations, and other landlords also use SAP ratings to estimate the energy efficiency of existing housing. The version on which the Average SAP rating model is based is SAP 2012.
The SAP ratings give a measure of the annual unit energy cost of space and water heating for the dwelling under a standard regime, assuming specific heating patterns and room temperatures. The fuel prices used are the same as those specified in SAP 2012. The SAP takes into account a range of factors that contribute to energy efficiency, which include:
• Thermal insulation of the building fabric • The shape and exposed surfaces of the dwelling • Efficiency and control of the heating system • The fuel used for space and water heating • Ventilation and solar gain characteristics of the dwelling
3. Household vulnerability indicators: a. Fuel poverty - 10% definition
This definition states that a household is said to be in fuel poverty if it spends more than 10% of its income on fuel to maintain an adequate level of warmth (usually defined as 21oC for the main living area, and 18oC for other occupied rooms). This broad definition of fuel costs also includes modelled spending on water heating, lights, appliances and cooking.
The fuel poverty ratio is defined as:
Fuel poverty ratio = Fuel costs (usage * price) Full income
If this ratio is greater than 0.1 then the household is in fuel poverty.
The definition of full income is the official headline figure and in addition to the basic income measure, it includes income related directly to housing (i.e. Housing Benefit, Income Support for Mortgage Interest (ISMI), Mortgage Payment Protection Insurance (MPPI), Council Tax reduction).

Integrated Dwelling Level Housing Stock Modelling and Database
Commercial in Confidence
Template Version V2-082014
© Building Research Establishment Ltd
Report No. QUO-01528-F6X3H0
Page 86 of 110
Fuel costs are modelled, rather than based on actual spending. They are calculated by combining the fuel requirements of the household with the corresponding fuel prices. The key goal in the modelling is to ensure that the household achieves the adequate level of warmth set out in the definition of fuel poverty whilst also meeting their other domestic fuel requirements.
b. Fuel poverty - Low Income High Costs definition The government has recently set out a new definition of fuel poverty which it intends to adopt under the Low Income High Costs (LIHC) framework54. Under the new definition, a household is said to be in fuel poverty if:
• They have required fuel costs that are above average (the national median level) • Were they to spend that amount they would be left with a residual income below the
official poverty line
c. Dwellings occupied by a low income household A household in receipt of:
• Income support • Housing benefit • Attendance allowance • Disability living allowance • Industrial injuries disablement benefit • War disablement pension • Pension credit • Child tax credit • Working credit
For child tax credit and working tax credit, the household is only considered a low income household if it has a relevant income of less than £15,860.
The definition also includes households in receipt of Council Tax reduction and income based Job Seekers Allowance.
54 https://www.gov.uk/government/collections/fuel-poverty-statistics

Integrated Dwelling Level Housing Stock Modelling and Database
Commercial in Confidence
Template Version V2-082014
© Building Research Establishment Ltd
Report No. QUO-01528-F6X3H0
Page 87 of 110
Appendix B Methodology for the BRE Integrated Dwelling Level Housing Stock Modelling approach
This Appendix provides a more detailed description of the models which make up the overall housing stock modelling approach and feed into the housing stock condition database. The process is made up of a series of data sources and Models which, combined with various imputation and regression techniques and the application of other formulae, make up the final Housing Stock Condition Database (HSCD). The database is essentially the main output of the modelling and provides information on the key indicators and other data requirements (e.g. energy efficiency variables). An overview of the approach and a simplified flow diagram are provided in Section 3 of this report.
The models making up the overall housing stock modelling approach are:
• SimpleCO2 Model • Fuel Poverty Model • HHSRS (all hazards, falls hazards and excess cold) Models • Disrepair Model • Low Income Households Model
Figure B.1 shows the data flows for the stock modelling approach, showing which models each of the outputs in the database (split into the key indicators and other information) come from. The exception is the energy efficiency variables (if used) which come directly from the energy inputs, and the tenure and HMO data (if used) which come directly from the other inputs.
Section B.1 describes the SimpleCO2 Model in more detail, Section B.2 provides more information on the other four models and Section B.3 gives details of the OS MasterMap/geomodelling approach.

Integrated Dwelling Level Housing Stock Modelling and Database
Commercial in Confidence
Template Version V2-082014
© Building Research Establishment Ltd
Report No. QUO-01528-F6X3H0
Page 88 of 110
Figure B.1: Simplified data flow for the housing stock modelling approach
EPC estimates
Energy planning variables
Energy efficiency variables (wall and loft insulation)
Cost of mitigating cat 1 hazards
SimpleCO2 Presence of cat 1 excess cold
hazard
Presence of cat 1 hazard
Dwellings occupied by low income household
Fuel poverty
HHSRS (‘falls’ and ‘other’)
Disrepair
Low income households
Energy inputs
Other inputs
Tenure split HMOs
Fuel poverty
Dwellings in disrepair
SimpleSAP rating
Presence of cat 1 falls hazard
Inputs Model Outputs - key indicators Outputs - other information
Housing Stock Condition Database (HSCD)
HHSRS excess cold

Integrated Dwelling Level Housing Stock Modelling and Database
Commercial in Confidence
Template Version V2-082014
© Building Research Establishment Ltd
Report No. QUO-01528-F6X3H0
Page 89 of 110
B.1 BRE SimpleCO2 Model
BRE have developed a variant of the BREDEM55 software, named “SimpleCO2”, that can calculate outputs from a reduced set of input variables. These outputs are indicative of the full BREDEM outputs and the minimum set of variables the software accepts is information on:
• Tenure • Dwelling type • Location of flat (if a flat) • Dwelling age • Number of storeys • Number of rooms • Loft insulation • Level of double glazing • Main heating type • Boiler type (if a boiler driven system) • Heating fuel • Heating system • Heating controls • Water heating • Hot water cylinder insulation • Solar hot water • PV panels • Internal floor area
The Experian UK Consumer Dynamics Database is used as a source for some of these variables (tenure, dwelling age) and they are converted into a suitable format for the SimpleCO2 software. The dwelling type is derived using information from OS Mastermap and the number of storeys from OS experimental height data. The remaining pieces of data are inferred from the EHS using other tenure, dwelling age and type, other Experian data (number of bedrooms), other OS data (i.e. dwelling footprint) and data from Xoserve56 which indicates whether the dwelling is in a postcode which is on the gas network. As the characteristics of a dwelling cannot be determined through access to observed data, a technique known as cold deck imputation is undertaken. This is a process of assigning values in accordance with their known proportions in the stock. For example, this technique is used for predicting heating fuels because the Xoserve data only confirms whether a dwelling is on the gas network or not. Fuel used by dwellings not on the gas network is unknown, so in most cases this information will be assigned using probabilistic methods. The process is actually far more complex e.g. dwellings with particular characteristics such as larger dwellings are more likely to be assigned with oil as a fuel than smaller dwellings.
55 Building Research Establishment Domestic Energy Model, BRE are the original developers of this model which calculates the energy costs of a dwelling based on measures of building characteristics (assuming a standard heating and living regime). The model has a number of outputs including an estimate of the SAP rating and carbon emissions.
56 Xoserve is jointly owned by the five major gas distribution Network companies and National Grid’s gas transmission business. It provides transportation transactional services on behalf of all the major gas Network transportation companies.

Integrated Dwelling Level Housing Stock Modelling and Database
Commercial in Confidence
Template Version V2-082014
© Building Research Establishment Ltd
Report No. QUO-01528-F6X3H0
Page 90 of 110
The reason for taking this approach is to ensure that the national proportions in the data source are the same as those found in the stock nationally (as predicted by the EHS or other national survey). Whilst there is the possibility that some values assigned will be incorrect for a particular dwelling (as part of the assignment process has to be random) they ensure that examples of some of the more unusual types of dwelling that will be present in the stock are included.
Whilst this approach is an entirely sensible and commonly adopted approach to dealing with missing data in databases intended for strategic use, it raises issues where one of the intended uses is planning implementation measures. It must therefore be kept in mind at all times that the data provided represents the most likely status of the dwelling, but that the actual status may be quite different. That said, where EPC data has been used, the energy models (which use EPC data) are likely to be more accurate.
It is important to note that some variables have been entirely assigned using cold decking imputation techniques. These include presence of cavity wall insulation and thickness of loft insulation as there is no reliable database with national coverage for these variables.
The “SimpleCO2” software takes the combination of Experian and imputed data and calculates the “SimpleSAP” rating for each dwelling in the national database. The calculated “SimpleSAP” ratings are the basis of the estimates of SAP and excess cold. How the other key variables are derived is discussed later in this Appendix.
Because the estimates of “SimpleSAP” etc. are calculated from modelled data it is not possible to guarantee the figures. They do, however, provide the best estimates that we are aware can be achieved from a data source with national coverage and ready availability. The input data could, however, be improved in its:
• accuracy for example through correcting erroneous values, • depth of coverage, for example by providing more detailed information on age of dwellings, • breadth by providing additional input variables such as insulation.
Improving any of these would enhance the accuracy of the output variables and for this reason it is always worth considering utilising additional information sources where they are available. Using EPC data will go some way towards meeting these improvements by providing more accurate data.
B.2 Housing Condition and Low Income Household Models
This section provides further information on the remaining four models – fuel poverty, HHSRS, disrepair and low income households. These models are discussed together since the approach used for each one is broadly the same.
These models are not based solely on the thermal characteristics of the dwelling, and in some cases are not based on these characteristics at all. A top down methodology has been employed for these models, using data from the EHS and statistical techniques, such as logistic regression, to determine the combination of variables which are most strongly associated with failure of each standard. Formulae have been developed by BRE to predict the likelihood of failure based on certain inputs. The formulae are then applied to the variables in the national Experian dataset to provide a likelihood of failure for each dwelling. Each individual case is then assigned a failure/compliance indicator based on its likelihood of failure and on the expected number of dwellings that will fail the standard within a given geographic area. Thus if the aggregate values for a census output area are that 60% of the dwellings in the area fail a particular standard then 60% of the dwellings with the highest failure probabilities will be assigned as failures and the remaining 40% as passes.

Integrated Dwelling Level Housing Stock Modelling and Database
Commercial in Confidence
Template Version V2-082014
© Building Research Establishment Ltd
Report No. QUO-01528-F6X3H0
Page 91 of 110
The presence of a category 1 hazard failure is the only exception to this as it is found by combining excess cold, fall hazards and other hazards such that failure of any one of these hazards leads to failure of the standard.
B.3 Integrating local data sources
As mentioned in the main body of the report, Bedford identified a number sources of data which were used to update the BRE dwelling level models to provide an integrated housing stock condition database. Their data sources are shown in Table B.1.
To allow these data sources to be linked to the BRE Dwelling Level Stock Models, an address matching exercise was required to link each address to the Experian address key. Address matching is rarely 100% successful due to a number of factors including:
• Incomplete address or postcodes • Variations in how the address is written e.g. Flat 1 or Ground floor flat • Additions to the main dwelling e.g. annexes or out-buildings
Experience indicates that, for address files in good order, match rates are around 75% - 95%. Table B.1 provides the address matching results for the data sources provided by Bedford and the resulting impact on the modelling process.
Table B.1: Address matching results and impact on the modelling process
Data source Total no. of records
No. (and %) of addresses matched
Notes / impact on the modelling process
EPC data 42,884 – total records
available
33,100 (90.4% of de-
duplicated)
Data de-duplicated for multiple EPCs – 36,632 remaining
Final number matched to modelled data and useable – 33,100
The Housing Stock Condition Database (HSCD) was also updated using the Ordnance Survey (OS) MasterMap data which enables the measurement of the footprint of the building and provides information on the number of residential addresses within the building, and to see which other buildings each address is attached to or geographically close to.
The stage at which the local data sources are included in the modelling process depends on whether or not the data includes information which can be used as an input into the SimpleCO2 model. The simplified flow diagram in Figure 1 in the main report shows how these data sources are integrated into the standard modelling approach.
The following sections consider each of the data sources and how they are used to update the SimpleCO2 inputs and/or stock model outputs.
Integrated Dwelling Level Housing Stock Modelling and Database
Commercial in Confidence
Template Version V2-082014
© Building Research Establishment Ltd
Report No. QUO-01528-F6X3H0
Page 92 of 110
EPC data If there are discrepancies in the energy data for the same dwelling case, arising from different energy data sources, then, if available, the EPC data will be used. If no EPC data source is available for that case, then the data with the most recent date will be taken.
Some of the energy data provided includes tenure data, in which case the housing stock condition database has been updated accordingly. However EPC cases do not include tenure data, they only include the reason for the EPC.
Therefore:
• If the reason given was a sale then the dwelling was assumed to be owner occupied. • If the reason given was re-letting and the tenure of the let was specified (i.e. private or social) then
the tenure was changed to that indicated. • If the reason for the sale did not indicate tenure then the tenure was left unchanged.
It is important to note that the modified tenure created from the EPC data should only ever be used for work relating to energy efficiency and carbon reduction. This is a legal requirement stemming from the collection of the data, and is a licence condition of the data suppliers, Landmark. For this reason the tenure variable supplied in the database is NOT based on EPC data; however, the calculations used to determine the SimpleSAP rating and other energy characteristics of the dwelling do make use of the EPC tenure.
Where the energy data provides information on loft insulation, wall insulation, the location of a flat within a block and floor area this information will be used in favour of any imputed information, as long as the OS data is in agreement with the dwelling type.
Where energy data on wall type is present for a dwelling in a block of flats, terrace or semi-detached, that data is extrapolated to the rest of the block or terrace. If multiple dwellings with energy data are present then the most common wall type is used. Note that where the energy data indicates a wall type that is not the predominant one, this data will not be overwritten with the predominant type – the data reported in the energy database will always be used even if this results in two different wall types being present in a terrace or a block of flats.
For flats it is assumed that all flats in the block will have the same level of double glazing and as the case for which we have energy data for. If there are multiple flats in the block with energy data showing different levels of double glazing, an average will be used. It is assumed that all flats in a block share the same heating type, boiler type if present, fuel type and heating controls. Where there are multiple types present, the predominant type is used. Flats are assumed to have the same hot water source, and if one flat benefits from solar hot water it is assumed that all flats in the block do.
B.4 OS MasterMap information
The OS data has been used to update a number of the SimpleCO2 model inputs. The most valuable use of the OS data is the ability to determine the dwelling type with much greater confidence.
The existing dwelling type is replaced with a new dwelling type derived from OS data. By looking at the number of residential address points it can be inferred whether the building is a house or block of flats (houses have one residential address point and blocks of flats have two or more).

Integrated Dwelling Level Housing Stock Modelling and Database
Commercial in Confidence
Template Version V2-082014
© Building Research Establishment Ltd
Report No. QUO-01528-F6X3H0
Page 93 of 110
Houses - where the dwelling is a house the number of other buildings it is attached to can be observed and the following assumptions made:
• If there are no other dwellings attached, the house is detached. • If two dwellings are joined to one another, but not to any other dwellings, they are semi-detached. • If they are attached to two or more other dwellings, they are mid terraced. • If they are attached to only one dwelling, but that dwelling is a mid-terrace, they are an end-terrace.
Flats - if the building is a block of flats, its exact nature is determined by its age and the number of flats in the block and the following assumptions made:
• If there are between two and four flats in the block (inclusive) and the dwelling was built before 1980 then it is a conversion.
• Otherwise it is purpose built. This information can also be used to reconcile discrepancies within blocks of flats, terraced and semi-detached houses. These discrepancies occur in variables such as dwelling age, location of flat in block, number of storeys, loft insulation, wall insulation, wall type and floor area. Looking at dwelling age, although the OS data does not itself provide any information on age, it does allow reconciliation of age data within semi-detached, terraces and blocks of flats. Where a group of buildings are all attached in some way, such as a terrace, it is logical to assume that they were built at the same time. Therefore the age of each building is replaced with the most common age among those present. Where the most common age occurs in equal numbers, this is resolved by looking at the average age of houses in the same postcode.
If one dwelling has an age that is notably newer than its neighbours, then the age is not changed, as it is assumed that the original dwelling was destroyed and rebuilt.
Figure B. 2 and Figure B. 3 below show how the initial base data is adjusted using the OS data to produce more consistent and reliable results.
Considering the number of storeys and the location of a flat in its block, if the OS data reveals that the dwelling type is significantly different from the original value – specifically if a house becomes a flat, or vice versa then the variables are adjusted. If this is the case a new location for the flat within the block or the number of storeys will be imputed using the same method as before, but taking into account the revised dwelling type.
Similarly with floor area, loft insulation and wall type - if the dwelling type or location of a flat within a block changes as a result of OS data then the variables are calculated using the same method of imputation as the original models, but taking into account the new data.

Integrated Dwelling Level Housing Stock Modelling and Database
Commercial in Confidence
Template Version V2-082014
© Building Research Establishment Ltd
Report No. QUO-01528-F6X3H0
Page 94 of 110
Figure B. 2: Dwelling level map showing the base data, prior to using the OS data
Figure B. 3: Dwelling level map showing the OS updated data
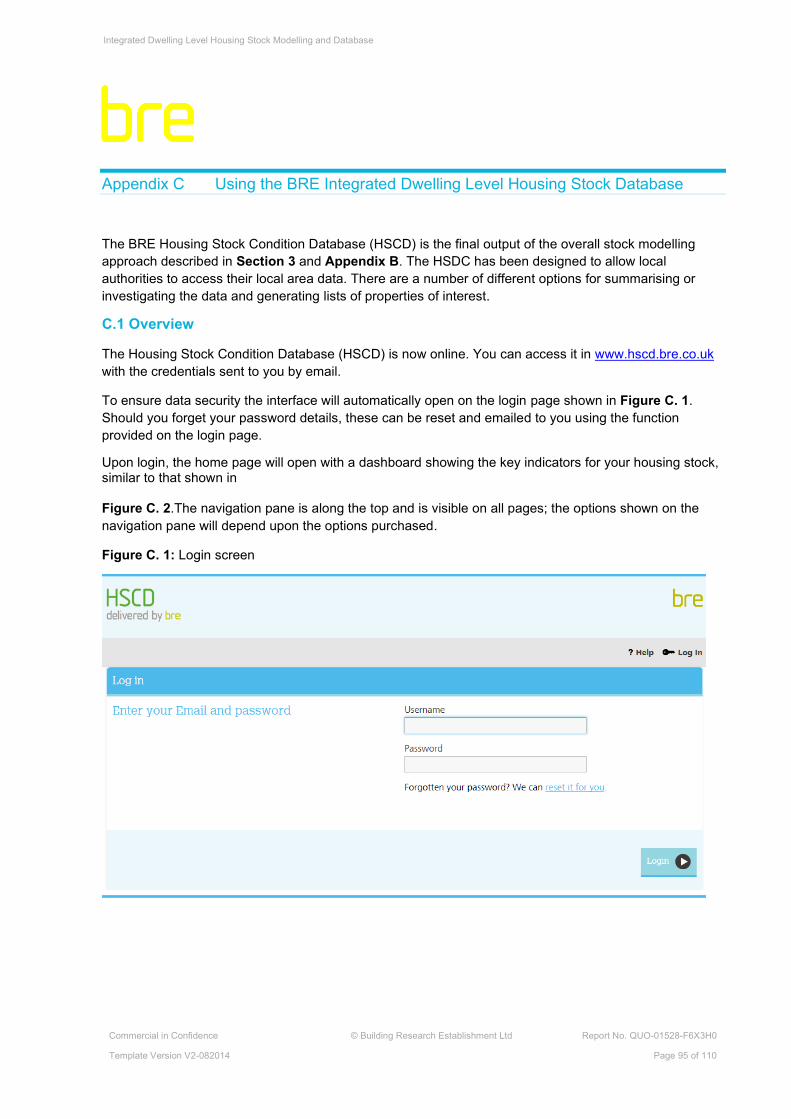
Integrated Dwelling Level Housing Stock Modelling and Database
Commercial in Confidence
Template Version V2-082014
© Building Research Establishment Ltd
Report No. QUO-01528-F6X3H0
Page 95 of 110
Appendix C Using the BRE Integrated Dwelling Level Housing Stock Database
The BRE Housing Stock Condition Database (HSCD) is the final output of the overall stock modelling approach described in Section 3 and Appendix B. The HSDC has been designed to allow local authorities to access their local area data. There are a number of different options for summarising or investigating the data and generating lists of properties of interest.
C.1 Overview
The Housing Stock Condition Database (HSCD) is now online. You can access it in www.hscd.bre.co.uk with the credentials sent to you by email.
To ensure data security the interface will automatically open on the login page shown in Figure C. 1. Should you forget your password details, these can be reset and emailed to you using the function provided on the login page.
Upon login, the home page will open with a dashboard showing the key indicators for your housing stock, similar to that shown in
Figure C. 2.The navigation pane is along the top and is visible on all pages; the options shown on the navigation pane will depend upon the options purchased.
Figure C. 1: Login screen

Integrated Dwelling Level Housing Stock Modelling and Database
Commercial in Confidence
Template Version V2-082014
© Building Research Establishment Ltd
Report No. QUO-01528-F6X3H0
Page 96 of 110
Figure C. 2 Home page (note screenshot below is sample data)
Please refer to the user guide accessible via the log in page under the help button.

Integrated Dwelling Level Housing Stock Modelling and Database
Commercial in Confidence
Template Version V2-082014
© Building Research Establishment Ltd
Report No. QUO-01528-F6X3H0
Page 97 of 110
Appendix D Additional Maps
This Appendix provides close up maps for each indicator, focussing in on the urban area of Bedford. These maps show the clear urban – rural divide in many of the housing indicators. The larger maps included above in the report do not always allow for the appreciation that smaller and denser COAs in urban areas are very different in their hazards to the surrounding rural COAs which are larger and are immediately more eye-catching.
Map D. 1: Bedford estimated category 1 hazards – private stock Return to main report

Integrated Dwelling Level Housing Stock Modelling and Database
Commercial in Confidence
Template Version V2-082014
© Building Research Establishment Ltd
Report No. QUO-01528-F6X3H0
Page 98 of 110
Map D. 2: Bedford estimated households with excess cold – private stock Return to main report
Map D. 3: Bedford estimated households with falls hazards – private stock Return to main report

Integrated Dwelling Level Housing Stock Modelling and Database
Commercial in Confidence
Template Version V2-082014
© Building Research Establishment Ltd
Report No. QUO-01528-F6X3H0
Page 99 of 110
Map D. 4: Bedford estimated households in disrepair – private stock Return to main report
Map D. 5: Bedford estimated households in fuel poverty (LIHC definition) – private stock Return to main report

Integrated Dwelling Level Housing Stock Modelling and Database
Commercial in Confidence
Template Version V2-082014
© Building Research Establishment Ltd
Report No. QUO-01528-F6X3H0
Page 100 of 110
Map D. 6: Bedford estimated households in fuel poverty (10% definition) – private stock Return to main report
Map D. 7: Bedford estimated households in low income – private stock Return to main report

Integrated Dwelling Level Housing Stock Modelling and Database
Commercial in Confidence
Template Version V2-082014
© Building Research Establishment Ltd
Report No. QUO-01528-F6X3H0
Page 101 of 110
Map D. 8: Bedford estimated households with excess cold and in low income – private stock Return to main report
Map D. 9: Bedford estimated average SimpleSAP households – private stock Return to main report

Integrated Dwelling Level Housing Stock Modelling and Database
Commercial in Confidence
Template Version V2-082014
© Building Research Establishment Ltd
Report No. QUO-01528-F6X3H0
Page 102 of 110
Map D. 10: Bedford estimated HMOs Return to main report
Map D. 11: Bedford estimated licensable HMOs (current definition) Return to main report

Integrated Dwelling Level Housing Stock Modelling and Database
Commercial in Confidence
Template Version V2-082014
© Building Research Establishment Ltd
Report No. QUO-01528-F6X3H0
Page 103 of 110
Map D. 12: Bedford estimated licensable HMOs (proposed definition) Return to main report
Map D. 13: Bedford estimated households with EPC ratings F or G – private rented Return to main report

Integrated Dwelling Level Housing Stock Modelling and Database
Commercial in Confidence
Template Version V2-082014
© Building Research Establishment Ltd
Report No. QUO-01528-F6X3H0
Page 104 of 110
Map D. 14: Bedford estimated un-insulated cavity wall households – private stock Return to main report
Map D. 15: Bedford estimated solid wall households– private stock Return to main report

Integrated Dwelling Level Housing Stock Modelling and Database
Commercial in Confidence
Template Version V2-082014
© Building Research Establishment Ltd
Report No. QUO-01528-F6X3H0
Page 105 of 110
Map D. 16: Bedford estimated households with less than 100mm loft insulation – private stock Return to main report
Map D. 17: Bedford estimated total energy demand – private stock Return to main report

Integrated Dwelling Level Housing Stock Modelling and Database
Commercial in Confidence
Template Version V2-082014
© Building Research Establishment Ltd
Report No. QUO-01528-F6X3H0
Page 106 of 110
Map D. 18: Bedford estimated total energy cost – private stock Return to main report
Map D. 19: Bedford estimated total heat demand – private stock Return to main report

Integrated Dwelling Level Housing Stock Modelling and Database
Commercial in Confidence
Template Version V2-082014
© Building Research Establishment Ltd
Report No. QUO-01528-F6X3H0
Page 107 of 110
Map D. 20: Bedford estimated total heating cost – private stock Return to main report

Integrated Dwelling Level Housing Stock Modelling and Database
Commercial in Confidence
Template Version V2-082014
© Building Research Establishment Ltd
Report No. QUO-01528-F6X3H0
Page 108 of 110
Glossary of terms
BREDEM BRE Domestic Energy Model
Category 1 hazard Hazards with a HHSRS score of > 1,000. A dwelling with a category 1 hazard is considered to fail the minimum statutory standard for housing
CLG Department for Communities and Local Government
COA Census Output Area
Designed for statistical purposes, built from postcode units, approximately 125 households
Disrepair Based on former Decent Homes Standard criteria which states that a dwelling fails this if it is not in a reasonable state of repair – this is based on the dwelling age and condition of a range of building components including walls, roofs, windows, doors, electrics and heating systems
ECO Energy Companies Obligation
Places legal obligations on the larger energy suppliers to deliver energy efficiency measures to domestic energy users
EHS English Housing Survey
A continuous national survey commissioned by the Ministry of Housing, Communities and Local Government (MHCLG). It collects information about people’s housing circumstances and the condition and energy efficiency of housing in England
EPC Energy Performance Certificate
Present the energy efficiency of domestic properties on a scale of A (most efficient) to G (least efficient)
Fuel poverty The original definition of fuel poverty states that a household is in fuel poverty if it needs to spend more than 10% of their income on fuel to maintain an adequate level of warmth (10% definition). The new definition now adopted by government is that a household is said to be in fuel poverty if they have fuel costs that are above average and were they to spend that amount they would be left with a residual income below the official poverty line (Low Income High Costs definition)
GIS Geographic Information System
A system designed to capture, store, manipulate, analyse, manage and present spatial or geographical data
HHSRS Housing Health and Safety Rating System
A risk assessment tool to help local authorities identify and protect against potential risks and hazards to health and safety related deficiencies in dwellings, covering 29 categories of hazards

Integrated Dwelling Level Housing Stock Modelling and Database
Commercial in Confidence
Template Version V2-082014
© Building Research Establishment Ltd
Report No. QUO-01528-F6X3H0
Page 109 of 110
HIA Health Impact Assessment
A formal method of assessing the impact of a project, procedure or strategy on the health of a population
HMO Houses in Multiple Occupation
An entire house or flat which is let to 3 or more tenants who form 2 or more households and who share a kitchen, bathroom or toilet
A house which has been converted entirely into bedsits or other non-self-contained accommodation and which is let to 3 or more tenants who form two or more households and who share kitchen, bathroom or toilet facilities
A converted house which contains one or more flats which are not wholly self-contained (i.e. the flat does not contain within it a kitchen, bathroom and toilet) and which is occupied by 3 or more tenants who form two or more households
A building which is converted entirely into self-contained flats if the conversion did not meet the standards of the 1991 Building Regulations and more than one-third of the flats are let on short-term tenancies
In order to be an HMO the property must be used as the tenants’ only or main residence and it should be used solely or mainly to house tenants. Properties let to students and migrant workers will be treated as their only or main residence and the same will apply to properties which are used as domestic refuges
HSM Housing Stock Model
Desktop based modelling used to determine the condition of the housing stock
Jenks’ Natural Breaks The natural breaks classification method is a data clustering method determining the best arrangement of values into different classes. It is achieved through minimising each class’s average deviation from the class mean while maximising each class’s deviation from the means of the other groups. The method seeks to reduce the variance within classes and maximise variance between classes thus ensuring groups are distinctive
JSNA Joint Strategic Needs Assessment
An assessment of the current and future health and social care needs of the local community
LACORs Local Authority Coordinators of Regulatory Services – now renamed Local Government Regulation
LAHS Local Authority Housing Statistics
National statistics on housing owned and managed by local authorities
LIHC Low Income High Cost

Integrated Dwelling Level Housing Stock Modelling and Database
Commercial in Confidence
Template Version V2-082014
© Building Research Establishment Ltd
Report Ends
Report No. QUO-01528-F6X3H0
Page 110 of 110
Measure of fuel poverty, considers a household to be in fuel poverty if required fuel costs are above average, or if they were to spend that amount they would be left with a residual income below the official poverty line
LLPG Local Land and Property Gazetteer
An address database maintained by local authorities
LSOA Lower Super Output Area
Designed for statistical purposes, built from census output areas, approximately 400 households
MHCLG Ministry of Housing, Communities and Local Government
MSOA Medium Super Output Area
Designed for statistical purposes, built from lower super output areas, approximately 2,000 households
NHS National Health Service
Older people People over 65 for the excess cold hazard, people over 60 for the fire and fall hazards (excl. falling between levels)
OS Ordnance Survey
Poor housing Dwellings where a category 1 hazard is present
Private sector housing Housing not owned by the local authority or a housing association
SAP Standard Assessment Procedure
Method system for measurement of energy rating of residential buildings.
SimpleSAP An estimate of a residential dwelling’s likely SAP score, it is not based on the full required range of data for a SAP calculation or a reduced data SAP calculation (RDSAP), it should only ever be considered an estimate of the SAP score, and used as a guide
UPRN Unique Property Reference Number
A unique 12 digit number assigned to every unit of land and property recorded by local authorities as part of their LLPG
Vulnerable persons Persons who are more likely to be affected by the particular hazard as defined by the HHSRS Operating Guidance