Embed Size (px)
Citation preview
BRD - Groupe Société Générale S.A. INTERIM FINANCIAL REPORT SEPTEMBER 30, 2017
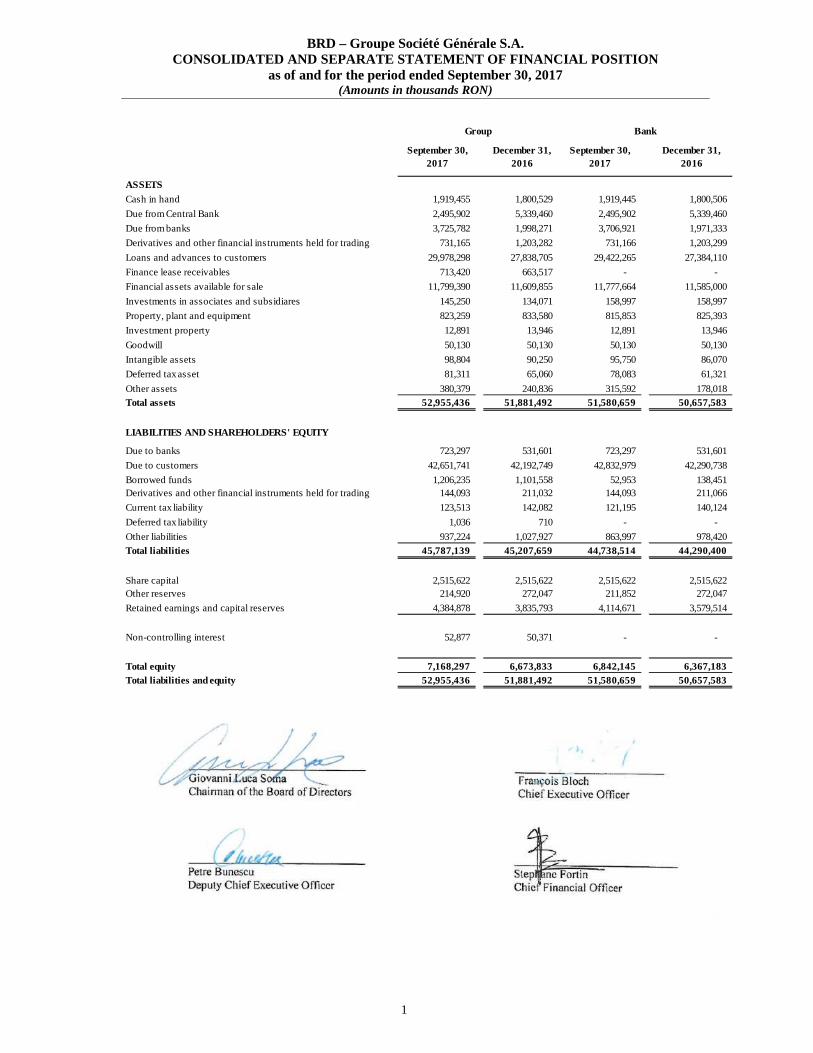
BRD – Groupe Société Générale S.A. CONSOLIDATED AND SEPARATE STATEMENT OF FINANCIAL PO SITION
as of and for the period ended September 30, 2017 (Amounts in thousands RON)
1
September 30, 2017
December 31, 2016
September 30, 2017
December 31, 2016
ASSETSCash in hand 1,919,455 1,800,529 1,919,445 1,800,506
Due from Central Bank 2,495,902 5,339,460 2,495,902 5,339,460
Due from banks 3,725,782 1,998,271 3,706,921 1,971,333
Derivatives and other financial instruments held for trading 731,165 1,203,282 731,166 1,203,299
Loans and advances to customers 29,978,298 27,838,705 29,422,265 27,384,110
Finance lease receivables 713,420 663,517 - -
Financial assets available for sale 11,799,390 11,609,855 11,777,664 11,585,000
Investments in associates and subsidiares 145,250 134,071 158,997 158,997
Property, plant and equipment 823,259 833,580 815,853 825,393
Investment property 12,891 13,946 12,891 13,946
Goodwill 50,130 50,130 50,130 50,130
Intangible assets 98,804 90,250 95,750 86,070
Deferred tax asset 81,311 65,060 78,083 61,321
Other assets 380,379 240,836 315,592 178,018 Total assets 52,955,436 51,881,492 51,580,659 50,657,583
LIABILITIES AND SHAREHOLDERS' EQUITY
Due to banks 723,297 531,601 723,297 531,601
Due to customers 42,651,741 42,192,749 42,832,979 42,290,738
Borrowed funds 1,206,235 1,101,558 52,953 138,451 Derivatives and other financial instruments held for trading 144,093 211,032 144,093 211,066
Current tax liability 123,513 142,082 121,195 140,124
Deferred tax liability 1,036 710 - -
Other liabilities 937,224 1,027,927 863,997 978,420
Total liabilities 45,787,139 45,207,659 44,738,514 44,290,400
Share capital 2,515,622 2,515,622 2,515,622 2,515,622 Other reserves 214,920 272,047 211,852 272,047
Retained earnings and capital reserves 4,384,878 3,835,793 4,114,671 3,579,514
Non-controlling interest 52,877 50,371 - -
Total equity 7,168,297 6,673,833 6,842,145 6,367,183 Total liabilities and equity 52,955,436 51,881,492 51,580,659 50,657,583
Bank Group
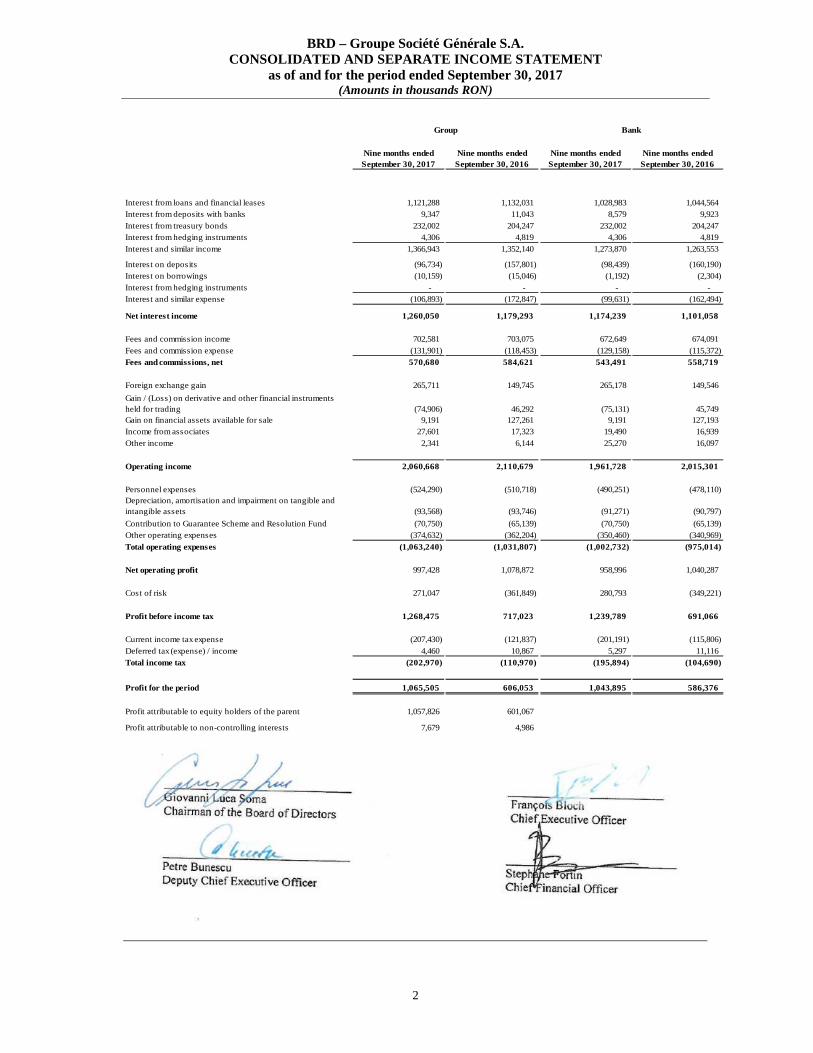
BRD – Groupe Société Générale S.A. CONSOLIDATED AND SEPARATE INCOME STATEMENT
as of and for the period ended September 30, 2017 (Amounts in thousands RON)
2
Nine months ended September 30, 2017
Nine months ended September 30, 2016
Nine months ended September 30, 2017
Nine months ended September 30, 2016
Interest from loans and financial leases 1,121,288 1,132,031 1,028,983 1,044,564 Interest from deposits with banks 9,347 11,043 8,579 9,923 Interest from treasury bonds 232,002 204,247 232,002 204,247 Interest from hedging instruments 4,306 4,819 4,306 4,819 Interest and similar income 1,366,943 1,352,140 1,273,870 1,263,553
Interest on deposits (96,734) (157,801) (98,439) (160,190) Interest on borrowings (10,159) (15,046) (1,192) (2,304) Interest from hedging instruments - - - - Interest and similar expense (106,893) (172,847) (99,631) (162,494)
Net interest income 1,260,050 1,179,293 1,174,239 1,101,058
Fees and commission income 702,581 703,075 672,649 674,091 Fees and commission expense (131,901) (118,453) (129,158) (115,372) Fees and commissions, net 570,680 584,621 543,491 558,719
Foreign exchange gain 265,711 149,745 265,178 149,546
Gain / (Loss) on derivative and other financial instruments held for trading (74,906) 46,292 (75,131) 45,749 Gain on financial assets available for sale 9,191 127,261 9,191 127,193 Income from associates 27,601 17,323 19,490 16,939 Other income 2,341 6,144 25,270 16,097
Operating income 2,060,668 2,110,679 1,961,728 2,015,301
Personnel expenses (524,290) (510,718) (490,251) (478,110) Depreciation, amortisation and impairment on tangible and intangible assets (93,568) (93,746) (91,271) (90,797)
Contribution to Guarantee Scheme and Resolution Fund (70,750) (65,139) (70,750) (65,139) Other operating expenses (374,632) (362,204) (350,460) (340,969)
Total operating expenses (1,063,240) (1,031,807) (1,002,732) (975,014)
Net operating profit 997,428 1,078,872 958,996 1,040,287
Cost of risk 271,047 (361,849) 280,793 (349,221)
Profit before income tax 1,268,475 717,023 1,239,789 691,066
Current income tax expense (207,430) (121,837) (201,191) (115,806) Deferred tax (expense) / income 4,460 10,867 5,297 11,116 Total income tax (202,970) (110,970) (195,894) (104,690)
Profit for the period 1,065,505 606,053 1,043,895 586,376
Profit attributable to equity holders of the parent 1,057,826 601,067
Profit attributable to non-controlling interests 7,679 4,986
BankGroup
Quarterly Report
September 30, 2017
according to National Securities Commission Regulation no 1/2006
Page | 2
BRD | QUARTERLY REPORT
CONTENTS
1. THE COMPANY AND ITS SHAREHOLDERS............................................................................ 3
2. ECONOMIC AND BANKING ENVIRONMENT ........................................................................... 7
3. COMMERCIAL ACTIVITY ........................................................................................................ 8
4. FINANCIAL RESULTS AND RATIOS .......................................................................................11
5. CONCLUSIONS .......................................................................................................................16
Page | 3
BRD | QUARTERLY REPORT
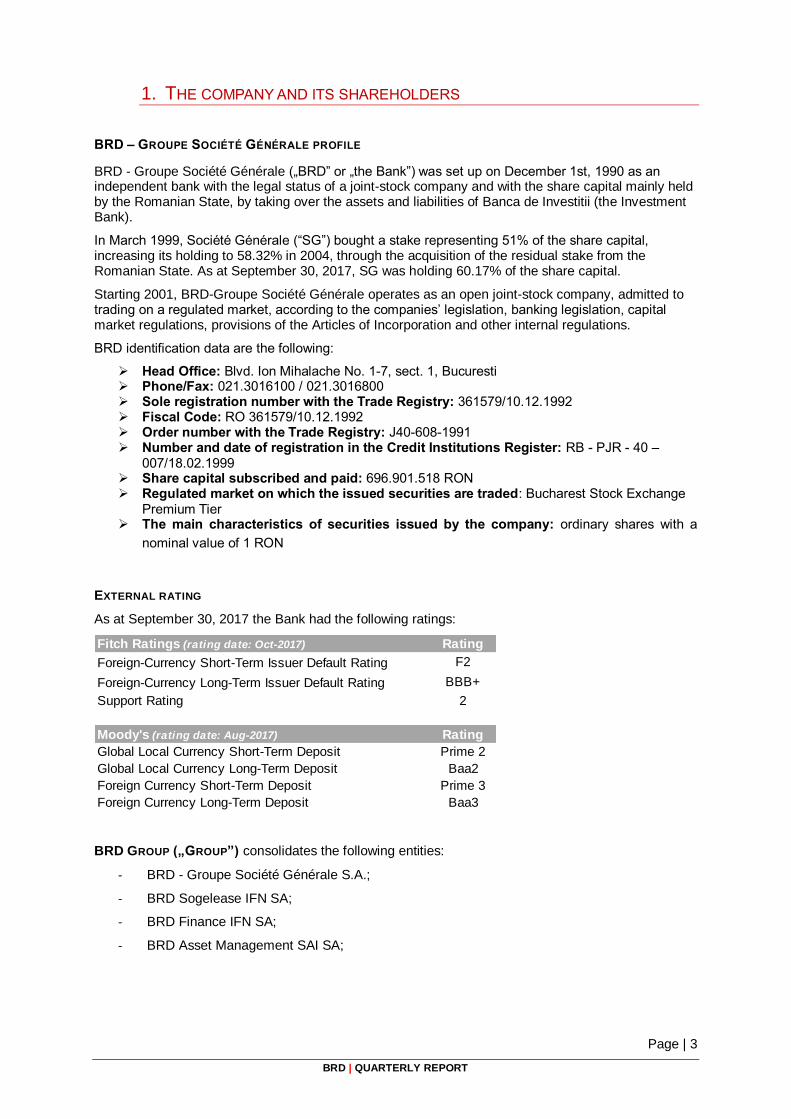
1. THE COMPANY AND ITS SHAREHOLDERS
BRD – GROUPE SOCIÉTÉ GÉNÉRALE PROFILE
BRD - Groupe Société Générale („BRD” or „the Bank”) was set up on December 1st, 1990 as an independent bank with the legal status of a joint-stock company and with the share capital mainly held by the Romanian State, by taking over the assets and liabilities of Banca de Investitii (the Investment Bank).
In March 1999, Société Générale (“SG”) bought a stake representing 51% of the share capital, increasing its holding to 58.32% in 2004, through the acquisition of the residual stake from the Romanian State. As at September 30, 2017, SG was holding 60.17% of the share capital.
Starting 2001, BRD-Groupe Société Générale operates as an open joint-stock company, admitted to trading on a regulated market, according to the companies’ legislation, banking legislation, capital market regulations, provisions of the Articles of Incorporation and other internal regulations.
BRD identification data are the following:
Head Office: Blvd. Ion Mihalache No. 1-7, sect. 1, Bucuresti Phone/Fax: 021.3016100 / 021.3016800 Sole registration number with the Trade Registry: 361579/10.12.1992
Fiscal Code: RO 361579/10.12.1992
Order number with the Trade Registry: J40-608-1991 Number and date of registration in the Credit Institutions Register: RB - PJR - 40 –
007/18.02.1999 Share capital subscribed and paid: 696.901.518 RON Regulated market on which the issued securities are traded: Bucharest Stock Exchange
Premium Tier The main characteristics of securities issued by the company: ordinary shares with a
nominal value of 1 RON
EXTERNAL RATING
As at September 30, 2017 the Bank had the following ratings:
BRD GROUP („GROUP”) consolidates the following entities:
- BRD - Groupe Société Générale S.A.;
- BRD Sogelease IFN SA;
- BRD Finance IFN SA;
- BRD Asset Management SAI SA;
Fitch Ratings (rating date: Oct-2017) Rating
Foreign-Currency Short-Term Issuer Default Rating F2
Foreign-Currency Long-Term Issuer Default Rating BBB+
Support Rating 2
Moody's (rating date: Aug-2017) Rating
Global Local Currency Short-Term Deposit Prime 2
Global Local Currency Long-Term Deposit Baa2
Foreign Currency Short-Term Deposit Prime 3
Foreign Currency Long-Term Deposit Baa3
Page | 4
BRD | QUARTERLY REPORT
SOCIÉTÉ GÉNÉRALE PROFILE
Société Générale was set up in 1864 as a banking company, registered in France. Its head office is located on 29 Boulevard Haussmann, 75009, Paris, France, and its shares are listed on the Paris Stock Exchange.
Société Générale is one of the largest European financial services groups. Based on a diversified universal banking model, the Group combines financial solidity with a strategy of sustainable growth, and aims to be the reference for relationship banking, recognised on its markets, close to clients, chosen for the quality and commitment of its teams.
Société Générale has been playing a vital role in the economy for 150 years. With more than 145,000 employees, based in 66 countries, Société Générale accompanies 31 million clients throughout the world on a daily basis. Société Générale’s teams offer advice and services to individual, corporate and institutional customers in three core businesses:
Retail banking in France with the Société Générale branch network, Credit du Nord and Boursorama, offering a comprehensive range of multi channel financial services at the leading edge of digital innovation;
International retail banking, financial services and insurance with a presence in developing economies and leading specialised businesses;
Corporate and investment banking, private banking, asset management and securities services, with recognized expertise, top international rankings and integrated solutions.
As at September 30, 2017, the ratings of Société Générale were:
Standard and Poor's: A
Moody's: A2
Fitch: A
BRD POSITION WITHIN SOCIÉTÉ GÉNÉRALE
SG has been present in Romania since 1980, being the only significant bank from Western Europe that was present in Romania during the communist era.
In 1999, it takes part in the process of privatization of Banca Română pentru Dezvoltare and acquires 51% of the bank’s share capital.
Starting with this period, BRD lined up its operational procedures and business practices to those of the parent company.
BRD is part of the international network of Société Générale, managed by the International retail banking and financial services division (IBFS) that aims to offer a broad range of products and services to individuals, professionals and corporates. Its global development is built upon:
The international universal banking and consumer credit networks, organised around three
regions: Europe, Russia and Africa / Asia / Mediterranean Basin & Overseas;
Three specialised businesses, leaders in their markets: Insurance, Car Renting and Fleet
Management, Equipment and Vendor Finance.
Page | 5
BRD | QUARTERLY REPORT
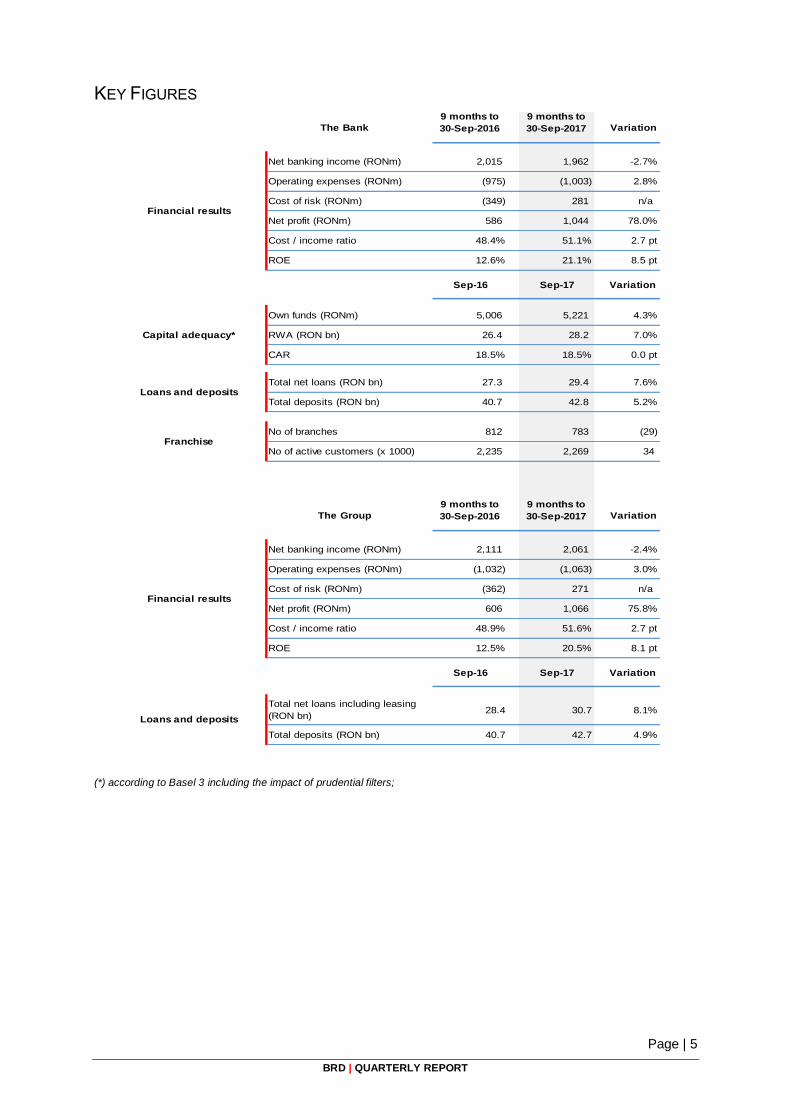
KEY FIGURES
The Bank
9 months to
30-Sep-2016
9 months to
30-Sep-2017 Variation
Net banking income (RONm) 2,015 1,962 -2.7%
Operating expenses (RONm) (975) (1,003) 2.8%
Cost of risk (RONm) (349) 281 n/a
Net profit (RONm) 586 1,044 78.0%
Cost / income ratio 48.4% 51.1% 2.7 pt
ROE 12.6% 21.1% 8.5 pt
Sep-16 Sep-17 Variation
Own funds (RONm) 5,006 5,221 4.3%
RWA (RON bn) 26.4 28.2 7.0%
CAR 18.5% 18.5% 0.0 pt
Total net loans (RON bn) 27.3 29.4 7.6%
Total deposits (RON bn) 40.7 42.8 5.2%
No of branches 812 783 (29)
No of active customers (x 1000) 2,235 2,269 34
The Group
9 months to
30-Sep-2016
9 months to
30-Sep-2017 Variation
Net banking income (RONm) 2,111 2,061 -2.4%
Operating expenses (RONm) (1,032) (1,063) 3.0%
Cost of risk (RONm) (362) 271 n/a
Net profit (RONm) 606 1,066 75.8%
Cost / income ratio 48.9% 51.6% 2.7 pt
ROE 12.5% 20.5% 8.1 pt
Sep-16 Sep-17 Variation
Total net loans including leasing
(RON bn)28.4 30.7 8.1%
Total deposits (RON bn) 40.7 42.7 4.9%
Financial results
Loans and deposits
Financial results
Capital adequacy*
Loans and deposits
Franchise
(*) according to Basel 3 including the impact of prudential filters;
Page | 6
BRD | QUARTERLY REPORT
BRD SHARE
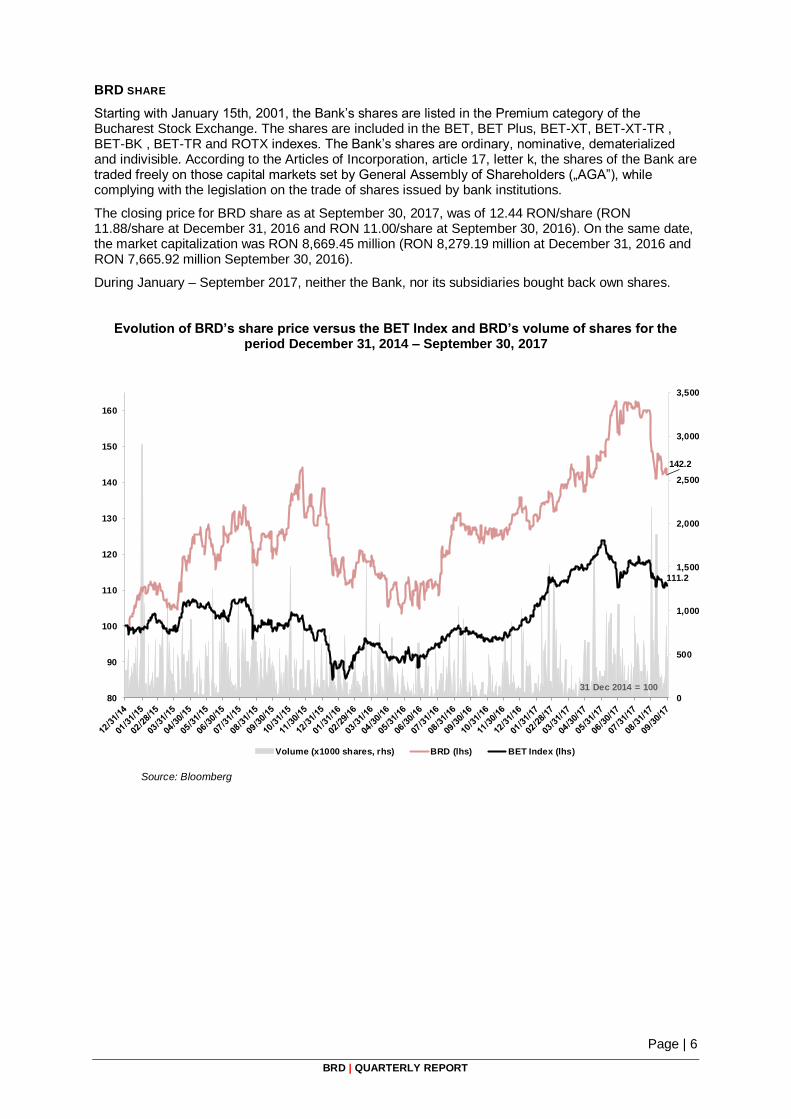
Starting with January 15th, 2001, the Bank’s shares are listed in the Premium category of the Bucharest Stock Exchange. The shares are included in the BET, BET Plus, BET-XT, BET-XT-TR , BET-BK , BET-TR and ROTX indexes. The Bank’s shares are ordinary, nominative, dematerialized and indivisible. According to the Articles of Incorporation, article 17, letter k, the shares of the Bank are traded freely on those capital markets set by General Assembly of Shareholders („AGA”), while complying with the legislation on the trade of shares issued by bank institutions.
The closing price for BRD share as at September 30, 2017, was of 12.44 RON/share (RON 11.88/share at December 31, 2016 and RON 11.00/share at September 30, 2016). On the same date, the market capitalization was RON 8,669.45 million (RON 8,279.19 million at December 31, 2016 and RON 7,665.92 million September 30, 2016).
During January – September 2017, neither the Bank, nor its subsidiaries bought back own shares.
Evolution of BRD’s share price versus the BET Index and BRD’s volume of shares for the period December 31, 2014 – September 30, 2017
142.2
111.2
0
500
1,000
1,500
2,000
2,500
3,000
3,500
80
90
100
110
120
130
140
150
160
Volume (x1000 shares, rhs) BRD (lhs) BET Index (lhs)
31 Dec 2014 = 100
Source: Bloomberg
Page | 7
BRD | QUARTERLY REPORT
2. ECONOMIC AND BANKING ENVIRONMENT
Romania GDP increased by 5.9% YoY in the second quarter of 2017, further driven by private consumption advance (+7.4%YoY) while fixed investments contracted by 0.3% YoY.
The annual inflation rate continued to rise in September (+1.8% YoY) and the increasing dynamics were shared by prices for both food (+2.74% YoY) and non-food products (+1.89% YoY) while tariffs of services registered a minor decrease (-0.16% YoY).
NBR decided to narrow the symmetrical corridor of interest rate on the standing facilities around the policy rate to ±1.25% from ±1.50% previously, giving a first signal of monetary policy tightening at the last monetary policy meeting on October 3rd, 2017. However, the key interest rate (1.75%) was left unchanged, as well as the minimum reserves requirements for RON and FX liabilities (both at 8%).
As of September 2017, the growth of the total gross loans granted by banks speeded up, reaching an increase of +5.7% YoY (from +3.5% YoY at June 2017 end and +2.3% YoY at March 2017 end). Both households and companies segments contributed to the favorable dynamic, as lending to households increased by +6.2% YoY while lending to companies accelerated to +5.2% in annual terms. The Prima Casa programme continued to sustain the advance of the housing loans (+10.7% YoY), whereas consumer loans recorded further gains (+1.5% YoY) pushed by the increase in the disposable income.
The ratio of non-performing loans for the banking system (defined according to European Banking Authority methodology) remained on a downward trend. NPL ratio dropped to 8.19% at the end of August 2017 from 10.56% at the end of August 2016 (NPL ratio of 16.02% at August 2015 end) influenced by write-off operations and sale of defaulted loans portfolios performed by the banks.
Page | 8
BRD | QUARTERLY REPORT
3. COMMERCIAL ACTIVITY
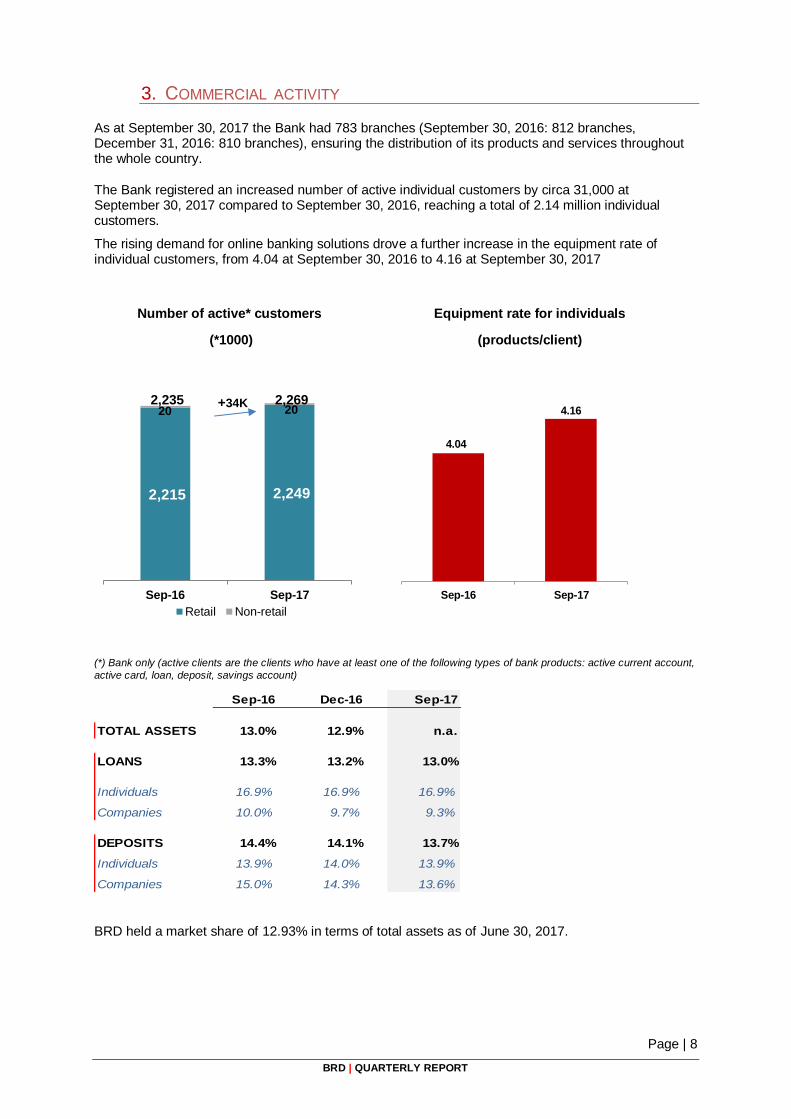
As at September 30, 2017 the Bank had 783 branches (September 30, 2016: 812 branches, December 31, 2016: 810 branches), ensuring the distribution of its products and services throughout the whole country.
The Bank registered an increased number of active individual customers by circa 31,000 at September 30, 2017 compared to September 30, 2016, reaching a total of 2.14 million individual customers.
The rising demand for online banking solutions drove a further increase in the equipment rate of individual customers, from 4.04 at September 30, 2016 to 4.16 at September 30, 2017
Number of active* customers
(*1000)
Equipment rate for individuals
(products/client)
4.04
4.16
Sep-16 Sep-17
(*) Bank only (active clients are the clients who have at least one of the following types of bank products: active current account,
active card, loan, deposit, savings account)
Sep-16 Dec-16 Sep-17
TOTAL ASSETS 13.0% 12.9% n.a.
LOANS 13.3% 13.2% 13.0%
Individuals 16.9% 16.9% 16.9%
Companies 10.0% 9.7% 9.3%
DEPOSITS 14.4% 14.1% 13.7%
Individuals 13.9% 14.0% 13.9%
Companies 15.0% 14.3% 13.6%
BRD held a market share of 12.93% in terms of total assets as of June 30, 2017.
2,215 2,249
20 20 2,235 2,269
Sep-16 Sep-17
Retail Non-retail
+34K
Page | 9
BRD | QUARTERLY REPORT
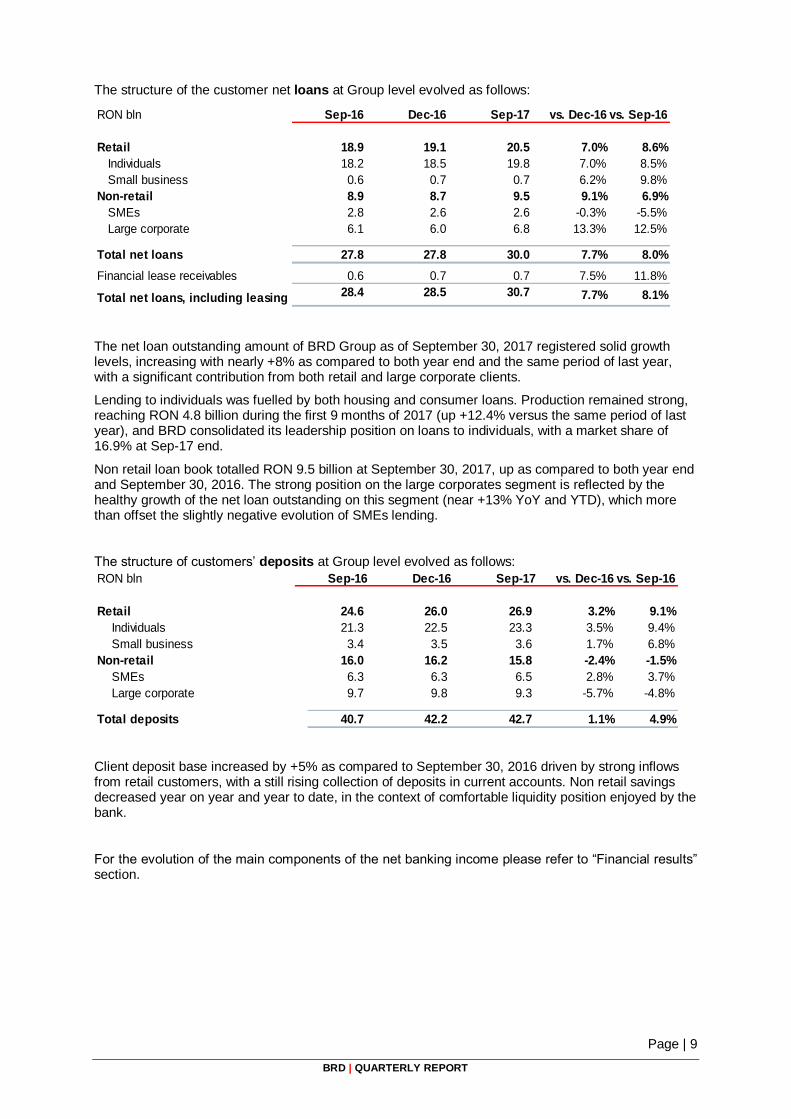
The structure of the customer net loans at Group level evolved as follows:
RON bln Sep-16 Dec-16 Sep-17 vs. Dec-16 vs. Sep-16
Retail 18.9 19.1 20.5 7.0% 8.6%
Individuals 18.2 18.5 19.8 7.0% 8.5%
Small business 0.6 0.7 0.7 6.2% 9.8%
Non-retail 8.9 8.7 9.5 9.1% 6.9%
SMEs 2.8 2.6 2.6 -0.3% -5.5%
Large corporate 6.1 6.0 6.8 13.3% 12.5%
Total net loans 27.8 27.8 30.0 7.7% 8.0%
Financial lease receivables 0.6 0.7 0.7 7.5% 11.8%
Total net loans, including leasing 28.4 28.5 30.7 7.7% 8.1%
The net loan outstanding amount of BRD Group as of September 30, 2017 registered solid growth levels, increasing with nearly +8% as compared to both year end and the same period of last year, with a significant contribution from both retail and large corporate clients.
Lending to individuals was fuelled by both housing and consumer loans. Production remained strong, reaching RON 4.8 billion during the first 9 months of 2017 (up +12.4% versus the same period of last year), and BRD consolidated its leadership position on loans to individuals, with a market share of 16.9% at Sep-17 end.
Non retail loan book totalled RON 9.5 billion at September 30, 2017, up as compared to both year end and September 30, 2016. The strong position on the large corporates segment is reflected by the healthy growth of the net loan outstanding on this segment (near +13% YoY and YTD), which more than offset the slightly negative evolution of SMEs lending.
The structure of customers’ deposits at Group level evolved as follows:
RON bln Sep-16 Dec-16 Sep-17 vs. Dec-16 vs. Sep-16
Retail 24.6 26.0 26.9 3.2% 9.1%
Individuals 21.3 22.5 23.3 3.5% 9.4%
Small business 3.4 3.5 3.6 1.7% 6.8%
Non-retail 16.0 16.2 15.8 -2.4% -1.5%
SMEs 6.3 6.3 6.5 2.8% 3.7%
Large corporate 9.7 9.8 9.3 -5.7% -4.8%
Total deposits 40.7 42.2 42.7 1.1% 4.9% Client deposit base increased by +5% as compared to September 30, 2016 driven by strong inflows from retail customers, with a still rising collection of deposits in current accounts. Non retail savings decreased year on year and year to date, in the context of comfortable liquidity position enjoyed by the bank.
For the evolution of the main components of the net banking income please refer to “Financial results” section.
Page | 10
BRD | QUARTERLY REPORT
SUBSIDIARIES ACTIVITY
BRD SOGELEASE IFN SA
As of September 30, 2017, BRD Sogelease’s net outstanding of leasing financing was RON 713.4 million (+12% YoY). New leasing production reached RON 321 million at the end of September 2017 end, with commercial vehicles and passenger cars having the largest weight, followed by agricultural, construction and industrial equipment.
According to the latest statistics issued by the Financial Companies Association in Romania (ALB) at December 31, 2016, BRD Sogelease had a market share of 7.7%, compared to 6.4% at December 31, 2015.
BRD FINANCE IFN SA
BRD Finance results for the first 9 months continued the positive trend from previous periods, showing an increase of +19% in net loans outstanding, driven by the good performance on new customer acquisition, especially through credit cards and car loans. The net banking income amounted to RON 72 million, +9% compared to the same period of previous year, while the net result reached RON 15 million, up +52%. The performance was sustained by the continuation of the commercial strategy based on the consolidation and development of key partnerships, combined with the constant optimization of internal processes and a strict control of costs and risks.
BRD ASSET MANAGEMENT SA
BRD Asset Management is one of the important actors on the Romanian UCITS market, with a market share of 12.5%* (vs 12.2% at September 2016) and RON 3.16 bn assets under management at September 2017 end. BRD Asset Management offers 7 different open-end funds, all with their specific portfolio structure, risks and target yield and re commended investment period. Among those, BRD Simfonia, BRD Obligatiuni (denominated in RON), BRD Euro Fond (denominated in Euro) and BRD USD Fond (denominated in USD) invest in bonds, fixed income and money market instruments and have no stock holdings. BRD Diverso (denominated in RON and Euro) is a balanced fund with investments in Central and Eastern Europe stock markets, the rest being invested mainly in money market and fixed income instruments for risk spread purposes. BRD Actiuni (denominated in RON and Euro) fund is focused on stocks, as well as BRD Index which is an index tracker fund.
market share computation based on total Open-end Funds assets under management
Page | 11
BRD | QUARTERLY REPORT
4. FINANCIAL RESULTS AND RATIOS
FINANCIAL POSITION ANALYSIS
The below financial position analysis is based on the separate and consolidated financial statements prepared according to the International Financial Reporting Standards, for the period ended September 30, 2017 and the comparative periods.
FINANCIAL POSITION – ASSETS
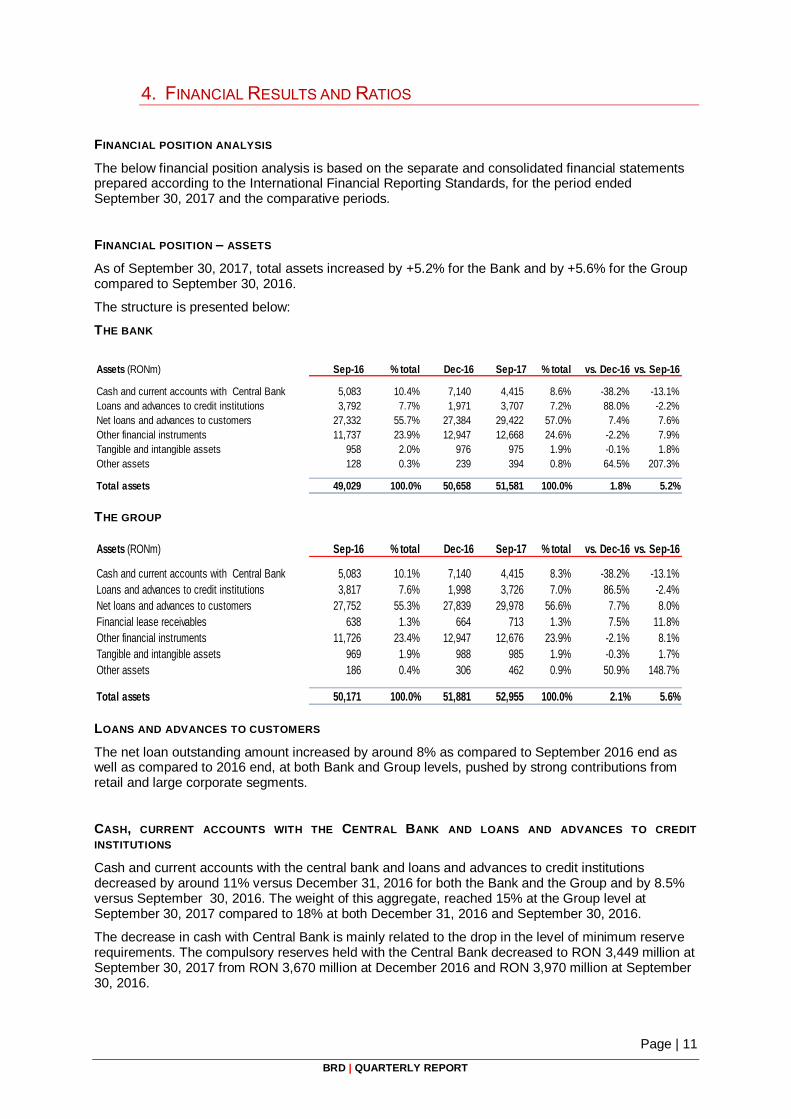
As of September 30, 2017, total assets increased by +5.2% for the Bank and by +5.6% for the Group compared to September 30, 2016.
The structure is presented below:
THE BANK
Assets (RONm) Sep-16 % total Dec-16 Sep-17 % total vs. Dec-16 vs. Sep-16
Cash and current accounts with Central Bank 5,083 10.4% 7,140 4,415 8.6% -38.2% -13.1%
Loans and advances to credit institutions 3,792 7.7% 1,971 3,707 7.2% 88.0% -2.2%
Net loans and advances to customers 27,332 55.7% 27,384 29,422 57.0% 7.4% 7.6%
Other financial instruments 11,737 23.9% 12,947 12,668 24.6% -2.2% 7.9%
Tangible and intangible assets 958 2.0% 976 975 1.9% -0.1% 1.8%
Other assets 128 0.3% 239 394 0.8% 64.5% 207.3%
Total assets 49,029 100.0% 50,658 51,581 100.0% 1.8% 5.2% THE GROUP
Assets (RONm) Sep-16 % total Dec-16 Sep-17 % total vs. Dec-16 vs. Sep-16
Cash and current accounts with Central Bank 5,083 10.1% 7,140 4,415 8.3% -38.2% -13.1%
Loans and advances to credit institutions 3,817 7.6% 1,998 3,726 7.0% 86.5% -2.4%
Net loans and advances to customers 27,752 55.3% 27,839 29,978 56.6% 7.7% 8.0%
Financial lease receivables 638 1.3% 664 713 1.3% 7.5% 11.8%
Other financial instruments 11,726 23.4% 12,947 12,676 23.9% -2.1% 8.1%
Tangible and intangible assets 969 1.9% 988 985 1.9% -0.3% 1.7%
Other assets 186 0.4% 306 462 0.9% 50.9% 148.7%
Total assets 50,171 100.0% 51,881 52,955 100.0% 2.1% 5.6% LOANS AND ADVANCES TO CUSTOMERS
The net loan outstanding amount increased by around 8% as compared to September 2016 end as well as compared to 2016 end, at both Bank and Group levels, pushed by strong contributions from retail and large corporate segments.
CASH, CURRENT ACCOUNTS WITH THE CENTRAL BANK AND LOANS AND ADVANCES TO CREDIT
INSTITUTIONS
Cash and current accounts with the central bank and loans and advances to credit institutions decreased by around 11% versus December 31, 2016 for both the Bank and the Group and by 8.5% versus September 30, 2016. The weight of this aggregate, reached 15% at the Group level at September 30, 2017 compared to 18% at both December 31, 2016 and September 30, 2016.
The decrease in cash with Central Bank is mainly related to the drop in the level of minimum reserve requirements. The compulsory reserves held with the Central Bank decreased to RON 3,449 million at September 30, 2017 from RON 3,670 million at December 2016 and RON 3,970 million at September 30, 2016.
Page | 12
BRD | QUARTERLY REPORT
OTHER FINANCIAL INSTRUMENTS
Other financial instruments mostly represent treasury bills and bonds issued by the Romanian Government, which are accounted as available for sale and trading instruments, and also derivatives. This item registered an increase as compared to September 2016 end, mainly related to higher investments in Government bonds.
TANGIBLE AND INTANGIBLE ASSETS
The tangible and intangible assets (out of which the largest part is represented by land and buildings) represent around 2% of the total assets.
Total value of investments during January – September 2017 reached approximately RON 95 million for the Bank and the Group (compared to RON 65 million for the Bank and the Group during January – September 2016) and were related mainly to change-the-bank initiatives. There is no capitalized research and development expenditure. FINANCIAL POSITION – LIABILITIES
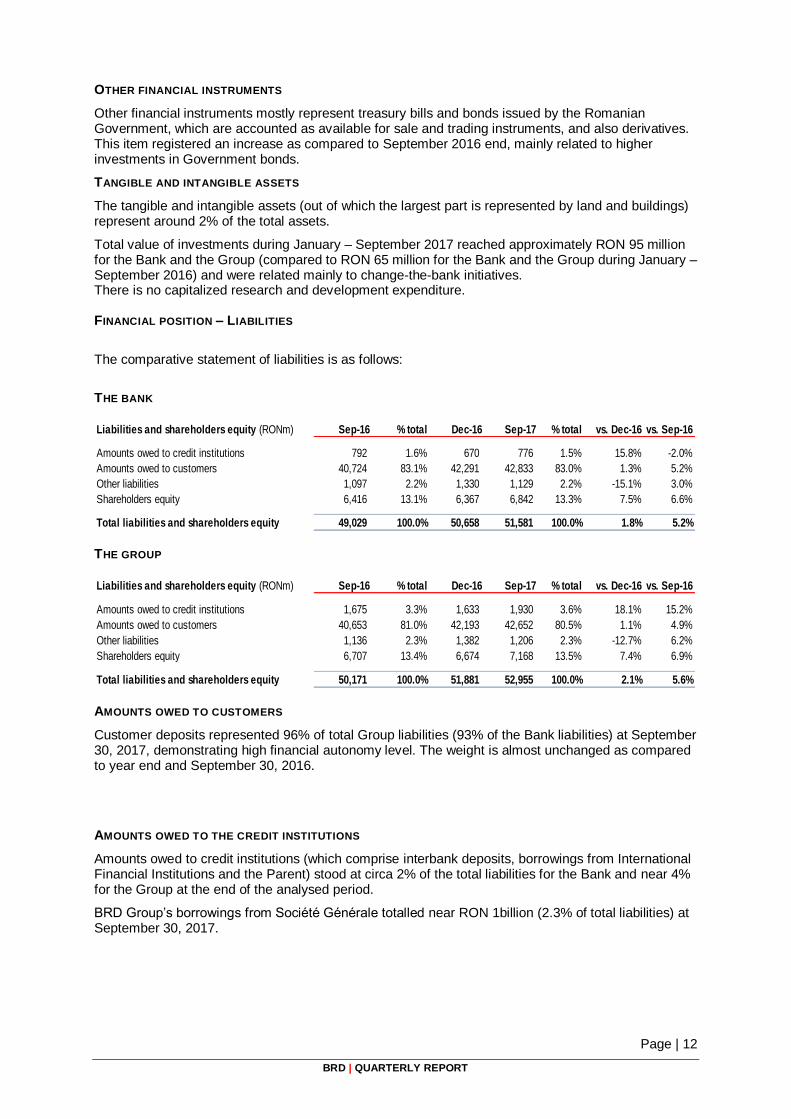
The comparative statement of liabilities is as follows:
THE BANK Liabilities and shareholders equity (RONm) Sep-16 % total Dec-16 Sep-17 % total vs. Dec-16 vs. Sep-16
Amounts owed to credit institutions 792 1.6% 670 776 1.5% 15.8% -2.0%
Amounts owed to customers 40,724 83.1% 42,291 42,833 83.0% 1.3% 5.2%
Other liabilities 1,097 2.2% 1,330 1,129 2.2% -15.1% 3.0%
Shareholders equity 6,416 13.1% 6,367 6,842 13.3% 7.5% 6.6%
Total liabilities and shareholders equity 49,029 100.0% 50,658 51,581 100.0% 1.8% 5.2% THE GROUP Liabilities and shareholders equity (RONm) Sep-16 % total Dec-16 Sep-17 % total vs. Dec-16 vs. Sep-16
Amounts owed to credit institutions 1,675 3.3% 1,633 1,930 3.6% 18.1% 15.2%
Amounts owed to customers 40,653 81.0% 42,193 42,652 80.5% 1.1% 4.9%
Other liabilities 1,136 2.3% 1,382 1,206 2.3% -12.7% 6.2%
Shareholders equity 6,707 13.4% 6,674 7,168 13.5% 7.4% 6.9%
Total liabilities and shareholders equity 50,171 100.0% 51,881 52,955 100.0% 2.1% 5.6% AMOUNTS OWED TO CUSTOMERS
Customer deposits represented 96% of total Group liabilities (93% of the Bank liabilities) at September 30, 2017, demonstrating high financial autonomy level. The weight is almost unchanged as compared to year end and September 30, 2016.
AMOUNTS OWED TO THE CREDIT INSTITUTIONS
Amounts owed to credit institutions (which comprise interbank deposits, borrowings from International Financial Institutions and the Parent) stood at circa 2% of the total liabilities for the Bank and near 4% for the Group at the end of the analysed period.
BRD Group’s borrowings from Société Générale totalled near RON 1billion (2.3% of total liabilities) at September 30, 2017.
Page | 13
BRD | QUARTERLY REPORT
SHAREHOLDERS’ EQUITY
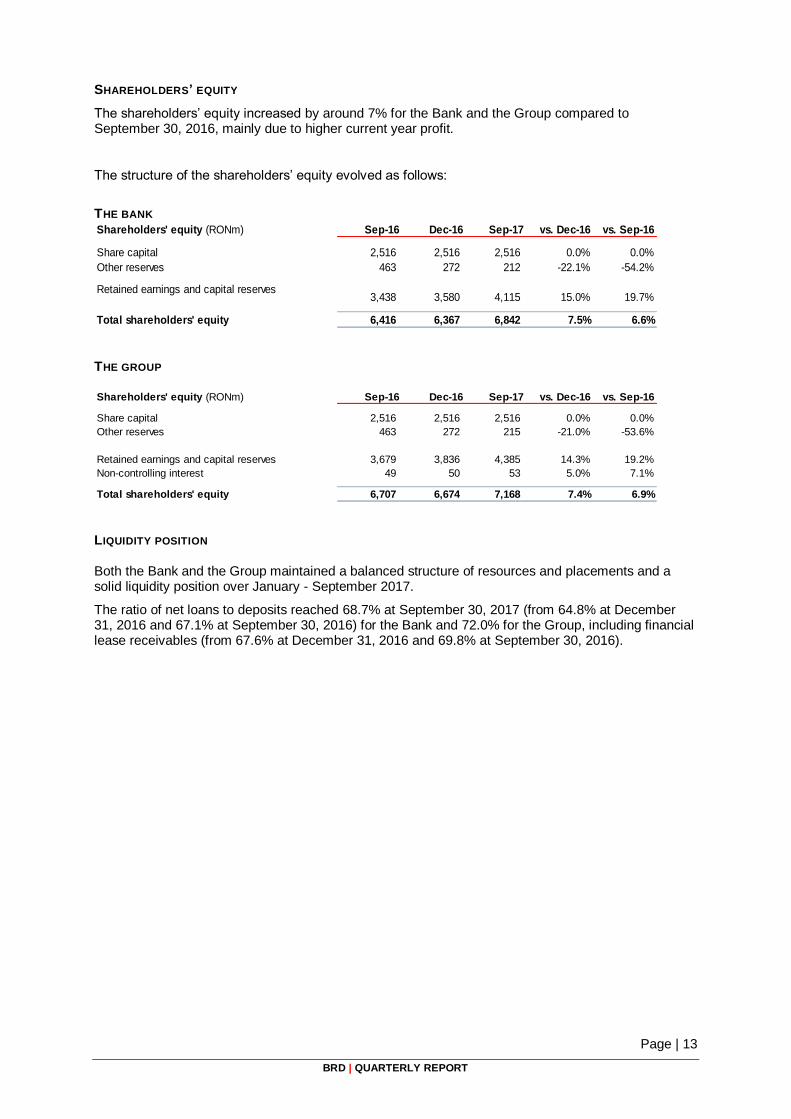
The shareholders’ equity increased by around 7% for the Bank and the Group compared to September 30, 2016, mainly due to higher current year profit.
The structure of the shareholders’ equity evolved as follows:
THE BANK Shareholders' equity (RONm) Sep-16 Dec-16 Sep-17 vs. Dec-16 vs. Sep-16
Share capital 2,516 2,516 2,516 0.0% 0.0%
Other reserves 463 272 212 -22.1% -54.2%
Retained earnings and capital reserves3,438 3,580 4,115 15.0% 19.7%
Total shareholders' equity 6,416 6,367 6,842 7.5% 6.6% THE GROUP Shareholders' equity (RONm) Sep-16 Dec-16 Sep-17 vs. Dec-16 vs. Sep-16
Share capital 2,516 2,516 2,516 0.0% 0.0%
Other reserves 463 272 215 -21.0% -53.6%
Retained earnings and capital reserves 3,679 3,836 4,385 14.3% 19.2%
Non-controlling interest 49 50 53 5.0% 7.1%
Total shareholders' equity 6,707 6,674 7,168 7.4% 6.9% LIQUIDITY POSITION Both the Bank and the Group maintained a balanced structure of resources and placements and a solid liquidity position over January - September 2017.
The ratio of net loans to deposits reached 68.7% at September 30, 2017 (from 64.8% at December 31, 2016 and 67.1% at September 30, 2016) for the Bank and 72.0% for the Group, including financial lease receivables (from 67.6% at December 31, 2016 and 69.8% at September 30, 2016).
Page | 14
BRD | QUARTERLY REPORT
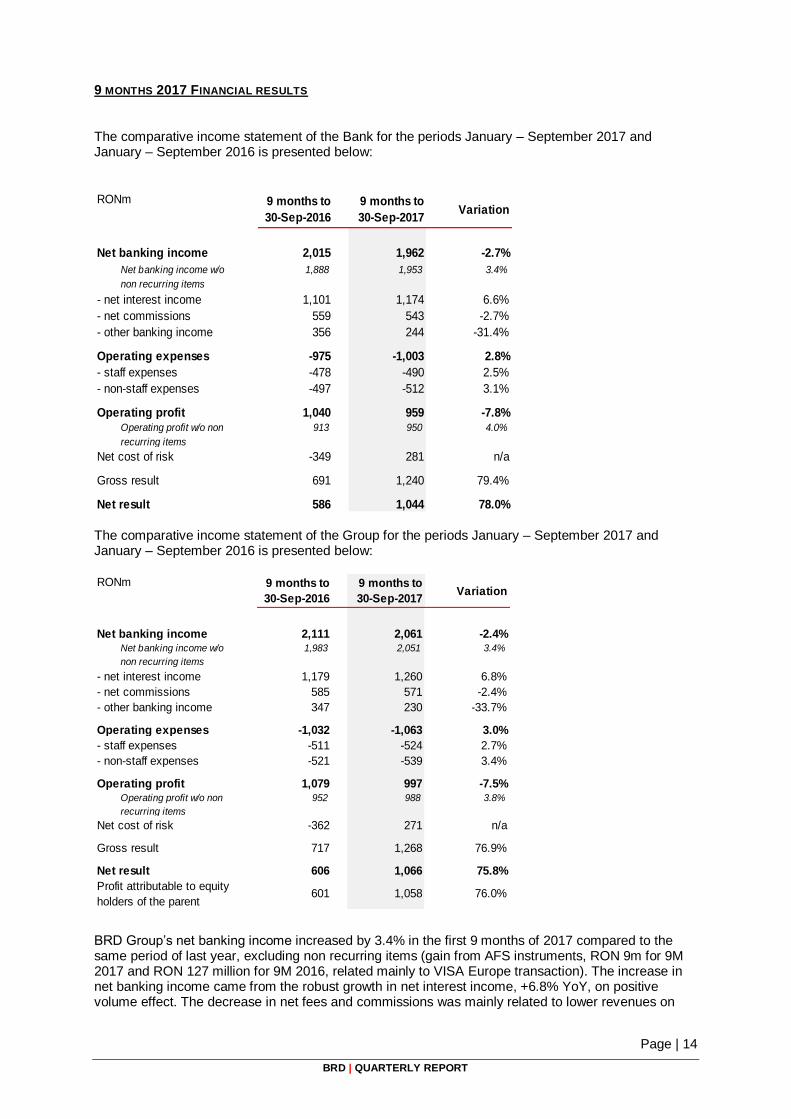
9 MONTHS 2017 FINANCIAL RESULTS
The comparative income statement of the Bank for the periods January – September 2017 and January – September 2016 is presented below:
RONm 9 months to
30-Sep-2016
9 months to
30-Sep-2017Variation
Net banking income 2,015 1,962 -2.7%
Net banking income w/o
non recurring items
1,888 1,953 3.4%
- net interest income 1,101 1,174 6.6%
- net commissions 559 543 -2.7%
- other banking income 356 244 -31.4%
Operating expenses -975 -1,003 2.8%
- staff expenses -478 -490 2.5%
- non-staff expenses -497 -512 3.1%
Operating profit 1,040 959 -7.8%Operating profit w/o non
recurring items
913 950 4.0%
Net cost of risk -349 281 n/a
Gross result 691 1,240 79.4%
Net result 586 1,044 78.0% The comparative income statement of the Group for the periods January – September 2017 and January – September 2016 is presented below: RONm 9 months to
30-Sep-2016
9 months to
30-Sep-2017Variation
Net banking income 2,111 2,061 -2.4%Net banking income w/o
non recurring items
1,983 2,051 3.4%
- net interest income 1,179 1,260 6.8%
- net commissions 585 571 -2.4%
- other banking income 347 230 -33.7%
Operating expenses -1,032 -1,063 3.0%
- staff expenses -511 -524 2.7%
- non-staff expenses -521 -539 3.4%
Operating profit 1,079 997 -7.5%Operating profit w/o non
recurring items
952 988 3.8%
Net cost of risk -362 271 n/a
Gross result 717 1,268 76.9%
Net result 606 1,066 75.8%
Profit attributable to equity
holders of the parent 601 1,058 76.0%
BRD Group’s net banking income increased by 3.4% in the first 9 months of 2017 compared to the same period of last year, excluding non recurring items (gain from AFS instruments, RON 9m for 9M 2017 and RON 127 million for 9M 2016, related mainly to VISA Europe transaction). The increase in net banking income came from the robust growth in net interest income, +6.8% YoY, on positive volume effect. The decrease in net fees and commissions was mainly related to lower revenues on
Page | 15
BRD | QUARTERLY REPORT
transactional banking, due to increased competitive pressures and continuous structure changes in channel mix.
Operational expenses increased by 3% on a yearly basis. Staff expenses were influenced by the revalorisation of the compensation package, in line with the market practice. Non staff expenses increase stemmed mostly from change-the-bank initiatives (consulting services linked to transformation projects and higher depreciation charge driven by increased IT related investments).
Gross operating income increased by 3.8% YoY, when excluding non-recurring items (gain from AFS instruments, RON 9m for 9M 2017 and RON 127 million for 9M 2016, related mainly to VISA Europe).
Core Group cost/income ratio reached 51.8% for 9M 2017 compared to 52.0% for 9M 2016.
For the first 9 months of 2017, the Group registered a positive net cost of risk of RON 271m (vs. a negative cost of risk of RON 362 for 9M 2016) due to the recognition of insurance indemnities, recoveries on non-retail defaulted portfolios and gain on sale of non-performing loans.
The quality of assets further improved as shown by the continued reduction in non performing loans (as defined by EBA methodology). NPL ratio decreased to 7.8% as of September 30, 2017 vs 10.8% as of September 30, 2016, mainly as a result of non-performing loans portfolios sale activities and some further write offs. The level of coverage ratio increased to 75.0% at September 30, 2017 (vs. 74.8% at September 30, 2016).
BRD Group’s net profit registered a strong growth, for the first 9 months of 2017, up by +75.8% YoY, to RON 1,066 billion (vs RON 606 million in the same period of the last year). This performance resulted both from a dynamic commercial activity leading to an acceleration of net banking income growth, and non recurring positive cost of risk items. The Bank recorded similar trends, with net profit reaching RON 1,044 billion (vs RON 586 million), up by +78% YoY.
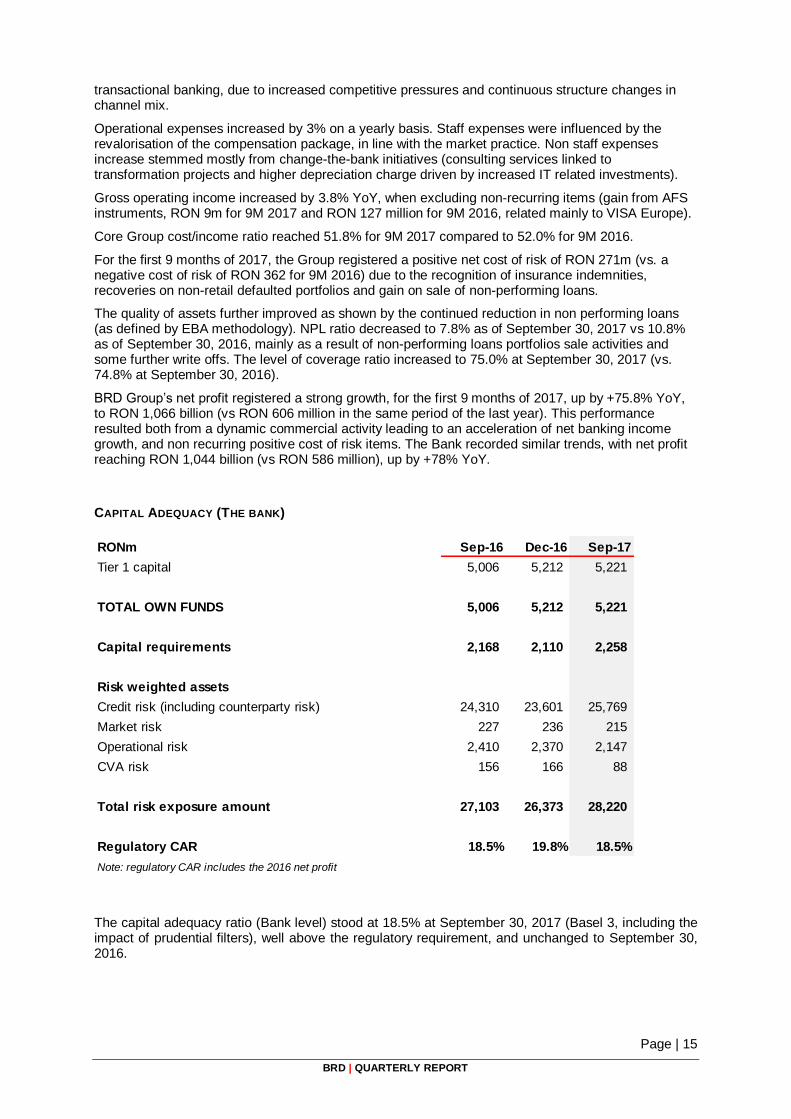
CAPITAL ADEQUACY (THE BANK)
RONm Sep-16 Dec-16 Sep-17
Tier 1 capital 5,006 5,212 5,221
TOTAL OWN FUNDS 5,006 5,212 5,221
Capital requirements 2,168 2,110 2,258
Risk weighted assets
Credit risk (including counterparty risk) 24,310 23,601 25,769
Market risk 227 236 215
Operational risk 2,410 2,370 2,147
CVA risk 156 166 88
Total risk exposure amount 27,103 26,373 28,220
Regulatory CAR 18.5% 19.8% 18.5%
Note: regulatory CAR includes the 2016 net profit
The capital adequacy ratio (Bank level) stood at 18.5% at September 30, 2017 (Basel 3, including the impact of prudential filters), well above the regulatory requirement, and unchanged to September 30, 2016.