Embed Size (px)
Citation preview

Brazilian Banking Conference 2019 27 de Junho de 2019 São Paulo

Visão Geral Sobre o Rating Soberano Rafael Guedes, Diretor-executivo, Fitch Ratings
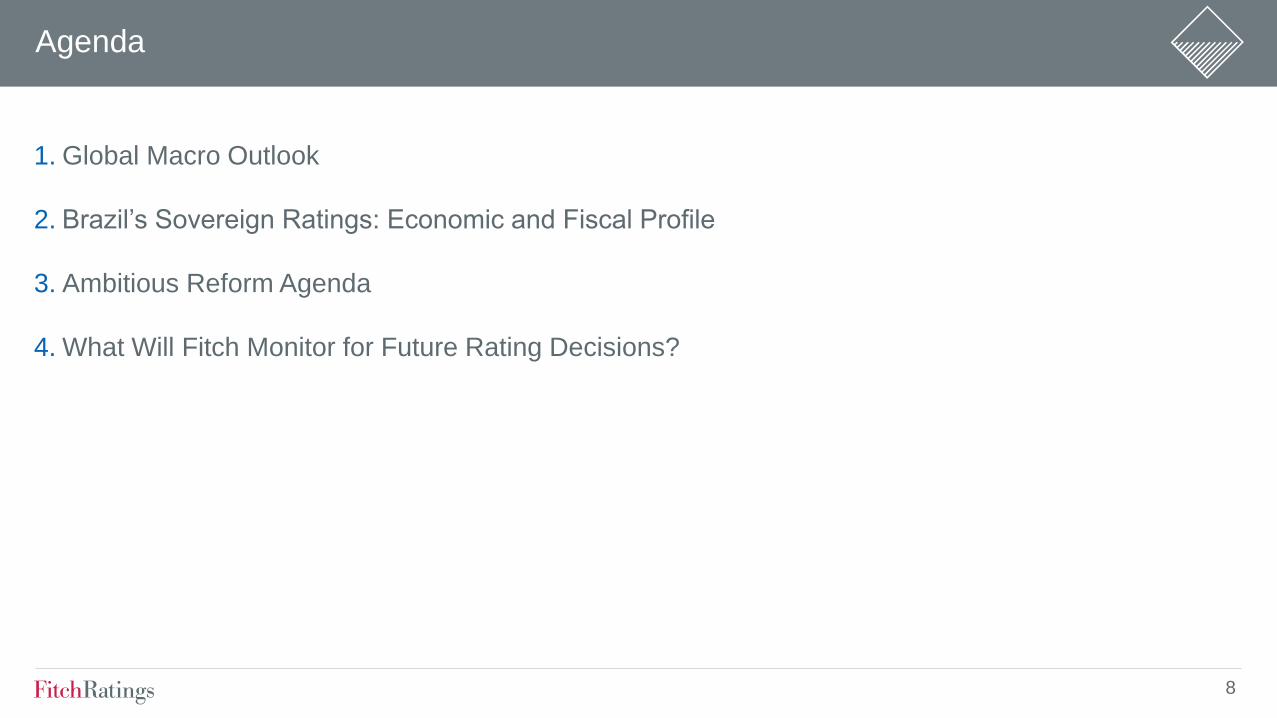
Agenda
1. Global Macro Outlook
2. Brazil’s Sovereign Ratings: Economic and Fiscal Profile
3. Ambitious Reform Agenda
4. What Will Fitch Monitor for Future Rating Decisions?
8
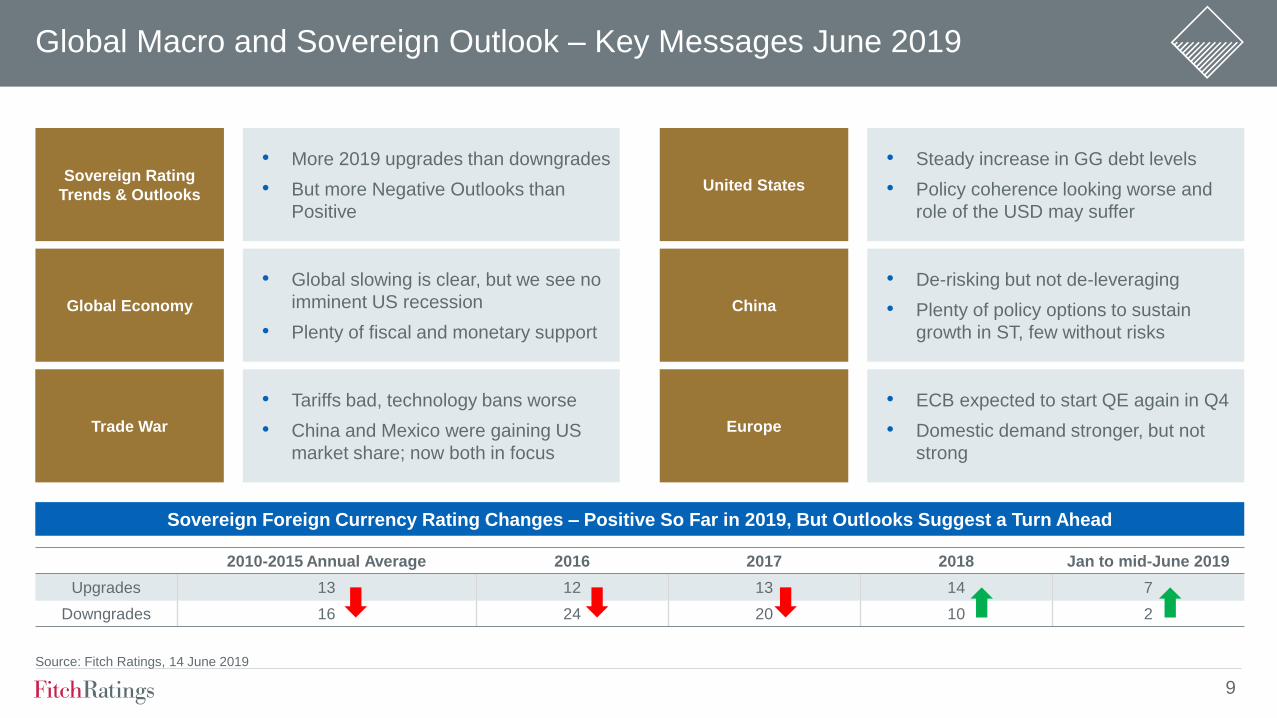
Global Macro and Sovereign Outlook – Key Messages June 2019
Sovereign Rating
Trends & Outlooks
Global Economy
Trade War
United States
China
Europe
• More 2019 upgrades than downgrades
• But more Negative Outlooks than
Positive
2010-2015 Annual Average 2016 2017 2018 Jan to mid-June 2019
Upgrades 13 12 13 14 7
Downgrades 16 24 20 10 2
Sovereign Foreign Currency Rating Changes – Positive So Far in 2019, But Outlooks Suggest a Turn Ahead
• ECB expected to start QE again in Q4
• Domestic demand stronger, but not
strong
• Tariffs bad, technology bans worse
• China and Mexico were gaining US
market share; now both in focus
• Global slowing is clear, but we see no
imminent US recession
• Plenty of fiscal and monetary support
• De-risking but not de-leveraging
• Plenty of policy options to sustain
growth in ST, few without risks
• Steady increase in GG debt levels
• Policy coherence looking worse and
role of the USD may suffer
Source: Fitch Ratings, 14 June 2019
9
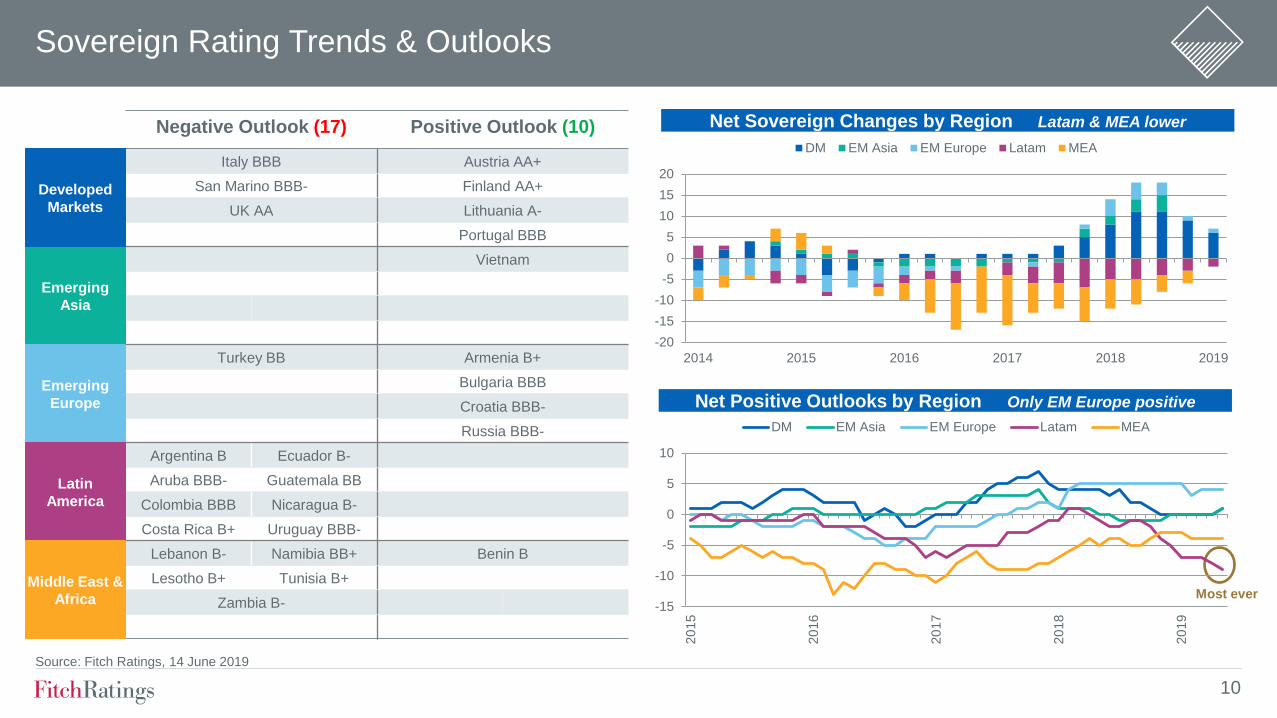
Sovereign Rating Trends & Outlooks
Negative Outlook (17) Positive Outlook (10)
Italy BBB Austria AA+
San Marino BBB- Finland AA+
UK AA Lithuania A-
Portugal BBB
Vietnam
Turkey BB Armenia B+
Bulgaria BBB
Croatia BBB-
Russia BBB-
Argentina B Ecuador B-
Aruba BBB- Guatemala BB
Colombia BBB Nicaragua B-
Costa Rica B+ Uruguay BBB-
Lebanon B- Namibia BB+ Benin B
Lesotho B+ Tunisia B+
Zambia B-
Emerging
Asia
Developed
Markets
Emerging
Europe
Latin
America
Middle East &
Africa
Source: Fitch Ratings, 14 June 2019
Net Positive Outlooks by Region Only EM Europe positive
Most ever
6.5 15.8
17.14
3.42
6.5 15.8
17.14
10.82
-15
-10
-5
0
5
10
20
15
20
16
20
17
20
18
20
19
DM EM Asia EM Europe Latam MEA
-20
-15
-10
-5
0
5
10
15
20
2014 2015 2016 2017 2018 2019
DM EM Asia EM Europe Latam MEA
Net Sovereign Changes by Region Latam & MEA lower
10
Sovereign Rating Trends & Outlooks
6.5 15.8
17.14
3.42 2017 2018 2019f 2020f
GDP Growth (%)
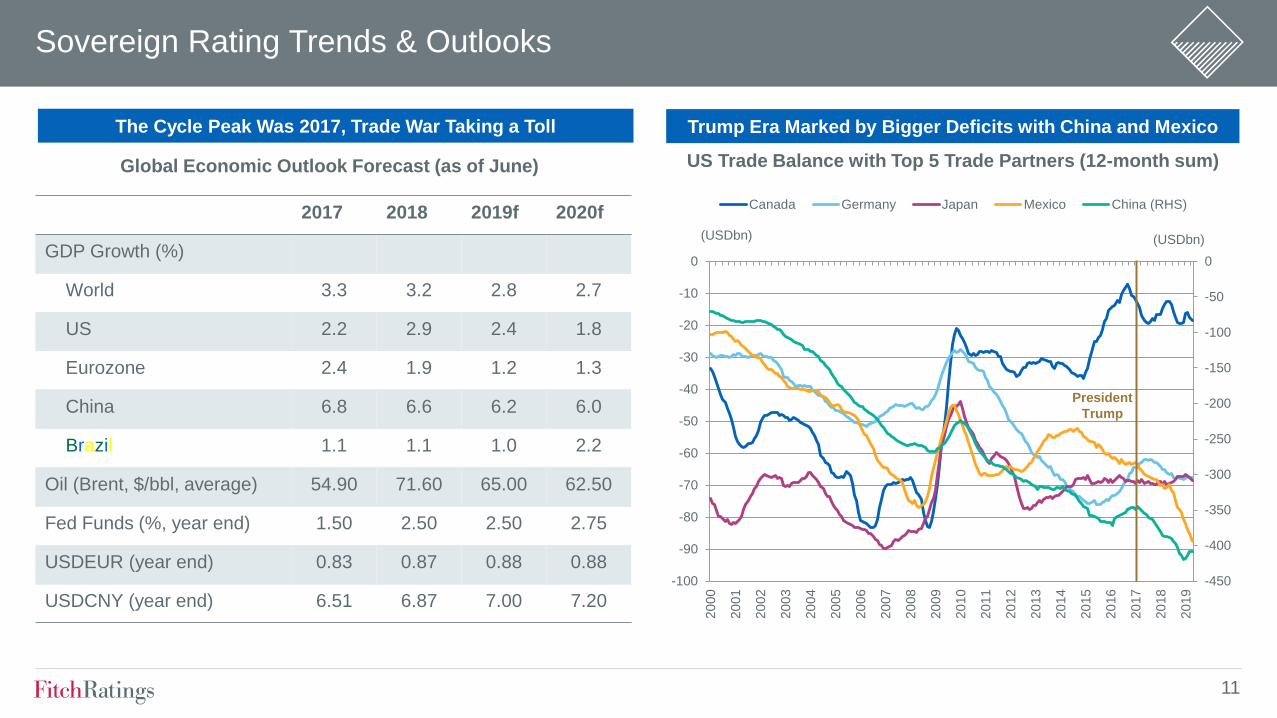
World 3.3 3.2 2.8 2.7
US 2.2 2.9 2.4 1.8
Eurozone 2.4 1.9 1.2 1.3
China 6.8 6.6 6.2 6.0
Brazil 1.1 1.1 1.0 2.2
Oil (Brent, $/bbl, average) 54.90 71.60 65.00 62.50
Fed Funds (%, year end) 1.50 2.50 2.50 2.75
USDEUR (year end) 0.83 0.87 0.88 0.88
USDCNY (year end) 6.51 6.87 7.00 7.20
Global Economic Outlook Forecast (as of June)
The Cycle Peak Was 2017, Trade War Taking a Toll
-450
-400
-350
-300
-250
-200
-150
-100
-50
0
-100
-90
-80
-70
-60
-50
-40
-30
-20
-10
0
20
00
20
01
20
02
20
03
20
04
20
05
20
06
20
07
20
08
20
09
20
10
20
11
20
12
20
13
20
14
20
15
20
16
20
17
20
18
20
19
(USDbn) (USDbn)
Canada Germany Japan Mexico China (RHS)
Trump Era Marked by Bigger Deficits with China and Mexico
US Trade Balance with Top 5 Trade Partners (12-month sum)
President
Trump
11
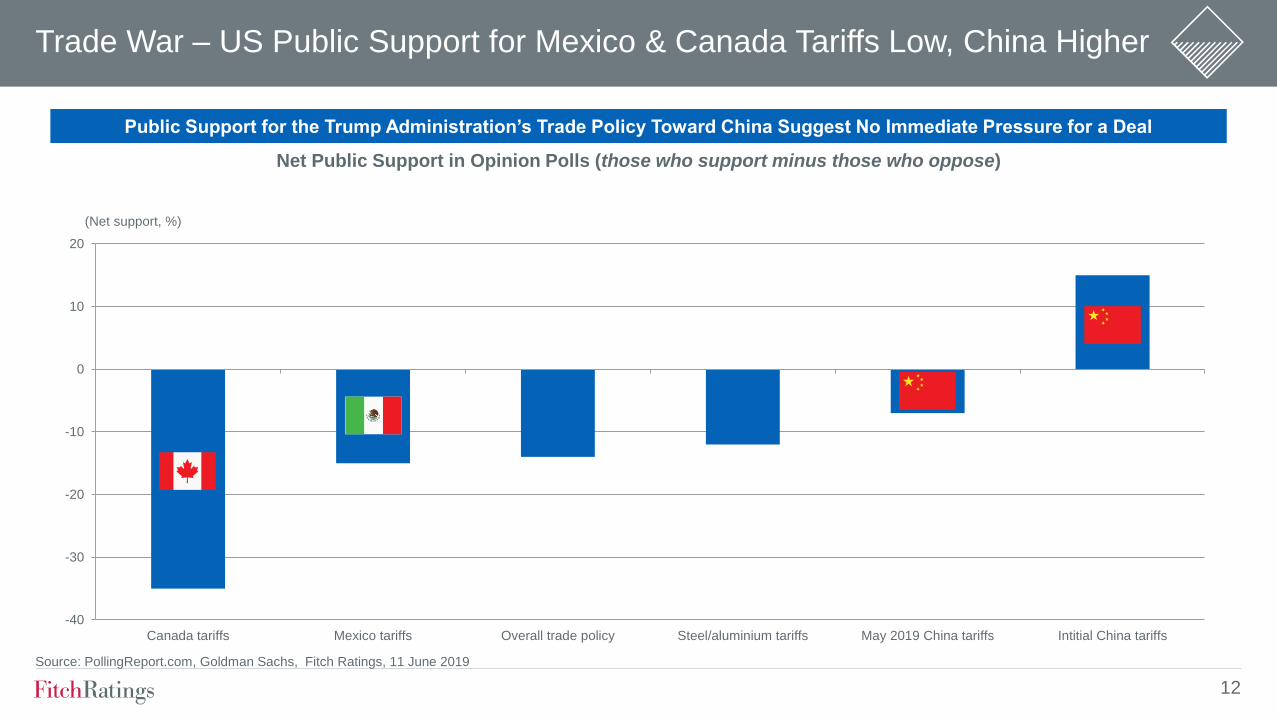
Trade War – US Public Support for Mexico & Canada Tariffs Low, China Higher
-40
-30
-20
-10
0
10
20
Canada tariffs Mexico tariffs Overall trade policy Steel/aluminium tariffs May 2019 China tariffs Intitial China tariffs
(Net support, %)
Public Support for the Trump Administration’s Trade Policy Toward China Suggest No Immediate Pressure for a Deal
Net Public Support in Opinion Polls (those who support minus those who oppose)
Source: PollingReport.com, Goldman Sachs, Fitch Ratings, 11 June 2019
12
Brazil was downgraded to ‘BB-’ from ‘BB’ in 2018, with Stable Outlook.
Brazil’s growth is still being challenged with Fitch forecasting growth of only 1% in 2019. Market sentiment
turned positive and confidence indicators improved after the elections. But this has not resulted in improvement
in economic activity so far. Growth performance is weak following the nation’s worst recession and fiscal
challenges persist and potential growth has been revised down.
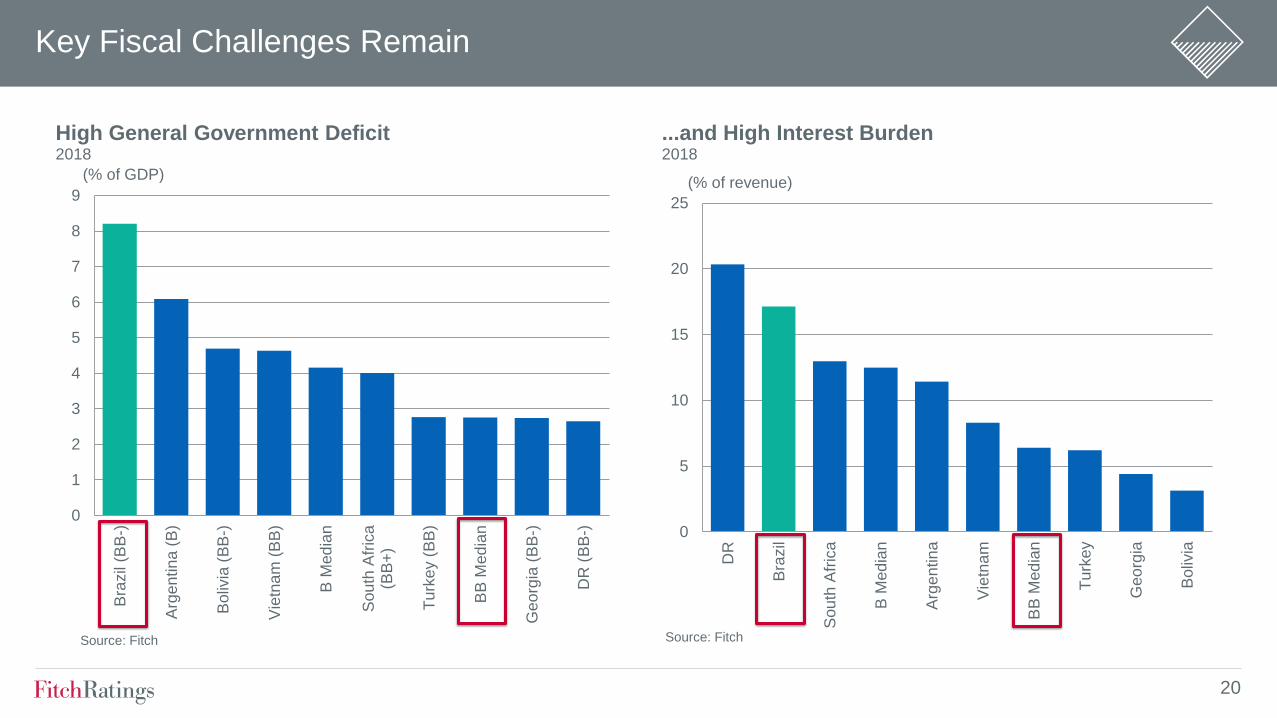
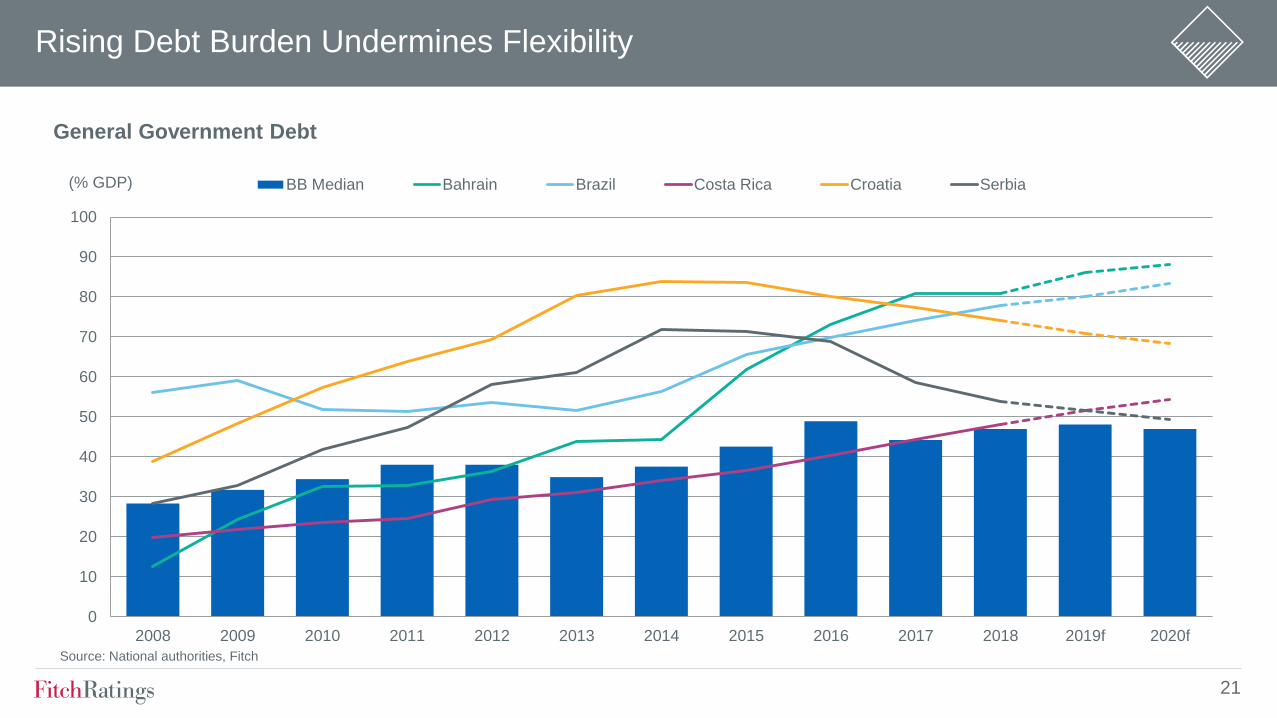
The general government deficit – at 8.2% in 2018 – is well above peers and has led to a rapidly rising debt
burden, forecast at around 80% in 2019 up from 51% in 2013.
The new government’s reform agenda, if implemented well, could be positive for growth (by addressing
structural challenges) and reducing fiscal pressures.
Progress on the implementation of the economic agenda is key, beginning with pension reform this year.
Furthermore, Brazil maintains a strong external position relative to other EM peers
Key Messages
13
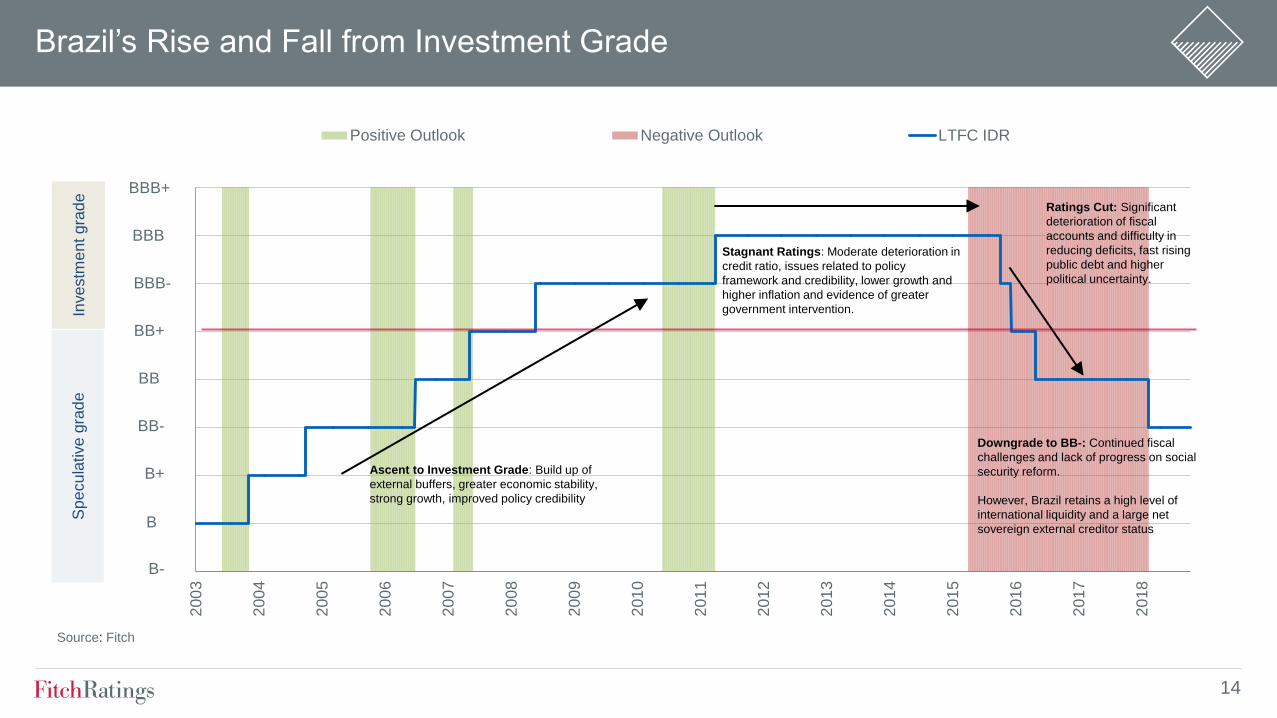
Brazil’s Rise and Fall from Investment Grade
200
3
200
4
200
5
200
6
200
7
200
8
200
9
201
0
201
1
201
2
201
3
201
4
201
5
201
6
201
7
201
8
Positive Outlook Negative Outlook LTFC IDR
Source: Fitch
BB-
B+
B
B-
BBB+
BBB
BBB-
BB+
BB
Inve
stm
en
t gra
de
S
pe
cu
lative
gra
de
Ascent to Investment Grade: Build up of
external buffers, greater economic stability,
strong growth, improved policy credibility
Stagnant Ratings: Moderate deterioration in
credit ratio, issues related to policy
framework and credibility, lower growth and
higher inflation and evidence of greater
government intervention.
Downgrade to BB-: Continued fiscal
challenges and lack of progress on social
security reform.
However, Brazil retains a high level of
international liquidity and a large net
sovereign external creditor status
Ratings Cut: Significant
deterioration of fiscal
accounts and difficulty in
reducing deficits, fast rising
public debt and higher
political uncertainty.
14
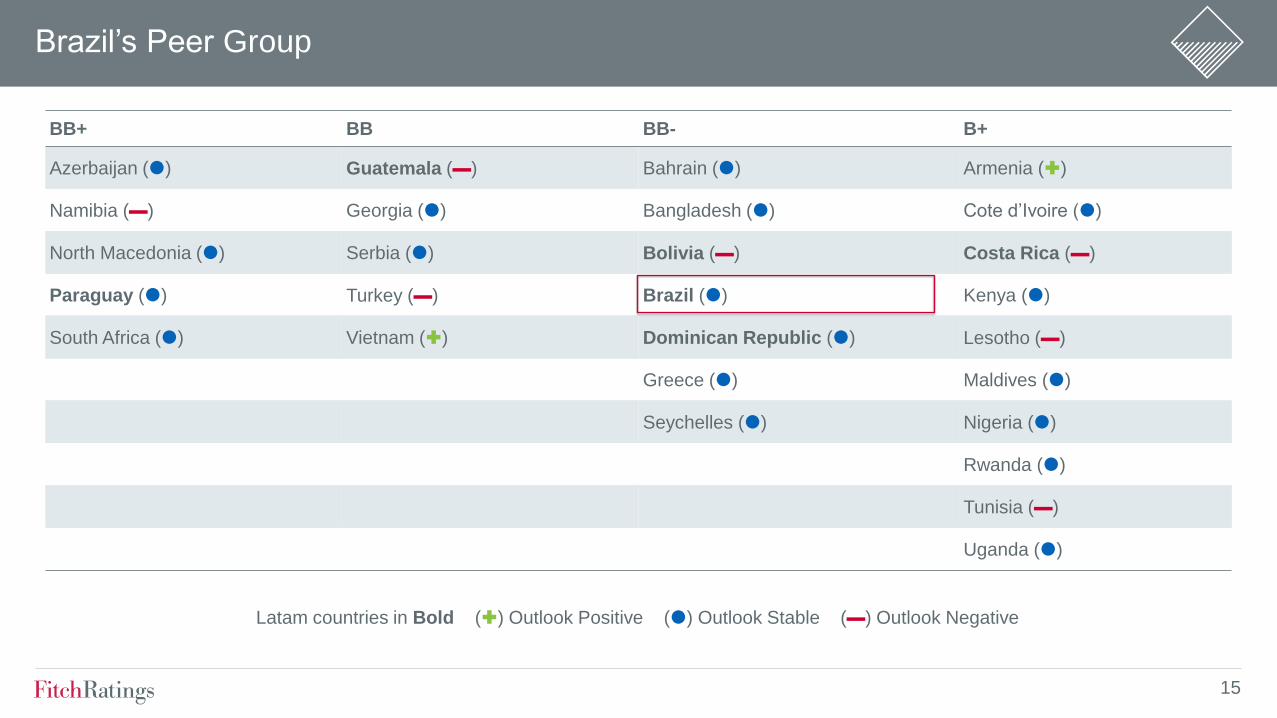
BB+ BB BB- B+
Azerbaijan () Guatemala (▬) Bahrain () Armenia ()
Namibia (▬) Georgia () Bangladesh () Cote d’Ivoire ()
North Macedonia () Serbia () Bolivia (▬) Costa Rica (▬)
Paraguay () Turkey (▬) Brazil () Kenya ()
South Africa () Vietnam () Dominican Republic () Lesotho (▬)
Greece () Maldives ()
Seychelles () Nigeria ()
Rwanda ()
Tunisia (▬)
Uganda ()
Latam countries in Bold () Outlook Positive () Outlook Stable (▬) Outlook Negative
Brazil’s Peer Group
15
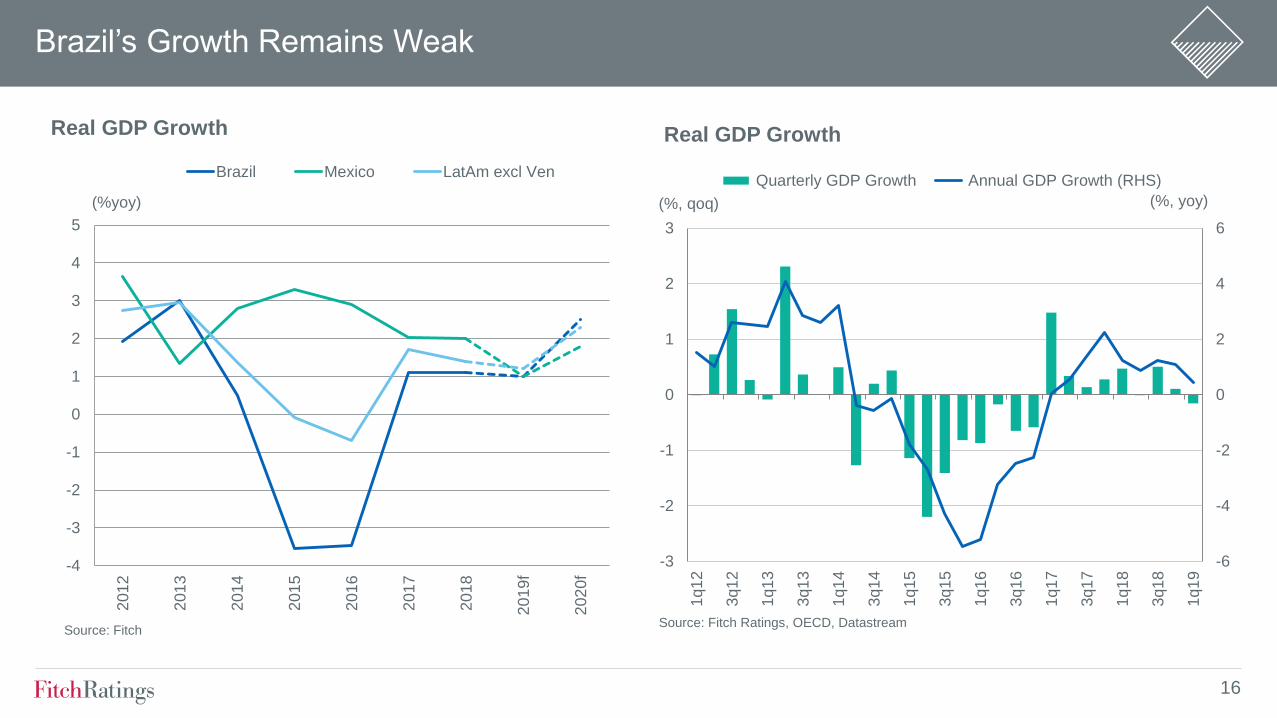
Brazil’s Growth Remains Weak
-4
-3
-2
-1
0
1
2
3
4
5
201
2
201
3
201
4
201
5
201
6
201
7
201
8
201
9f
202
0f
Real GDP Growth
Brazil Mexico LatAm excl Ven
(%yoy)
Source: Fitch
-6
-4
-2
0
2
4
6
-3
-2
-1
0
1
2
3
1q1
2
3q1
2
1q1
3
3q1
3
1q1
4
3q1
4
1q1
5
3q1
5
1q1
6
3q1
6
1q1
7
3q1
7
1q1
8
3q1
8
1q1
9
(%, yoy) (%, qoq)
Real GDP Growth
Quarterly GDP Growth Annual GDP Growth (RHS)
Source: Fitch Ratings, OECD, Datastream
16
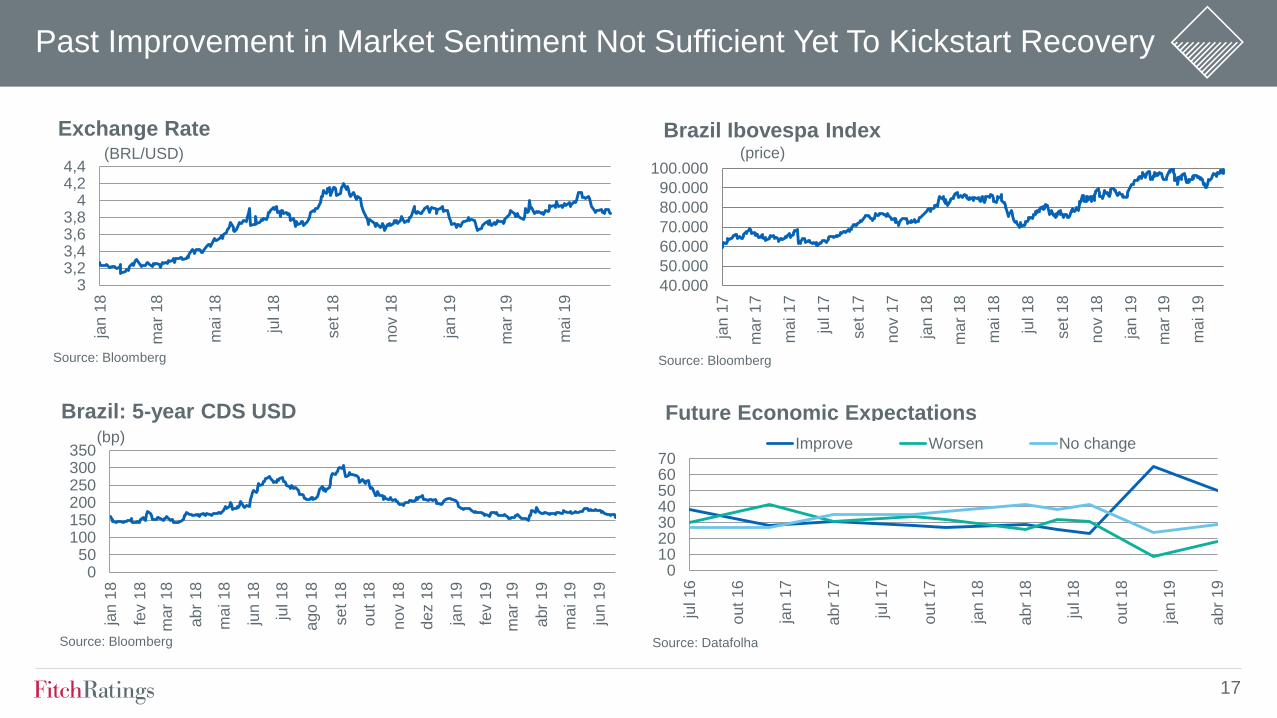
Past Improvement in Market Sentiment Not Sufficient Yet To Kickstart Recovery
050
100150200250300350
jan 1
8
fev 1
8
ma
r 18
abr
18
ma
i 1
8
jun 1
8
jul 18
ago
18
se
t 1
8
out
18
nov 1
8
dez 1
8
jan 1
9
fev 1
9
ma
r 19
abr
19
ma
i 1
9
jun 1
9
Brazil: 5-year CDS USD (bp)
Source: Bloomberg
010203040506070
jul 16
out
16
jan 1
7
abr
17
jul 17
out
17
jan 1
8
abr
18
jul 18
out
18
jan 1
9
abr
19
Improve Worsen No change
Future Economic Expectations
Source: Datafolha
33,23,43,63,8
44,24,4
jan 1
8
ma
r 18
ma
i 1
8
jul 18
se
t 1
8
nov 1
8
jan 1
9
ma
r 19
ma
i 1
9
Exchange Rate (BRL/USD)
Source: Bloomberg
40.000
50.000
60.000
70.000
80.000
90.000
100.000
jan 1
7
ma
r 17
ma
i 1
7
jul 17
se
t 1
7
nov 1
7
jan 1
8
ma
r 18
ma
i 1
8
jul 18
se
t 1
8
nov 1
8
jan 1
9
ma
r 19
ma
i 1
9
Brazil Ibovespa Index (price)
Source: Bloomberg
17
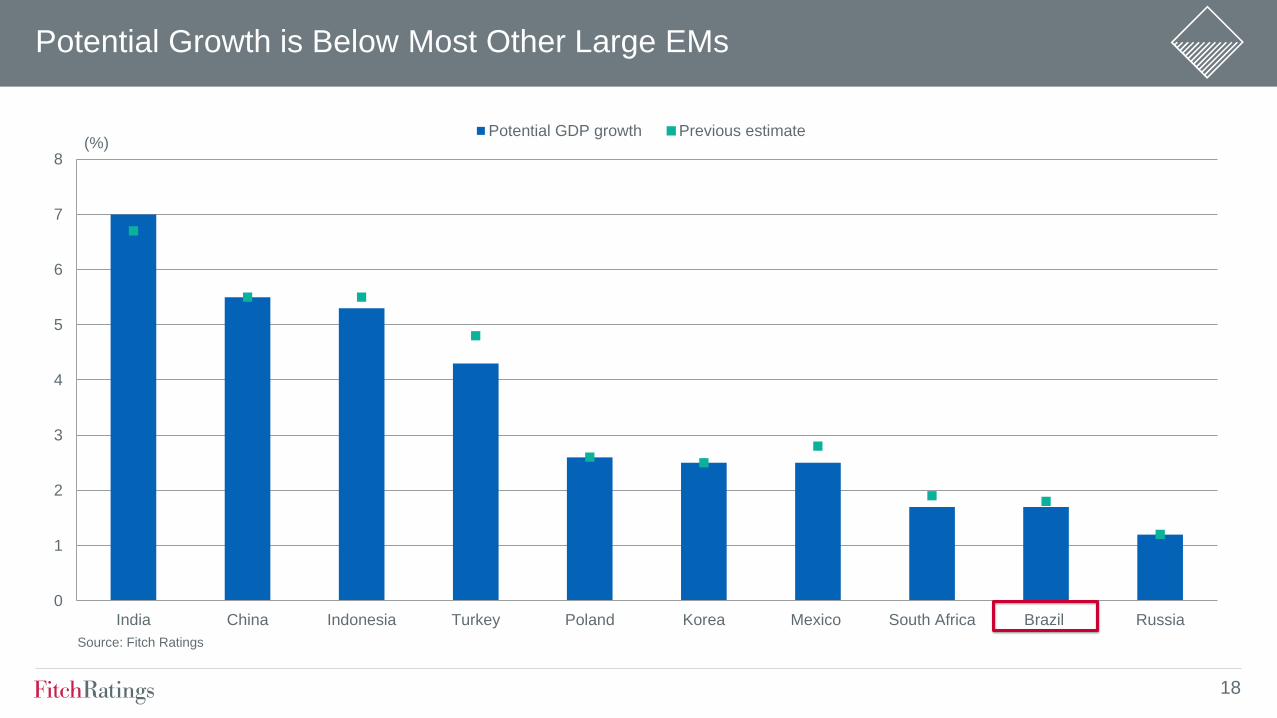
Potential Growth is Below Most Other Large EMs
0
1
2
3
4
5
6
7
8
India China Indonesia Turkey Poland Korea Mexico South Africa Brazil Russia
Potential GDP growth Previous estimate
Source: Fitch Ratings
(%)
18
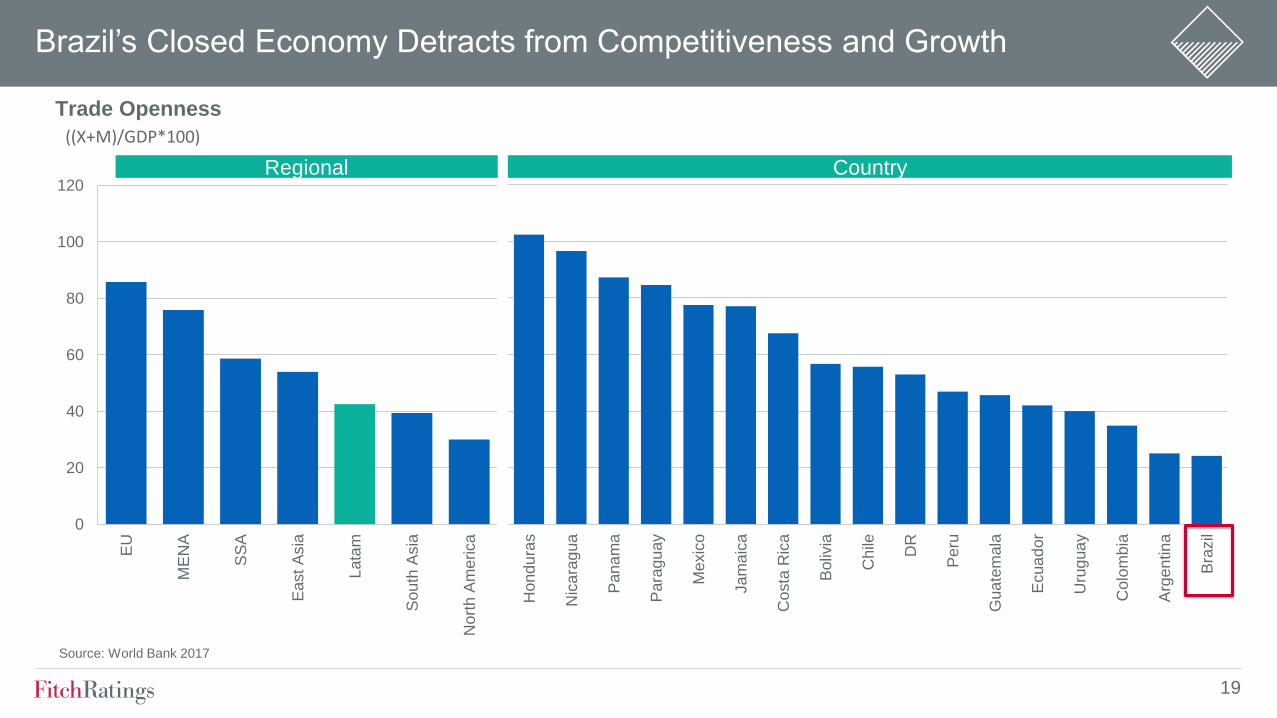
Brazil’s Closed Economy Detracts from Competitiveness and Growth
0
20
40
60
80
100
120
EU
ME
NA
SS
A
East
Asia
Lata
m
Sou
th A
sia
Nort
h A
me
rica
Source: World Bank 2017
Trade Openness
((X+M)/GDP*100)
Hond
ura
s
Nic
ara
gua
Pan
am
a
Para
gu
ay
Me
xic
o
Ja
ma
ica
Costa
Ric
a
Boliv
ia
Chile DR
Peru
Gua
tem
ala
Ecua
dor
Uru
gua
y
Colo
mb
ia
Arg
en
tin
a
Bra
zil
Regional Country
19
0
5
10
15
20
25
DR
Bra
zil
Sou
th A
fric
a
B M
ed
ian
Arg
en
tin
a
Vie
tna
m
BB
Med
ian
Turk
ey
Geo
rgia
Boliv
ia
...and High Interest Burden 2018
(% of revenue)
Source: Fitch
Key Fiscal Challenges Remain
0
1
2
3
4
5
6
7
8
9
Bra
zil
(BB
-)
Arg
en
tin
a (
B)
Boliv
ia (
BB
-)
Vie
tna
m (
BB
)
B M
ed
ian
Sou
th A
fric
a(B
B+
)
Turk
ey (
BB
)
BB
Med
ian
Geo
rgia
(B
B-)
DR
(B
B-)
High General Government Deficit 2018
(% of GDP)
Source: Fitch
20
0
10
20
30
40
50
60
70
80
90
100
2008 2009 2010 2011 2012 2013 2014 2015 2016 2017 2018 2019f 2020f
General Government Debt
BB Median Bahrain Brazil Costa Rica Croatia Serbia
Rising Debt Burden Undermines Flexibility
(% GDP)
Source: National authorities, Fitch
21
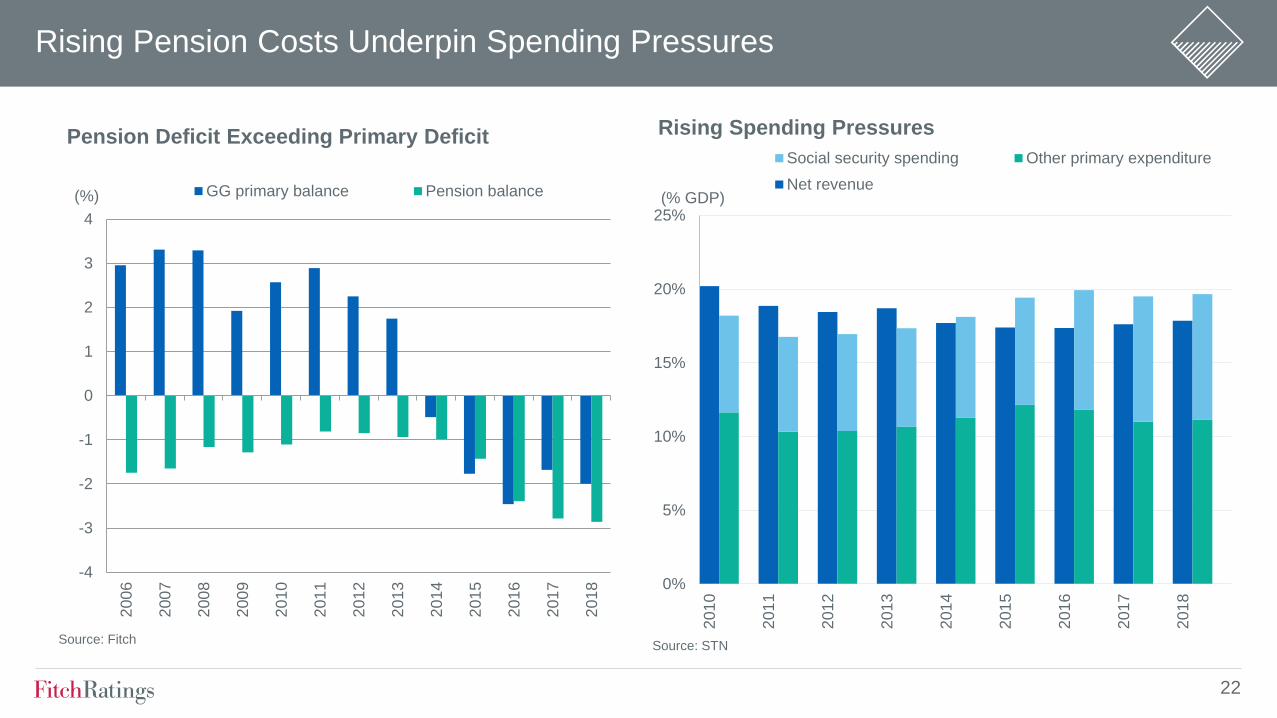
Rising Pension Costs Underpin Spending Pressures
-4
-3
-2
-1
0
1
2
3
4
200
6
200
7
200
8
200
9
201
0
201
1
201
2
201
3
201
4
201
5
201
6
201
7
201
8
GG primary balance Pension balance
Source: Fitch
(%)
Pension Deficit Exceeding Primary Deficit
0%
5%
10%
15%
20%
25%
201
0
201
1
201
2
201
3
201
4
201
5
201
6
201
7
201
8
Social security spending Other primary expenditure
Net revenue
Source: STN
Rising Spending Pressures
(% GDP)
22
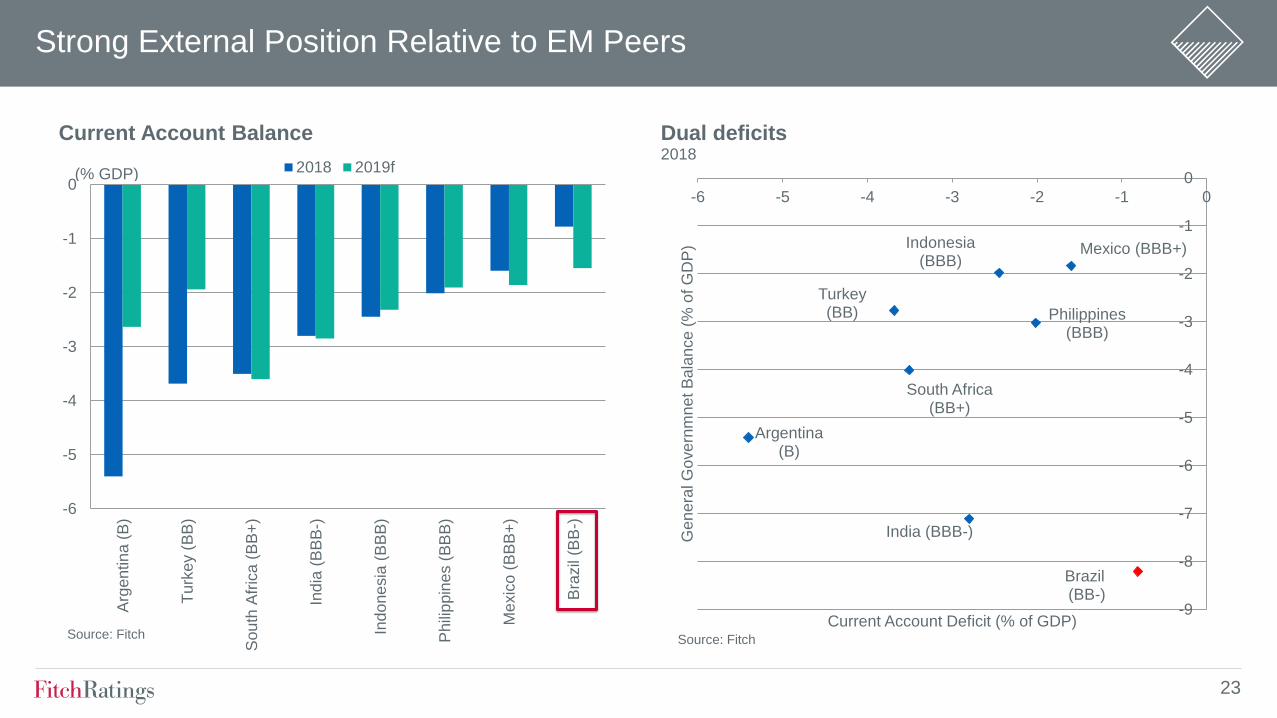
-6
-5
-4
-3
-2
-1
0
Arg
en
tin
a (
B)
Turk
ey (
BB
)
Sou
th A
fric
a (
BB
+)
Ind
ia (
BB
B-)
Ind
one
sia
(B
BB
)
Phili
ppin
es (
BB
B)
Me
xic
o (
BB
B+
)
Bra
zil
(BB
-)
Current Account Balance
2018 2019f(% GDP)
Source: Fitch
Strong External Position Relative to EM Peers
Argentina (B)
Turkey (BB)
South Africa (BB+)
India (BBB-)
Indonesia (BBB)
Philippines (BBB)
Mexico (BBB+)
Brazil (BB-)
-9
-8
-7
-6
-5
-4
-3
-2
-1
0
-6 -5 -4 -3 -2 -1 0
Ge
ne
ral G
ove
rnm
ne
t B
ala
nce
(%
of G
DP
)
Current Account Deficit (% of GDP)
Dual deficits 2018
Source: Fitch
23
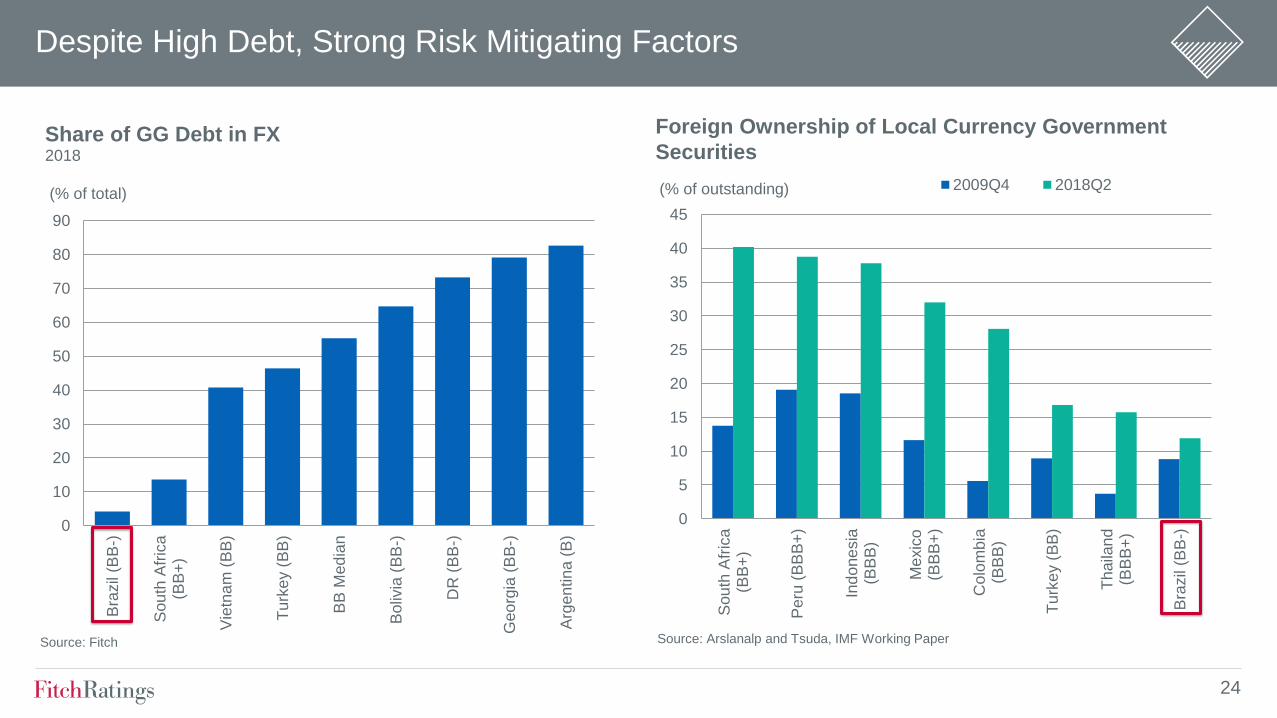
Despite High Debt, Strong Risk Mitigating Factors
0
10
20
30
40
50
60
70
80
90
Bra
zil
(BB
-)
Sou
th A
fric
a(B
B+
)
Vie
tna
m (
BB
)
Turk
ey (
BB
)
BB
Med
ian
Boliv
ia (
BB
-)
DR
(B
B-)
Geo
rgia
(B
B-)
Arg
en
tin
a (
B)
Share of GG Debt in FX 2018
(% of total)
Source: Fitch
0
5
10
15
20
25
30
35
40
45
Sou
th A
fric
a(B
B+
)
Peru
(B
BB
+)
Ind
one
sia
(BB
B)
Me
xic
o(B
BB
+)
Colo
mb
ia(B
BB
)
Turk
ey (
BB
)
Thaila
nd
(BB
B+
)
Bra
zil
(BB
-)
2009Q4 2018Q2
Foreign Ownership of Local Currency Government
Securities
(% of outstanding)
Source: Arslanalp and Tsuda, IMF Working Paper
24
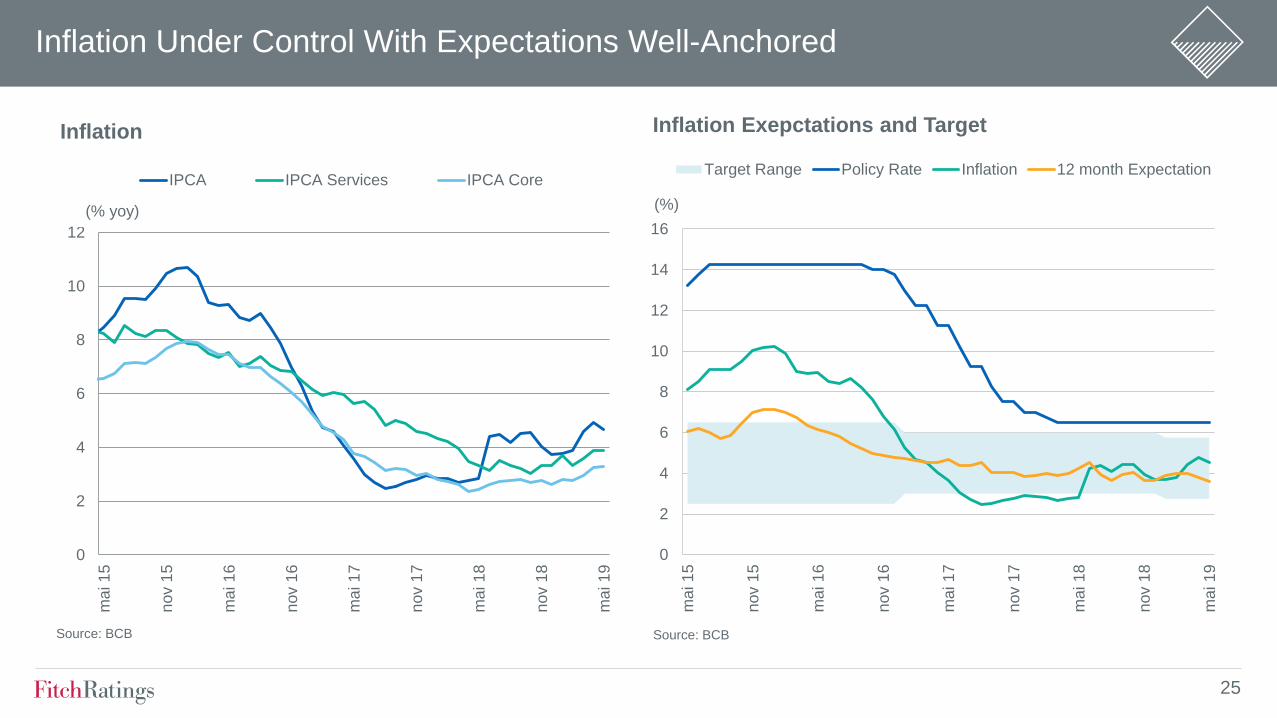
Inflation Under Control With Expectations Well-Anchored
0
2
4
6
8
10
12
14
16
ma
i 1
5
nov 1
5
ma
i 1
6
nov 1
6
ma
i 1
7
nov 1
7
ma
i 1
8
nov 1
8
ma
i 1
9
(%)
Inflation Exepctations and Target
Target Range Policy Rate Inflation 12 month Expectation
Source: BCB
0
2
4
6
8
10
12
ma
i 1
5
nov 1
5
ma
i 1
6
nov 1
6
ma
i 1
7
nov 1
7
ma
i 1
8
nov 1
8
ma
i 1
9
IPCA IPCA Services IPCA Core
Inflation
(% yoy)
Source: BCB
25
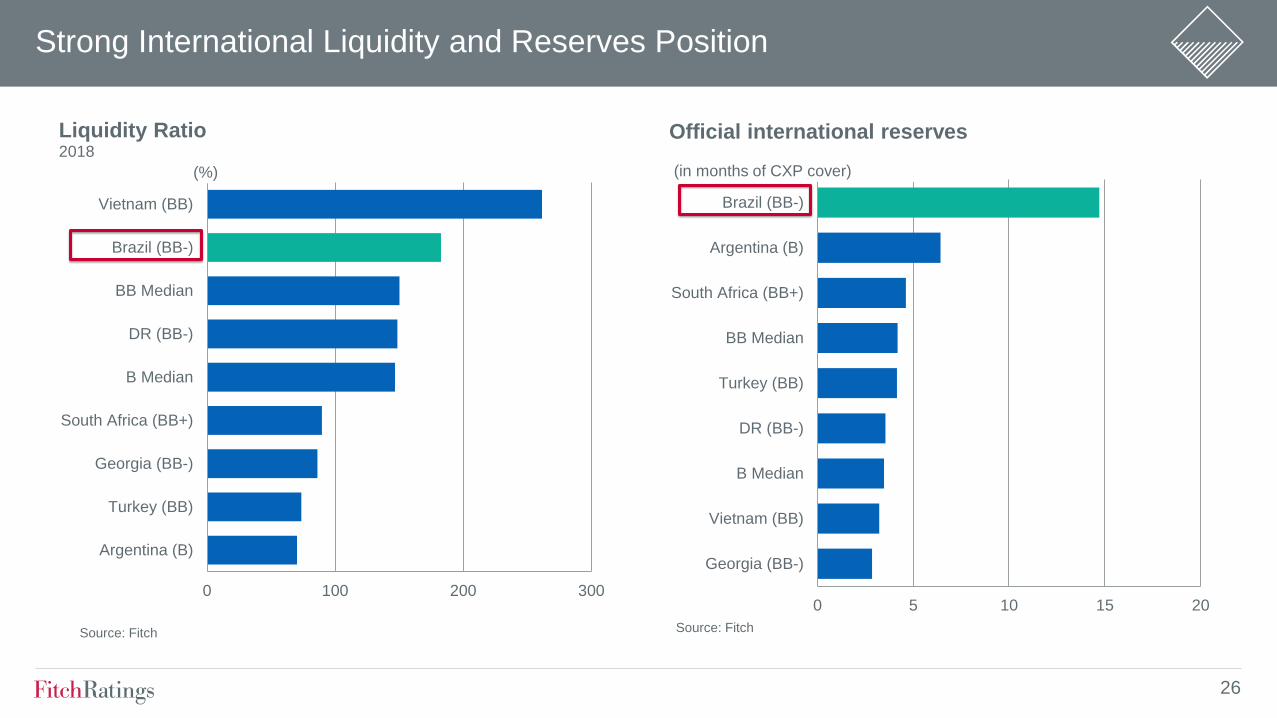
0 5 10 15 20
Georgia (BB-)
Vietnam (BB)
B Median
DR (BB-)
Turkey (BB)
BB Median
South Africa (BB+)
Argentina (B)
Brazil (BB-)
Official international reserves
Source: Fitch
0 100 200 300
Argentina (B)
Turkey (BB)
Georgia (BB-)
South Africa (BB+)
B Median
DR (BB-)
BB Median
Brazil (BB-)
Vietnam (BB)
Liquidity Ratio 2018
Source: Fitch
Strong International Liquidity and Reserves Position
(in months of CXP cover) (%)
26
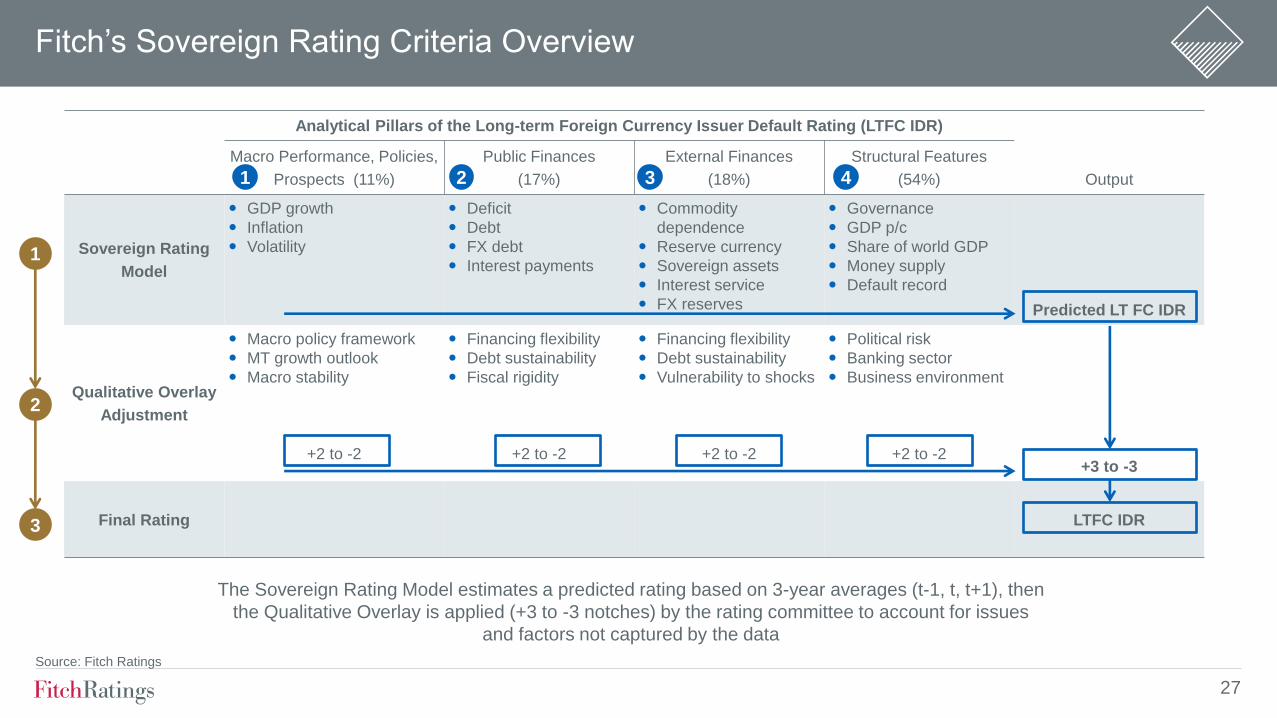
Fitch’s Sovereign Rating Criteria Overview
Analytical Pillars of the Long-term Foreign Currency Issuer Default Rating (LTFC IDR)
Macro Performance, Policies,
Prospects (11%)
Public Finances
(17%)
External Finances
(18%)
Structural Features
(54%) Output
Sovereign Rating
Model
GDP growth
Inflation
Volatility
Deficit
Debt
FX debt
Interest payments
Commodity
dependence
Reserve currency
Sovereign assets
Interest service
FX reserves
Governance
GDP p/c
Share of world GDP
Money supply
Default record
Predicted LT FC IDR
Qualitative Overlay
Adjustment
Macro policy framework
MT growth outlook
Macro stability
+2 to -2
Financing flexibility
Debt sustainability
Fiscal rigidity
+2 to -2
Financing flexibility
Debt sustainability
Vulnerability to shocks
+2 to -2
Political risk
Banking sector
Business environment
+2 to -2
+3 to -3
Final Rating
LTFC IDR
1
2
3
The Sovereign Rating Model estimates a predicted rating based on 3-year averages (t-1, t, t+1), then
the Qualitative Overlay is applied (+3 to -3 notches) by the rating committee to account for issues
and factors not captured by the data
1 4 3 2
Source: Fitch Ratings
27
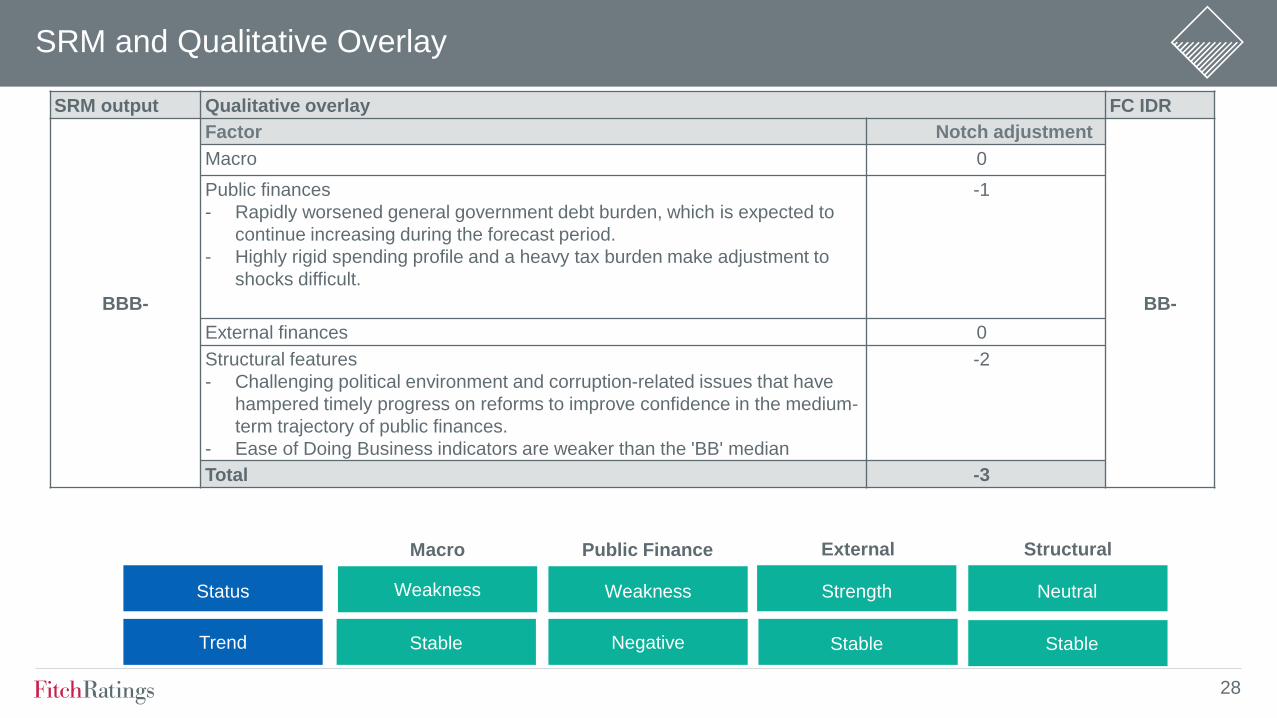
SRM and Qualitative Overlay
Macro
Status
Public Finance External Structural
Weakness
Stable Stable Negative
Weakness Strength Neutral
Trend Stable
SRM output Qualitative overlay FC IDR
BBB-
Factor Notch adjustment
BB-
Macro 0
Public finances
- Rapidly worsened general government debt burden, which is expected to
continue increasing during the forecast period.
- Highly rigid spending profile and a heavy tax burden make adjustment to
shocks difficult.
-1
External finances 0
Structural features
- Challenging political environment and corruption-related issues that have
hampered timely progress on reforms to improve confidence in the medium-
term trajectory of public finances.
- Ease of Doing Business indicators are weaker than the 'BB' median
-2
Total -3
28
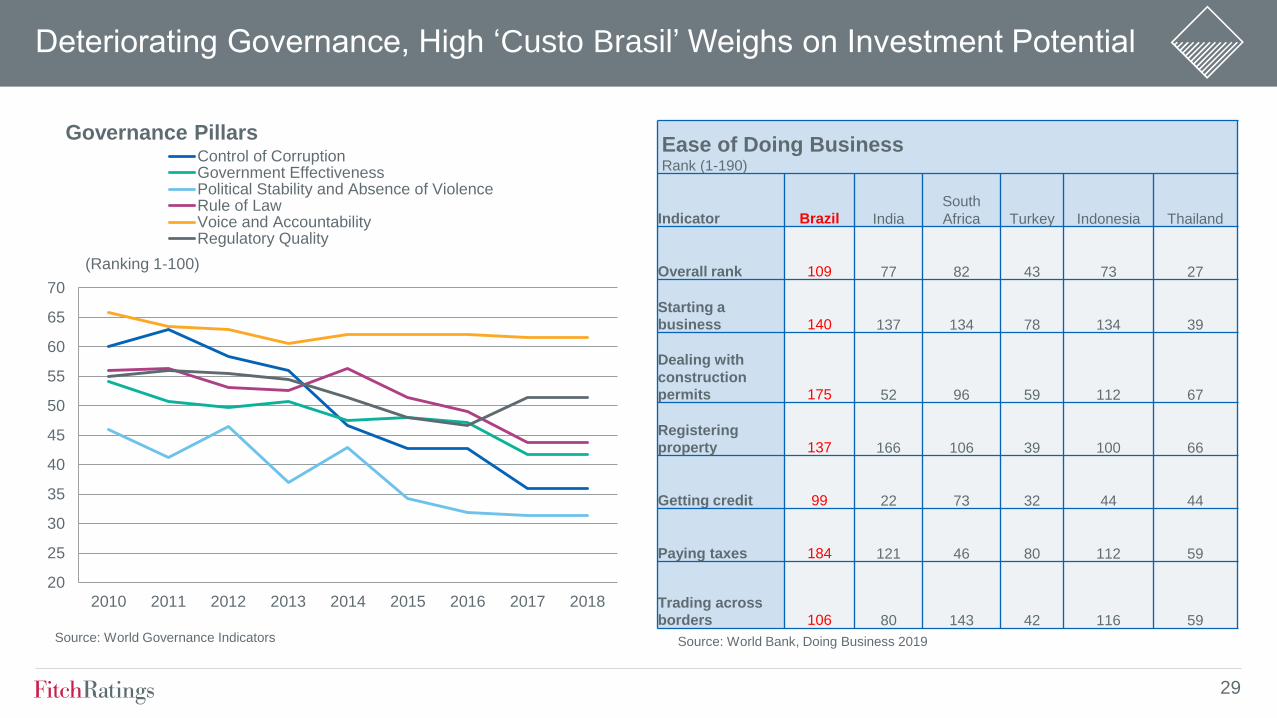
Deteriorating Governance, High ‘Custo Brasil’ Weighs on Investment Potential
Ease of Doing Business Rank (1-190)
Indicator Brazil India
South
Africa Turkey Indonesia Thailand
Overall rank 109 77 82 43 73 27
Starting a business 140 137 134 78 134 39
Dealing with
construction
permits 175 52 96 59 112 67
Registering
property 137 166 106 39 100 66
Getting credit 99 22 73 32 44 44
Paying taxes 184 121 46 80 112 59
Trading across borders 106 80 143 42 116 59
20
25
30
35
40
45
50
55
60
65
70
2010 2011 2012 2013 2014 2015 2016 2017 2018
Control of CorruptionGovernment EffectivenessPolitical Stability and Absence of ViolenceRule of LawVoice and AccountabilityRegulatory Quality
Governance Pillars
(Ranking 1-100)
Source: World Governance Indicators Source: World Bank, Doing Business 2019
29
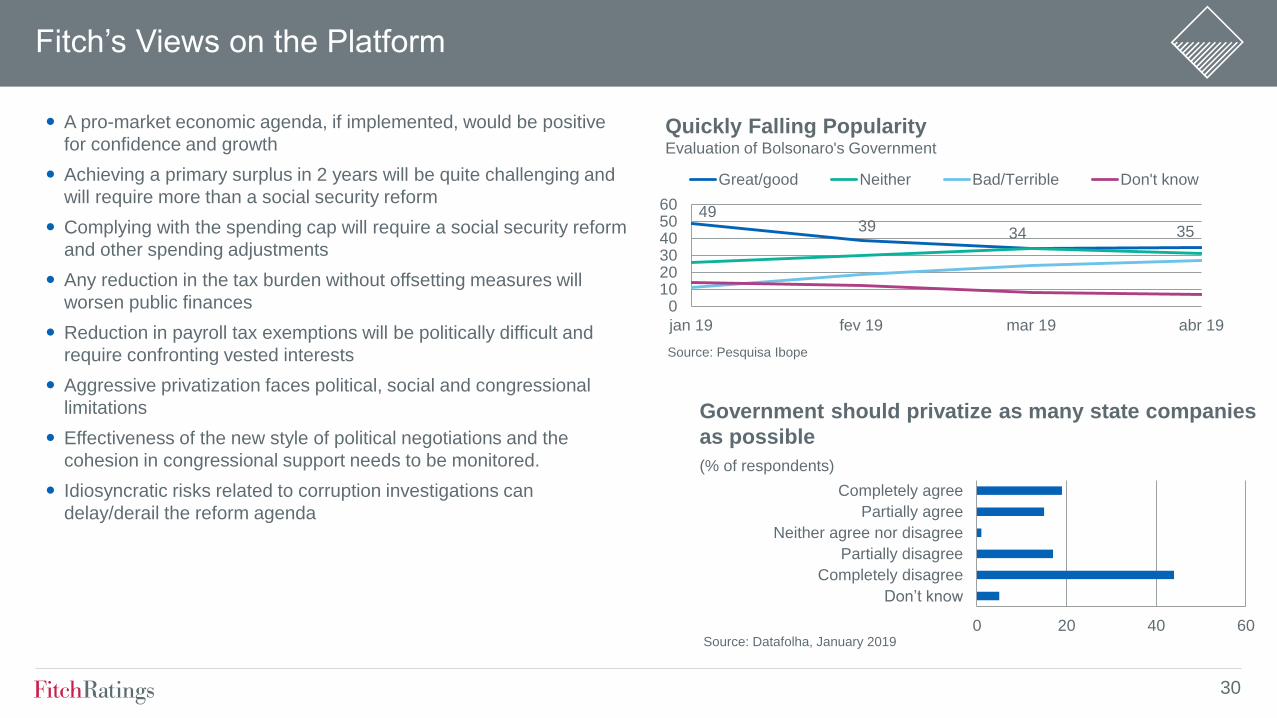
Fitch’s Views on the Platform
A pro-market economic agenda, if implemented, would be positive
for confidence and growth
Achieving a primary surplus in 2 years will be quite challenging and
will require more than a social security reform
Complying with the spending cap will require a social security reform
and other spending adjustments
Any reduction in the tax burden without offsetting measures will
worsen public finances
Reduction in payroll tax exemptions will be politically difficult and
require confronting vested interests
Aggressive privatization faces political, social and congressional
limitations
Effectiveness of the new style of political negotiations and the
cohesion in congressional support needs to be monitored.
Idiosyncratic risks related to corruption investigations can
delay/derail the reform agenda
0 20 40 60
Don’t know
Completely disagree
Partially disagree
Neither agree nor disagree
Partially agree
Completely agree
Source: Datafolha, January 2019
Government should privatize as many state companies
as possible
(% of respondents)
49 39 34 35
0102030405060
jan 19 fev 19 mar 19 abr 19
Great/good Neither Bad/Terrible Don't know
Source: Pesquisa Ibope
Quickly Falling Popularity Evaluation of Bolsonaro's Government
30
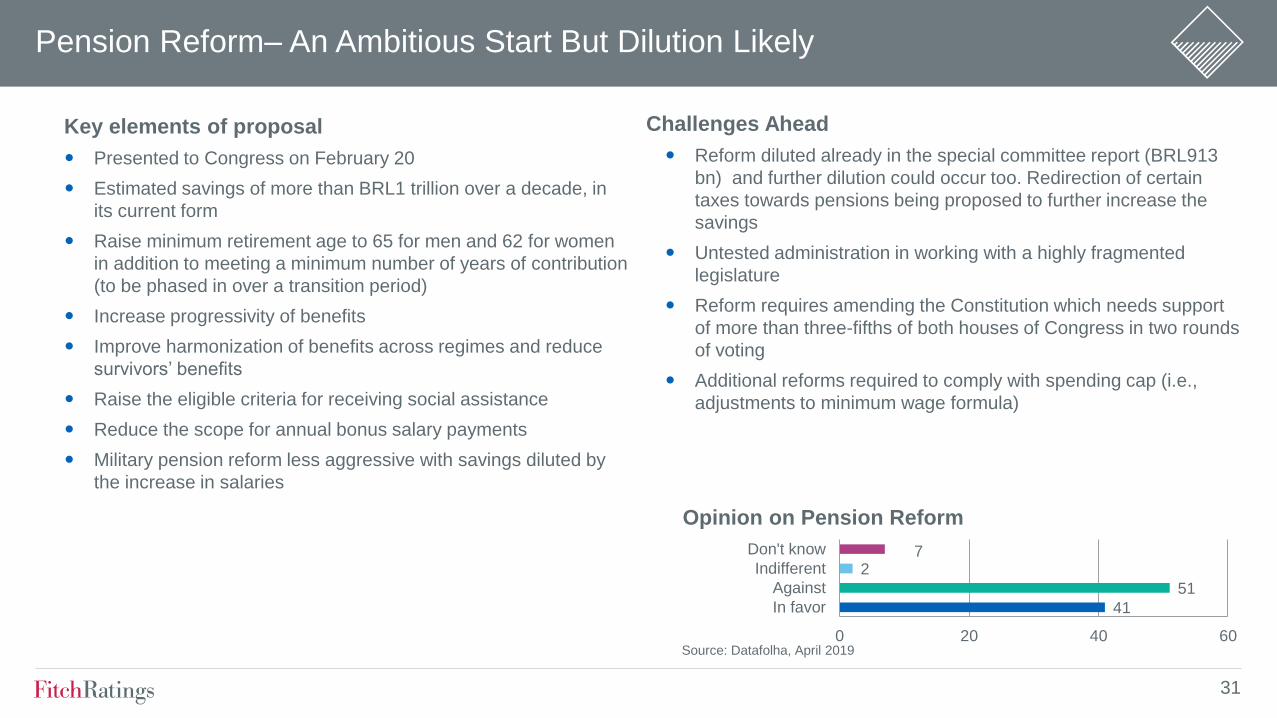
Pension Reform– An Ambitious Start But Dilution Likely
Key elements of proposal
Presented to Congress on February 20
Estimated savings of more than BRL1 trillion over a decade, in
its current form
Raise minimum retirement age to 65 for men and 62 for women
in addition to meeting a minimum number of years of contribution
(to be phased in over a transition period)
Increase progressivity of benefits
Improve harmonization of benefits across regimes and reduce
survivors’ benefits
Raise the eligible criteria for receiving social assistance
Reduce the scope for annual bonus salary payments
Military pension reform less aggressive with savings diluted by
the increase in salaries
Challenges Ahead
Reform diluted already in the special committee report (BRL913
bn) and further dilution could occur too. Redirection of certain
taxes towards pensions being proposed to further increase the
savings
Untested administration in working with a highly fragmented
legislature
Reform requires amending the Constitution which needs support
of more than three-fifths of both houses of Congress in two rounds
of voting
Additional reforms required to comply with spending cap (i.e.,
adjustments to minimum wage formula)
41
51
2 7
In favor
Against
Indifferent
Don't know
0 20 40 60
Opinion on Pension Reform
Source: Datafolha, April 2019
31
What Will Fitch Monitor in Future Rating Decisions
Political willingness and capacity for economic reforms
Cohesiveness of the economic team to implement the policy
agenda
Operational and formal independence of the BCB
Political strategy of the administration to negotiate in congress to
pursue and approve reforms
Assessment of fiscal proposals and the degree to which those
reduce fiscal deficits and stabilize the rising debt burden
Broader micro economic reform agenda to boost growth and
reduce unemployment
Positive Rating Sensitivities
Improvement in the political environment that facilitates the
implementation of credible policy initiatives to address medium term
public debt sustainability
Fiscal consolidation and improved prospects for debt stabilization
Improved growth outlook amid continued macroeconomic stability
Negative Rating Sensitivities
Lack of fiscal reform that is sufficient to support an improvement in
the fiscal and growth prospects, leading to a rapid growth in the
government debt burden that threatens medium term public debt
sustainability
Deterioration in the sovereign's domestic and/or external borrowing
conditions
Erosion of international reserves buffer and the broader external
balance sheet
32
Fitch Ratings’ credit ratings rely on factual information received from issuers and
other sources.
Fitch Ratings cannot ensure that all such information will be accurate and complete.
Further, ratings are inherently forward-looking, embody assumptions and predictions
that by their nature cannot be verified as facts, and can be affected by future events
or conditions that were not anticipated at the time a rating was issued or affirmed.
The information in this presentation is provided “as is” without any representation or
warranty. A Fitch Ratings credit rating is an opinion as to the creditworthiness of a
security and does not address the risk of loss due to risks other than credit risk,
unless such risk is specifically mentioned. A Fitch Ratings report is not a substitute
for information provided to investors by the issuer and its agents in connection with a
sale of securities.
Ratings may be changed or withdrawn at any time for any reason in the sole
discretion of Fitch Ratings. The agency does not provide investment advice of any
sort. Ratings are not a recommendation to buy, sell, or hold any security.
ALL FITCH CREDIT RATINGS ARE SUBJECT TO CERTAIN LIMITATIONS AND
DISCLAIMERS. PLEASE READ THESE LIMITATIONS AND DISCLAIMERS AND
THE TERMS OF USE OF SUCH RATINGS AT WWW.FITCHRATINGS.COM.

@fitchratings
fitchratings.com
New York London 33 Whitehall Street
New York, NY 10004
30 North Colonnade
Canary Wharf
London, E14 5GN