Embed Size (px)
Citation preview
Brazil:The Response
to the Crisis
Min. Guido MantegaSeptember 2009
The end of the beginning or the beginning of the end?
• One year after Lehman Brothers´s bankruptcy it becomes clear that Brazil was one of the most successful countries in fighting the crisis;
• While most of the countries recovered slowly Brazil is one of the first countries to leave the crisis behind.
2

Sources: BEA (USA), JPMorgan (China) e IBGE (Brasil) Produced by: Ministry of Finance
Positive GDP Growth for Brazil and China Annualized Quarter data
3* Forecasts: USA and China - JP Morgan and Brazil - Ministry of Finance
4
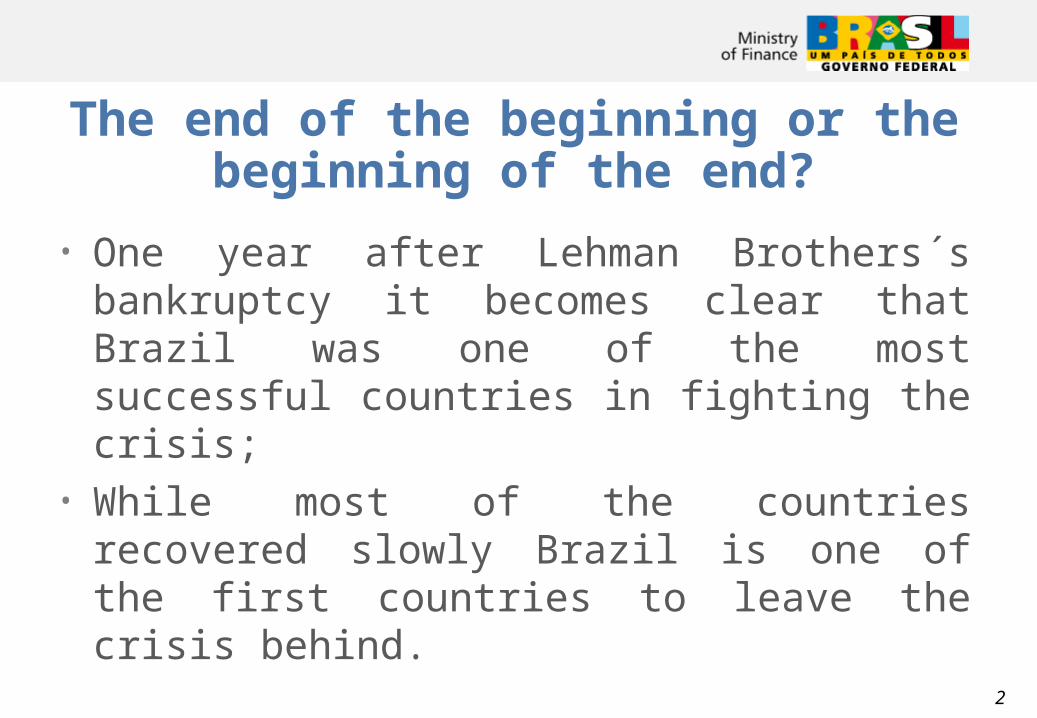
GDP Growth – International Comparison
2nd Quarter/09* - %
Source: GDW JP Morgan 09/11/2009 and IBGE for Brazil
* Growth relative to the previuos quarter (1st Q 2009) , annualized and seazonally adjusted.
5
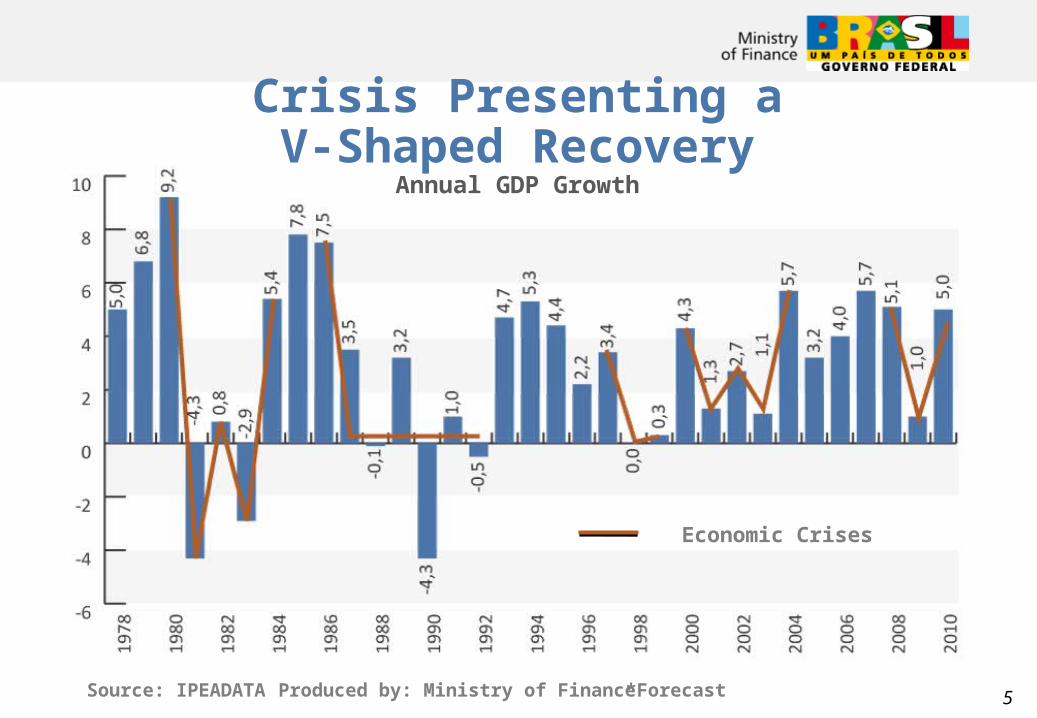
Crisis Presenting aV-Shaped Recovery
Annual GDP Growth
Source: IPEADATA Produced by: Ministry of Finance
Economic Crises
*Forecast

6
GDP and ConsumptionChange in the last 12 months - %
Source: IBGE Produced by: Ministry of Finance

7
Reduction of External Vulnerability
Source: Ministry of Development Industry and Commerce. Produced by: Ministry of Finance
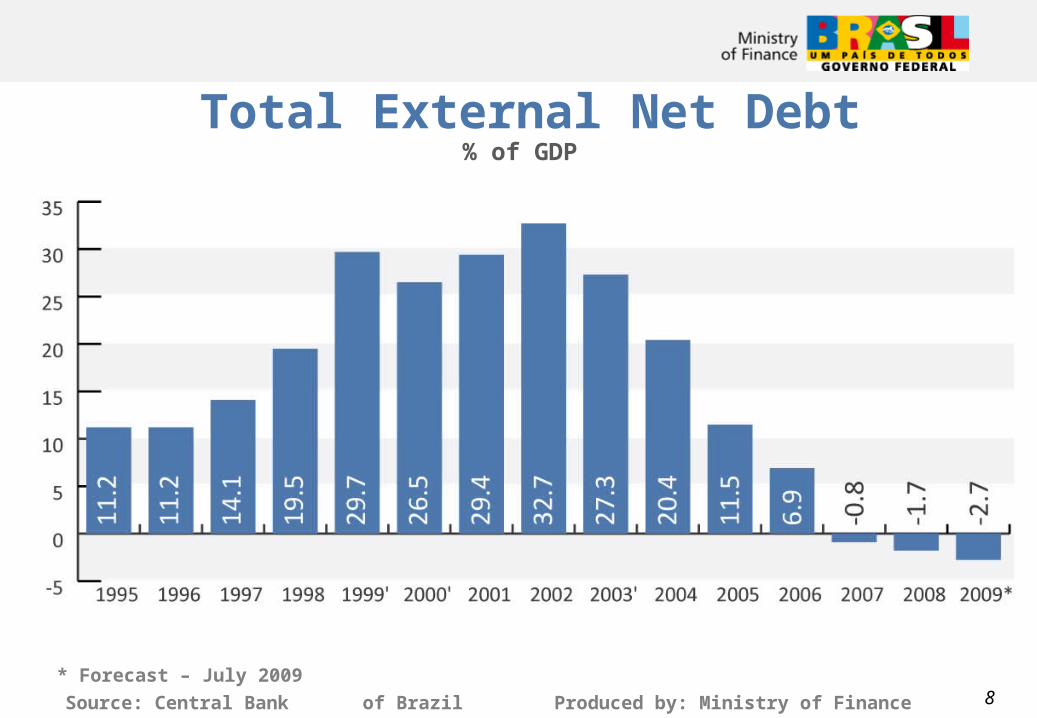
8Source: Central Bank of Brazil Produced by: Ministry of Finance
Total External Net Debt% of GDP
* Forecast – July 2009

9
Foreign Exchange Reserves (International Liquidity)
US$ billion
Source: Central Bank of Brazil. Prepared by: Ministry of Finance
*Position at September 08th, 2009.

10
SOLID BANKING SYSTEM
More RegulationState-Owned Banks

11
Regulatory CapitalCapital-to-Risk Weighted Assets Ratio - %
Source: Central Bank of Brazil Produced by: Ministry of Finance..
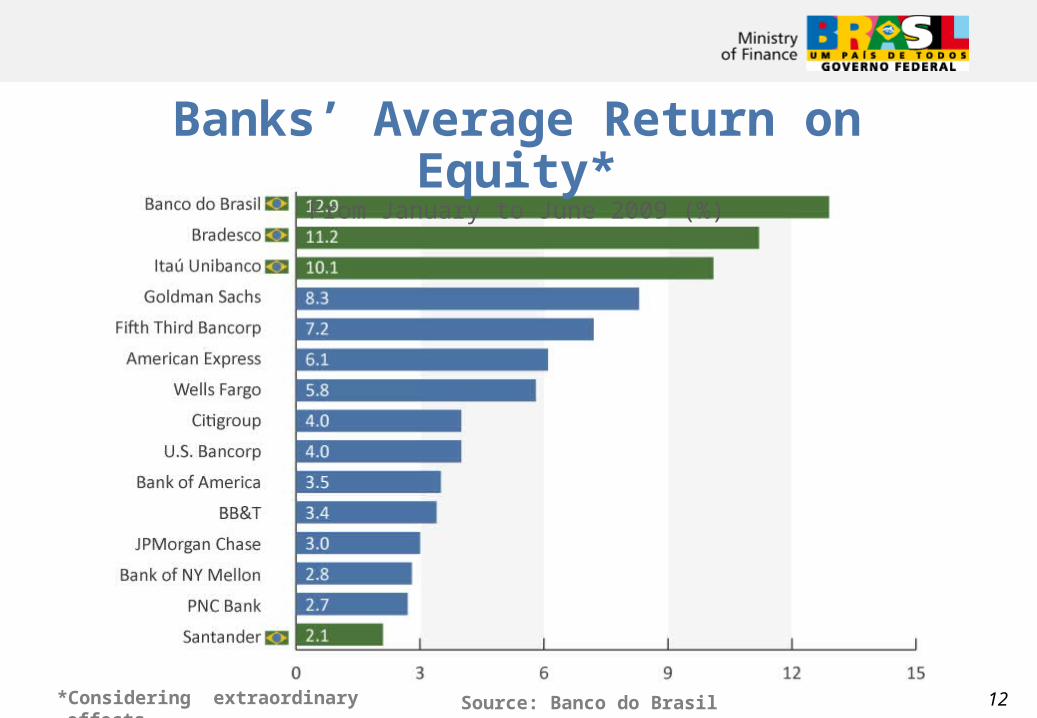
Banks’ Average Return on Equity*
From January to June 2009 (%)
*Considering extraordinary effects Source: Banco do Brasil 12

13
2003-08 Vigorous Economic GrowthMacroeconomic Fundamentals
• Brazil acquired the ability to implement economic policies to fight crises;
• Expansionary Monetary Policy;
Compulsory reserves;
Interest Rate Reductions;
Foreign Commerce (Reserves);
• Fiscal Policy for Economic Stimulus.
14
Effects of Monetary Policy
• Monetary Policy was efficient;
• It prevented bank’s bankrupcy;
• Overcame problems with derivatives;
• Supported small and medium banks;
• It didn’t avoid liquidity crunch;
• Without State-owned banks credit would remain scarce and interest rates would be higher.
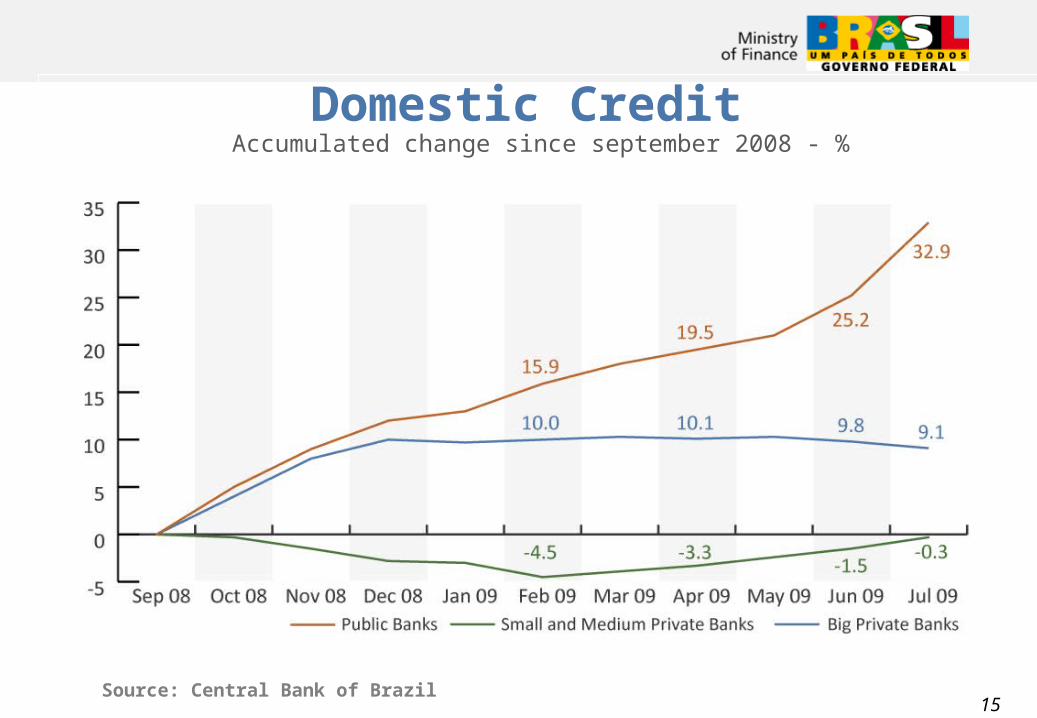
15
Domestic Credit Accumulated change since september 2008 - %
Source: Central Bank of Brazil

Repo ContractsTotal Value and Maturity of Contracts – Monthly Average - Jan/07 to Sept/09 (R$ bilions)
16Source: Central Bank of Brazil
17
Active Fiscal Policy
• Expansion of Public Investments (PAC); • R$ 100 billion to the Brazilian Development Bank
(BNDES)• “Minha Casa Minha Vida” (Housing Program): US$
15.6 billion in subsidies and US$ 33.3 billion in investments;
Note: all values converted from Real to US Dollar at the exchange rate of US$1=R$1.8.
18
Active Fiscal Policy
Note: all values converted from Real to US Dollar at the exchange rate of US$1=R$1.8.
• “Plano Safra” (Agriculture): US$ 59.4 billion (2009-2010);
• Investment Expansion Program (BNDES);
• Expansion of social programs;
• Fiscal Stimulus to States and Municipalities (2007-2009) US$ 18.9 billion.
19
Tax Reductions in 2009
• Reduction of the tax on Industrial Products (IPI): automobiles, trucks, building construction materials, kitchen appliances, capital goods.
• Reduction of the Financial Transactions Tax (IOF) to individuals (50% reduction) and to foreign exchange transactions.
• Change in the Individual Income Taxes’ (IRPF) brakets.
19
20
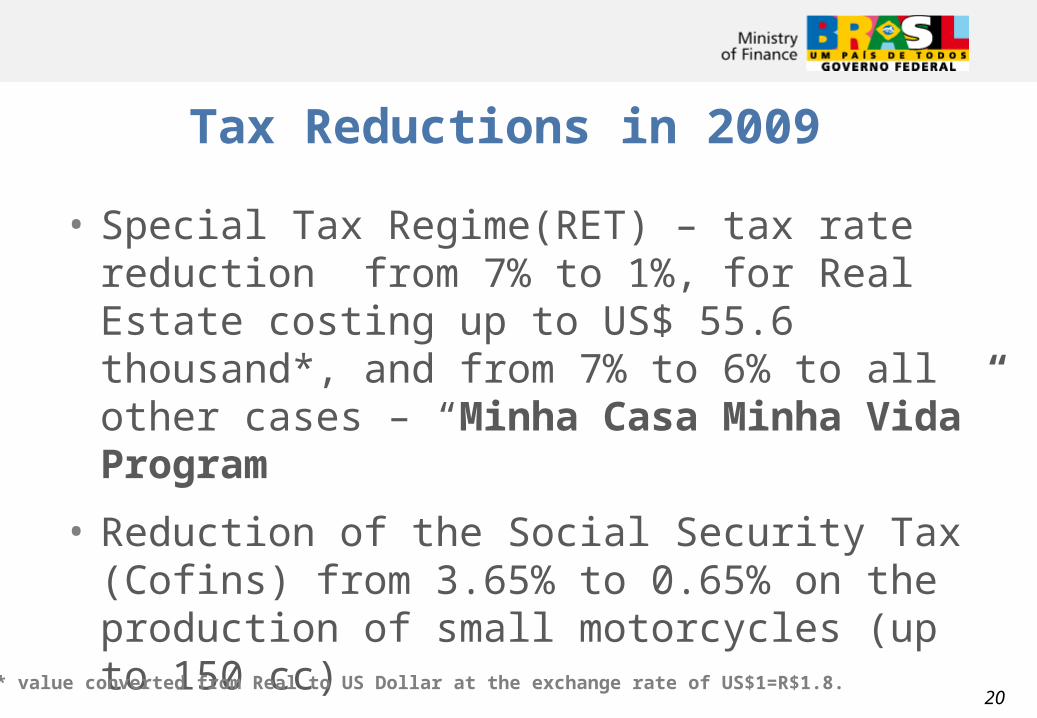
Tax Reductions in 2009
• Special Tax Regime(RET) – tax rate reduction from 7% to 1%, for Real Estate costing up to US$ 55.6 thousand*, and from 7% to 6% to all other cases – “Minha Casa Minha Vida” Program
• Reduction of the Social Security Tax (Cofins) from 3.65% to 0.65% on the production of small motorcycles (up to 150 cc)
* value converted from Real to US Dollar at the exchange rate of US$1=R$1.8.20
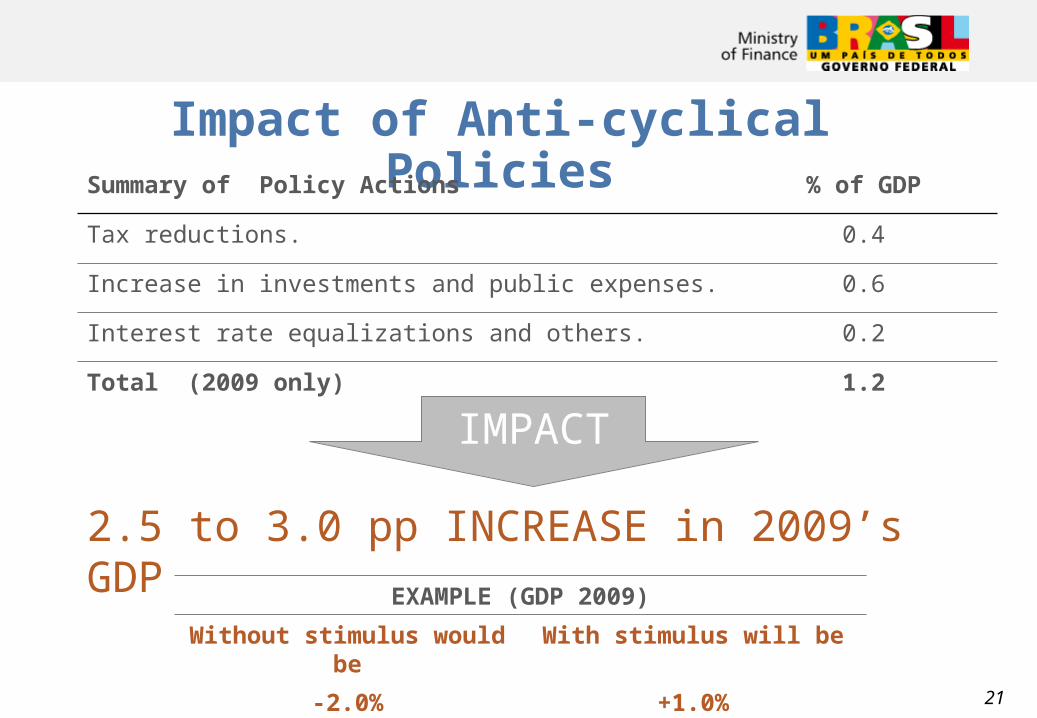
Impact of Anti-cyclical PoliciesSummary of Policy Actions % of GDP
Tax reductions. 0.4
Increase in investments and public expenses. 0.6
Interest rate equalizations and others. 0.2
Total (2009 only) 1.2
IMPACT
2.5 to 3.0 pp INCREASE in 2009’s GDP
EXAMPLE (GDP 2009)
Without stimulus would be With stimulus will be
-2.0% +1.0%21
22
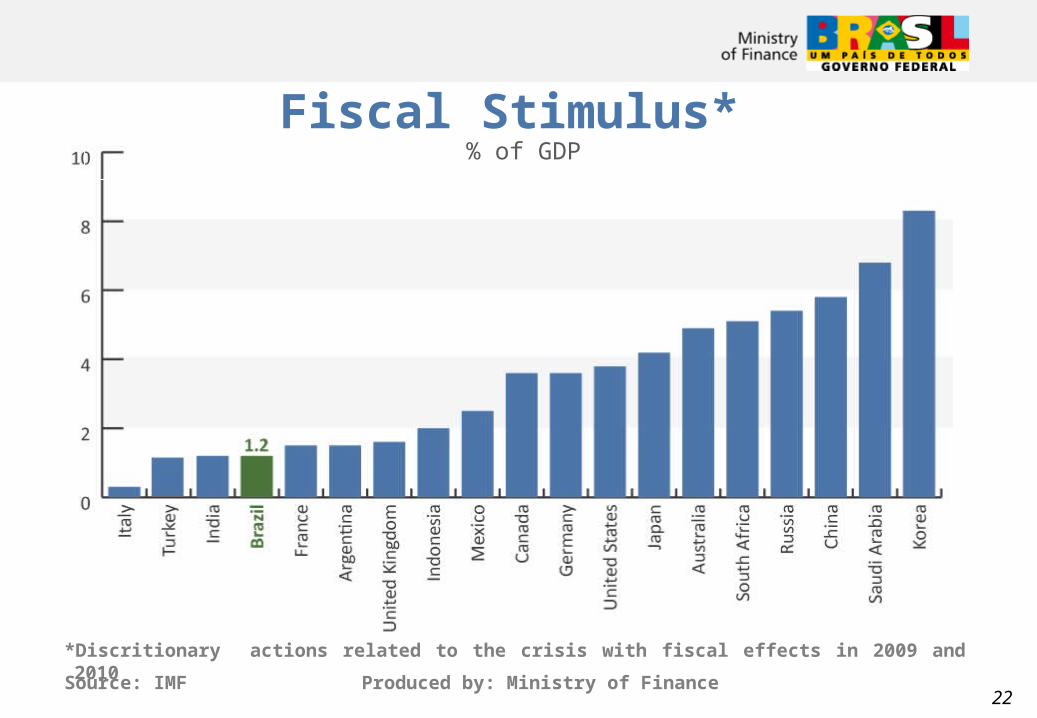
Fiscal Stimulus* % of GDP
Source: IMF Produced by: Ministry of Finance
*Discritionary actions related to the crisis with fiscal effects in 2009 and 2010
22
23
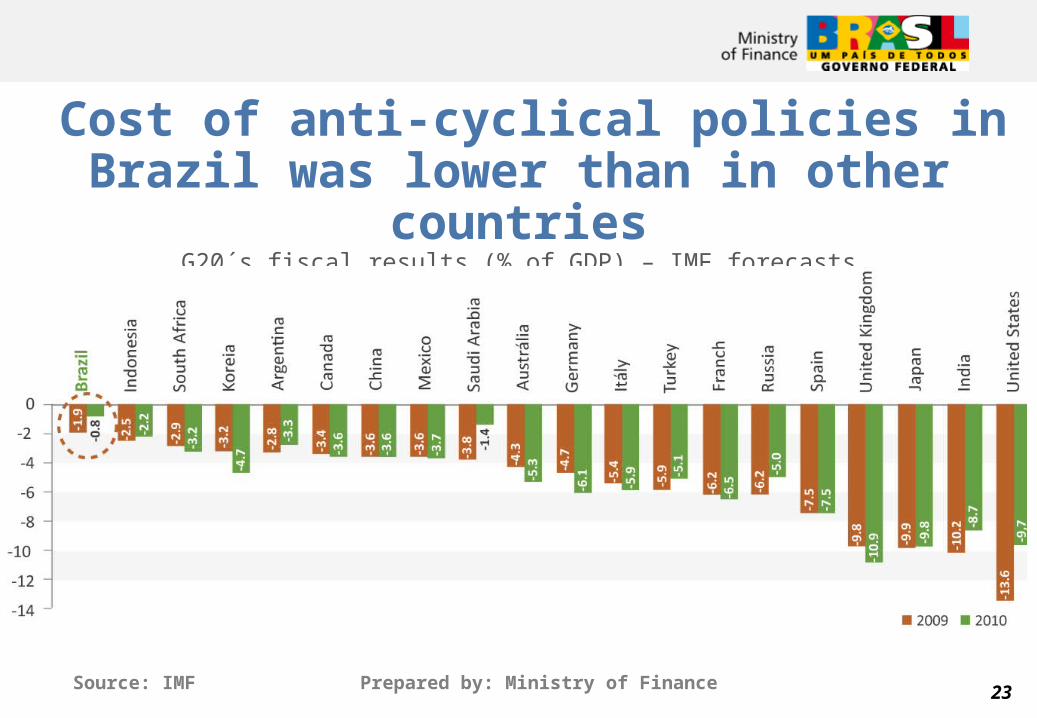
Cost of anti-cyclical policies in Brazil was lower than in other countries
G20´s fiscal results (% of GDP) – IMF forecasts
Source: IMF Prepared by: Ministry of Finance
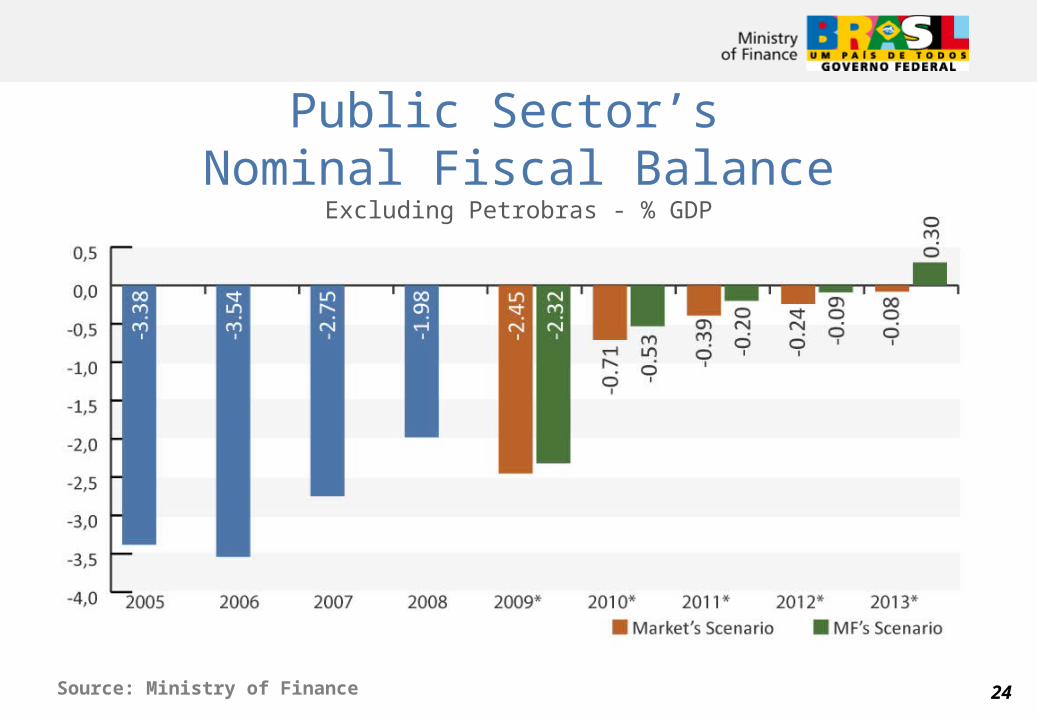
24
Public Sector’s Nominal Fiscal Balance
Excluding Petrobras - % GDP
Source: Ministry of Finance

25
Public Sector’s Net Debt Excluding Petrobras - % GDP
Central Bank forecasts, considering a primary surplus of 2.5% of GDP in 2009 and of 3.3% of GDP from 2010 to 2012
Source: Central Bank Prepared by: Ministry of Finance
26
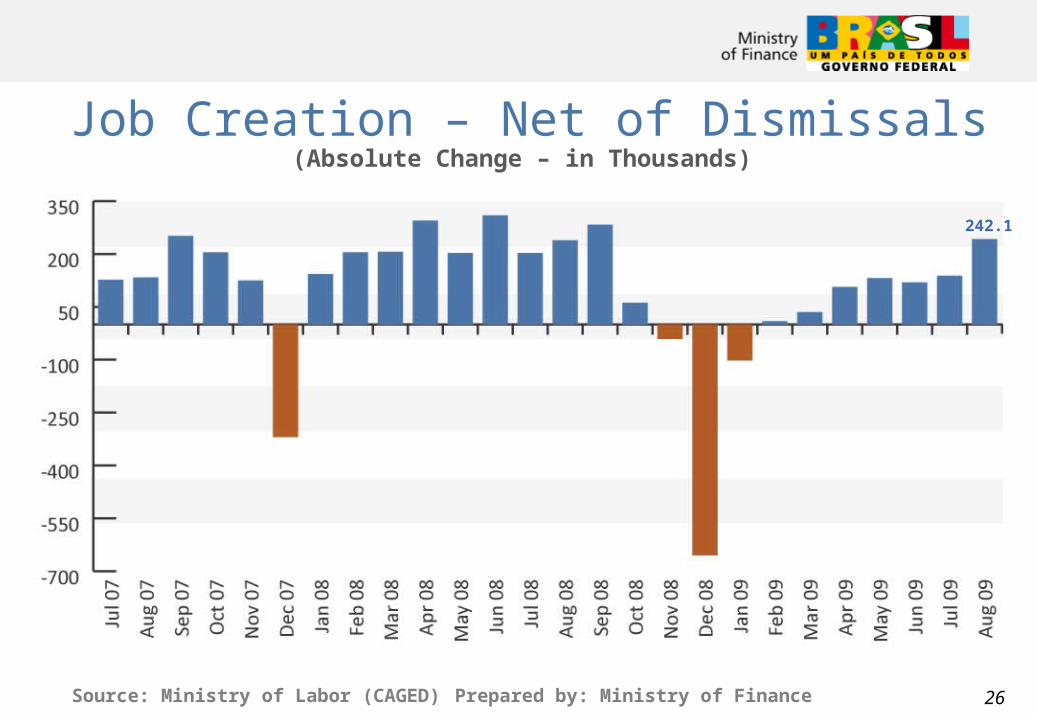
Job Creation – Net of Dismissals(Absolute Change – in Thousands)
Source: Ministry of Labor (CAGED) Prepared by: Ministry of Finance 26
242.1
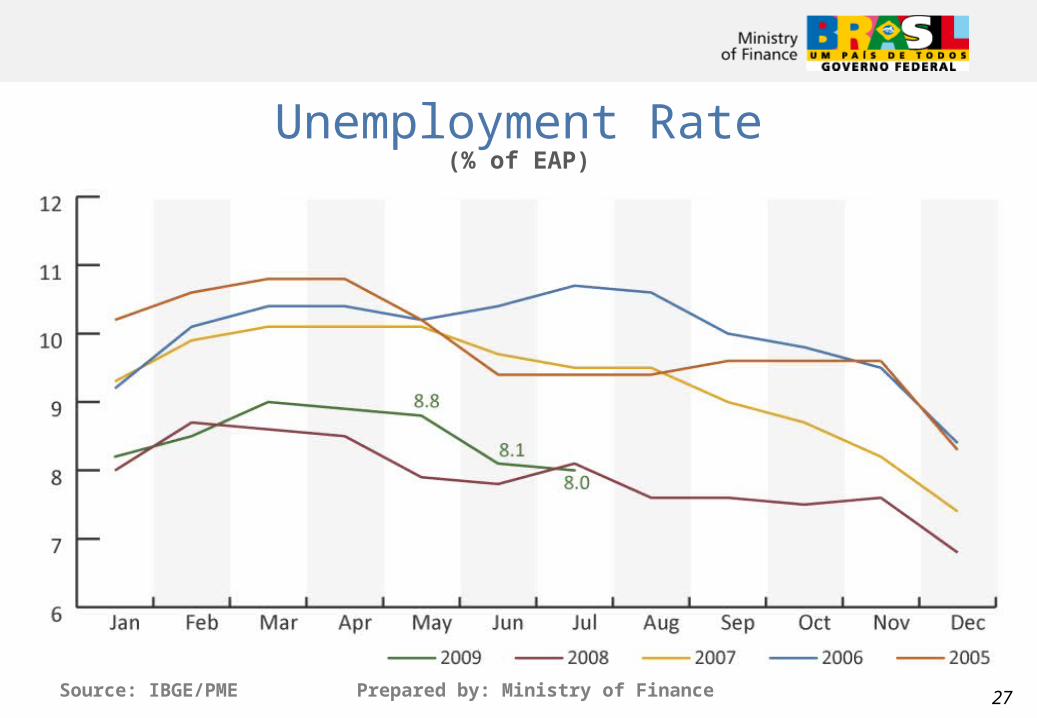
Source: IBGE/PME Prepared by: Ministry of Finance
Unemployment Rate(% of EAP)
27

Source: LatinPanel
Few Brazilians Felt the Negative impact of the World Crisis!!
28
29
Lessons from the Crisis• Most affected countries:
• Countries with deregulated financial markets
• “Minimum Government”, with few state-owned enterprises;
• Countries with low economic dynamism, with weak domestic markets, or with markets more dependant on external demand.
• Countries with unstable fiscal, monetary and external accounts.
29

30
Lessons from the Crisis• Least affected countries:
• Countries with more financial regulation and with a more prominent role for the Government in the economy and in social programs;
• Countries with state-owned banks and state-owned enterprises in strategic sectors;
• Countries with more dynamic economies and with flourishing domestic markets;
• Countries experiencing stable growth with fiscal and external accounts under control and with significant foreign exchange reserves.
30