Embed Size (px)
Citation preview

Braskem S.A. Quarterly Information (ITR) at
March 31, 2013
and Report on the Review
of the Quarterly Information

Report on Review of Quarterly Information To the Board of Directors and Shareholders
Braskem S.A.
Introduction
We have reviewed the accompanying parent company and consolidated interim accounting information of
Braskem S.A., included in the Quarterly Information Form (ITR) for the quarter ended March 31, 2013,
comprising the balance sheet as at that date and the statements of operations, comprehensive income,
changes in equity and cash flows for the quarter then ended, and a summary of significant accounting
policies and other explanatory information.
Management is responsible for the preparation of the parent company interim accounting information in
accordance with the accounting standard CPC 21 - Interim Financial Reporting, of the Brazilian
Accounting Pronouncements Committee (CPC), and of the consolidated interim accounting information
in accordance with CPC 21 and International Accounting Standard (IAS) 34 - Interim Financial Reporting
issued by the International Accounting Standards Board (IASB), as well as the presentation of this
information in accordance with the standards issued by the Brazilian Securities Commission (CVM),
applicable to the preparation of the Quarterly Information (ITR). Our responsibility is to express a
conclusion on this interim accounting information based on our review.
Scope of review
We conducted our review in accordance with Brazilian and International Standards on Reviews of Interim
Financial Information (NBC TR 2410 – Review of Interim Financial Information Performed by the
Independent Auditor of the Entity and ISRE 2410 – Review of Interim Financial Information Performed
by the Independent Auditor of the Entity, respectively). A review of interim information consists of
making inquiries, primarily of persons responsible for financial and accounting matters, and applying
analytical and other review procedures. A review is substantially less in scope than an audit conducted in
accordance with Brazilian and International Standards on Auditing and consequently does not enable us
to obtain assurance that we would become aware of all significant matters that might be identified in an
audit. Accordingly, we do not express an audit opinion.
Conclusion on the parent
company interim information
Based on our review, nothing has come to our attention that causes us to believe that the accompanying
parent company interim accounting information included in the quarterly information referred to above
has not been prepared, in all material respects, in accordance with CPC 21 applicable to the preparation of
the Quarterly Information, and presented in accordance with the standards issued by the CVM.

Conclusion on the consolidated
interim information Based on our review, nothing has come to our attention that causes us to believe that the accompanying
consolidated interim accounting information included in the quarterly information referred to above has
not been prepared, in all material respects, in accordance with CPC 21 and IAS 34 applicable to the
preparation of the Quarterly Information, and presented in accordance with the standards issued by the
CVM.
Other matters
Statements of value added We have also reviewed the parent company and consolidated statements of value added for the quarter
ended March 31, 2013. These statements are the responsibility of the Company’s management, and are
required to be presented in accordance with standards issued by the CVM applicable to the preparation of
Quarterly Information (ITR) and are considered supplementary information under IFRS, which do not
require the presentation of the statement of value added. These statements have been submitted to the
same review procedures described above and, based on our review, nothing has come to our attention that
causes us to believe that they have not been prepared, in all material respects, in a manner consistent with
the parent company and consolidated interim accounting information taken as a whole.
Salvador, May 9, 2013
PricewaterhouseCoopers
Auditores Independentes
CRC 2SP000160/O-5 "F" BA
Fábio Cajazeira Mendes
Contador CRC 1SP196825/O-0 "S" BA

Braskem S.A.
Balance sheet
at March 31, 2013 All amounts in thousands of reais
1
The Management notes are an integral part of the financial statements
Assets Note Mar/2013 Dec/2012 Mar/2013 Dec/2012
2.2 Revised Revised
Current assets
Cash and cash equivalents 4 1,877,056 0 1,627,928 3,002,201 0 3,287,622
Financial investments 5 159,007 0 155,535 221,799 0 172,146
Trade accounts receivable 6 2,241,059 0 1,834,491 2,449,316 0 2,326,480
Inventories 7 2,763,650 0 2,478,550 4,632,690 0 4,102,055
Taxes recoverable 9 1,085,840 0 1,005,842 1,661,217 0 1,476,211
Dividends and interest on capital - 130,145 0 130,145 2,645 0 2,645
Prepaid expenses - 8,348 0 14,153 16,245 0 54,013
Related parties 8 17,787 0 13,906 23,210 0 13,912
Insurance claims 10 161,257 0 160,981 161,257 0 160,981
Other receivables 11 609,421 0 761,450 660,548 0 818,434
-
- 9,053,570 8,182,981 12,831,128 12,414,499
-
Non-current assets held for sale 3 277,828 0 277,828
-
- 9,053,570 8,182,981 13,108,956 12,692,327
-
Non-current assets -
Financial investments 5 26,328 0 34,088 28,614 0 34,489
Trade accounts receivable 6 31,240 0 35,710 34,059 0 37,742
Taxes recoverable 9 978,668 0 1,026,391 1,499,654 0 1,527,134
Deferred income tax and social contribution 18(b) 1,088,445 0 1,100,611 2,060,149 0 2,062,009
Judicial deposits 12 165,194 0 164,443 177,475 0 179,618
Related parties 8 1,049,495 0 988,589 128,736 0 127,627
Insurance claims 10 87,311 0 45,649 88,918 0 47,255
Other receivables 11 144,855 0 153,466 241,257 0 218,279
Investments in subsidiaries and jointly-controlled subsidiaries 13 9,736,085 0 9,591,644 110,824 0 118,787
Other investments - 6,575 0 6,575 6,949 0 6,948
Property, plant and equipment 14 11,723,191 0 11,794,385 21,854,970 0 21,176,785
Intangible assets 15 2,231,938 0 2,241,565 2,926,210 0 2,940,966
27,269,325 27,183,116 29,157,815 28,477,639
Total assets 36,322,895 35,366,097 42,266,771 41,169,966
Parent Company Consolidated

Braskem S.A.
Balance sheet
at March 31, 2013 All amounts in thousands of reais Continued
2
The Management notes are an integral part of the financial statements
Liabilities and equity Note Mar/2013 Dec/2012 Mar/2013 Dec/2012
2.2 Revised Revised
Current liabilities
Trade payables - 6,508,010 0 6,446,898 8,701,681 0 8,897,597
Borrowings 16 2,194,893 0 1,887,811 2,383,219 0 1,836,028
Derivatives operations 24.2 248,541 0 293,378 248,541 0 293,378
Payroll and related charges - 302,445 0 249,275 425,585 0 349,176
Taxes payable 17 239,270 0 245,173 352,837 0 342,789
Dividends and interest on capital - 1,334 0 2,160 4,111 0 5,369
Advances from customers 20 153,917 0 257,079 477,261 0 237,504
Sundry provisions 19 14,840 0 11,930 35,185 0 52,264
Post-employment benefits 21 160,645 0 147,175 160,645 0 147,175
Accounts payable to related parties 8 316,850 0 206,991 - 0 -
Other payables 22 32,678 0 29,478 547,600 0 385,577
-
- 10,173,423 9,777,348 13,336,665 12,546,857
-
-
Non-current liabilities held for sale 3 109,770 0 109,770
-
- 10,173,423 9,777,348 13,446,435 12,656,627
-
Non-current liabilities -
Borrowings 16 10,416,128 0 10,534,287 15,723,502 0 15,675,610
Taxes payable 17 1,040,112 0 1,059,225 1,146,671 0 1,164,753
Accounts payable to related parties 8 4,237,696 0 3,667,754 - 0 -
Long-term incentives - 10,567 0 10,405 10,567 0 10,405
Deferred income tax and social contribution 18(b) 1,041,181 0 1,015,743 2,196,467 0 2,138,622
Post-employment benefits 21 - 0 - 35,242 0 36,602
Provision for losses on subsidiaries and jointly-controlled subsidiaries - 115,562 0 119,375 - 0 -
Advances from customers 20 66,078 0 80,463 188,794 0 204,989
Sundry provisions 19 143,562 0 144,782 365,322 0 363,411
Other payables 22 264,412 0 343,652 280,141 0 266,963
-
- 17,335,298 16,975,686 19,946,706 19,861,355
-
Equity 25
Capital (a) 8,043,222 0 8,043,222 8,043,222 0 8,043,222
Capital reserve - 797,979 0 797,979 797,979 0 797,979
Other comprehensive income - 321,559 0 337,411 321,559 0 337,411
Treasury shares (b) - 0 - (48,892) 0 (48,892)
Losses accumulated - (348,586) 0 (565,549) (348,586) 0 (565,549)
-
Total attributable to the Company's shareholders - 8,814,174 8,613,063 8,765,282 8,564,171
-
Non-controlling interest 2.4 108,348 0 87,813
-
- 8,814,174 8,613,063 8,873,630 8,651,984
-
Total liabilities and equity - 36,322,895 35,366,097 42,266,771 41,169,966
-
Parent Company Consolidated

Braskem S.A.
Statement of operations for the period
at March 31, 2013 All amounts in thousands of reais, except earnings (loss) per share
3
The Management notes are an integral part of the financial statements
Note Mar/2013 Mar/2012 Mar/2013 Mar/2012
3 Revised
Continued operations
Net sales revenue 27 5,508,783 0 4,574,694 0 9,295,751 0 8,071,673
Cost of products sold - (4,969,651) 0 (4,146,710) 0 (8,315,675) 0 (7,482,025)
-
Gross profit - 539,132 427,984 980,076 589,648
-
Income (expenses) -
Selling - (48,497) 0 (49,384) 0 (99,555) 0 (90,951)
Distribution - (100,077) 0 (90,322) 0 (146,817) 0 (129,998)
General and administrative - (154,188) 0 (153,457) 0 (237,006) 0 (231,749)
Research and development - (18,515) 0 (18,160) 0 (24,564) 0 (24,446)
Results from equity investments 13(c) 156,088 0 137,230 0 (4,722) 0 (2,099)
Other operating income (expenses), net 32 (20,231) 0 (32,398) 0 (29,055) 0 191,940
-
Operating profit - 353,712 221,493 438,357 302,345
-
Financial results 29
Financial expenses - (151,509) 0 (69,577) 0 (230,050) 0 (192,751)
Financial income - 45,314 0 12,930 0 122,864 0 85,641
-
- (106,195) (56,647) (107,186) (107,110)
-
Profit before income tax and -
social contribution - 247,517 164,846 331,171 195,235
-
Current and deferred income tax and social contribution 18(a) (37,605) 0 (11,288) 0 (104,368) 0 (53,138)
- (37,605) (11,288) (104,368) (53,138)
-
Profit for the period of continued operations - 209,912 153,558 226,803 142,097
-
Discontinued operations results 3(b)
Profit from discontinued operations - 15,433
Current and deferred income tax and social contribution - - (5,333)
- - 10,100
-
Profit for the period - 209,912 153,558 226,803 152,197
-
Attributable to: -
Company's shareholders - 209,912 0 153,558
Non-controlling interest 2.4 16,891 0 (1,361)
-
- 226,803 152,197
-
-
Earnings per share attributable to the shareholders of the Company -
of continued operations at the end of the period (R$) 26
Basic earnings per share - common - 0.0025 -
Basic earnings per share - preferred - 0.6062 0.4439
Diluted earnings per share - common - 0.0027 -
Diluted earnings per share - preferred - 0.6064 0.4443
Parent Company Consolidated

Braskem S.A.
Statement of comprehensive income for the period
at March 31, 2013 All amounts in thousands of reais, except earnings (loss) per share
4
The Management notes are an integral part of the financial statements
Note Mar/2013 Mar/2012 Mar/2013 Mar/2012
3 Revised
Profit for the period - 209,912 153,558 226,803 152,197
- - - - -
Other comprehensive income or loss: - - - - -
Cash flow derivatives - - 15,613 - 15,613
Foreign currency translation adjustment - (6,821) (55,631) (3,177) (49,444)
Income tax and social contribution related to - - - - -
components of comprehensive income - - (5,309) - (5,309)
- - - - -
Total other comprehensive income or loss - (6,821) (45,327) (3,177) (39,140)
- - - - -
Total comprehensive income for the period - 203,091 108,231 223,626 113,057
- - - -
Attributable to: - - - -
Company's shareholders - continued operations - - 203,091 98,131
Company's shareholders - discontinued operations - - - 10,100
Non-controlling interest - - 20,535 4,826
- - - -
- - 223,626 113,057
Parent Company Consolidated

Braskem S.A.
Statement of changes in equity All amounts in thousands of reais
5
The Management notes are an integral part of the financial statements
Parent Company
Retained
Unrealized Additional Other earnings Total
Capital Legal Tax profit dividends comprehensive Treasury (accumulated shareholders'
Capital reserve reserve incentives reserve proposed income shares deficit) equity
At December 31, 2011 8,043,222 845,998 87,710 4,547 16,457 482,593 315,586 (11,325) - 9,784,788
Comprehensive income for the period: - - - - - - - - - -
Profit for the period - - - - - - - - 153,558 153,558
Fair value of cash flow derivative, net of taxes - - - - - - 10,304 - - 10,304
Foreign currency translation adjustment - - - - - - (55,631) - - (55,631)
- - - - - - (45,327) - 153,558 108,231
- - - - - - - - - -
Equity valuation adjustments - - - - - - - - - -
Realization of deemed cost of jointly-controlled subsidiary, net of taxes - - - - - - (230) - 230 -
Realization of additional property, plant and equipment price-level
restatement, net of taxes - - - - - - (6,809) - 6,809 -
- - - - - - (7,039) - 7,039 -
- - - - - - - - - -
Contributions and distributions to shareholders: - - - - - - - - - -
Gain on interest in subsidiary - - - - - - 1,018 - - 1,018
- - - - - - 1,018 - - 1,018
- - - - - - - - - -
At March 31, 2012 8,043,222 845,998 87,710 4,547 16,457 482,593 264,238 (11,325) 160,597 9,894,037
- - - - - - - - - -
At December 31, 2012 (revised) 8,043,222 797,979 - - - - 337,411 - (565,549) 8,613,063
Comprehensive income for the period: - - - - - - - - - -
Profit for the period - - - - - - - - 209,912 209,912
Foreign currency translation adjustment - - - - - - (6,821) - - (6,821)
- - - - - - (6,821) - 209,912 203,091
- - - - - - - - - -
Equity valuation adjustments - - - - - - - - - -
Realization of additional property, plant and equipment price-level - - - - - - (6,809) - 6,809 -
Realization of deemed cost of jointly-controlled subsidiary, net of taxes
restatement, net of taxes - - - - - - (242) - 242 -
- - - - - - (7,051) - 7,051 -
- - - - - - - - - -
Contributions and distributions to shareholders: - - - - - - - - - -
Loss on interest in subsidiary - - - - - - (1,980) - - (1,980)
- - - - - - (1,980) - - (1,980)
- - - - - - - - - -
At March 31, 2013 8,043,222 797,979 - - - - 321,559 - (348,586) 8,814,174
Revenue reserves

Braskem S.A.
Statement of changes in equity All amounts in thousands of reais
6
The Management notes are an integral part of the financial statements
Consolidated
Retained Total
Unrealized Additional Other earnings Braskem Total
Capital Legal Tax profit dividends comprehensive Treasury (accumulated shareholders' Non-controlling shareholders'
Capital reserve reserve incentives reserve proposed income shares deficit) interest interest equity
At December 31, 2011 8,043,222 845,998 87,710 4,547 16,457 482,593 315,586 (60,217) - 9,735,896 215,322 9,951,218
- - - - - - - - - - - -
Comprehensive income for the period: - - - - - - - - - - - -
Profit (loss) for the period - - - - - - - - 153,558 153,558 (1,361) 152,197
Fair value of cash flow derivative, net of taxes - - - - - - 10,304 - - 10,304 - 10,304
Foreign currency translation adjustment - - - - - - (55,631) - - (55,631) 6,187 (49,444)
- - - - - - (45,327) - 153,558 108,231 4,826 113,057
- - - - - - - - - - - -
Equity valuation adjustments - - - - - - - - - - - -
Deemed cost of jointly-controlled subsidiary, net - - - - - - (230) - 230 - - -
Realization of deemed cost of jointly-controlled subsidiary, net of taxes - - - - - - (6,809) - 6,809 - - -
- - - - - - (7,039) - 7,039 - - -
- - - - - - - - - - - -
Contributions and distributions to shareholders: - - - - - - - - - - - -
Capital increase from non-controlling interest - - - - - - - - - - 21,142 21,142
Gain (loss) on interest in subsidiary - - - - - - 1,018 - - 1,018 (1,018) -
- - - - - - 1,018 - - 1,018 20,124 21,142
At March 31, 2012 8,043,222 845,998 87,710 4,547 16,457 482,593 264,238 (60,217) 160,597 9,845,145 240,272 10,085,417
At December 31, 2012 (revised) 8,043,222 797,979 - - - - 337,411 (48,892) (565,549) 8,564,171 87,813 8,651,984
- - - - - - - - - - - -
Comprehensive income for the period: - - - - - - - - - - - -
Profit for the period - - - - - - - - 209,912 209,912 16,891 226,803
Foreign currency translation adjustment - - - - - - (6,821) - - (6,821) 3,644 (3,177)
- - - - - - (6,821) - 209,912 203,091 20,535 223,626
- - - - - - - - - - - -
Equity valuation adjustments - - - - - - - - - - - -
Realization of additional property, plant and equipment price-level - - - - - - (6,809) - 6,809 - - -
Realization of deemed cost of jointly-controlled subsidiary, net of taxes
restatement, net of taxes - - - - - - (242) - 242 - - -
- - - - - - (7,051) - 7,051 - - -
- - - - - - - - - - - -
Contributions and distributions to shareholders: - - - - - - - - - - - -
Loss on interest in subsidiary - - - - - - (1,980) - - (1,980) - (1,980)
- - - - - - (1,980) - - (1,980) - (1,980)
At March 31, 2013 8,043,222 797,979 - - - - 321,559 (48,892) (348,586) 8,765,282 108,348 8,873,630
Attributed to shareholders' interest
Revenue reserves

Braskem S.A.
Statement of cash flows
at March 31, 2013 All amounts in thousands of reais
7
The Management notes are an integral part of the financial statements
Mar/2013 Mar/2012 Mar/2013 Mar/2012
Profit before income tax and social contribution
and after of discountinued operations results 247,517 164,846 331,171 210,668 - - - -
Adjustments for reconciliation of loss - - - -
Depreciation, amortization and depletion 300,991 270,906 483,446 444,443
Results from equity investments (156,088) (137,230) 4,722 2,099
Interest and monetary and exchange variations, net 125,314 (7,255) 25,836 41,220
Other (1) 17,124 1,546 19,674 - - - -
517,733 308,391 846,721 718,104
- - - -
Changes in operating working capital - - - -
Held-for-trading financial investments (656) (116,085) (58,272) (117,125)
Trade accounts receivable (409,823) (245,491) (119,761) (578,257)
Inventories (257,572) (291,146) (526,189) (288,674)
Taxes recoverable (23,847) (94,792) (149,086) (127,873)
Prepaid expenses 5,805 9,280 37,768 11,537
Other receivables (47,473) (148,308) (78,302) (243,069)
Trade payables 61,112 1,038,261 (195,916) 2,096,892
Taxes payable (25,016) 93,651 (52,697) (8,407)
Long-term incentives 162 - 162 -
Advances from customers (117,547) 16,135 223,562 17,234
Sundry provisions 886 8,799 (15,168) (4,560)
Other payables 16,341 90,866 256,646 109,408 - - - -
Cash from operations (279,895) 669,561 169,468 1,585,210
- - - -
Interest paid (105,189) (114,935) (200,543) (139,914)
Income tax and social contribution paid (8,428) (6,124) (8,440) (8,222) - - - -
Net cash generated by (used in) operating activities (393,512) 548,502 (39,515) 1,437,074
- - - -
Proceeds from the sale of fixed assets - - 608 498
Proceeds from the sale of investments 163,000 - 163,000 -
Cash effect from incorporated subsidiary - 394 - -
Acquisitions of investments in subsidiaries and associates (31) (35,204) (31) -
Acquisitions to property, plant and equipment (227,814) (554,230) (1,101,042) (832,884)
Acquisitions of intangible assets (524) (68) (524) (115)
Held-for-trading and available for sale financial investments 5,831 1,814 15,086 (1,124) - - - -
Net cash used in investing activities (59,538) (587,294) (922,903) (833,625)
- - - -
Short-term and long-term debt - - - -
Obtained borrowings 2,401,860 434,998 2,958,599 1,175,038
Payment of borrowings (2,224,626) (1,347,859) (2,285,304) (1,477,926)
Related parties - - - -
Obtained loans 377,467 1,081,388 - -
Payment of loans (17,762) (135,967) - -
Net current transactions 165,260 277,875 - -
Dividends paid (21) (2) (21) (2)
Non-controlling interests in subsidiaries - - (2,660) 21,142 - - - -
Net cash provided by (used in) financing activities 702,178 310,433 670,614 (281,748) - - - -
Exchange variation on cash of foreign subsidiaries - - 6,383 (5,401) - - - -
Increase (decrease) in cash and cash equivalents 249,128 271,641 (285,421) 316,300
- - - -
Represented by - - - -
Cash and cash equivalents at the beginning for the period 1,627,928 2,224,335 3,287,622 2,986,819
Cash and cash equivalents at the end for the period 1,877,056 2,495,976 3,002,201 3,303,119 - - - -
Increase (decrease) in cash and cash equivalents 249,128 271,641 (285,421) 316,300
Parent Company Consolidated

Braskem S.A.
Statement of value added
At March 31, 2013 All amounts in thousands of reais
8
The Management notes are an integral part of the financial statements
Continued and discontinued operations Note Mar/2012 Mar/2013 Mar/2012 Mar/2013
Revised
Revenue - 6,581,346 0 5,514,450 0 10,884,033 0 9,924,607
Sale of goods, products and services, including discontinued operations 3(c) 6,606,575 5,556,391 10,926,490 9,739,175
Other income (expenses), net - (19,401) (32,134) (26,910) 199,278
Allowance for doubtful accounts - (5,828) (9,807) (15,547) (13,846)
Inputs acquired from third parties - (5,740,966) (4,146,170) (9,404,160) (7,872,061)
Cost of products, goods and services sold - (5,535,699) (3,957,658) (9,077,888) (7,566,147)
Material, energy, outsourced services and others - (205,117) (188,199) (326,079) (300,363)
Impairment of assets - (150) (313) (193) (5,551)
Gross value added - 840,380 1,368,280 1,479,873 2,052,546
- - - - -
Depreciation, amortization and depletion 3(c) (300,991) (270,906) (483,446) (444,443)
- - - - -
Net value added produced by the entity - 539,389 1,097,374 996,427 1,608,103
- - - - -
Value added received in transfer - 201,488 150,209 118,228 87,803
Results from equity investments 3(c) 156,088 137,230 (4,722) (2,099)
Financial income 3(c) 45,314 12,930 122,864 89,836
Other - 86 49 86 66
- - - - -
Total value added to distribute - 740,877 1,247,583 1,114,655 1,695,906
- - - - -
- - - - -
Personnel - 123,031 115,035 196,325 200,163
Direct compensation - 95,954 79,126 152,937 146,776
Benefits - 17,176 26,538 30,679 40,738
FGTS (Government Severance Pay Fund) - 9,901 9,371 12,709 12,649
- - - - -
Taxes, fees and contributions - 223,573 882,455 421,591 1,117,374
Federal - 64,908 610,796 225,853 817,860
State - 155,637 268,553 188,486 290,205
Municipal - 3,028 3,106 7,252 9,309
- - - - -
Remuneration on third parties' capital - 184,361 96,535 269,936 226,172
Financial expenses (including exchange variation) - 149,488 62,597 227,110 186,389
Rentals - 34,873 33,938 42,826 39,783
- - - - -
Remuneration on own capital - 209,912 153,558 226,803 152,197
Profit for the period 3(c) 209,912 153,558 209,912 143,458
Non-controlling interests in profit (loss) for the period - - - 16,891 (1,361)
Profit from discontinued operations - - 10,100
- - -
Value added distributed - 740,877 1,247,583 1,114,655 1,695,906
Parent Company Consolidated

Braskem S.A.
Notes to the financial statements
at March 31, 2013 All amounts in thousands of reais unless otherwise stated
9
1. Operations
Braskem S.A. (hereinafter “Parent Company”) is a public corporation headquartered in Camaçari, Bahia, which
jointly with its subsidiaries (hereinafter “Braskem” or “Company”), operates 36 industrial units, 29 in Brazil, 5
in the United States and 2 in Germany.
Braskem S.A. is controlled by Odebrecht S.A. (“Odebrecht”), which indirectly holds interests of 50.11% and
38.11% in its voting and total capital, respectively.
(a) Material operating events
(a.1) On August 17, 2012, the Company inaugurated, in Marechal Deodoro, Alagoas, a new plant with annual
production capacity of 200 kton (unaudited) of polyvinyl chloride (“PVC”). With the plant’s opening,
Braskem’s annual PVC production capacity increased to 710 kton (unaudited).
(a.2) On September 13, 2012, the Company inaugurated, in the Triunfo Petrochemical Complex in the state of Rio
Grande do Sul, a new plant with annual production capacity of 103 kton (unaudited) of butadiene. The new
plant is already operating at full production capacity.
(a.3) In the last quarter of 2012, the Management decided to divest the ownership interest held in Cetrel and Braskem
Distribuidora. The Parent Company held 54.2% of the total and voting capital of Cetrel and 100% of the capital
of Braskem Distribuidora, which were sold on December 28, 2012 for R$208,100 and R$444,000, respectively.
(b) Net working capital
On March 31, 2013, net working capital at the Parent Company and Consolidated were negative R$1,119,853
and R$337,479, respectively. The consolidated figures are used in the management of working capital, since the
Company uses mechanisms to transfer funds between the companies efficiently without jeopardizing the
fulfillment of the commitments of each of the entities forming the consolidated statements. For this reason, any
analysis of the Parent Company’s working capital will not reflect the actual liquidity position of the
consolidated group. Although the consolidated net working capital is negative, the Company does not have any
issue regarding liquidity, since this condition is only temporary, for the following reason. Braskem S.A. and the
Idesa Group are temporarily financing the installation of the Ethylene XXI Project in Mexico of the subsidiary
Braskem Idesa. The funds required are loaned by the shareholders proportionally to their interest in the capital
of Braskem Idesa. As of March 31, 2013, a total of R$1,689 million had been loaned, of which R$1,265 million
by Braskem and R$424 million by the Idesa Group. These loans will be repaid upon the release of funds under
the Project Finance structure. The contracts related to such loans were executed in December 2012 and the first
disbursement is expected to take place in the coming months. The amount owed to the Idesa Group is recorded
in “other accounts payable” under current liabilities in the consolidated financial statements (Note 22).
Additionally, Braskem has three revolving credit lines in the amounts of: (i) US$350 million that may be used
without restrictions for a period of four years as from November 2012; and (ii) US$250 million that may be
used without restrictions for a period of five years as from August 2011; and (iii) R$450 million for a period of
three years as from December 2012. These credit facilities enable Braskem to reduce the amount of cash it
holds. Up to March 31, 2013, Braskem had not drawn credit from these lines.

Braskem S.A.
Notes to the financial statements
at March 31, 2013 All amounts in thousands of reais unless otherwise stated
10
(c) Effect of foreign exchange variation
The Company has balances and transactions in U.S. dollar, as well as financial investments, trade accounts
receivable, trade payables, borrowings and sales. The balances of assets and liabilities are translated based on
the exchange rate at the end of each period, while transactions are based on the effective exchange rate on the
date each operation occurs. These rates are informed by the Central Bank of Brazil.
The following table shows the U.S. dollar average and end-of-period exchange rates for the periods in this
report:
U.S. dollar, end of period
March 2013 R$ 2.0138
December 2012 R$ 2.0435
Appreciation of the Brazilian real in relation to the U.S. dollar 1.45%
Average U.S. dollar rate
Three-month period ended March 31, 2013 R$ 1.9957
Three-month period ended March 31, 2012 R$ 1.7701
Appreciation of the U.S. dollar in relation to the Brazilian real 12.02%
2. Summary of significant accounting policies
2.1. Basis of preparation
This Quarterly Information should be read together with the financial statements of Braskem S.A. as of
December 31, 2012 and for the year then ended, which were prepared and presented in accordance with
accounting practices adopted in Brazil, including the pronouncements issued by the Brazilian Accounting
Pronouncements Committee (CPC), and in accordance with the International Financial Reporting Standards
(IFRS) issued by the International Accounting Standards Board (IASB).
The preparation of the quarterly information requires the use of certain critical accounting estimates. It also
requires the Management of the Company to exercise its judgment in the process of applying its accounting
policies. There were no changes in the assumptions and judgments made by the Company’s management in the
use of estimates for the preparation of the Quarterly Information in relation to those used in the December 31,
2012 financial statements.
The statement of operations and segment information (Note 31) for the first quarter of 2012 were restated to
reflect the divestments of Cetrel S.A. (“Cetrel”) and of Distribuidora de Água Camaçari S.A. (“Braskem
Distribuidora”), as well as the decision to divest IQ Soluções & Química S.A. (“Quantiq”) and IQAG Armazéns
Gerais Ltda. (“IQAG”) (Note 3). The balance sheet and the statement of changes in equity of December 31,
2012 have been revised in order to reflect the retrospective effects of the adoption of new standards
CPC 33 (R1) (IAS 19), as described in Note 21.
(a) Consolidated quarterly information
The consolidated Quarterly Information was prepared and is being presented in accordance with the
pronouncements CPC 21 (R1) and IAS 34 - Interim Financial Reporting, which establish the minimum content
for interim financial statements.

Braskem S.A.
Notes to the financial statements
at March 31, 2013 All amounts in thousands of reais unless otherwise stated
11
(b) Parent company quarterly information
The parent company Quarterly Information was prepared and is being presented in accordance with
pronouncement CPC 21.
2.2. Accounting policies
There were no changes in the accounting practices used in the preparation of the Quarterly Information in
relation to those presented in the December 31, 2012 financial statements, except for the method for recognizing
the cost components of defined benefit plans (Note 2.2.1). The accounting practice adopted complies with
IAS 19 and CPC 33 (R1).
2.2.1 Defined benefit plans
The defined benefit plans are financed by contributions to pension funds and the use of actuarial assumptions is
necessary to measure the liability and the expenses of the plans, as well as the existence of actuarial gains and
losses.
The liability recognized in respect of these plans is the present value of the defined benefit obligation at the
balance sheet date, less the fair value of plan assets, adjusted by actuarial gains or losses and past-service costs.
The cost components of defined-benefit plans are recognized as follows:
(i) actuarial gains and losses from the actuarial remeasurement are recognized under “other comprehensive
income”.
(ii) immediate recognition of the costs of past services in the profit or loss as they are incurred; and
(iii) the net amount of interest on the assets and liabilities of the plan are recorded in the financial results of
the period.
Until 2013, it was possible not to recognize item (i) above if the amount was lower than 10% (a) of the amount
of the current defined benefit obligation; and (b) of the fair value of any plan assets. As of 2013, the amount
must be recognized at the moment it is determined. The effects of this change in accounting standard are
described in Note 21.
2.3. Consolidated quarterly information
The consolidated quarterly information includes the quarterly information of the Parent Company and
companies in which it, directly or indirectly, maintains a controlling equity interest or controls the activities, as
presented below:

Braskem S.A.
Notes to the financial statements
at March 31, 2013 All amounts in thousands of reais unless otherwise stated
12
(i) Company incorporated in August 2012.
(ii) The Company increased its interest in this investments in November 2012.
(iii) Company incorporated in June 2012.
(iv) Divestments in December 2012.
(v) The Company decided to withdraw its interest in this investment in November 2012.
(vi) Unconsolidated investments as from 2012.
2.4. Non-controlling interest in the equity and results of operations
of the Company’s subsidiaries
Headquarters
(Country) Mar/2013 Dec/2012 Mar/2012
Braskem America, Inc. (“Braskem America”) - EUA 100.00 100.00 100.00
Braskem America Finance Company ("Braskem America Finance") - EUA 100.00 100.00 100.00
Braskem Argentina S.A. (“Braskem Argentina”) - Argentina 100.00 100.00 100.00
Braskem Austria Finance GmbH ("Braskem Austria Finance") (i) Austria 100.00 100.00 -
Braskem Chile Ltda. (“Braskem Chile”) - Chile 100.00 100.00 100.00
Braskem Europe GmbH ("Braskem Alemanha") - Alemanha 100.00 100.00 100.00
Braskem Finance Limited (“Braskem Finance”) - Ilhas Cayman 100.00 100.00 100.00
Braskem Idesa S.A.P.I (“Braskem Idesa") (ii) México 75.00 75.00 65.00
Braskem Idesa Servicios S.A. de CV ("Braskem Idesa Serviços") (ii) México 75.00 75.00 65.00
Braskem Importação e Exportação Ltda. (“Braskem Importação”) - Brasil 100.00 100.00 100.00
Braskem Incorporated Limited (“Braskem Inc”) - Ilhas Cayman 100.00 100.00 100.00
Braskem International GmbH ("Braskem Austria") - Austria 100.00 100.00 100.00
Braskem Netherlands B.V (“Braskem Holanda”) - Holanda 100.00 100.00 100.00
Braskem México, S de RL de CV (“Braskem México”) - México 100.00 100.00 100.00
Braskem Participações S.A. (“Braskem Participações”) - Brasil 100.00 100.00 100.00
Braskem Petroquímica Ltda. (“Braskem Petroquímica”) - Brasil 100.00 100.00 100.00
Braskem Petroquímica Chile Ltda. (“Petroquímica Chile”) - Chile 100.00 100.00 100.00
Braskem Petroquímica Ibérica, S.L. ("Braskem Espanha") (iii) Espanha 100.00 100.00 -
Braskem Qpar S.A. (“Braskem Qpar”) - Brasil 100.00 100.00 100.00
Cetrel S.A. ("Cetrel") (iv) Brasil - - 100.00
Common Industries Ltd. (“Common”) - Ilhas Virgens Britânicas 100.00 100.00 100.00
Distribuidora de Água Camaçari S.A. ("Braskem Distribuidora") (iv) Brasil - - 100.00
IQ Soluções & Química S.A.(“Quantiq”) (v) Brasil - - 100.00
IQAG Armazéns Gerais Ltda. (“IQAG”) (v) Brasil - - 100.00
Lantana Trading Co. Inc. (“Lantana”) - Bahamas 100.00 100.00 100.00
Norfolk Trading S.A. (“Norfolk”) - Uruguai 100.00 100.00 100.00
Politeno Empreendimentos Ltda. (“Politeno Empreendimentos”) - Brasil 100.00 100.00 100.00
Rio Polímeros S.A. (“Riopol”) - Brasil 100.00 100.00 100.00
- - - -
- - - -
Fundo de Investimento Multimercado Crédito Privado Sol (“FIM Sol”) - Brasil 100.00 100.00 100.00
- - - -
- - - -
Refinaria de Petróleo Riograndense S.A. (“RPR”) (vi) Brasil - - 33.20
Polipropileno Del Sur S.A.(“Propilsur”) (vi) Venezuela - - 49.00
Jointly-controlled subsidiaries
Direct and Indirect subsidiaries
Total interest - %
Specific Purpose Entity ("SPE")
Mar/2013 Dec/2012 Mar/2013 Mar/2012
Braskem Idesa 108,348 87,813 16,891 (4,464)
Cetrel - - - 3,103
Total 108,348 87,813 16,891 (1,361)
Equity Profit (loss) for the period
Braskem S.A.
Notes to the financial statements
at March 31, 2013 All amounts in thousands of reais unless otherwise stated
13
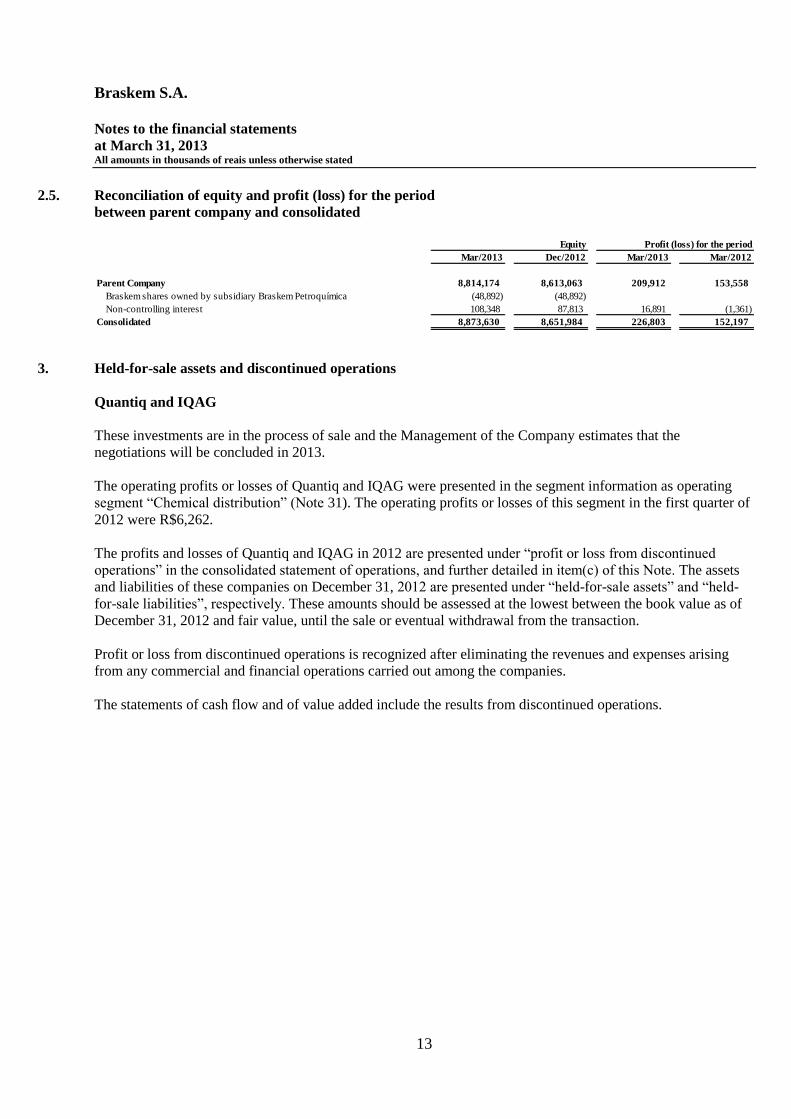
2.5. Reconciliation of equity and profit (loss) for the period
between parent company and consolidated
3. Held-for-sale assets and discontinued operations
Quantiq and IQAG
These investments are in the process of sale and the Management of the Company estimates that the
negotiations will be concluded in 2013.
The operating profits or losses of Quantiq and IQAG were presented in the segment information as operating
segment “Chemical distribution” (Note 31). The operating profits or losses of this segment in the first quarter of
2012 were R$6,262.
The profits and losses of Quantiq and IQAG in 2012 are presented under “profit or loss from discontinued
operations” in the consolidated statement of operations, and further detailed in item(c) of this Note. The assets
and liabilities of these companies on December 31, 2012 are presented under “held-for-sale assets” and “held-
for-sale liabilities”, respectively. These amounts should be assessed at the lowest between the book value as of
December 31, 2012 and fair value, until the sale or eventual withdrawal from the transaction.
Profit or loss from discontinued operations is recognized after eliminating the revenues and expenses arising
from any commercial and financial operations carried out among the companies.
The statements of cash flow and of value added include the results from discontinued operations.
Mar/2013 Dec/2012 Mar/2013 Mar/2012
Parent Company 8,814,174 8,613,063 209,912 153,558
Braskem shares owned by subsidiary Braskem Petroquímica (48,892) (48,892) - -
Non-controlling interest 108,348 87,813 16,891 (1,361)
Consolidated 8,873,630 8,651,984 226,803 152,197
Equity Profit (loss) for the period

Braskem S.A.
Notes to the financial statements
at March 31, 2013 All amounts in thousands of reais unless otherwise stated
14
(a) Gains or losses from discontinued operations
Consolidated statement of operations for Cetrel, Braskem Distribuidora, Quantiq and IQAG.
Mar/2012
Net sales revenue 160,756
Cost of products sold (117,543)
Gross profit 43,213
Selling, General and administrative expenses (31,541)
Other operating income, net 794
Operating profit 12,466
Financial results 2,967
Profit before income tax and social contribution 15,433
Current and deffered income tax and social contribution (5,333)
Discountinued operations results 10,100
Earnings per share attributable to the shareholders of the Company
of continued operations at the end of the year (R$) (i)
Basic earnings per share - preferred 0.0292
Diluted earnings per share - preferred 0.0292
(i) Reduction in earnings per share of the Company

Braskem S.A.
Notes to the financial statements
at March 31, 2013 All amounts in thousands of reais unless otherwise stated
15
(b) Cash flow information from discontinued operations
Consolidated cash flow information for Cetrel, Braskem Distribuidora, Quantiq and IQAG.
Mar/2012
Profit before income tax and social contribution 15,433 -
Adjustments for reconciliation of profit -
Depreciation, amortization and depletion 4,548
Interest and monetary and exchange variations, net 897
Other adjustments 71 -
20,949 -
Changes in operating working capital (16,409) - -
Net cash generated by operating activities 4,540 -
Acquisitions to property, plant and equipment (3,185)
Acquisitions of intangible assets (47) -
Net cash used in investing activities (3,232)
-
Short-term and long-term debt -
Payment of borrowings (2,695) - -
Net cash used in financing activities (2,695) -
Decrease in cash and cash equivalents (1,387)
-
Represented by -
Cash and cash equivalents at the beginning of the year 148,909
Cash and cash equivalents at the end of the year 147,522 -
Decrease in cash and cash equivalents (1,387)

Braskem S.A.
Notes to the financial statements
at March 31, 2013 All amounts in thousands of reais unless otherwise stated
16
(c) Statement of value added for discontinued operations
Consolidated statement of operations for Cetrel, Braskem Distribuidora, Quantiq and IQAG
Discontinued operations Mar/2012
Revenue 207,618
Sale of goods, products and services, including discontinued operations 206,845
Other income (expenses), net 773
-
Inputs acquired from third parties (187,367)
Cost of products, goods and services sold (157,574)
Material, energy, outsourced services and others (29,793)
-
Gross value added 20,251
-
Depreciation, amortization and depletion (4,549)
-
Net value added produced by the entity 15,702
-
Value added received in transfer 4,219
Financial income 4,195
Other 24
-
Total value added to distribute 19,921
-
-
Personnel 1,169
Direct compensation 899
Benefits 208
FGTS (Government Severance Pay Fund) 62
-
Taxes, fees and contributions 7,400
Federal 5,540
Municipal 1,860
-
Remuneration on third parties' capital 1,252
Financial expenses (including exchange variation) 1,229
Rentals 23
-
Remuneration on own capital 10,100
Result from discontinued operations 10,100
-
Value added distributed 19,921

Braskem S.A.
Notes to the financial statements
at March 31, 2013 All amounts in thousands of reais unless otherwise stated
17
4. Cash and cash equivalents
This table was presented in the 2012 annual financial statements of the Company, in Note 7.
5. Financial investments
This table was presented in the 2012 annual financial statements of the Company, in Note 8.
(i) On March 31, 2013, the Parent Company held junior subordinated shares issued by funds for the
acquisition of receivables. These shares are measured by their redemption value and are held until the
conclusion of operations of said funds. The funds issue two other types of shares that enjoy priority in
compensation over the junior subordinated shares. The risk related to the operations of these funds is
limited to the value of the shares held by the Parent Company.
(ii) On March 31, 2013, Braskem Holanda had a financial investments held-to-maturity that was irrevocably
offset by an export prepayment agreement of the Parent Company, in the amount of US$150 million, as
provided for in the credit assignment agreement entered into between these two companies and Banco
Bradesco (Note 16). This accounting offset was carried out in accordance with CPC 39 and IAS 32, which
provides for the possibility of offsetting financial instruments when there is intent and rightfully executable
right to realize an asset and settle a liability simultaneously.
Mar/2013 Dec/2012
Cash and banks 308,756 398,142
Cash equivalents:
Domestic market 1,682,133 1,293,164
Foreign market 1,011,312 1,596,316
Total 3,002,201 3,287,622
Consolidated
Mar/2013 Dec/2012
Held-for-trading
Investments in FIM Sol 45,741 0 50,803
Investments in foreign currency 4,486 0 5,256
Shares 1,679 0 3,023
Loans and receivables - 0 -
Investments in FIM Sol 97,809 77,469
Investments in local currency - 513
Held-to-maturity 0 0 0
31,701 0 52,559
Restricted deposits 3,919 0 1,281
Time deposit investment 65,078 0 15,731
Investments in foreign currency 304,138 0 307,639
Compensation of investments in foreign currency (ii) (304,138) 0 (307,639)
Total 250,413 206,635
0 0 0
In current assets 221,799 0 172,146
In non-current assets 28,614 0 34,489
Total 250,413 206,635
Consolidated
Quotas of investment funds in credit rights (i)

Braskem S.A.
Notes to the financial statements
at March 31, 2013 All amounts in thousands of reais unless otherwise stated
18
6. Trade accounts receivable
This table was presented in the 2012 annual financial statements of the Company, in Note 9.
The Company realizes part of its trade accounts receivable through the sale of trade notes to funds for the
acquisition of receivables. These operations are not entitled to recourse, for which reason the trade notes are
written-off at the moment of the operation.
7. Inventories
This table was presented in the 2012 annual financial statements of the Company, in Note 10.
Mar/2013 Dec/2012 Mar/2013 Dec/2012
Consumers
Domestic market 1,022,310 790,518 1,267,090 1,038,673
Foreign market 1,459,739 1,283,605 1,488,272 1,582,433
Allowance for doubtful accounts (209,750) (203,922) (271,987) (256,884)
Total 2,272,299 1,870,201 2,483,375 2,364,222
In current assets 2,241,059 1,834,491 2,449,316 2,326,480
In non-current assets 31,240 35,710 34,059 37,742
Total 2,272,299 1,870,201 2,483,375 2,364,222
Parent company Consolidated
Mar/2013 Dec/2012 Mar/2013 Dec/2012
Finished goods 1,685,026 1,417,380 3,128,012 2,622,736
Raw materials, production inputs and packaging 904,616 908,298 1,159,321 1,175,451
Maintenance materials 115,278 113,118 216,269 211,517
Advances to suppliers 18,197 10,969 82,515 61,385
Imports in transit and other 40,533 28,785 46,573 30,966
Total 2,763,650 2,478,550 4,632,690 4,102,055
Parent company Consolidated

Braskem S.A.
Notes to the financial statements
at March 31, 2013 All amounts in thousands of reais unless otherwise stated
19
8. Related parties
The information concerning related parties was presented in the 2012 annual financial statements of the
Company, in Note 11.
(a) Parent company
(i) Amounts under “dividends and interest on capital receivable”
(ii) Amounts under “other accounts receivable”
(iii) Amounts under “cash and cash equivalents”: R$1,350,144 and under “financial investments”: R$143,550
Balances at March 31, 2013
Assets
Current
Trade accounts
receivable Other Total Total
Receivable
notes
Other
receivable
Current
accounts
Loan
agreements Other receivable
Subsidiaries
Braskem America 10,627 4,340 # - - - 14,967 # - # - # - # -
Braskem Argentina 94,786 - # - - - 94,786 # - # - # - # -
Braskem Chile 5,234 - # - - - 5,234 # - # - # - # -
Braskem Holanda 4,663 168 # - - - 4,831 # - # - # - # -
Braskem Idesa 9,691 2,742 # - - - 12,433 # - # - # - # -
Braskem Inc 910,417 - # - - - 910,417 # - # 7,561 # - # 7,561
Braskem Participações - 96 # - - - 96 # 1,621 # - # - # 1,621
Braskem Petroquímica 56,133 - # - 34,000 (i) 90,133 # 21,087 # - # - # 21,087
Braskem Qpar 789 - # - - - 789 # 942,246 # - # - # 942,246
Lantana - - # - - - - # - # 56 # - # 56
Quantiq 1,260 - # - - - 1,260 # - # - # - # -
Riopol 9,049 - # - 93,500 (i) 102,549 # - # - # - # -
1,102,649 7,346 - 127,500 1,237,495 964,954 7,617 - 972,571
Jointly-controlled subsidiaries
RPR 4,251 - # - 2,645 (i) 6,896 # - # - # - # -
4,251 - - 2,645 6,896 - - - -
Associated companies
Borealis Brasil S.A. ("Borealis") 1,838 187 # - - - 2,025 # - # - # - # -
Sansuy Administração, Participação,
Representação e Serviços Ltda ("Sansuy") 15,228 - # - - - 15,228 # - # - # - # -
17,066 187 - - 17,253 - - -
Related companies
Alclor Quimicas de Alagoas Ltda ("Alclor") 89 - # - - - 89 # - # - # - # -
Odebrecht Ambiental - - # - 489,100 (ii) 489,100 # - # - # - # -
Petrobras Brasileiro S.A. ("Petrobras") 14,762 - # 10,254 - - 25,016 # - # 63,910 # 13,014 # 76,924
14,851 - 10,254 489,100 514,205 - 63,910 13,014 76,924
EPE
FIM Sol - - # 1,493,694 (iii) 1,493,694 # - # - # - # -
- - - 1,493,694 1,493,694 - - - -
Total 1,138,817 7,533 10,254 2,112,939 3,269,543 964,954 71,527 13,014 1,049,495
Non-current
Related Parties Related Parties

Braskem S.A.
Notes to the financial statements
at March 31, 2013 All amounts in thousands of reais unless otherwise stated
20
Balances at March 31, 2013
Liabilities
Current Non-Current
Trade payables
Advances from
customers Borrowings Total Borrowings Total
- - Advance to export Payable notes Advance to export
Current
accounts Payable notes
- - - -
Subsidiaries -
Braskem America 77 # - # - # 179,255 # 243 # 179,575 # - # 402,760 # - # - # 402,760
Braskem Austria - # - # - # 78,673 # - # 78,673 # - # 306,098 # - # - # 306,098
Braskem Holanda - # 111,411 # - # 55,935 # - # 167,346 # - # 2,484,678 # - # - # 2,484,678
Braskem Importação - # - # - # - # - # - # - # - # 111 # - # 111
Braskem Inc 3,342,735 # - # 471,545 # - # 789 # 3,815,069 # 3,198,392 # - # - # 84,929 # 3,283,321
Braskem Petroquímica 203 # - # - # - # - # 203 # - # - # - # - # -
IQAG - # - # - # - # - # - # - # - # 2,002 # - # 2,002
Politeno Empreendimentos - # - # - # - # - # - # - # - # 15 # - # 15
Quantiq - # - # - # - # 1,955 # 1,955 # - # - # 67,121 # - # 67,121
Riopol 183 # - # - # - # - # 183 # - # - # 889,982 # - # 889,982
3,343,198 111,411 471,545 313,863 2,987 4,243,004 3,198,392 3,193,536 959,231 84,929 7,436,088
Jointly-controlled subsidiaries
RPR 135 # - - # - # - # 135 - - - - # -
135 - - - - 135 - - - - -
Related companies
Construtora Norberto Odebrecht
("CNO") 4,081 # - - # - # - # 4,081 - - - - # -
Petrobras 1,365,527 # - - # - # - # 1,365,527 - - - - # -
1,369,608 - - - - 1,369,608 - - - - -
Total 4,712,941 111,411 471,545 313,863 2,987 5,612,747 3,198,392 3,193,536 959,231 84,929 7,436,088
Accounts payable to related parties Accounts payable to related parties

Braskem S.A.
Notes to the financial statements
at March 31, 2013 All amounts in thousands of reais unless otherwise stated
21
Purchases of Cost of
raw materials, Financial production/general
Sales services and income and administrative
of products utilities (expenses) expenses
Subsidiaries
Braskem America 3,079 # - # (2,150) # -
Braskem Argentina 53,230 # - # (1,425) # -
Braskem Austria - # - # (7,304) # -
Braskem Chile 5,461 # - # 57 # -
Braskem Finance - # - # 1 # -
Braskem Holanda 73,566 # - # (396) # -
Braskem Idesa 4,959 # - # (296) # -
Braskem Importação - # - # (1) # -
Braskem Inc 448,745 # 67,133 # (14,601) # -
Braskem Petroquímica 130,967 # 59,358 # - # -
Braskem Qpar 2,956 # 23,240 # - # -
Lantana - # - # (1) # -
Quantiq 28,165 # 1,035 # - # -
Riopol 40,861 # 28,004 # - # -
791,989 178,770 (26,116) -
- # - # - # -
Jointly-controlled subsidiaries - # - # - # -
RPR 6,771 # 135 # - # -
6,771 135 - -
- # - # - # -
Associated companies - # - # - # -
Borealis 46,431 # - # - # -
Sansuy 7,874 # 2,018 # - # -
54,305 2,018 - -
- # - # - # -
Related companies - # - # - # -
CNO - # 58,671 # - # -
OCS - Corretora de Seguros ("OCS") - # 1,602 # - # -
Odebrecht Serviços e Participações S.A. ("OSP") - # 64,994 # - # -
Petrobras 174,573 # 3,058,402 # 1,088 # -
174,573 3,183,669 1,088 -
- - - -
Post-employment benefit plan
Odebrecht Previdência Privada ("Odeprev") - - - 3,444
- - - 3,444
Total 1,027,638 # 3,364,592 # (25,028) # 3,444
Income statement transactions from January to March 31, 2013

Braskem S.A.
Notes to the financial statements
at March 31, 2013 All amounts in thousands of reais unless otherwise stated
22
(i) Amounts under “dividends and interest on capital receivable”
(ii) Amounts under “other accounts receivable”
(iii) Amounts under “cash and cash equivalents”: R$954,919 and under “financial investments”: R$128,271
Balances at December 31, 2012
Assets
Current
Trade accounts
receivable Other Total Total
Receivable
notes
Other
receivable
Current
accounts
Loan
agreements
Other
receivable
Subsidiaries
Braskem America 20,295 # 4,011 # - # - - 24,306 # - # - # - # -
Braskem Argentina 95,273 # - # 20 # - - 95,293 # - # - # - # -
Braskem Chile 429 # - # - # - - 429 # - # - # - # -
Braskem Holanda 7,588 # 168 # 39 # - - 7,795 # - # - # - # -
Braskem Idesa - # 3,026 # - # - - 3,026 # - # - # - # -
Braskem Inc 478,182 # - # - # - - 478,182 # - # 7,584 # - # 7,584
Braskem Participações - # 96 # - # - - 96 # 1,611 # - # - # 1,611
Braskem Petroquímica 5,939 # - # - # 34,000 (i) 39,939 # 54,085 # - # - # 54,085
Braskem Qpar 1,138 # - # 196 # - - 1,334 # 849,437 # - # - # 849,437
Cetrel # - # - # 48 - 48 # - # - # - # -
Lantana - # - # - # - - - # - # 57 # - # 57
Quantiq - # - # - # 610 - 610 # - # - # - # -
Riopol 5,066 # - # 50 # 93,500 (i) 98,616 # - # - # - # -
613,910 0 7,301 305 0 128,158 749,674 905,133 7,641 - 912,774
Jointly-controlled subsidiaries
Propilsur - # - # - # - - - # - # - # - # -
RPR - # - # - # 2,645 (i) 2,645 # - # - # - # -
- 0 - - 0 2,645 2,645 - - - -
Associated companies
Borealis 252 # 187 # - # - - 439 # - # - # - # -
Sansuy 15,609 # - # - # - - 15,609 # - # - # - # -
15,861 0 187 - 0 - 16,048 - - - -
Related companies
Odebrecht Ambiental # # - # 652,100 (ii) 652,100 # - # - # - # -
Petrobras 85,566 # - # 6,113 # - - 91,679 # - # 62,822 # 12,993 # 75,815
85,566 0 - 6,113 0 652,100 743,779 - 62,822 12,993 75,815
EPE
FIM Sol - # - # - # 1,083,190 (iii) 1,083,190 - # - # - -
- 0 - - 0 1,083,190 1,083,190 - - - -
Total 715,337 7,488 6,418 1,866,093 2,595,336 905,133 70,463 12,993 988,589
Non-current
Related Parties Related Parties

Braskem S.A.
Notes to the financial statements
at March 31, 2013 All amounts in thousands of reais unless otherwise stated
23
(i) Amounts under “current accounts”
(ii) Amounts under “trade notes”
Balances at December 31, 2012
Liabilities
Current Non-Current
Trade payables
Advances from
customers Borrowings Other Total Borrowings Other Total
- - Advance to export Payable notes Advance to export Payable notes
- - - -
Subsidiaries - -
Braskem America - # - # - # 181,639 # 170 # - - 181,809 # - # 408,700 # - - - - 408,700
Braskem Holanda - # 80 # - # 24,382 # - # - - 24,462 # - # 2,521,323 # - - - - 2,521,323
Braskem Importação - # - # - # - # - # - - - # - # - # 113 - - - 113
Braskem Inc 2,677,575 # - # 53,406 # - # 800 # - - 2,731,781 # 3,245,562 # - # 86,181 (i) - - 3,331,743
Braskem Petroquímica 863 # - # - # - # - # - - 863 # - # - # - - - - -
Braskem Qpar 40 # - # - # - # - # - - 40 # - # - # - - - - -
IQAG - # - # - # - # - # - - - # - # - # - 1,235 - 1,235
Politeno
Empreendimentos - # - # - # - # - # - - - # - # - # 15 - - - 15
Quantiq - # - # - # - # # 1,954 - 1,954 # - # - # - 81,418 - 81,418
Riopol 954 # - # - # - # - # - - 954 # - # - # 651,422 (ii) - - 651,422
2,679,432 80 53,406 206,021 970 1,954 2,941,863 3,245,562 2,930,023 737,731 82,653 6,995,969
Related companies -
CNO 1,388 # - - # - # - # - - 1,388 - - - - - - -
Petrobras 1,193,461 # - - # - # - # - - 1,193,461 - - - - - - -
1,194,849 - - - - - # 1,194,849 - - - - - # -
Total 3,874,281 80 53,406 206,021 970 1,954 4,136,712 3,245,562 2,930,023 737,731 82,653 6,995,969
Accounts payable to related parties Accounts payable to related parties
Braskem S.A.
Notes to the financial statements
at March 31, 2013 All amounts in thousands of reais unless otherwise stated
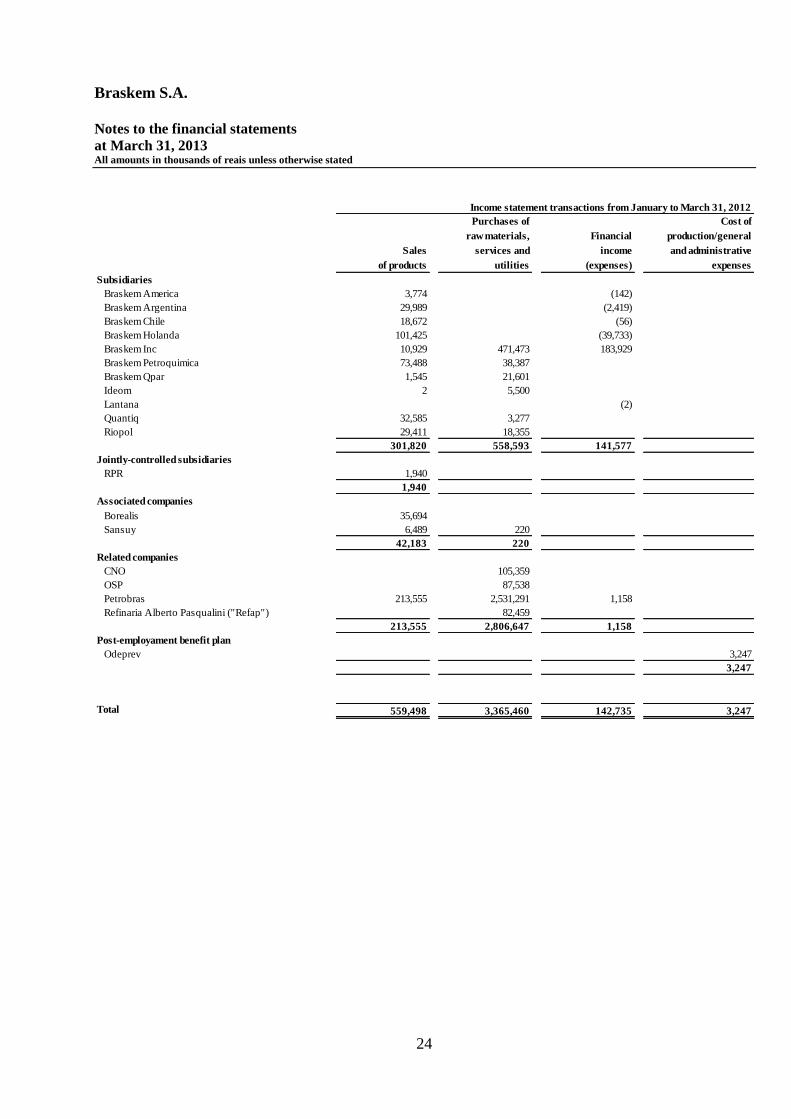
24
Purchases of Cost of
raw materials, Financial production/general
Sales services and income and administrative
of products utilities (expenses) expenses
Subsidiaries
Braskem America 3,774 # - # (142) # -
Braskem Argentina 29,989 # - # (2,419) # -
Braskem Chile 18,672 # - # (56) # -
Braskem Holanda 101,425 # - # (39,733) # -
Braskem Inc 10,929 # 471,473 # 183,929 # -
Braskem Petroquimica 73,488 # 38,387 # - # -
Braskem Qpar 1,545 # 21,601 # - # -
Ideom 2 # 5,500 # - # -
Lantana - # - # (2) # -
Quantiq 32,585 # 3,277 # - # -
Riopol 29,411 # 18,355 # - # -
301,820 558,593 141,577 # -
Jointly-controlled subsidiaries - # - # - # -
RPR 1,940 # - # - # -
1,940 - - -
Associated companies - # - # - # -
Borealis 35,694 # - # - # -
Sansuy 6,489 # 220 # - # -
42,183 220 # - # -
Related companies - # - # - # -
CNO - # 105,359 # - # -
OSP - # 87,538 # - # -
Petrobras 213,555 # 2,531,291 # 1,158 # -
Refinaria Alberto Pasqualini ("Refap") - # 82,459 # - # -
213,555 2,806,647 1,158 -
Post-employament benefit plan - - # - # -
Odeprev - # - - # 3,247
- # - # - # 3,247
- # - # - # -
- # - # - # -
Total 559,498 3,365,460 142,735 3,247
Income statement transactions from January to March 31, 2012

Braskem S.A.
Notes to the financial statements
at March 31, 2013 All amounts in thousands of reais unless otherwise stated
25
(b) Consolidated
(i) Amounts under “dividends and interest on capital receivable”
(ii) Amounts under “other accounts receivable”
Balances at March 31, 2013
Assets Liabilities
Current Current
Trade accounts
receivable Other Total Total
Trade
payables
Receivable
notes
Other
receivable
Loan
agreements
Other
receivable
Jointly-controlled subsidiary
Polimerica 4,251 # - # - # - - 4,251 # - # - # - # -
RPR - # - # - # 2,645 (i) 2,645 # - # - # - # 191
4,251 0 - - 2,645 # 6,896 - - - 191
0 0 0 0 0 0 0 0 0 0 0 0 0 0 0 0
Associated companies 0 0 0 0 0 0 0 0 0 0 0 0 0 0 0 0
Borealis 1,838 # 187 # - # - - 2,025 # - # - # - # -
Sansuy 15,228 # - # - # - - 15,228 # - # - # - # -
17,066 0 187 - - # 17,253 - - - -
0 0 0 0 0 0 0 0 0 0 0 0 0 0 0 0
Related companies - # - # - # - - - # - # - # - # -
Alclor 89 # - # - # - - 89 # - # - # - # -
CNO - # - # - # - - - # - # - # - # 4,081
Odebrecht Ambiental - # - # - # 489,100 (ii) 489,100 # - # - # - # -
Petrobras 14,762 # - # 23,023 # - - 37,785 # 63,910 # 64,826 # 128,736 # 1,710,809
14,851 0 - 23,023 489,100 # 526,974 63,910 64,826 128,736 1,714,890
0 0 0 0 0 0 0 0 0 0 0 0 0 0 0
0 0 0 0 0 0 0 0 0 0 0 0 0 0 0
Total 36,168 0 187 23,023 491,745 # 551,123 63,910 64,826 128,736 1,715,081
Non-current
Related parties Related parties
Purchases of Cost of
raw materials, Financial production/general
Sales services and income and administrative
of products utilities (expenses) expenses
Jointly-controlled subsidiary
RPR 7,428 # 11,702 # - # -
7,428 11,702 # - # -
- - # - # -
Associated companies - # - # - # -
Borealis 50,445 # - # - # -
Sansuy 7,874 # 2,018 # - # -
58,319 2,018 # - # -
- - # - # -
Related parties - # - # - # -
CNO - # 58,671 # - # -
OCS - # 1,602 # - # -
OSP - # 64,994 # - # -
Petrobras 299,884 # 4,794,408 # 329 # -
299,884 4,919,675 329 # -
- - # - # -
Post-employment benefit plan - - # - # -
Odeprev - # - - # 4,410
- # - # - # 4,410
- # - # - # -
- # - # - # -
Total 365,631 4,933,395 329 4,410
Income statement transactions from January to March 31, 2013

Braskem S.A.
Notes to the financial statements
at March 31, 2013 All amounts in thousands of reais unless otherwise stated
26
(i) Amounts under “dividends and interest on capital receivable”
(ii) Amounts under “other accounts receivable”
Balances at December 31, 2012
Assets Liabilities
Current Current
Trade accounts
receivable Other Total Total Trade payables
Receivable
notes Other receivable
Loan
agreements
Other
receivable
Jointly-controlled subsidiary
RPR 0 0 0 0 0 0 2,645 (i) 2,645 0 0 0 0 0 0 0 0
0 0 0 2,645 2,645 0 0 0 0
Associated companies
Borealis 1,017 187 0 1,204
Sansuy 15,640 0 0 15,640
16,657 187 0 0 16,844 0 0 0 0
Related companies
CNO 0 0 - 1,388
Odebrecht Ambiental 652,100 (ii) 652,100
Petrobras 95,462 0 13,725 109,187 62,822 64,805 127,627 1,505,754
95,462 0 13,725 652,100 761,287 62,822 64,805 127,627 1,507,142
Total 112,119 187 13,725 654,745 780,776 62,822 64,805 127,627 1,507,142
Non-current
Related partiesRelated parties
Purchases of Cost of
raw materials, Financial production/general
Sales services and income and administrative
of products utilities (expenses) expenses
Jointly-controlled subsidiary
RPR 2,247 # 5,013 # - # -
2,247 5,013 # - # -
Associated companies - # - # - # -
Borealis 41,539 # - # - # -
Sansuy 6,489 # 220 # - # -
48,028 220 # - # -
Related parties - # - # - # -
CNO - # 105,359 # - # -
OSP - # 87,538 # - # -
Petrobras 365,896 # 4,022,266 # 1,158 # -
Refap - # 83,084 # - # -
365,896 4,298,247 1,158 # -
Post-employment benefit plan - - # - # -
Odeprev - # - - # 4,128
- # - # - # 4,128
- # - # - # -
- # - # - # -
Total 416,171 4,303,480 1,158 4,128
Income statement transactions from January to March 31, 2012

Braskem S.A.
Notes to the financial statements
at March 31, 2013 All amounts in thousands of reais unless otherwise stated
27
(c) Key management personnel
9. Taxes recoverable
The information related to taxes recoverable was presented in the 2012 annual financial statements of the
Company, in Note 12.
(a) REINTEGRA Program
In the period ended March 31, 2013, the Company recognized credits in the amount of R$52,448 (Note 28) and
offset the amount of R$16,262.
Non-current liabilities Mar/2013 Dec/2012
Long-term incentives 2,940 2,897
Total 2,940 2,897
Income statement transactions
Mar/2013 Mar/2012 Mar/2013 Mar/2012
Remuneration
Short-term benefits to employees and managers 4,728 3,753 4,728 3,753
Post-employment benefit 68 58 68 58
Long-term incentives 42 - 42 -
Total 4,838 3,811 4,838 3,811
Parent company Consolidated
Note Mar/2013 Dec/2012 Mar/2013 Dec/2012
Parent Company and subsidiaries in Brazil
Excise tax (IPI) 31,937 31,647 32,760 32,734
471,719 447,086 925,656 845,045
ICMS - credits from PP&E 88,278 108,910 132,074 178,920
430,126 419,170 502,805 484,692
143,828 147,764 272,339 273,693
PIS and COFINS - Law 9,718/98 120,196 158,570 133,532 171,140
PIS - Decree-Law 2,445 and 2,449/88 71,033 70,856 103,711 104,256
Income tax and social contribution (IR and CSL) 336,025 323,924 465,926 452,867
REINTEGRA program (a) 237,162 194,694 253,706 217,775
Other 134,204 129,612 159,213 150,980
Foreign subsidiaries
Value-added tax (b) - - 177,060 90,301
Income tax - - 906 177
Other - - 1,183 765
Total 2,064,508 2,032,233 3,160,871 3,003,345
In current assets 1,085,840 1,005,842 1,661,217 1,476,211
In non-current assets 978,668 1,026,391 1,499,654 1,527,134
Total 2,064,508 2,032,233 3,160,871 3,003,345
Social integration program (PIS) and social contribution on
PIS and COFINS - credits from PP&E
Consolidated
Value-added tax on sales and services (ICMS) - normal operations
Parent company
revenue (COFINS) - normal operations

Braskem S.A.
Notes to the financial statements
at March 31, 2013 All amounts in thousands of reais unless otherwise stated
28
(b) Value added tax (“VAT”)
On March 31, 2013, this line included:
(i) R$34,122 from sales by Braskem Alemanha to other countries. These credits are refunded in cash by the
local government; and
(ii) R$142,938 from purchases of machinery and equipment for the Ethylene XXI Project. These credits
may be refunded, in cash, by the local government or offset with VAT due from the start of operations
of the project.
10. Insurance claims
The information related to insurance claims was presented in the 2012 annual financial statements, in Note 14.
The main change in non-current assets is due to the expenses in the amount of R$42,033 to repair the damages
caused by the power blackout in the Northeast region of Brazil in October 2012.
11. Other accounts receivable - consolidated
The information related to other accounts receivable was presented in the 2012 annual financial statements, in
Note 15.
(a) Current assets
The main change in current assets is due to the receipt of R$163,000 from the divestment, in December 2012, of
the interest previously held by the Parent Company at Braskem Distribuidora.
12. Judicial deposits
The information related to judicial deposits was presented in the 2012 annual financial statements of the
Company, in Note 13.
Mar/2013 Dec/2012
Judicial deposits
Tax contingencies 98,754 101,499
Labor and social security contingencies 73,802 73,177
Other 4,919 4,942
Total 177,475 179,618
Consolidated

Braskem S.A.
Notes to the financial statements
at March 31, 2013 All amounts in thousands of reais unless otherwise stated
29
13. Investments
The information related to investments was presented in the Company’s 2012 annual financial statements, in
Note 16.
(a) Information on investments
(a.1) Investments of the Parent Company
(i) Investment transferred to the subsidiary Braskem Alemanha in December 2012.
(ii) Company divested in December 2012.
(iii) Investment divested in December 2012.
(iv) Companies in the process of divestment.
Interest in
total capital (% )
Mar/2013 Mar/2013 Mar/2012 Mar/2013 Dec/2012
Subsidiaries
Braskem Alemanha 5.66 (113) (11,236) 931,444 961,450
Braskem America (i) - - 162,902 - -
Braskem Argentina 96.77 2,948 788 10,798 7,850
Braskem Austria 100.00 (105) - (29) 81
Braskem Chile 99.02 (2) 37 1,780 1,782
Braskem Distribuidora (ii) - - (2,469) - -
Braskem Holanda 100.00 11,060 53,741 1,170,480 1,188,368
Braskem Finance 100.00 3,374 2,507 (114,055) (117,429)
Braskem Idesa 75.00 67,563 (12,754) 433,386 351,249
Braskem Importação 0.04 1 1 204 203
Braskem Inc. 100.00 (16,438) (3,664) 285,391 301,829
Braskem Participações 100.00 457 567 (1,478) (1,945)
Braskem Petroquímica 100.00 24,123 3,019 1,618,096 1,593,973
Braskem Qpar 96.96 (33,983) (42,206) 2,502,106 2,536,089
Cetrel (iii) - - 6,469 - -
IQAG (iv) 0.12 - 260 - 3,942
Petroquímica Chile 97.96 (45) (13) 6,490 6,535
Politeno Empreendimentos 99.98 (1) (1) 606 607
Quantiq (iv) 99.90 - 3,328 - 249,383
Riopol 100.00 136,799 (19,827) 2,769,136 2,632,337
-
Jointly-controlled subsidiary -
RPR 33.20 2,455 4,099 112,770 128,591
Adjusted net profit (loss) Adjusted
for the period equity

Braskem S.A.
Notes to the financial statements
at March 31, 2013 All amounts in thousands of reais unless otherwise stated
30
(a.2) Investments of subsidiaries
(v) Company incorporated in August 2012.
(vi) Company incorporated in June 2012.
(vii) Company acquired by Braskem Participações in August 2012.
(viii) Company acquired by Braskem Participações in October 2012.
(ix) Withdrawal of the interest in this investment in November 2012
Interest in
total capital (% )
Mar/2013 Mar/2013 Dec/2012
Braskem Alemanha
Braskem America (i) 100.00 8,425 - 800,732 810,315
Braskem America -
Braskem America Finance 100.00 2 (328) 938 (4,206)
Braskem Austria - -
Braskem Austria Finance (v) 100.00 - - 47 47
Braskem Espanha (vi) 100.00 - - 8 8
Braskem Chile - -
Braskem Argentina 3.17 2,948 788 10,798 7,850
Petroquímica Chile 2.03 (45) (13) 6,490 6,535
Braskem Distribuidora - -
Braskem Importação (vii) - - 1 - -
Lantana (viii) - - (2,527) - -
Braskem Holanda -
Braskem Alemanha 94.34 (113) (11,236) 961,450 961,450
Propilsur 49.00 (556) (168) 109,695 109,695
Polimerica (ix) - - 1 - -
Braskem Idesa - -
Braskem Idesa Serviços 100.00 213 81 3,045 2,726
Braskem Importação -
Braskem México 0.03 463 587 474 -
Braskem Inc. - -
Braskem Chile 0.98 (2) 37 1,780 1,782
Lantana 3.66 10 (2,527) (534) (544)
Petroquímica Chile 0.01 (45) (13) 6,490 6,535
Braskem Participações - -
Braskem Argentina 0.06 2,948 788 7,850 7,850
Braskem Importação (vii) 99.96 1 - 204 203
Braskem México 99.97 463 587 474 -
Politeno Empreendimentos 0.02 (1) (1) 606 607
Quantiq (iv) 0.10 - 3,328 - 249,383
Lantana (viii) 96.34 10 - (534) (544)
Braskem Petroquímica - -
Braskem Qpar 3.04 (33,983) (42,206) 2,502,106 2,536,089
Cetrel (iii) - 6,469 - -
Braskem Qpar - -
Common 100.00 (90) (1,201) 7,459 7,550
Common - -
Norfolk 100.00 (401) (171) 69,668 70,069
Quantiq - -
IQAG (iv) 99.88 - 260 - 3,942
Adjusted net profit (loss) Adjusted
for the period equity
Mar/2013 Mar/2012
Interest in
total capital (% )
Mar/2013 Mar/2013 Mar/2012 Mar/2013 Dec/2012
Associates
Borealis 20.00 16,102 5,703 165,459 165,459
Companhia de Desenvolvimento
Rio Verde ("Codeverde") 35.97 (596) (199) 46,342 46,342
Sansuy 20.00 (232) (16) 1,722 1,722
Adjusted net profit (loss) Adjusted
for the period equity

Braskem S.A.
Notes to the financial statements
at March 31, 2013 All amounts in thousands of reais unless otherwise stated
31
(b) Changes in investments – parent company
Adjustment Currency
Balance at Capital Effect of profit Goodwill Interest translation Balance at
Dec/2012 increase of results in inventories amortization O ther loss adjustments Mar/2013
Subsidiaries and jointly-controlled subsidiaries
Domestic subsidiaries
Braskem Petroquímica 1,452,589 - 24,123 (129) (859) - - - 1,475,724
Braskem Qpar 3,367,628 - (32,949) 2,107 (20,222) - - - 3,316,564
Politeno Empreendimentos 607 - (1) - - - - - 606
Quantiq 253,272 - - - - - - - 253,272
Riopol 2,630,417 - 136,799 (19) - - - - 2,767,197
RPR 42,698 - (5,253) - - - - - 37,445
7,747,211 - 122,719 1,959 (21,081) - - - 7,850,808
Foreign subsidiaries
Braskem Alemanha 53,753 - (6) - - - - (1,023) 52,724
Braskem Argentina 7,850 - 2,948 - - - - - 10,798
Braskem Austria 81 - - - - (81) - - -
Braskem Chile 1,782 - (2) - - - - - 1,780
Braskem Holanda 1,177,221 - 11,060 - - - - (17,801) 1,170,480
Braskem Idesa 263,437 - 50,672 - - - (1,980) 12,911 325,040
Braskem Inc. 301,829 - (16,438) - - - - - 285,391
Petroquímica Chile 6,535 - (46) - - - - - 6,489
1,812,488 - 48,188 - - (81) (1,980) (5,913) 1,852,702
Total subsidiaries and jointly-controled subsidiaries 9,559,699 - 170,907 1,959 (21,081) (81) (1,980) (5,913) 9,703,510
Associates
Domestic subsidiaries
Borealis 31,945 - 630 - - - - - 32,575
Nitrocolor - 38 - - - (38) - - -
Total associates 31,945 38 630 - - (38) - - 32,575
Total subsidiaries, jointly-controled subsidiaries and associates 9,591,644 38 171,537 1,959 (21,081) (119) (1,980) (5,913) 9,736,085
Equity in results of investees

Braskem S.A.
Notes to the financial statements
at March 31, 2013 All amounts in thousands of reais unless otherwise stated
32
(c) Breakdown of equity accounting results
(i) Amortization of fair value adjustments comprises the following:
R$20,222 related to the amortization of fair value adjustments on the assets and liabilities from the
acquisition of Quattor. This amount is distributed in the following items of the consolidated statement of
operations: “net sales revenue” of R$4,430; “cost of sales” of R$22,921; “general and administrative
expenses” of R$23, and “financial results” of R$3,266. The effect of deferred income tax and social
contribution was R$10,418.
R$859 related to the amortization of fair value adjustments on property, plant and equipment of the
subsidiary Braskem Petroquímica.
14. Property, plant and equipment
This table was presented in the Company’s 2012 annual financial statements, in Note 17.
Impairment test for property, plant and equipment
There were no significant events or circumstances in the quarter ended March 31, 2013 that indicate the need for
impairment testing on the property, plant and equipment.
Consolidated
Mar/2013 Mar/2012 Mar/2013 Mar/2012
Equity in results of subsidiaries, associate and jointly-controlled 173,496 156,971 (4,722) (762)
Amortization of fair value adjustment (21,081) (i) (22,257) - (1,337)
Provision for losses on investments 3,673 2,507 - -
Other - 9 - -
156,088 137,230 (4,722) (2,099)
Parent company
Mar/2013 Dec/2012
Accumulated Accumulated
depreciation/ depreciation/
Cost depletion Net Cost depletion Net
Land 83,776 - 83,776 83,776 - 83,776
Buildings and improvements 1,424,605 (688,082) 736,523 1,423,806 (675,177) 748,629
Machinery, equipment and installations 16,812,607 (7,891,102) 8,921,505 16,766,124 (7,657,862) 9,108,262
Projects in progress 1,973,075 - 1,973,075 1,839,278 - 1,839,278
Other 518,786 (353,577) 165,209 517,951 (345,039) 172,912
Impairment (156,897) - (156,897) (158,472) - (158,472)
Total 20,655,952 (8,932,761) 11,723,191 20,472,463 (8,678,078) 11,794,385
Consolidated

Braskem S.A.
Notes to the financial statements
at March 31, 2013 All amounts in thousands of reais unless otherwise stated
33
15. Intangible Assets
This table was presented in the 2012 annual financial statements of the Company, in Note 18.
Impairment testing of intangible assets with indefinite useful life
There were no significant events or circumstances in the period ended March 31, 2013 that indicated the need
for impairment testing of the intangible assets with indefinite useful life.
16. Borrowings
(i) The Company has derivative operations contracted for a portion of advances on foreign exchange contracts in order to
offset fluctuations in the U.S. dollar (Note 17.2.1(a.ii)).
The information related to borrowings was presented in the 2012 annual financial statements of the Company, in
Note 19.
Mar/2013
Accumulated Accumulated
Cost amortization Net Cost amortization Net
Goodwill based on future profitability 3,187,722 (1,128,804) 2,058,918 3,187,722 (1,128,804) 2,058,918
Trademarks and patents 199,130 (73,360) 125,770 199,367 (71,141) 128,226
Software and use rights 420,454 (197,160) 223,294 402,396 (183,908) 218,488
Contracts with customers and suppliers 682,794 (164,566) 518,228 685,890 (150,556) 535,334
Total 4,490,100 (1,563,890) 2,926,210 4,475,375 (1,534,409) 2,940,966
Consolidated
Dec/2012
Consolidated
Monetary restatement Mar/2013 Dec/2012
Foreign currency
Bonds and Medium term notes (MTN) Note 16 (a) Note 16 (a) 9,191,947 9,278,759
Advances on exchange contracts (i) US dollar exchange variation 1.54% - 173,939
Export prepayments Note 16 (b) Note 16 (b) 912,655 513,610
BNDES Note 16 (c) Note 16 (c) 469,951 495,260
Export credit notes Note 16 (d) Note 16 (d) 777,653 787,687
Other US dollar exchange variation 1.40% above Libor 1,392,929 917,283
Other Exchange variation (UMBNDES) 6.06% 302 768
Transactions costs, net (82,694) (60,285)
Local currency
Export credit notes Note 16 (d) Note 16 (d) 2,496,756 2,384,414
BNDES Note 16 (c) Note 16 (c) 2,323,394 2,381,892
BNB/ FINAME/ FINEP/ FUNDES 7.06% 598,137 605,273
BNB/ FINAME/ FINEP/ FUNDES TJLP 0.39% 22,773 25,746
Other TJLP 2.87% 2,918 7,292
Total 18,106,721 17,511,638
Current liabilities 2,383,219 1,836,028
Non-current liabilities 15,723,502 15,675,610
Total 18,106,721 17,511,638
Annual financial charges
Average interest
(unless otherwise stated)

Braskem S.A.
Notes to the financial statements
at March 31, 2013 All amounts in thousands of reais unless otherwise stated
34
(a) Bonds and MTN
(b) Export prepayments (“EPP”)
Issue amount Interest
Issue date (US$ in thousands) Maturity (% per year) Mar/2013 Dec/2012
July 1997 250,000 June 2015 9.38 135,300 134,175
January 2004 250,000 January 2014 11.75 159,506 169,609
September 2006 275,000 January 2017 8.00 263,780 275,270
June 2008 500,000 June 2018 7.25 1,030,219 1,026,894
May 2010 400,000 May 2020 7.00 822,702 820,621
May 2010 350,000 May 2020 7.00 724,428 722,596
October 2010 450,000 no maturity date 7.38 922,176 935,776
April 2011 750,000 April 2021 5.75 1,544,971 1,545,798
July 2011 500,000 July 2041 7.13 1,020,451 1,053,701
February 2012 250,000 April 2021 5.75 516,718 516,995
February 2012 250,000 no maturity date 7.38 512,320 519,876
May 2012 500,000 May 2022 5.38 1,029,150 1,030,598
July 2012 250,000 July 2041 7.13 510,226 526,850
Total 4,975,000 9,191,947 9,278,759
Consolidated
Initial amount
of the transaction
Issue date (US$ thousand) Maturity Charges (% per year) Mar/2013 Dec/2012
May 2010 150,000 May 2015 US dollar exchange variation + semiannual Libor + 2.40 305,091 307,406
December 2010 100,000 December 2017 US dollar exchange variation + semiannual Libor + 2.47 203,814 206,204
January 2013 200,000 November 2022 US dollar exchange variation + semiannual Libor + 1.10 403,750 -
Total 450,000 912,655 513,610
Consolidated

Braskem S.A.
Notes to the financial statements
at March 31, 2013 All amounts in thousands of reais unless otherwise stated
35
(c) BNDES borrowings
Consolidated
Projects Issue date Maturity Charges (% per year) Mar/2013 Dec/2012
Foreign currency
Other 2005/2006 October 2016 US dollar exchange variation + 6.36 7,104 7,708
Other 2005/2006 May 2013 Monetary variation (UMBNDES) + 5.46 - 100
Limit of credit UNIB-South 2006 July 2014 US dollar exchange variation + 5.38 to 6.06 8,676 10,747
Braskem Qpar expansion 2006/2007/2008 April 2016 US dollar exchange variation + 6.06 to 6.36 18,549 21,072
Braskem Qpar expansion 2006/2007/2008 January 2015 Monetary variation (UMBNDES) + 6.21 1,817 2,099
Limit of credit I 2007 April 2015 US dollar exchange variation + 4.88 to 5.77 36,875 42,519
Green PE 2009 July 2017 US dollar exchange variation + 6.14 41,419 44,440
Limit of credit II 2009 January 2017 US dollar exchange variation + 6.14 86,393 93,354
New plant PVC Alagoas 2010 January 2020 US dollar exchange variation + 6.14 102,557 101,647
Limit of credit III 2011 January 2018 US dollar exchange variation + 5.98 to 6.01 138,596 143,186
Butadiene 2011 January 2021 US dollar exchange variation + 6.01 27,965 28,388
469,951 495,260
Local currency
Other 2005/2006 September 2016 TJLP + 2.40 to 2.80 62,751 67,218
Limit of credit UNIB-South 2006 May 2014 TJLP + 2.02 to 3.00 35,325 44,432
Braskem Qpar expansion 2006/2007/2008 February 2016 TJLP + 1.00 to 3.50 175,073 197,546
Limit of credit I 2007 April 2015 TJLP + 1.81 to 2.32 151,703 173,477
Green PE 2008/2009 June 2017 TJLP + 0.00 to 4.78 391,006 414,278
Limit of credit II 2009 January 2017 TJLP + 2.58 to 3.58 299,579 319,039
Limit of credit II 2009 January 2017 4.50 13,383 14,252
New plant PVC Alagoas 2010 December 2019 TJLP + 0.00 to 3.58 360,863 351,406
New plant PVC Alagoas 2010 December 2019 5.50 43,079 43,066
Limit of credit III 2011 January 2018 TJLP + 2.05 to 3.45 596,998 582,981
Limit of credit III 2011 July 2018 4.00 81,514 64,095
Butadiene 2011 December 2020 TJLP + 2.15 to 3.45 112,120 110,102
2,323,394 2,381,892
-
Total 2,793,345 2,877,152

Braskem S.A.
Notes to the financial statements
at March 31, 2013 All amounts in thousands of reais unless otherwise stated
36
(d) Export credit notes (“NCE”)
(i) The Company enters into swap transactions for these NCE contracts in order to offset the variation in the
Interbank Certificate of Deposit (CDI) rate.
(ii) Financing paid in advance in March 2013.
(iii) Financing paid in advance in January 2013.
(iv) The Company enters into swap transactions for these NCE contracts (from 88.20% to 92.70% of CDI).
Initial amount Consolidated
Issue date of the transaction Maturity Charges (% per year) Mar/2013 Dec/2012
Foreign currency
November 2006 167,014 May 2018 Us dollar exchange variation + 8.10 161,989 161,150
April 2007 101,605 March 2018 Us dollar exchange variation + 7.87 104,498 104,029
May 2007 146,010 May 2019 Us dollar exchange variation + 7.85 155,020 154,298
January 2008 266,430 February 2020 Us dollar exchange variation + 7.30 305,623 315,973
March 2008 41,750 March 2016 Us dollar exchange variation + 7.50 50,523 52,237
722,809 777,653 787,687
Local currency
April 2010 50,000 March 2014 12.16 66,738 65,678
June 2010 200,000 June 2014 12.13 260,611 256,471
February 2011 250,000 February 2014 99% of CDI 241,750 297,434
April 2011 (i) 450,000 April 2019 112.5% of CDI 456,541 456,876
June 2011 80,000 June 2014 98.5% of CDI 93,019 91,563
August 2011 (i) 400,000 August 2019 112.5% of CDI 402,420 402,527
January 2012 (ii) 200,000 December 2013 103% of CDI - 217,320
June 2012 100,000 June 2014 103% of CDI 105,545 103,818
September 2012 300,000 September 2015 103% of CDI 310,768 305,684
October 2012 85,000 September 2014 98.5% of CDI 87,794 86,419
November 2012 (iii) 100,000 November 2013 106% of CDI - 100,624
February 2013 (iv) 100,000 February 2016 8.00 101,140 -
February 2013 (iv) 50,000 February 2016 7.50 50,515 -
February 2013 (iv) 100,000 February 2016 8.00 100,859 -
February 2013 (iv) 50,000 February 2016 8.00 50,419 -
February 2013 (iv) 100,000 February 2016 8.00 100,794 -
March 2013 (iv) 50,000 March 2016 8.00 50,257 -
March 2013 (iv) 17,500 March 2016 8.00 17,586 -
Total 2,682,500 2,496,756 2,384,414

Braskem S.A.
Notes to the financial statements
at March 31, 2013 All amounts in thousands of reais unless otherwise stated
37
(e) Payment schedule
The maturity profile of the long-term amounts is as follows:
(f) Capitalized financial charges - consolidated
The Company capitalized financial charges in the period ended March 31, 2013 in the amount of R$122,267
(R$32,953 on March 31, 2012), including monetary variation and part of the exchange variation. The average
rate of these charges in the period was 6.98% p.a. (7.46% p.a. in the first quarter of 2012).
(g) Guarantees
Braskem gave collateral for part of its borrowings as follows:
Mar/2013 Dec/2012
2014 1,146,390 1,759,551
2015 1,559,380 1,515,498
2016 1,600,140 1,092,519
2017 756,686 715,362
2018 1,540,208 1,512,383
2019 1,185,052 1,146,166
2020 1,897,655 1,884,761
2021 2,069,348 2,059,513
2022 em diante 3,968,643 3,989,857
Total 15,723,502 15,675,610
Consolidated
Total Total
Loans Maturity debt Mar/2013 guaranteed Guarantees
BNB December 2022 301,714 301,714 Mortgage of plants, pledge of machinery and equipment
BNDES January 2021 2,793,345 2,793,345 Mortgage of plants, land and property, pledge of machinery and equipment
FUNDES May 2020 219,236 219,236 Mortgage of plants, land and property, pledge of machinery and equipment
FINEP January 2019 95,766 95,766 Bank surety
FINAME February 2022 4,194 4,194 Pledge of equipment
Other May 2013 3,220 3,220 Mortgage of plants and promissory note
Total 3,417,475 3,417,475

Braskem S.A.
Notes to the financial statements
at March 31, 2013 All amounts in thousands of reais unless otherwise stated
38
17. Taxes payable
The information related to taxes payable was presented in the Company’s 2012 annual financial statements, in
Note 21.
Mar/2013 Dec/2012 Mar/2013 Dec/2012
Parent Company and subsidiaries in Brazil
IPI 63,189 55,609 84,431 71,440
PIS and COFINS - - 8,855 5,764
Income tax and social contribution 14,693 16,983 74,985 54,987
ICMS 6,094 16,274 64,134 72,435
Federal tax payment program - Law 11,941/09 1,151,043 1,168,413 1,219,271 1,237,156
Other 44,363 47,119 42,578 59,630
Foreign subsidiaries
Value-added tax - - 3,157 2,538
Income tax - - 2,097 2,132
Other - - - 1,460
Total 1,279,382 1,304,398 1,499,508 1,507,542
- -
Current liabilities 239,270 245,173 352,837 342,789
Non-current liabilities 1,040,112 1,059,225 1,146,671 1,164,753
Total 1,279,382 1,304,398 1,499,508 1,507,542
ConsolidatedParent company

Braskem S.A.
Notes to the financial statements
at March 31, 2013 All amounts in thousands of reais unless otherwise stated
39
18. Income tax (“IR”) and social contribution (“CSL”)
(a) Reconciliation of the effects of income tax and social contribution on profit
Mar/2013 Mar/2012 Mar/2013 Mar/2012
Income before IR and CSL and after discontinued operations 247,517 164,846 331,171 210,668
IR and CSL at the rate of 34% (84,156) (56,048) (112,598) (71,627)
Permanent adjustments to the IR and CSL calculation basis
IR and CSL on equity in results of investees 51,821 45,805 (1,605) (714)
Tax incentives (Sudene and PAT) - - 495 -
Other permanent adjustments (5,270) (1,045) 9,340 13,870
Effect of IR and CSL on results of operations (37,605) (11,288) (104,368) (58,471)
Breakdown of IR and CSL:
Current IR and CSL / continued operations - - (40,587) (97,724)
Current IR and CSL / discontinued operations - - - (4,320)
Current IR and CSL - - (40,587) (102,044)
Deferred IR and CSL / continued operations (37,605) (11,288) (63,781) 44,586
Deferred IR and CSL / discontinued operations - - - (1,013)
Deferred IR and CSL (37,605) (11,288) (63,781) 43,573
Total IR and CSL on income statement (37,605) (11,288) (104,368) (58,471)
Parent company Consolidated

Braskem S.A.
Notes to the financial statements
at March 31, 2013 All amounts in thousands of reais unless otherwise stated
40
(b) Breakdown of deferred income tax and social contribution
(c) Realization of deferred income tax and social contribution
In the period ended March 31, 2013, there were no material events or circumstances that indicate any
compromise of the realization of these deferred taxes.
The information related to income tax and social contribution was presented in the 2012 annual financial
statements of the Company, in Note 22.
Deferred tax - assets Mar/2013 Dec/2012 Mar/2013 Dec/2012
Tax losses (IR) and negative base (CSL) 536,418 444,332 1,203,023 1,099,345
Goodwill amortized 22,027 28,126 25,225 31,432
Exchange variations 103,902 205,725 110,943 215,545
Temporary adjustments 277,812 277,549 360,786 355,810
Business combination 89,769 89,770 244,627 243,517
Pension plan 54,619 49,912 61,007 56,300
Deferred charges - write-off 3,898 5,197 54,538 60,060
Total assets 1,088,445 1,100,611 2,060,149 2,062,009
Deferred tax - liabilities Mar/2013 Dec/2012 Mar/2013 Dec/2012
Amortization of goodwill based on future profitability 518,964 510,308 601,038 586,857
Tax depreciation 226,893 208,849 434,267 391,224
Temporary differences 7,862 8,014 337,263 327,500
Business combination 85,201 85,746 614,965 624,817
Write-off negative goodwill of incorporated subsidiaries 1,633 1,781 1,633 1,781
Additional indexation PP&E 150,681 154,188 150,681 154,189
Other 49,947 46,857 56,620 52,254
Total liabilities 1,041,181 1,015,743 2,196,467 2,138,622
Parent company Consolidated
Parent company Consolidated

Braskem S.A.
Notes to the financial statements
at March 31, 2013 All amounts in thousands of reais unless otherwise stated
41
19. Sundry provisions
The composition of provisions for judicial and administrative suits is as follows:
This table and the information on provisions were presented in the 2012 annual financial statements of the
Company, in Note 23.
20. Advances from customers – consolidated current liabilities
The main change in this item is related to advances made by clients abroad for the purchase of products in 2013.
The information related to advances from customers was presented in the 2012 annual financial statements of
the Company, in Note 26.
Mar/2013 Dec/2012
Provision for customers bonus 23,261 40,666
Provision for recovery of environmental damages 33,257 32,944
Judicial and administrative provisions 335,256 333,218
Other 8,733 8,847
Total 400,507 415,675
In current liabilities 35,185 52,264
In non-current liabilities 365,322 363,411
Total 400,507 415,675
Consolidated
Mar/2013 Dec/2012
Labor claims 80,268 75,697
Tax claims
Income tax and social contribution 30,449 29,980
PIS and COFINS 33,472 32,929
ICMS - interstate purchases 81,002 79,688
ICMS - other 57,912 56,974
Other 44,143 50,744
Societary claims and other 8,010 7,206
335,256 333,218
Consolidated

Braskem S.A.
Notes to the financial statements
at March 31, 2013 All amounts in thousands of reais unless otherwise stated
42
21. Defined-benefit plans
The amounts recognized for defined benefit pension plans are as follows:
(i) With the adoption of CPC 33 (R1) and IAS 19, the actuarial losses previously unrecognized in these two plans, in
the amount of R$18,204 (R$11,816 net of income tax) were recognized under "other comprehensive income (loss)"
on December 31, 2012. For comparison purposes, the information for December 31, 2011 has not been revised,
since the amounts are immaterial.
22. Other accounts payable – consolidated
The main variation was the addition to amounts payable to the non-controlling shareholder of Braskem Idesa of
R$163,760, due in 2013, arising from loans for the Ethylene XXI Project, which will be reimbursed upon
disbursement of funds from the associated Project Finance structure.
The information related to other accounts payable was presented in the 2012 annual financial statements of the
Company, in Note 27.
23. Contingencies
The Company has contingent liabilities related to lawsuits and administrative proceedings arising from the
normal course of its business. These contingencies are of a labor and social security, tax, civil and corporate
nature and involve risks of losses that are classified by the Company’s management as possible. A provision for
the lawsuits for which the risk of loss is classified as probable is recognized and is presented in Note 19 of this
Quarterly Information.
During the quarter, various lawsuits and proceedings whose chance of loss was deemed as possible were
concluded with no impact on the profit or loss for the period, including those whose final ruling was against the
Company. In these cases, the lawsuits and proceedings had judicial deposits. The balance of contingencies at
March 31, 2013 is as follows:
The description of the main contingent liabilities of the Company was presented in the 2012 annual financial
statements, in Note 28.
Mar/2013 Dec/2012
Petros Copesul 160,645 147,175
Novamont Braskem America (i) 9,732 10,381
Braskem Alemanha (i) 25,510 26,221
195,887 183,777
Consolidated
Mar/2013 Dec/2012
- -
Tax claims 2,875,017 2,967,799
Other lawsuits 336,292 411,324
Total 3,211,309 3,379,123
Consolidated

Braskem S.A.
Notes to the financial statements
at March 31, 2013 All amounts in thousands of reais unless otherwise stated
43
24. Financial instruments
The information related to financial instruments was presented in the 2012 financial statements of the Company,
in Note 20.
24.1. Non-derivative financial instruments - consolidated
Fair value hierarchy
Level 1 – fair value obtained through prices quoted (without adjustments) in active markets for identical assets
or liabilities, such as the stock exchange.
Level 2 – fair value obtained from discounted cash flow models, when the instrument is a forward purchase or
sale or a swap contract, or valuation models of option contracts, such as the Black-Scholes model, when the
derivative has the characteristics of an option.
Fair value
Note Classification by category hierarchy Mar/2013 Dec/2012 Mar/2013 Dec/2012
Cash and cash equivalents 4
Cash and banks Loans and receivables 308,756 398,142 308,756 398,142
Financial investments in Brazil Held-for-trading Level 2 394,733 393,348 394,733 393,348
Financial investments in Brazil Loans and receivables 1,287,400 899,816 1,287,400 899,816
Financial investments abroad Held-for-trading Level 2 1,011,312 1,596,316 1,011,312 1,596,316
3,002,201 3,287,622 3,002,201 3,287,622
Financial investments 5
FIM Sol investments Held-for-trading Level 2 45,741 50,803 45,741 50,803
Investments in foreign currency Held-for-trading Level 2 4,486 5,256 4,486 5,256
Investments in foreign currency Held-to-maturity 65,078 15,731 65,078 15,731
Shares Held-for-trading Level 1 1,679 3,023 1,679 3,023
FIM Sol investments Loans and receivables 97,809 77,469 97,809 77,469
Investments in national currency Loans and receivables - 513 - 513
Quotas of receivables investment fund Held-to-maturity 31,701 52,559 31,701 52,559
Restricted deposits Held-to-maturity 3,919 1,281 3,919 1,281
250,413 206,635 250,413 206,635
Trade accounts receivable 6 Loans and receivables 2,483,375 2,364,222 2,483,375 2,364,222
Related parties credits 8 Loans and receivables 151,946 141,539 151,946 141,539
Other receivables
Disposal of shareholdings Loans and receivables 489,100 652,100 489,100 652,100
Trade payables Other financial liabilities 8,701,681 8,897,597 8,701,681 8,897,597
Borrowings 16
Foreign currency Other financial liabilities 12,745,437 12,166,538 13,297,789 12,920,332
Local currency Other financial liabilities 5,443,978 5,404,617 5,443,978 5,405,688
18,189,415 17,571,155 18,741,767 18,326,020
Other payables 22
Creditors for the acquisitions of shares Other financial liabilities 260,758 256,030 260,758 256,030
Accounts payable to non-controlling Other financial liabilities 424,431 260,649 424,431 260,649
685,189 516,679 685,189 516,679
Book value Fair value
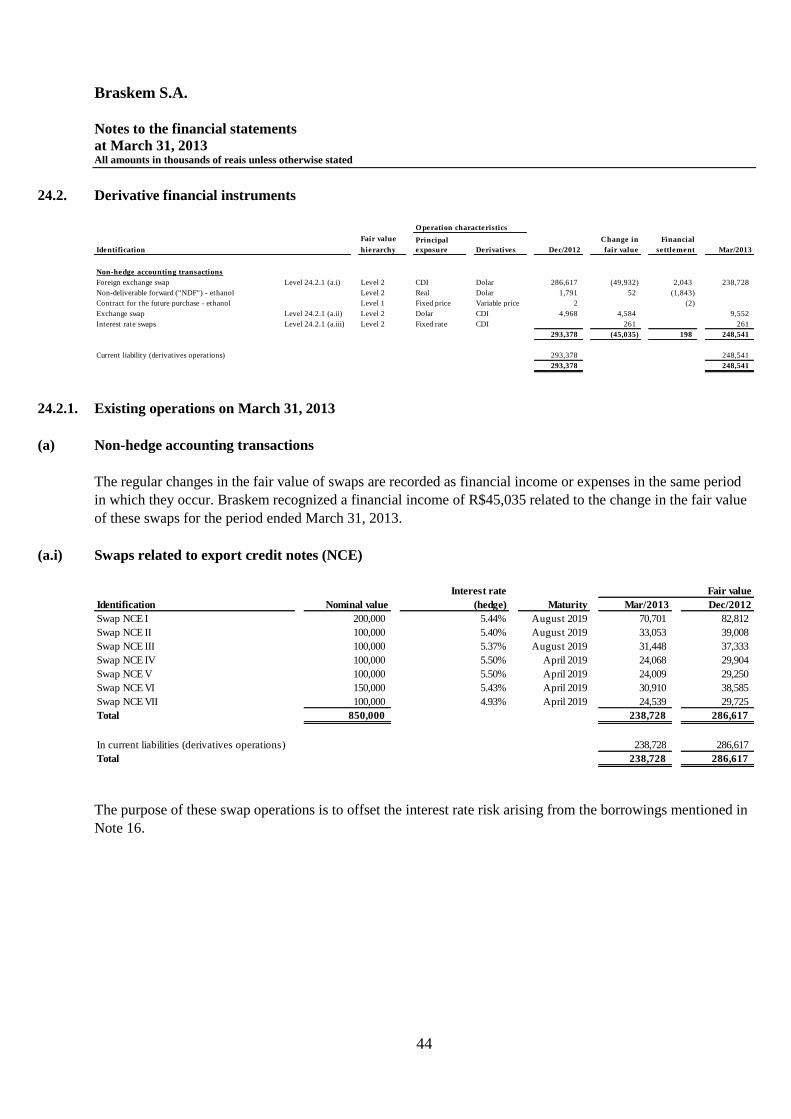
Braskem S.A.
Notes to the financial statements
at March 31, 2013 All amounts in thousands of reais unless otherwise stated
44
24.2. Derivative financial instruments
24.2.1. Existing operations on March 31, 2013
(a) Non-hedge accounting transactions
The regular changes in the fair value of swaps are recorded as financial income or expenses in the same period
in which they occur. Braskem recognized a financial income of R$45,035 related to the change in the fair value
of these swaps for the period ended March 31, 2013.
(a.i) Swaps related to export credit notes (NCE)
The purpose of these swap operations is to offset the interest rate risk arising from the borrowings mentioned in
Note 16.
Fair value Change in Financial
Identification hierarchy Derivatives Dec/2012 fair value settlement Mar/2013
Non-hedge accounting transactions
Foreign exchange swap Level 24.2.1 (a.i) Level 2 CDI Dolar 286,617 (49,932) 2,043 238,728
Non-deliverable forward ("NDF") - ethanol Level 2 Real Dolar 1,791 52 (1,843) -
Contract for the future purchase - ethanol Level 1 Fixed price Variable price 2 - (2) -
Exchange swap Level 24.2.1 (a.ii) Level 2 Dolar CDI 4,968 4,584 - 9,552
Interest rate swaps Level 24.2.1 (a.iii) Level 2 Fixed rate CDI - 261 - 261
293,378 (45,035) 198 248,541
Current liability (derivatives operations) 293,378 248,541
293,378 248,541
O peration characteristics
Principal
exposure
Interest rate
Identification Nominal value (hedge) Mar/2013 Dec/2012
Swap NCE I 200,000 5.44% August 2019 70,701 82,812
Swap NCE II 100,000 5.40% August 2019 33,053 39,008
Swap NCE III 100,000 5.37% August 2019 31,448 37,333
Swap NCE IV 100,000 5.50% April 2019 24,068 29,904
Swap NCE V 100,000 5.50% April 2019 24,009 29,250
Swap NCE VI 150,000 5.43% April 2019 30,910 38,585
Swap NCE VII 100,000 4.93% April 2019 24,539 29,725
Total 850,000 238,728 286,617
In current liabilities (derivatives operations) 238,728 286,617
Total 238,728 286,617
Maturity
Fair value

Braskem S.A.
Notes to the financial statements
at March 31, 2013 All amounts in thousands of reais unless otherwise stated
45
(a.ii) Currency swap
(a.iii) Interest rate swap linked to NCE
The objective of swap transactions is to reduce cash flow volatility by causing the fluctuation in interest on debt
to match the return on cash in Brazilian real.
(b.1) Estimated maximum loss
The amount at risk of the derivatives held by Braskem on March 31, 2013, which is defined as the highest loss
that could result in one month and in 95% of the cases under normal market conditions, was estimated by the
Company at US$14,259 for the NCE swaps, R$2,450 for currency swaps, and US$114,259 for fixed rate / CDI
swaps.
Interest rate
Identification Nominal value (hedge) Mar/2013 Dec/2012
Swap ACC 35,000 99.85% CDI November 2013 4,017 2,180
Swap ACC 50,000 99.75% CDI November 2013 5,535 2,788
Total 85,000 9,552 4,968
- -
In current liabilities (derivatives operations) 9,552 4,968
Total 9,552 4,968
Maturity
Fair value
Interest rate
Identification Nominal value (hedge) Mar/2013 Dec/2012
Swap NCE I 101,053 90.65% CDI February 2016 (224)
Swap NCE II 50,451 88.20% CDI February 2016 (381)
Swap NCE III 100,672 92.64% CDI February 2016 303
Swap NCE IV 50,376 92.70% CDI February 2016 172
Swap NCE V 100,643 91.92% CDI February 2016 206
Swap NCE VI 50,225 92.25% CDI March 2016 162
Swap NCE VII 17,500 91.10% CDI March 2016 23
Total 470,920 261 -
In current liabilities (derivatives operations) 261
Total 261 -
Maturity
Valor justo

Braskem S.A.
Notes to the financial statements
at March 31, 2013 All amounts in thousands of reais unless otherwise stated
46
24.3. Credit quality of financial assets
(a) Trade accounts receivable
Only a few of the Company's customers have risk ratings assigned by credit rating agencies. For this reason, the
Company developed its own credit rating system for all accounts receivable from domestic customers and for
part of the accounts receivable from foreign customers. The Company does not apply this rating to all of its
foreign customers because most accounts receivable from them are covered by an insurance policy or letters of
credit issued by banks. On March 31, 2013, the credit ratings were as follows:
Percentage
1 Minimum risk 16.69%
2 Low risk 26.33%
3 Moderate risk 27.84%
4 High risk 27.53%
5 Very high risk (i) 1.61%
(i) Most customers in this group are inactive and the respective accounts are in the process of collection
actions in the courts. Customers in this group that are still active buy from Braskem and pay in advance.
Delinquency indicators for the periods ended:
Domestic
Market
(LTM)
Export
Market
(LTM)
March 31, 2013 0.79% 0.27%
December 31, 2012 0.28% 0.37%
December 31, 2011 0.18% 0.43%
LTM – last 12 months
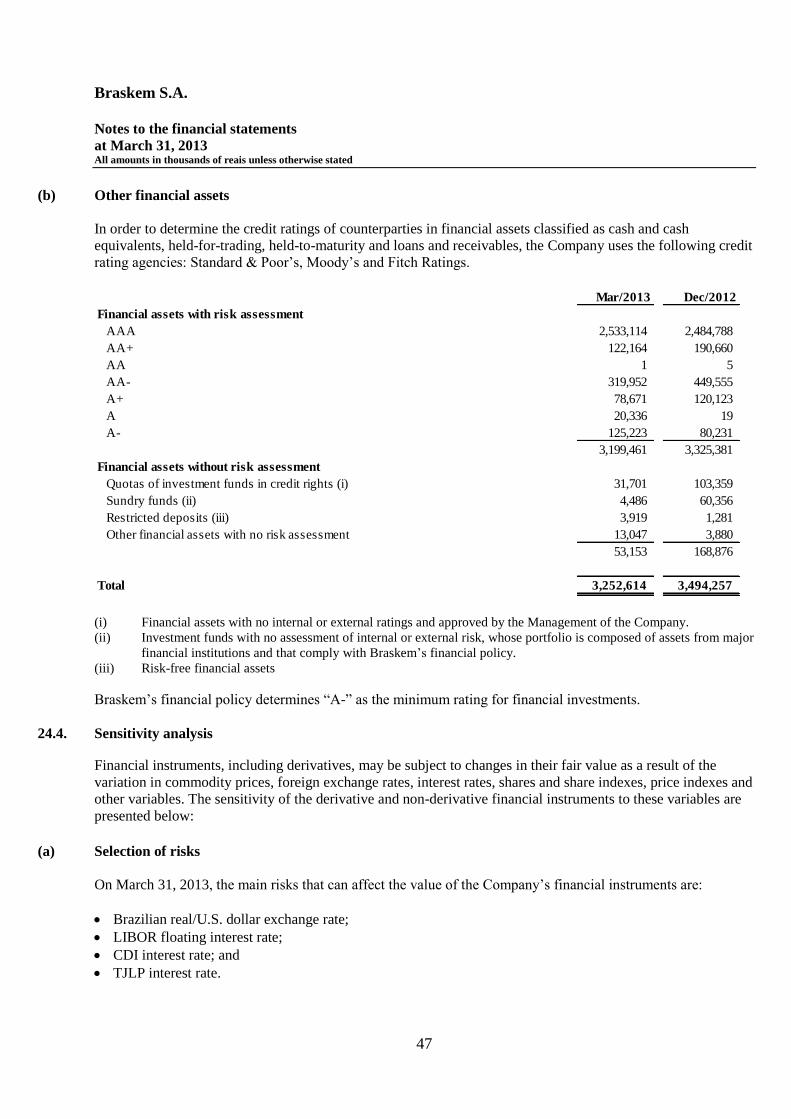
Braskem S.A.
Notes to the financial statements
at March 31, 2013 All amounts in thousands of reais unless otherwise stated
47
(b) Other financial assets
In order to determine the credit ratings of counterparties in financial assets classified as cash and cash
equivalents, held-for-trading, held-to-maturity and loans and receivables, the Company uses the following credit
rating agencies: Standard & Poor’s, Moody’s and Fitch Ratings.
(i) Financial assets with no internal or external ratings and approved by the Management of the Company.
(ii) Investment funds with no assessment of internal or external risk, whose portfolio is composed of assets from major
financial institutions and that comply with Braskem’s financial policy.
(iii) Risk-free financial assets
Braskem’s financial policy determines “A-” as the minimum rating for financial investments.
24.4. Sensitivity analysis
Financial instruments, including derivatives, may be subject to changes in their fair value as a result of the
variation in commodity prices, foreign exchange rates, interest rates, shares and share indexes, price indexes and
other variables. The sensitivity of the derivative and non-derivative financial instruments to these variables are
presented below:
(a) Selection of risks
On March 31, 2013, the main risks that can affect the value of the Company’s financial instruments are:
Brazilian real/U.S. dollar exchange rate;
LIBOR floating interest rate;
CDI interest rate; and
TJLP interest rate.
Mar/2013 Dec/2012
Financial assets with risk assessment
AAA 2,533,114 2,484,788
AA+ 122,164 190,660
AA 1 5
AA- 319,952 449,555
A+ 78,671 120,123
A 20,336 19
A- 125,223 80,231
3,199,461 3,325,381
Financial assets without risk assessment
Quotas of investment funds in credit rights (i) 31,701 103,359
Sundry funds (ii) 4,486 60,356
Restricted deposits (iii) 3,919 1,281
Other financial assets with no risk assessment 13,047 3,880
53,153 168,876
Total 3,252,614 3,494,257

Braskem S.A.
Notes to the financial statements
at March 31, 2013 All amounts in thousands of reais unless otherwise stated
48
For the purposes of the risk sensitivity analysis, the Company presents the exposures to currencies as if they
were independent, that is, without reflecting in the exposure to a foreign exchange rate the risks of the variation
in other foreign exchange rates that could be directly influenced by it.
(b) Selection of scenarios
In accordance with CVM Instruction No. 475/08, the Company included three scenarios in the sensitivity
analysis, with one that is probable and two that represent adverse effects to the Company. In the preparation of
the adverse scenarios, only the impact of the variables on the financial instruments, including derivatives, and
on the items covered by hedge transactions, was considered. The overall impacts on the Company’s operations,
such as those arising from the revaluation of inventories and revenue and future costs, were not considered.
Since the Company manages its exposure to foreign exchange rate risk on a net basis, adverse effects from
depreciation in the Brazilian real in relation to the U.S. dollar can be offset by opposing effects on Braskem’s
operating results.
(b.1) Probable scenario
The Market Readout published by the Central Bank of Brazil on March 29, 2013 was used to create the probable
scenario for the U.S. dollar/Brazilian real exchange rate and the CDI interest rate, using the reference date of
December 31, 2013. The Market Readout presents a consensus of market expectations based on a survey of the
forecasts made by various financial and non-financial institutions.
The Market Readout does not publish forecasts for the interest rates LIBOR and TJLP. Therefore, the Company
considered the expectations for the CDI interest rate for determining the probable scenario for those rates, given
their correspondence. The probable scenario for the TJLP is an increase of 0.5% from the current rate of 5%, in
line with the size of the government’s most recent decisions to increase or decrease the rate, and accompanying
the forecast for the cumulative increase in the CDI rate by end-2013 of 1.25%.
(b.2) Possible and extreme adverse scenarios
For the Brazilian real/U.S. dollar exchange rate, a positive change of 25% was considered for the possible
adverse scenario and of 50% for the extreme scenario based on the exchange rate on March 31, 2013.
For the CDI interest rate, a positive change of 25% was considered for the possible adverse scenario and of 50%
for the extreme scenario based on the interest rate on March 31, 2013.
For the LIBOR interest rate, a positive change of 25% was considered for the possible adverse scenario and of
50% for the extreme scenario based on the LIBOR rate on March 31, 2013.
For the TJLP interest rate, an increase of 1% was considered for the possible adverse scenario and of 1.5% for
the extreme scenario based on its rate on March 31, 2013, in accordance with the upward or downward
adjustments made by the government in the rate, in this order of scale.
The sensitivity values in the table (c) below are the changes in the value of the financial instruments in each
scenario, except for tables (d), (e) and (f), which show the changes in future cash flows.

Braskem S.A.
Notes to the financial statements
at March 31, 2013 All amounts in thousands of reais unless otherwise stated
49
(c) Sensitivity to the Brazilian real/U.S. dollar exchange rate
The sensitivity of each financial instrument, including derivatives and items covered by them, to the variation in
the Brazilian real/US dollar exchange rate is presented in the table below:
(d) Sensitivity of future cash flows to the LIBOR floating interest rate
The sensitivity of future interest income and expenses of each financial instrument, including derivatives and
items covered by them, is presented in the table below. The figures represent the impact on financial income
(expenses), taking into consideration the average term of the respective instrument.
(e) Sensitivity of future cash flows to the CDI interest rate
The sensitivity of each financial instrument, including derivatives and items covered by them, to the variation in
CDI interest rate is presented in the table below:
(f) Sensitivity of future cash flows to the TJLP interest rate
The sensitivity of each financial instrument, including derivatives and items covered by them, to the variation in
TJLP interest rate is presented in the table below:
Possible adverse Extreme adverse
Instrument Probable (25% ) (50% )
Bonds and MTN 52,501 (1,915,318) (3,830,635)
Working capital / structured operations 15,608 (569,409) (1,138,817)
Raw material financing 15 (549) (1,097)
Export prepayments 3,487 (127,226) (254,452)
Financial investments abroad (8,396) 306,298 612,596
Swaps 8,026 (287,786) (572,047)
Possible adverse Extreme adverse
Instrument Probable (25% ) (50% )
Working capital / structured operations (566) (1,664) (3,328)
Export prepayments (314) (924) (1,849)
Possible adverse Extreme adverse
Instrument Probable (25% ) (50% )
Export credit notes (4,807) (6,977) (13,994)
Agricultural credit note (10,126) (14,693) (29,455)
Working capital / other 15,635 22,655 45,535
Probable Possible adverse Extreme adverse
Instrumento 5.5% 6.0% 6.5%
BNDES (8,013) (15,959) (23,840)
FINEP (68) (136) (202)
Other governamental agents (15) (31) (3,965)

Braskem S.A.
Notes to the financial statements
at March 31, 2013 All amounts in thousands of reais unless otherwise stated
50
25. Shareholders’ Equity
The information related to the Company’s shareholders’ equity was presented in its 2012 annual financial
statements, in Note 29.
(a) Capital
On March 31, 2013, the Company's subscribed and paid up capital stock amounted to R$8,043,222 and
comprised 797,265,348 shares with no par value divided into 451,668,652 common shares, 345,002,878 class A
preferred shares, and 593,818 class B preferred shares, distributed as follows:
(b) Ongoing share repurchase programs
(b.1) 4th
Share repurchase program
On August 13, 2012, Braskem’s Board of Directors approved a program for the repurchase of shares effective
for the period between August 29, 2012 and August 28, 2013, through which the Company may acquire up to
13,376,161 class A preferred shares at market price. The shares may be acquired by the Company or by
financial institutions hired for such purpose. Upon the expiration of the program, Braskem will have to acquire
from financial institutions, at market value, the shares acquired by the latter. The private transaction was
approved by the CVM.
No shares were purchased under this program in the quarter.
Preferred Preferred
Commom shares shares
shares % class A % class B % Total %
OSP e Odebrecht # 226,334,623 50.11% 79,182,498 22.96% - - 0 305,517,121 38.32%
Petrobras # 212,426,951 47.03% 75,792,589 21.97% - - 0 288,219,540 36.15%
BNDESPAR # - 0.00% 44,069,052 12.77% - - 0 44,069,052 5.53%
ADR (i) - 0.00% 34,199,944 9.91% - - 0 34,199,944 4.29%
Other # 12,907,078 2.86% 110,604,037 32.06% 593,818 100.00% 0 124,104,933 15.57%
Total # 451,668,652 100.00% 343,848,120 99.67% 593,818 100.00% 0 796,110,590 99.86%
Braskem shares owned by subsidiary
of Braskem Petroquímica (ii) - 0% 1,154,758 0.33% - 0.00% 0 1,154,758 0.14%
Total # 451,668,652 100.00% 345,002,878 100.00% 593,818 100.00% 0 797,265,348 100.00%
(i) American Depository Receipt, negotiated in the New York stock market (USA).
(ii) This shares are treated as "treasury shares" in consolidated Equity.

Braskem S.A.
Notes to the financial statements
at March 31, 2013 All amounts in thousands of reais unless otherwise stated
51
(c) Other comprehensive income - shareholders' equity
(i) Realization under retained earnings (accumulated losses) as the asset is depreciated or written-off (CPC 26(R1));
(ii) Realization under retained earnings (accumulated losses) upon extinction of the plan (CPC 33 (R1);
(iii) Realization under profit or loss upon maturity, prepayment or loss of efficacy for hedge accounting (CPC 38);
(iv) Realization under profit or loss upon write-off of subsidiary abroad (CPC 02 (R2)); and
(v) Realization under profit or loss upon divestment or transfer of control of subsidiary (CPC 36 (R3)).
Parent Company and Consolidated
Additional Deemed Defined Foreign
indexation of cost of benefit Fair value currency Gain (loss)
PP&E jointly-controlled plan actuarial of cash flow translation on interest
price-level subsidiary loss derivatives adjustment in subsidiary
Note (i) (i) (ii) (iii) (iv) (v) Total
As of December 31, 2011 - 326,541 21,159 - (10,716) (24,504) 3,106 315,586
- - - - - - - -
Additional indexation - - - - - - - -
Realization by depreciation or writte-off assets - (10,317) - - - - - (10,317)
Income tax and social contribution on realization - 3,508 - - - - - 3,508
- - - - - - - -
Deemed cost of jointly-controlled subsidiary - - - - - - - -
Realization by depreciation or writte-off assets - - (348) - - - - (348)
Income tax and social contribution on realization - - 118 - - - - 118
- - - - - - - -
Cash flow derivativess 24.2.2 - - - - - - -
Change in fair value - - - - (359) - - (359)
Transfer to result - - - - 15,972 - - 15,972
Tax on fair value gains - - - - (5,309) - - (5,309)
- - - - - - - -
Gain on interest in subsidiary - - - - - - 1,018 1,018
- - - - - - - -
Foreign currency translation adjustment - - - - - (55,631) - (55,631)
- - - - - - - -
As of March 31, 2012 319,732 20,929 - (412) (80,135) 4,124 264,238
As of December 31, 2012 - 299,305 20,207 (11,816) - 37,158 (7,443) 337,411
- - - - - - - -
Additional indexation - - - - - - - -
Realization by depreciation or writte-off assets - (10,317) - - - - - (10,317)
Income tax and social contribution on realization - 3,508 - - - - - 3,508
- - - - - - - -
Deemed cost of jointly-controlled subsidiary - - - - - - - -
Realization by depreciation or writte-off assets - - (367) - - - - (367)
Income tax and social contribution on realization - - 125 - - - - 125
- - - - - - - -
Gain on interest in subsidiary - - - - - - (1,980) (1,980)
- - - - - - - -
Foreign currency translation adjustment - - - - - (6,821) - (6,821)
- - - - - - - -
As of March 31, 2013 292,496 19,965 (11,816) - 30,337 (9,423) 321,559

Braskem S.A.
Notes to the financial statements
at March 31, 2013 All amounts in thousands of reais unless otherwise stated
52
26. Earnings per share
The table below shows the reconciliation of profit or loss for the period adjusted for the amounts used to
calculate basic and diluted earnings per share.
The information related to the earnings per share of the Company was presented in its 2012 annual financial
statements, in Note 30.
Basic Diluted Basic Diluted
Revised Revised
Profit for the period attributed to Company's shareholders
of continued operations 209,912 209,912 143,458 143,458
- - - -
Distribution of dividends attributable to priority: - - - -
Preferred shares class "A" 208,437 208,515 143,212 143,335
Preferred share class "A" potentially convertible - 180 - 123
(the ratio of 2 shares class "B" for each share class "A") - - - -
Preferred shares class "B" 360 - 246 -
208,797 208,695 143,458 143,458
- - - -
Distribution of 6% of unit value of common shares 1,115 1,217 - -
- - - -
Reconciliation of income available for distribution, by class (numerator): - - - -
Common shares 1,115 1,217 - -
Preferred shares class "A" 208,437 208,515 143,212 143,335
Preferred share class "A" potentially convertible - 180 - 123
(the ratio of 2 shares class "B" for each share class "A") - - - -
209,552 209,912 143,212 143,458
0 0 0 0 0 0 0
Weighted average number of shares, by class (denominator): 0 0 0 0 0 0 0
Common shares 451,668,652 451,668,652 451,668,652 451,668,652
Preferred shares class "A" (i) 343,848,120 343,848,120 345,300,320 345,300,320
Preferred share class "A" potentially convertible - - - -
(the ratio of 2 shares class "B" for each share class "A") - 296,909 - 296,909
795,516,772 795,813,681 796,968,972 797,265,881
- - - -
Earnings per share (in R$) - - - -
Common shares 0.0025 0.0027 0 - 0 -
Preferred shares class "A" 0.6062 0.6064 0 0.4439 0 0.4443
Mar/2013 Mar/2012

Braskem S.A.
Notes to the financial statements
at March 31, 2013 All amounts in thousands of reais unless otherwise stated
53
27. Net sales revenues
This table was presented in the 2012 annual financial statements of the Company, in Note 31.
28. Tax incentives
This table was presented in the 2012 annual financial statements of the Company, in Note 32.
Mar/2013 Mar/2012 Mar/2013 Mar/2012
Revised
Sales revenue
Domestic market 5,196,361 0 4,298,027 0 7,202,033 0 5,995,938
Foreign market 1,492,345 1,323,734 3,835,718 3,612,742
6,688,706 5,621,761 11,037,751 9,608,680
Sales deductions - - - -
TributosTaxes (1,097,792) (981,697) (1,630,739) (1,460,657)
Devoluções de vendas e outrosSales returns and other (82,131) (65,370) (111,261) (76,350)
(1,179,923) (1,047,067) (1,742,000) (1,537,007)
- - - -
Net sales revenue 5,508,783 4,574,694 9,295,751 8,071,673
Parent Company Consolidated
Mar/2013 Mar/2012
State of Alagoas Integrated Development Program - PRODESIN (i) 11,971 32,780
REINTEGRA program (ii) 52,448 48,172
64,419 80,952
(i) Recorded in the account "net sales revenue" (Note 27).
(ii) Recorded in the account "cost of products sold".
Consolidated

Braskem S.A.
Notes to the financial statements
at March 31, 2013 All amounts in thousands of reais unless otherwise stated
54
29. Financial results
This table was presented in the 2012 annual financial statements of the Company, in Note 34.
Mar/2013 Mar/2012 Mar/2013 Mar/2012
Revised
Financial income
Interest income 32,324 0 47,435 0 34,387 0 60,480
Monetary variations 2,301 0 10,315 0 2,469 0 11,848
Exchange rate variations (6,126) 0 (44,989) 0 42,504 0 11,424
Other 16,815 0 169 0 43,504 0 1,889
45,314 0 12,930 0 122,864 0 85,641
- 0 - 0 - 0 -
Financial expenses - 0 - 0 - 0 -
Interest expenses (224,203) (219,306) (236,505) (246,707)
Monetary variations (72,772) (67,165) (73,159) (79,266)
Exchange rate variations 256,902 286,268 284,770 249,903
Inflation adjustments on fiscal debts (20,596) (39,720) (24,940) (46,493)
Tax expenses on finacial operations (2,022) (6,980) (2,940) (7,591)
Discounts granted (3,884) (5,517) (14,315) (10,718)
Loans transaction costs - amortization (81) (983) (2,113) (4,136)
Adjustment to present value - appropriation (72,053) (2,488) (137,162) (9,352)
Other (12,800) (13,686) (23,686) (38,391)
(151,509) 0 (69,577) 0 (230,050) 0 (192,751)
- 0 - 0 - 0 -
Total (106,195) 0 (56,647) 0 (107,186) 0 (107,110)
Parent Company Consolidated
Mar/2013 Mar/2012 Mar/2013 Mar/2012
Revised
Interest income
Held for sale 1,098 0 1,151 0 1,098 0 13,509
Loans and receivables 20,935 0 38,890 0 22,453 0 35,753
Held-to-maturity 2,892 0 4,549 0 2,918 0 4,549
24,925 0 44,590 0 26,469 0 53,811
Other assets not classifiable 7,399 0 2,845 0 7,918 0 6,669
Total 32,324 47,435 34,387 60,480
Parent Company Consolidated

Braskem S.A.
Notes to the financial statements
at March 31, 2013 All amounts in thousands of reais unless otherwise stated
55
30. Expenses by nature
This table was presented in the 2012 annual financial statements of the Company, in Note 35.
Mar/2013 Mar/2012 Mar/2013 Mar/2012
Revised
Classification by nature:
Raw materials other inputs (4,195,776) (3,456,705) (7,053,747) (6,307,086)
Personnel expenses (270,635) (238,995) (435,917) (414,847)
Outsourced services (203,029) (135,655) (369,557) (373,073)
Tax expenses (1,067) (7,125) (1,743) (13,235)
Depreciation, amortization and depletion (300,228) (270,906) (476,979) (438,255)
Freights (231,531) (204,748) (359,305) (294,758)
Other expenses (88,662) (143,899) (126,369) (117,915)
Total (5,290,928) (4,458,033) (8,823,617) (7,959,169)
Classification by function:
Cost of products sold (4,969,651) (4,146,710) (8,315,675) (7,482,025)
Selling (48,497) (49,384) (99,555) (90,951)
Distribution (100,077) (90,322) (146,817) (129,998)
General and administrative (154,188) (153,457) (237,006) (231,749)
Research and development (18,515) (18,160) (24,564) (24,446)
Total (5,290,928) (4,458,033) (8,823,617) (7,959,169)
Parent Company Consolidated

Braskem S.A.
Notes to the financial statements
at March 31, 2013 All amounts in thousands of reais unless otherwise stated
56
31. Segment information
The segment “United States and Europe” was presented in December 2012 as “International Business”.
The information related to the presentation of information by segment was presented in the 2012 annual financial statements, in Note 36.
Total Braskem
Basic USA and reportable Other Corporate consolidated Braskem
petrochemicals Polyolefins Vinyls Europe segments segments (i) unit before adjustments Eliminations consolidated
Net sales revenue 5,983,719 3,858,051 644,473 1,606,045 12,092,288 22,026 - 12,114,314 (2,818,563) 9,295,751
Cost of products sold (5,555,933) (3,409,385) (593,508) (1,511,245) (11,070,071) (24,661) - (11,094,732) 2,779,057 (8,315,675)
Gross profit 427,786 448,666 50,965 94,800 1,022,217 (2,635) - 1,019,582 (39,506) 980,076
- - - - - - - - - -
Operating expenses - - - - - - - - - -
Selling, general and distribution expenses (122,134) (204,950) (40,418) (61,740) (429,242) (11,423) (67,277) (507,942) - (507,942)
Results from equity investments - - - - - - (24,564) (24,564) 19,842 (4,722)
Other operating income (expenses), net (21,446) (423) 6,664 1,054 (14,151) (2,432) (12,472) (29,055) - (29,055)
(143,580) (205,373) (33,754) (60,686) (443,393) (13,855) (104,313) (561,561) 19,842 (541,719)
- - - - - - - - - -
Operating profit (loss) 284,206 243,293 17,211 34,114 578,824 (16,490) (104,313) 458,021 (19,664) 438,357
Total Braskem
Basic USA and reportable Other Corporate consolidated Braskem
petrochemicals Polyolefins Vinyls Europe segments segments (i) unit before adjustments Eliminations consolidated
Revised
Net sales revenue 5,651,669 3,267,496 449,717 1,301,498 10,670,380 26,956 - 10,697,336 (2,625,663) 8,071,673
Cost of products sold (5,288,362) (3,113,907) (444,660) (1,212,391) (10,059,320) (22,489) - (10,081,809) 2,599,784 (7,482,025)
Gross profit 363,307 153,589 5,057 89,107 611,060 4,467 - 615,527 (25,879) 589,648
- - - - - - - - - -
Operating expenses - - - - - - - - - -
Selling, general and distribution expenses (109,213) (222,680) (30,195) (48,748) (410,836) (15,150) (51,158) (477,144) - (477,144)
Results from equity investments - - - - - - (2,099) (2,099) - (2,099)
Other operating income (expenses), net (3,447) 25 (256) (126) (3,804) 872 194,872 191,940 - 191,940
(112,660) (222,655) (30,451) (48,874) (414,640) (14,278) 141,615 (287,303) - (287,303)
- - - - - - - - - -
Operating profit (loss) 250,647 (69,066) (25,394) 40,233 196,420 (9,811) 141,615 328,224 (25,879) 302,345
Mar/2013
Reporting segments
Mar/2012
Reporting segments

Braskem S.A.
Notes to the financial statements
at March 31, 2013 All amounts in thousands of reais unless otherwise stated
57
32. Other operating income (expenses), net
In the period ended March 31, 2013, no material operations were classified under this item. In the first quarter of
2012, the main amount comprising this item is the contractual compensation under the agreement between
Sunoco and Braskem America, in the amount of R$235,962.
The information related to the Company’s other net operating income (expenses) was presented in the 2012
annual financial statements, in Note 33.