Embed Size (px)
Citation preview

Branch Expansion of Commercial Banks in Rural America
Sangjeong Nam, Paul N. Ellinger
Selected Paper prepared for presentation at the American Agricultural Economics
Association Annual Meeting, Orlando, FL, July 27-July 29, 2008
Contact Information:
Sangjeong Nam
University of Illinois at Urbana-Champaign
402 Mumford Hall, MC-710
1301 West Gregory Drive
Urbana, IL 61801
Tel: (217) 333-3417
E-mail: [email protected]
Copyright 2008 by Sangjeong Nam and Paul N. Ellinger. All rights reserved. Readers
may make verbatim copies of this document for non-commercial purposes by any means,
provided that this copyright notice appears on all such copies.
___________________________
Sangjeong Nam is a Ph. D. candidate, Paul N. Ellinger is an associate professor in the
Department of Agricultural and Consumer Economics at the University of Illinois at
Urbana-Champaign.

1
Branch Expansion of Commercial Banks in Rural America
Introduction
Alternative distribution channels, such as automated teller machines (ATMs), internet
banking and electronic delivery, are now prevalent in the banking industry. Use of these
alternative channels has increased substantially.1 These alternative distribution channels
might suggest a lower demand for branch offices and traditional fixed “bricks and
mortar” assets. However, the number of branches of U.S. commercial banks has steadily
increased from 38,738 in 1980 to 73,275 in 2006, whereas the number of institutions has
declined during the same periods. The number of insured commercial banks in the U.S
decreased from 14,364 in 1980 to 12,347 in 1990, and to 7,401 in 2006. 2
The advancement in communication technology has been a driving force in
delivering remote banking services at low-cost. These technologies also enable non-bank
firms to pose credible threats to the retail bank franchises. From this point of view, it has
been argued that branches are relatively expensive channels of delivering retail financial
services (Orlow, Radecki and Wenninger, 1996). However, Spieker (2004) report that
bank branches are a highly effective and profitable distribution channel for retail services
relative to other methods like the internet or call centers.
Despite these arguments, the number of branches has risen steadily since the early
1980s. This study is intended to identify a series of institution-level and market-level
1 According to ATM Industry Association, the estimated number of ATMs in the world was expected 1.5
million in 2005. Since the first ATM was installed in London in 1967, it took 33 years for the ATM
industry to reach the 1 million mark, but it has taken only 6 years to hit 1.5 million. 2 Source: Federal Deposit Insurance Corporation (FDIC), Statistics on Banking.
2
proxy variables that are correlated with branch expansion decisions in the banking
industry. The increase in the number of branches is likely due to three factors: (1)
changes in banking branching laws; (2) branching may improve performance when it is
well operated; (3) changes in economic and demographic conditions encourage branching
in certain markets (Spieker, 2004).
Branching studies in the banking industry often investigate branch cost functions.
Multibank holding companies (MBHCs) or branching was thought to have structural
advantages because MBHC banks were better able (1) to provide services to larger
borrowers, (2) attract managers with better training, and (3) allow specialization within
lending functions. Some studies for branching were conducted to examine performance
of branches based on all commercial banks in U.S. (Avery et al., 1999; Cyree et al., 2000;
Shiers, 2002; Schaffnit et al., 1997). Recent papers have examined the impact of the
growth of large banks on bank performance and profitability (Hirtle and Stiroh, 2007;
Hirtle, 2007; Spieker, 2004). Few studies have focused on the characteristics of branch
expansions in rural or urban area with the trend of the increase the number of branches
with an opposite direction to the number of banks in the U.S.
The objective of this paper is to examine the financial and market characteristics
of commercial banks which are growing in through branch expansion. The analysis of
commercial banks and branching markets provides evidence of potential strategies. These
strategies may provide useful guidelines to bank managers and policy makers. This study
makes a complementary contribution to prior research by distinguishing the relationship
between branch expansion as a means of providing banking services and characteristics

3
of financial institutions and markets. The results also suggest that there is a meaningful
explanation for the role of branches in rural area.
The data used to investigate the characteristics of commercial banks are taken
from the Call and Income Report of Federal Reserve. The detailed data on branches and
and geographical markets are provided by the Summary of Deposit of FDIC. The changes
across three years are applied. A nested Logit model is employed to analyze the
characteristics for branch expansion since the decision for branch expansions has a two-
level nesting structure; the first decision is branch expansion or not, then banks should
make a decision for location, that is, to expand in rural area or urban area.
Review of literature
Most studies analyzing performance and impact of branch and bank consolidation
have focused on the banking industry as a whole market (Avery et al., 1999; Shiers, 2002,
Demsetz and Strahan, 1997; Eden and Moriah, 1996; Cyree et al., 2000). Shiers (2002)
and Demsetz and Strahan (1997) test the effects of geographic and economic diversity
and find that economic diversity reduces bank risk and branching reduce bank risk as
well. Eden and Moriah (1996) assess the contribution of internal auditing on branch bank
performance for organizational effectiveness and performance improve during the half
year following the audit in the experimental branches.
Avery et al. (1999) find that acquiring banks which have branch networking at the
same area as acquired banks reduce offices per capita and changes in the number of bank
offices per capita are more negative in low-income neighborhoods than in other
neighborhoods. They focus on the relationship between consolidation and changes in

4
levels of bank branching. They provide the historical statistics that the number of
branches masks differences across communities with differing characteristics; an increase
in the number of banking office in suburban areas is much higher than an increase both
urban and rural areas during 1975 to 1995. They also mention factors which affected
branch pattern.
Cerutti et al. (2007) examine the factors influencing international banks’
organizational form; branches or subsidiaries. Their research suggests appropriate
variables to explain opening branches. Cyree et al. (2000) examine the determinants of
bank growth and suggest that larger banks and state-chartered banks are more likely to
branch in 1989-1994 time period. They also suggest some variables which affect the
growth choice including branch expansions.
Train (2003) interprets generalized extreme value (GEV) models, which were
developed by McFadden (1978), and a nested logit model as the most widely used
member of the GEV family. He suggests that a nested logit model is appropriate when a
decision maker has to choose one from a set of alternatives, and this set can be divided
into subsets, called ‘nests’.3 This model has been applied by many researchers in a variety
of fields, including transportation, education, household consumption, telecommunication
(Montgomery, 2002; Lee, 1999; Ansari, Bawa and Ghosh,1995; Hensher and Greene,
2002). Montgomery (2002) uses a nested logit model of the determinants of choice of a
graduate business school. This study employs the structure of the decision model in his
study which has two-level nesting structure.
3 IIA holds within each nest and IIA does not hold in general for alternatives in different nests.

5
Data
The data employed to analyze the characteristics of commercial banks in the U. S. are
taken from the Call and Income Report of Federal Reserve and the Summary of Deposit
of Federal Deposit Insurance Corporation (FDIC). For the analysis of the branch
expansion, the sample is taken from the Federal Reserve for insured commercial banks
and FDIC for branch-level bank data. For the analysis, five-quarter averages from the
Call and Income Report of FDIC are used. Since five-quarter average reduces the effects
of seasonality on data like deposit, agricultural loans and other loans, this study employs
this averaging method (Ellinger and Neff, 1993).
Rural banks in this study are defined as those banks located outside of a
metropolitan statistical area (MSA), a city with a population of more than 50,000 people
or an urbanized area of at least 50,000 with a total metropolitan population of at least
100,000. In this study, agricultural loans are defined as the sum of loans secured by farm
real estate plus loans for agricultural production.
The Economic Research Service (ERS) developed a set of county-level typology
codes that captures differences in economic and social characteristics; farming-
dependent, mining-dependent, manufacturing-dependent, federal/state government-
dependent, services-dependent, and nonspecialized. The classification of metropolitan
area and nonmetropolitan area was originally completed in 2002 and results were
published in Rural America. Only counties that were classified as nonmetropolitan area
by the 1990 census were classified. The classification was updated for this typology by
coding the metro counties in 1990 that changed to nonmetropolitan status in 2000. The
county-level population growth rates are also taken from the ERS.

6
In order to obtain the branch expansion data, the number of branches opened in
rural and urban areas is estimated using the Call and Income Report of Federal Reserve
and Summary of Deposit of FDIC in 2003 and 2006. By investigating the changes in the
number of branches from 2003 to 2006, this number can be estimated.4
Empirical model
A nested logit model is the most widely used member of the generalized extreme value
(GEV). The main attribute of GEV models is that the unobserved portions of utility for
all alternatives are jointly distributed as a generalized extreme value. This model is an
appropriate model when the set of alternatives faced by a decision maker can be
partitioned into subsets, called ‘nests’. The nested logit model allows testing the
appropriateness of the hierarchical structure and the effects of the explanatory variables
on the expansion decision and regional choice. It is attractive because it relaxes the strong
assumptions of the multinomial or conditional logit model. In addition, it is
computationally straightforward and fast compared to the other discrete choice models
due to a closed form expression for the likelihood function (Train, 2003).
The determinants of branch expansion in rural areas are a primary goal of this
study. The decision for branch expansion has a two-level nesting structure. First a bank
decides whether to open a branch or not. If it decides to open a branch, it chooses among
one set of available locations. A nested logit model is used for this study. The tree
diagram for the banks’ expansion choice is given in Figure 1. The tree consists of two
4 Because of the limitation of the data, a bank which opened a new branch in certain rural area but close one
in other rural area was not counted in this estimation. Unlike to the first data set, the second data set is the
changes in the number of branches from 2003 to 2006. If the study sets up a longer period, the changes can
be affected by a lot of other aspects, like time, regulation, policy etc which are not included in this study.

7
branches, labeled “branch expansion” and “no expansion”, and one of the branches
contains three twigs for the three alternatives within the subset.
In a nested logit framework the location choice model forms one nest, the branch
expansion model forms the other. Though estimated simultaneously, the structures of the
nests are quite different and are therefore discussed separately.
Figure 1. Tree diagram for expansion decision
The location choice model
The location choice is represented by a random utility model estimated by the
conditional logit technique introduced by McFadden (1973). The random utility model
approach assumes that a bank selects one option, location in this study, from among all of
the options in a so-called choice set. It is assumed that the bank chooses the option that
yields the highest utility.
Location
choice
No branch expansion
Branch
expansion
Rural Urban Both

8
The model assumes that if a bank i decides to open a branch, then it chooses
among j alternatives in location choice set. The utility of a bank i of expanding j location
can be expressed as;
(location )i ij ijU j Zβ ε= + , j=1, 2, 3 (1)
where Z is a vector of characteristics of the location. If a bank I decides to open a branch
in a location j, then it can be inferred that kjkUjU ii ≠∀> ),location ()location ( . The
specific error terms ),,( 1321 εεε ii are assumed to be random, independently distributed
variables with an extreme value distribution. According to McFadden (1973), the
probability that a bank I chooses location j is given by
3
1
( chooses location )ijZ
Zij
j
eP i j
e
β
β=
=∑
(2)
A single vector of parameters, β, is provided by estimating above equation. This vector
shows the effect of the location characteristics Z on the probability that this bank having
already decided to open a branch, will choose location j.5
The branch expansion model
The other nest in the nested logit is the model of the decision whether to open a
branch or not. In this model, it is assumed that the utility levels associated with the
branch expansion.
(branch expansion)i i iU Xγ µ= + (3)
5 Note that any variable that does not vary across locations drops out of the model.

9
The null choice in this logit model will be “no branch expansion”. In the branch
expansion model, the vector X contains characteristics of banks. With no branch
expansion as the null choice, the probability of expansion with a branch is
(a bank chooses branch expansion)1
t
t
X
X
eP i
e
γ
γ=+
(4)
Combining the location choice and branch expansion decisions
To estimate the location-choice model and branch expansion model jointly the
nested logit combines two probabilities, (2) and (4). The unconditional probability that a
bank i will choose to open a branch in location j is
( chooses location )
( chooses location chooses branch expansion) ( chooses branch expansion)
P i j
P i j i P i
=
×
That is, using (2) and (4),
3
1
( chooses location )1
ij t i
t i
Z X I
X IZij
j
e eP i j
ee
β γ σ
γ σβ
+
+
=
= × + ∑ (5)
where ( )3
1log ijZ
i jI e
β
== ∑ . This new variable, called the inclusive value, represents the
utility associated with having available all of the locations in branch expansion choice
set. If the coefficient of the inclusive value, σ, is zero, then equation (5) will reduce to the
unconditional probability of choosing location j times the probability of the branch
expansion. In this case, the choice of whether or not to expand through opening a branch
is independent of the utility value of the options in the location choice set. With the
probability of observed choices from (5), a likelihood function can be constructed.

10
Estimation of the parameters
The parameters, β, γ, σ, of a nested model can be estimated by standard maximum
likelihood techniques. An explicit function of the parameters of this model can be derived
by substituting the choice probabilities of a nested logit formula into the log-likelihood
function. However, instead of using a maximum likelihood function, a nested logit model
can be estimated consistently in a sequential estimation, that is, estimated two separated
models. This sequential estimation is performed from “lower level”, that is, the lower
models for the choice of alternative within a nest are estimated first. Then the upper
model for choice of nest is estimated with the inclusive value entering as explanatory
variables. The inclusive value is calculated for each lower model using the estimated
coefficients.
Variables
The Location Choice Model
A discussion of the variables and the expected impact of each of the variables on
the probability a bank will choose a particular expansion strategy is shown below. The
location choice model includes characteristics of specific location as explanatory
variables; Herfindahl and Hirschman Index (HHI), Location of head office, Population
growth rate (county), Deposit growth rate (county), county typology code.

11
HHI is used for a proxy for the bank competition.6 Since there is a negative
relationship between competition and concentration, this study uses HHI as a measure of
competition, even though HHI is used as a measure of concentration. Based on previous
studies (Berger et al. 1993, Berger 1995), HHI has a positive relationship with
inefficiency and does not necessarily predict the ability to overcome operating
inefficiency. Thus banks that have high concentration, that is, banks with low
competition are less likely to open a branch due to inefficiency of those banks. In
addition, since the banking industry in rural areas is often less competitive and very
concentrated (Collender, 1996), it is less likely to open a branch in rural area than in
urban area.
Deposit growth rate for each county reflects the changes in an availability of
loanable funds, and population growth rate can be used as proxy for the changes in the
expected demand and supply for the funds in each county. Cheng et al. (1989) find
acquiring banks pay significantly higher premiums for banks with higher deposit growth
rate. It is inferred that more banks want to expand at the higher deposit growth rate area.
Thus, financial institutions are expected to open branches in rural area since rural area
has higher county-level population growth rate and county-level deposit growth rate a
given period.
The location of a head office affects the decision for the location choice. It is easy
to understand the local financial market and provide more specific services for rural
6 Herfindahl- Hirschmann Index (HHI) shows a degree of concentration of banking market m.
∑=
=n
i
iAHHI1
2, where iA represents the percentage of deposit share of i-th bank in a banking market in
which total of n banks are operating. Higher HHI means that there are few banks in a certain area and they
are in less competitive market while lower HHI means that there are a lot of banks and the market is more
competitive.

12
based bank (Lee, 2002). Thus, if the head office of a bank is in rural area, then it is more
likely to open a branch to obtain profits in rural area rather than in urban area due to those
advantages for local financial market.
Characteristics of a county in which a head office is located affect the location
choice model. In order to analyze the relationship between a property in rural area and the
branch expansion, this study use a binary variable equal to one if a county is specialized
and depends on farming rather than other characteristics like manufacturing, services,
mining, etc. A bank in a farming-specified county has advantages for local market and
farm business because it has more information for the farm businesses and agricultural
lending, and therefore it is more likely to open a branch in same characterized county.
Branch expansion model
Bank variables are characteristics of banks, not location.7 The branch expansion
model includes the set of a bank’s characteristics; Assets, loan to deposit ratio, equity to
asset ratio, agricultural loan rate, ROA, MBHC, the number of branches.
Total assets of a bank reflect a size of the bank. Larger banks are more likely to
expand by opening branches since they have a lower expenditure as a proportion of assets
(Cyree et al. 2000). Thus, total assets can be expected to positively affect the expansion
decision. Deposits are used in the x-efficiency literature (Berger and Humphrey, 1992).
They find that deposits have positive relation with total efficiency.8 Thus, the coefficient
of deposit to asset ratio for the branch expansion model is expected to be positive.
7 Location attributes affect the branch expansion decision through the inclusive value, as described in
previous section. 8 Cyree et al. (2000) assume that there is positive relationship between efficiency and bank growth.

13
Equity to asset ratio can be a measure of the capital position of the bank. Equity
capital can be another source of funds (Berger et al., 1996).9 In addition, as the proportion
of a bank’s equity capital increases the risk position of the bank declines and may
increase the impact of the bank to expand its portfolio and business. If equity to asset is a
source of liquidity for a bank anticipating growth activity, it is expected to have a positive
impact on the branch expansion.
As mentioned by Berger (1995), ROA, as a profit measure is standard in bank
research. Poor ROA leads a bank to enter into higher margin product expansion (Liang
and Savage, 1990) instead of opening a new branch. Thus ROA may have positive
relation with a branch expansion. Agricultural loan can be a factor to affect branch
expansion, especially in rural area. Agricultural loan rate is negatively correlated with
bank size and banks specialized in agricultural loans may experience higher profit
inefficiency (Neff et al. 1994). Since bank size positively affects bank expansion and
inefficiency has negative impact on bank expansion, it is expected to have a negative
impact on expansion decision.
MBHC is a binary variable that equals one if the bank is in a multi-bank holding
company and zero if the bank is a one-bank holding company. Multi-bank holding
companies have typically acquired banks in the past and maintain the acquired bank in
the holding company structure (Cyree, et al., 2000). Since MHBCs have more
competitive behavior and more flexible funds (Barry and Pepper, 1985), they are easier to
analyze local financial market and open a branch. Thus, it is expected to have a positive
impact on the branch expansion decision.
9 They use securities as a measure of ‘other assets’.
14
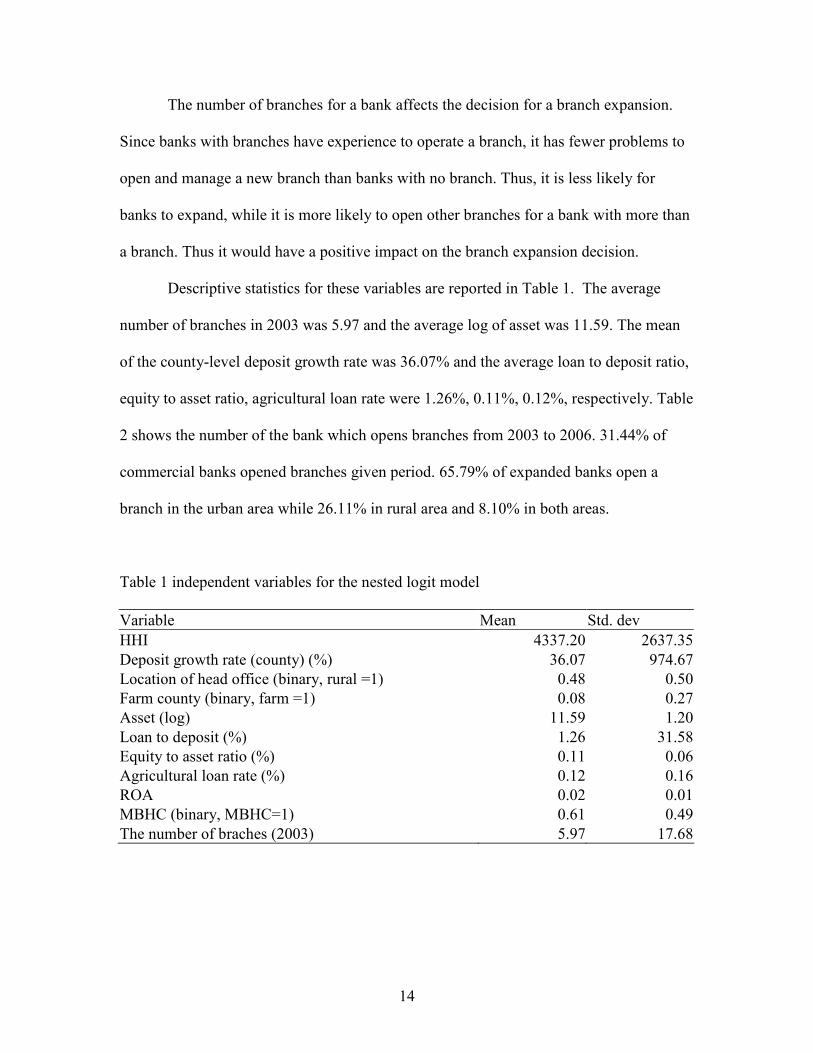
The number of branches for a bank affects the decision for a branch expansion.
Since banks with branches have experience to operate a branch, it has fewer problems to
open and manage a new branch than banks with no branch. Thus, it is less likely for
banks to expand, while it is more likely to open other branches for a bank with more than
a branch. Thus it would have a positive impact on the branch expansion decision.
Descriptive statistics for these variables are reported in Table 1. The average
number of branches in 2003 was 5.97 and the average log of asset was 11.59. The mean
of the county-level deposit growth rate was 36.07% and the average loan to deposit ratio,
equity to asset ratio, agricultural loan rate were 1.26%, 0.11%, 0.12%, respectively. Table
2 shows the number of the bank which opens branches from 2003 to 2006. 31.44% of
commercial banks opened branches given period. 65.79% of expanded banks open a
branch in the urban area while 26.11% in rural area and 8.10% in both areas.
Table 1 independent variables for the nested logit model
Variable Mean Std. dev
HHI 4337.20 2637.35
Deposit growth rate (county) (%) 36.07 974.67
Location of head office (binary, rural =1) 0.48 0.50
Farm county (binary, farm =1) 0.08 0.27
Asset (log) 11.59 1.20
Loan to deposit (%) 1.26 31.58
Equity to asset ratio (%) 0.11 0.06
Agricultural loan rate (%) 0.12 0.16
ROA 0.02 0.01
MBHC (binary, MBHC=1) 0.61 0.49
The number of braches (2003) 5.97 17.68

15
Table 2 Observations for the branch expansion by location.
Bank decision Frequency Percent
Rural area 654 8.21
Urban area 1648 20.68 Branch expansion
both 203 2.55
No expansion 5463 68.56
Empirical Results
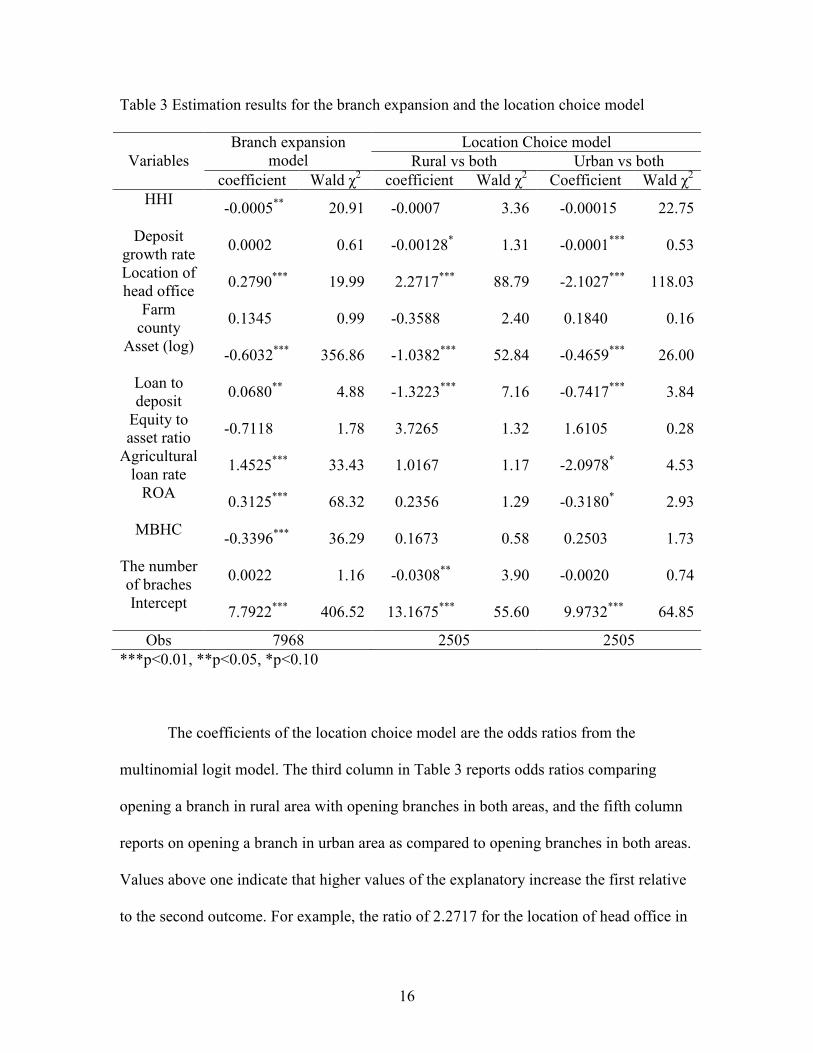
Table 3 presents the results of the branch expansion choice and for the location decision.
This study estimates the model step by step; first using a simple logit for expansion
decision, then a multinomial logit for location selection. Coefficients estimated by 2 step-
model have same signs and consistency comparing with the nested logit model. (Liao
1994, Lee et al. 2005)
In the branch expansion model, HHI has a significant and negative impact on the
expansion decision, that is, a bank in high concentrated area is less likely to open a
branch. Since the coefficient of location of head office is significant and positive, the
probability that a bank whose head office is located in rural area chooses a branch
expansion is higher than that of urban banks’ decision. Log of assets have a significant
and negative impact on the expansion decision which is an opposite result of this study’s
expectation. Loan to deposit ratio, agricultural loan rate, and profitability (ROA)
positively affect a bank’s expansion decision. A bank with higher ratios mentioned above
is more likely to choose a branch expansion. The coefficient of MBHC is significant and
negative. This means that the probability that a multibank holding company chooses a
branch expansion is higher than that of a non-MBHC. The county-level deposit growth
rate, farm-specified county, equity to asset ratio, and the number of branch are not
significant for the branch expansion model.
16
Table 3 Estimation results for the branch expansion and the location choice model
Location Choice model Branch expansion
model Rural vs both Urban vs both Variables
coefficient Wald χ2
coefficient Wald χ2
Coefficient Wald χ2
HHI
-0.0005
** 20.91 -0.0007 3.36 -0.00015 22.75
Deposit
growth rate 0.0002 0.61 -0.00128
* 1.31 -0.0001
*** 0.53
Location of
head office 0.2790
*** 19.99 2.2717
*** 88.79 -2.1027
*** 118.03
Farm
county 0.1345 0.99 -0.3588 2.40 0.1840 0.16
Asset (log)
-0.6032
*** 356.86 -1.0382
*** 52.84 -0.4659
*** 26.00
Loan to
deposit 0.0680
** 4.88 -1.3223
*** 7.16 -0.7417
*** 3.84
Equity to
asset ratio -0.7118 1.78 3.7265 1.32 1.6105 0.28
Agricultural
loan rate 1.4525
*** 33.43 1.0167 1.17 -2.0978
* 4.53
ROA
0.3125
*** 68.32 0.2356 1.29 -0.3180
* 2.93
MBHC
-0.3396
*** 36.29 0.1673 0.58 0.2503 1.73
The number
of braches 0.0022 1.16 -0.0308
** 3.90 -0.0020 0.74
Intercept
7.7922
*** 406.52 13.1675
*** 55.60 9.9732
*** 64.85
Obs 7968 2505 2505
***p<0.01, **p<0.05, *p<0.10
The coefficients of the location choice model are the odds ratios from the
multinomial logit model. The third column in Table 3 reports odds ratios comparing
opening a branch in rural area with opening branches in both areas, and the fifth column
reports on opening a branch in urban area as compared to opening branches in both areas.
Values above one indicate that higher values of the explanatory increase the first relative
to the second outcome. For example, the ratio of 2.2717 for the location of head office in

17
the third column indicates that the relative probability that a bank whose head office is
located in rural area opens a branch in rural area is 127% higher than the probability
which that bank opens branches in both areas.
The county-level deposit growth rate, location of head office, log of assets, loan to
deposit ratio are significant determinants of location choice model. The impacts of
agricultural loan rate and ROA on the relative odds for branch expansion in urban area
and that in both areas are significant and negative. The number of branches also has a
negative impact on the relative odds for a location choice decision between rural area and
both areas. HHI, farm-specified county, equity to asset ratio, MBHC and the number of
branch are not significant for the location choice model.
The coefficients of the location of head office have different signs in two relative
odds (the third column and the fifth column). This indicates that a bank whose head
office is located in rural area is more like to open a branch in rural area while an urban
bank is more like to open branches in both areas rather than in urban area. Since the
coefficients of deposit growth rate, log of asset and loan to deposit ratio are negative,
banks with higher deposit growth rate or higher loan to deposit ratio or larger assets are
more likely to open branches in both areas rather than in a rural or in urban area. Since
agricultural loan rate and ROA have negative coefficients in relative odds for urban
expansion versus urban and rural expansion, the probability of banks that banks with
higher profit or larger agricultural loan rate open branches in urban area is smaller than
the probability to open a branch in urban area. The number of branches has a negative
impact and thus banks with many branches are more likely to open branches in both areas
rather than in rural area.

18
The signs and significance of the coefficients in the branch expansion model have
standard interpretation, while the magnitudes of the coefficients can not be explained.
The marginal effect will provide interpretation for the effect of a unit change in
independent variable on the dependent variable. The marginal effect which is an elasticity
of probability of choosing location of a bank with respect to variables is shown Table 4.
The marginal effects are calculated by following equations.
( )( )
+∂∂
=∂
=∂
∑ ∑∑
−
= =
=1
1 1
1
exp1
exp)Pr(J
j
K
k kjk
K
k kjk
kk x
x
xx
jy
β
β
Let ( )∑ ==Λ
K
k kjk x1exp β , then
∑−
=Λ+
Λ===
1
11
)Pr(J
j
jPjy
( )∑
∑−
=
−
=
−=
Λ+
Λ∂∂
=∂
=∂
1
1
1
1
1
)Pr(
j
j jkjjkj
J
jkk
PP
xx
jy
ββ
(6)
Table 4 Marginal effects of the model
Location Choice model Variables
Branch expansion
model Rural vs both Urban vs both
HHI 0.0000 0.0000 0.0000
Deposit growth rate 0.0000 -0.0002 0.0001
Location of head office 0.0696 0.5810 -0.6901
Farm county 0.0336 -0.1154 0.1177
Asset (log) -0.1505 -0.0877 0.0392
Loan to deposit 0.0170 -0.0932 0.0212
Equity to asset ratio -0.1776 0.3225 -0.1527
Agricultural loan rate 0.3624 0.4042 -0.5327
ROA 0.0780 0.0727 -0.0909
MBHC -0.0847 -0.0077 0.0276
The number of braches 0.0005 -0.0041 0.0034

19
Conclusion
The main objective of this study is to identify the financial and market characteristics of
commercial banks’ branch expansion decision. The nested logit model is used to analyze
the characteristics to affect the expansion decision and location choice of commercial
banks due to a two-level nesting structure for branch expansion decision. Using the Call
and Income Report of Federal Reserve and the Summary of Deposit of FDIC, the
changes in the number of branches and independent variables are estimated for this
analysis.
The results indicate that most of characteristics chosen for this study are
significant for the branch expansion model except county-level deposit growth rate, farm-
specified county, equity to asset ratio and the number of branches in 2003. Location of
head office, loan to deposit ratio, agricultural loan rate, and profitability have positive
impact on the decision for the branch expansion while HHI, log of asset, and MBHC
affect negatively.
For the location choice model comparing banks opening a branch in rural area and
that in both areas, a bank whose head office is located in rural area is more likely to open
a branch in rural area instead of in both areas. The probability that banks with high
deposit growth rate, assets, loan to deposit ratio or more branches open branches in rural
area is less than the probability that those open branches in both areas. However, banks
with high deposit growth rate, asset, loan to deposit ratio, agricultural loan rate, ROA and
rural head office are more likely to open branches in both areas rather than in urban area.
These results suggest that bank size, structure and market characteristics are
affecting bank expansion choice since the assets of commercial banks, financial ratios,

20
MBHC and market concentration rate are determinants of the branch expansion decision
model. The importance of bank expansion decision and location choice models is more
likely to increase recently because commercial banks are globalizing, and adopting
improved technologies including internet banking, and markets are competitive. As banks
are more easily to open a branch across state lines due to the Reigle-Neal Act of 1994,
branch expansion becomes important. The further study should be provided to develop
more specific reasons why the number of branches in the US keeps increasing while that
in other countries declining.

21
References
Amel, D.F. and J.N. Liang, “Determinants of entry and profits in local banking markets,”
Review of Industrial Organization, 12 (1997): 59-78
Ansari, A., K. Bawa, and A. Ghosh, “ A nested logit model of brand choice incorporating
variety a seeking and marketing mix variables,” Marketing Letters 6 (1995): 199-
210
Avery, R.B, R.W. Bostic, P.S.Calem, and G.B.Canner, “Consolidation and bank
branching patterns,” Journal of Banking and Finance, 23 (1999): 497-532
Berger, A.N. and D.B. Humphrey, “Magamergers in banking and the use of cost
efficiency as an antitrust defense, Antitrust Bulletin 37 (1992): 541-600
Berger, A.N., “The profit-structure relationship in banking-test of market power and
efficient-structure hypotheses,” Journal of Money, Credit and Banking 27
(1995):404-431
Berger, A.N., D. Hancock and D.B. Humphrey, “Bank efficiency derived from the profit
function,” Journal of Banking & Finance 17 (1993):317-347
Berger, A.N., D.B. Humphrey and L.B. Pulley, “Do consumers pay for one-stop banking:
Evidence from and alternative revenue function,” Journal of Banking & Finance
20 (1996):1601-1621
Berger, A.N., R. J. Rosen and G.F. Udell, “Does market size structure affect competition?
The case of small business lending,” Journal of Banking & Finance 31 (2007):
11-33
Cerutti, E., G.D. Articcia, and M.S.M. Pería, “How banks go aborad: Branches or
subsidiaries?” Journal of Banking and Finance, 31 (2007): 1669-1692
Cheng, D. C., E.E., Gup and L.D. Wall, “Financial determinans of bank takeovers,”
Journal of Money, Credit and Banking 21 (1989):524-536

22
Collender, R. “Can Federal action improve efficiency in the market for farm loans?”
ERS Agriculture Information Bulletin No. 724-01, 1996
Cyree, K.B., J.W. Wansley, and T.P. Boehm, “Determinants of bank growth choice.”
Journal of Banking & Finance, 24 (2000):709-734
Demsetz R.S. and P.E. Strahan, “Diversificaion, size and risk at bank holding
companies,” Journal of Money, Credit, and Banking 29 (1997): 300-313
Eden, D and L. Moriah, “Impact of Internal Auditing on Branch bank performance: A
Field Experiment,” Organizational Behavior and Human Decision Process, Vol
68. No. 3(1996): 262-271
Ellinger P.N. and D.L. Neff, “Issues and approaches in efficiency analysis of agricultural
banks,” Agricultural Finance Review 53 (1993): 82-99
Hensher, D.A. and W.H. Greene, “Specification and estimation of the nested logit model:
Alternative normalizations,” Transportation Research Part B 36 (2002): 1-17
Hirtle, B. and K.J. Stiroh, “The return to retail and the performance of US banks,”
Journal of Banking & Finance 31(2007): 1101-1133
Hirtle, B., “The impact of network size on bank branch performance,” Journal of
Banking and Finance 31 (2007): 3782-3805
Lee, B., “Calling patterns and usage of residential toll services under self selecting
tariffs,” Journal of Regulatory Economics, 16 (1999): 45-81
Lee, S., “Banking profitability, competition, efficiency and specialization in rural
banking markets.” Ph.D. Dissertation, University of Illinois, 2002.
Lee, S., S. Min, J. Park and S. Yun, “The practice on Logit & Probit model,” Park Young
Sa (2005) (Korean)
Liang, N. and D.T. Savage, “New data on the performance of nonblank subsidiaries of
bank holding companies.” Federal Reserve Staff Studies (1990): 1-12
Liao, T.F., “Interpreting probability models; Logit, Probit, and other generalized linear
models,” Quantitative Application in the Social Science, Sage Publication (1994)
McFadden, D., “Modeling the choice of residential location,” Transportation Research
Record 672, National Research Council, Washington, DC (1978): 72-77
23
Montgomery, M., “A nested logit model of the choice of a graduate business school,”
Economics of Education Review 21 (2002): 471-480
Neff, D.L., B.L. Dixon and S. Zhu, “Measuring the efficiency of agricultural banks,”
American Journal of Agricultural Economics 76 (1994): 662-668
Orlow, D.K., L.J. Radecki, and J. Wenninger, “Ongoing restructuring of retail banking,”
Federal Reserve Bank of New York, Research paper No. 9634.
Schaffnit, C., D. Rosen, and J.C. Paradi, “Best practice analysis of bank branches: An
application of DEA in a large Canadian bank,” European Journal of Operational
Research, Volume 98, Issue 2, 16(1997): 269-289
Shiers, A.F., “Branch banking, economic diversity and bank risk.” The Quarterly Review
of Economic and Finance 42 (2002): 587-598
Spieker, R. “Bank branch growth has been steady: Will it continue?” FDIC Draft FOB
2004
Train, K.E., “Discrete choice methods with simulation,” Cambridge University Press
(2003)