Embed Size (px)
Citation preview

CIVIL & STRUCTURAL ENGINEERING CONSULTANTS Suite 27, 6 Saint Lucia Avenue, Kingston 5 Tel 876 – 754-2154/5 Fax 754-2156 Email [email protected]
NEW HARBOUR III HOUSING DEVELOPMENT BRAMPTON FARMS, ST. CATHERINE
FCS # 0853/76/C
ENGINEERING REPORT GENERAL DRAINAGE (PRELIMINARY)
PREPARED FOR GORE DEVELOPMENTS LIMITED
2C BRAEMAR AVENUE KINGSTON 10
JUNE 2009

GORE DEVELOPMENTS LIMITED NEW HARBOUR III HOUSING DEVELOPMENT
1
Table of Contents
1.0 OVERVIEW ................................................................................................................................. 1
2.0 DRAINAGE CRITERIA ............................................................................................................. 2
DESIGN STORM EVENT .......................................................................................................... 2
METHOD OF DETERMINING DESIGN PEAK FLOWS ................................................. 3
STORM SEWERS .................................................................................................................... 4
EROSION CONTROL ............................................................................................................ 6
3.0 DRAINAGE DESIGN ................................................................................................................. 6
PREDEVELOPMENT CONDITION ........................................................................................ 6
ESTIMATE OF PREDEVELOPMENT SURFACE RUNOFF ............................................... 8
ESTIMATE OF POST DEVELOPMENT SURFACE RUNOFF ........................................... 9
4.0 CONCLUSION .......................................................................................................................... 13
1.0 OVERVIEW

GORE DEVELOPMENTS LIMITED - NEW HARBOUR III DEVELOPMENT
1
Foreman Chung and Sykes Consultants Limited was retained by Mr. Christopher Gore of Gore Developments Limited to prepare infrastructure designs including drainage designs for the proposed subdivision. Gore Developments Limited intends to develop approximately 80 hectares of lands south of the New Harbour Village Housing Estate and east of Old Harbour Bay Main Road as a housing development. The location of the proposed development is shown in Figure 1. The development lands are located on the Old Harbour Bay flood plains. The area was once farmed but is now overgrown with brush and grass.
Figure 1 BRAMPTON SUBDIVISION LOCATION PLAN
PROPOSED BRAMPTON SUBDIVISION

GORE DEVELOPMENTS LIMITED - NEW HARBOUR III DEVELOPMENT
2
2.0 DRAINAGE CRITERIA DESIGN STORM EVENT The Jamaica Institution of Engineers recommended “Guidelines for the design and Construction of Housing Infrastructure” Vol 1: 1984 Storm Water Drainage recommends that the design storm frequency of storm sewers be 2 years and for culverts, bridges and flood control projects a minimum of 10 years. In the Standard Handbook for Civil Engineers by Merritt, Loftin and Ricketts article 14.9 states “Flooding problems and surface drainage as concerns of community and regional planning studies, differ primarily in degree of severity. The principal concern with flooding is the desire to avoid injury and loss of life and reduce property damages caused by major floods (those having a recurrence interval of 25 to 100 years). Surface-drainage systems on the other hand are primarily concerned with convenience and providing access to property in relatively minor storms (those having a recurrence interval of 2 to 10 years)”. Investigations will be conducted for the 1 in 25 year event for the main drainage channels and 1 in 10 year event for the subdivision drains. The FHWA HEC 22 recommendation is shown in Table 4-1 below and will be used for the designs.
Road Classification Design Frequency Design Spread < 70 km/hr (45 mph) 10-year Shoulder + 1 m (3 ft) > 70 km/hr (45 mph) 10-year Shoulder Sag Point 50-year Shoulder + 1 m (3 ft)
< 70 km/hr (45 mph) 10-year 1/2 Driving Lane > 70 km/hr (45 mph) 10-year Shoulder Sag Point 10-year 1/2 Driving Lane
Low ADT 5-year 1/2 Driving Lane High ADT 10-year 1/2 Driving Lane Sag Point 10-year 1/2 Driving Lane
FHWA HEC-22
Table 4-1. Suggested Minimum Design Frequency and Spread.
High Volume or Divided or Bi-Directional
Collector
Local Streets

GORE DEVELOPMENTS LIMITED - NEW HARBOUR III DEVELOPMENT
3
METHOD OF DETERMINING DESIGN PEAK FLOWS 1. For drainage areas less than 200 acres, the design engineer shall use the Rational
Method (Q=CIA) procedure for determining runoff flow. For drainage areas between 200 and 2,000 acres, the design engineer shall use the most recent NRCS Method, for determining runoff rates.
2. Drains to be sized to FHWA Hydraulic Engineering Circular No 22 – Urban Drainage Design HEC – 22.
3. Culverts to be sized and conform to FHWA-NHI-01-020-HDS 5 (Hydraulic Design
Series No 5 )– Hydraulic design of highway culverts – Second Edition. The calculation for peak runoff using the rational method is set out below: Q = C i A x 1/Ku Where: Q = Flow, m3/s (ft3/s) C = coefficient of runoff (dimensionless) i = rain intensity mm/hr (in/hr) A = drainage area, hectares, ha (acres) Ku = units conversion factor 360 (1 in English units)) The runoff coefficients by hydraulic soil group and slope range used in the rational method were developed by Rawls et al. as shown in table 7.6 in the standard handbook of environmental engineering (by Robert Corbitt). The proposed development is located south of the town of Old Harbour and the rain data for that town is used to estimate the rain intensity for the project (see Table 1.0). Table 1.0 Rainfall Data Old Harbour rainfall Data24 hr Return mm/day
1 in 2 yr 105
1 in 5 yr 164
1 in 10 yr 203
1 in 25 yr 252
1 in 50 yr 2881 in 100yr 324

GORE DEVELOPMENTS LIMITED - NEW HARBOUR III DEVELOPMENT
4
STORM SEWERS The storm sewer system being the buried drainage conveyance system below the roadway pavement will be designed to convey a 1:10 year storm without surcharging. The discharge of the storm sewers is mostly to paved drains and positive drainage will be maintained in the design. Minimum cover will be to the manufacturers’ specifications. Open Drains The open drains will be used where possible and erosion protection using both rigid and flexible linings will be used in the design. CALTRANS Highway Design Manual chapter 860 Open Channels will be used to guide the designs. The maximum velocity for unlined channels in table 862.2 is used to guide the designs.
Type of Material in Excavation Section Intermittent Flow Sustained FlowFine Sand (Noncolloidal) 0.8 0.8Sandy Loam (Noncolloidal) 0.8 0.8Silt Loam (Noncolloidal) 0.9 0.9Fine Loam 1.1 1.1Volcanic Ash 1.2 1.1Fine Gravel 1.2 1.1Stiff Clay (Colloidal) 1.5 1.2Graded Material (Noncolloidal) Loam to Gravel 2 1.5Silt to Gravel 2.1 1.7Gravel 2.3 1.8Coarse Gravel 2.4 2.0Gravel to Cobbles (Under 150 mm) 2.7 2.1Gravel and Cobbles (Over 200 mm) 3 2.4
Table 862.2
Recommended Permissible Velocities for Unlined Channels
Permissible Velocity (m/s)

GORE DEVELOPMENTS LIMITED - NEW HARBOUR III DEVELOPMENT
5
The manning’s roughness coefficients to be used in the evaluation of the design depth of flow is guided by table 863.3a shown below.
Type of Channel n valueUnlined Channels: Clay Loam 0.023 Sand 0.02 Gravel 0.03 Rock 0.04Lined Channels: Portland Cement Concrete 0.014 Air Blown Mortar (troweled) 0.012 Air Blown Mortar (untroweled) 0.016 Air Blown Mortar (roughened) 0.025 Asphalt Concrete 0.018 Sacked Concrete 0.025Pavement and Gutters: Portland Cement Concrete 0.015 Asphalt Concrete 0.016Depressed Medians: Earth (without growth) 0.04 Earth (with growth) 0.05 Gravel 0.055
Average Values for Manning's Roughness Coefficient (n)Table 864.3A
Freeboard in the open drains will be guided by table 866.2 of the CALTRANS Highway Design Manual.
Table 866.2
Shape of Channel Subcritical Flow SupercriticalFlow
Rectangular 0.1 He 0.20 d
Trapezoidal 0.2 He 0.25 d
Where He = Energy head, in meters d = Depth of flow, in meters for a straight alignment
Guide to Freeboard Height
For rigid pavements the FHWA HDS 4 guidance will be used and for flexible linings FHWA HEC-15 will be used along with the CALTRANS guidelines.
GORE DEVELOPMENTS LIMITED - NEW HARBOUR III DEVELOPMENT
6
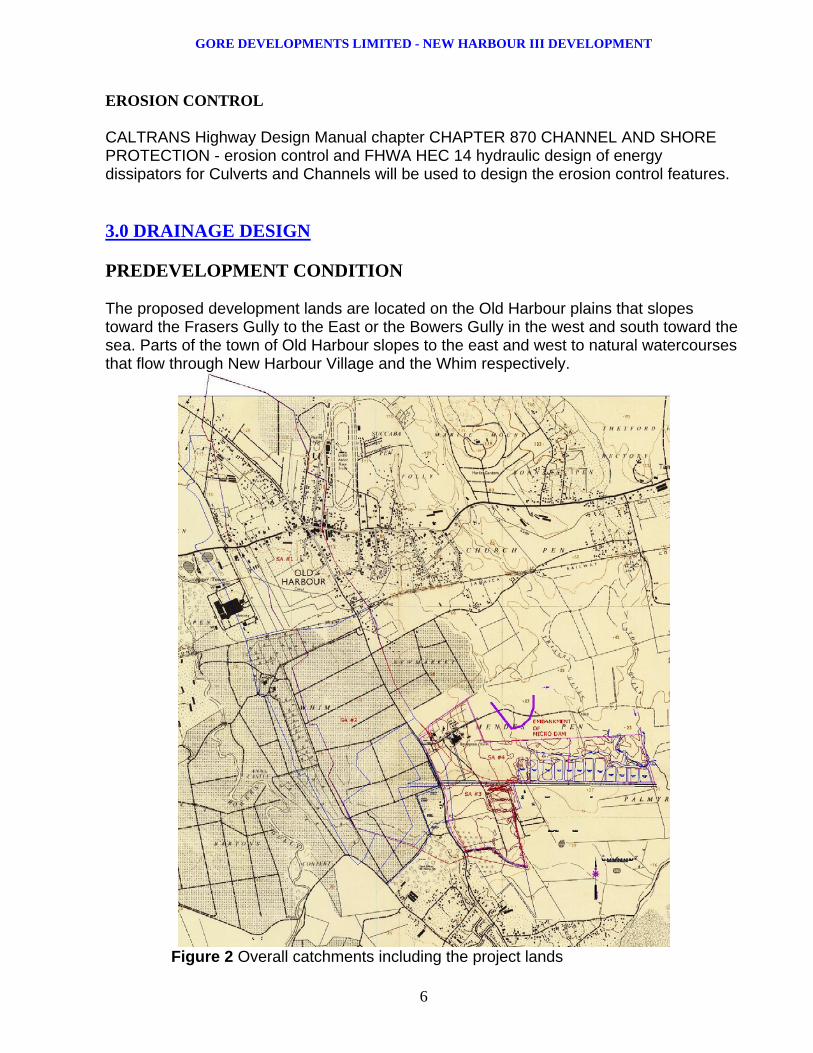
EROSION CONTROL CALTRANS Highway Design Manual chapter CHAPTER 870 CHANNEL AND SHORE PROTECTION - erosion control and FHWA HEC 14 hydraulic design of energy dissipators for Culverts and Channels will be used to design the erosion control features. 3.0 DRAINAGE DESIGN PREDEVELOPMENT CONDITION The proposed development lands are located on the Old Harbour plains that slopes toward the Frasers Gully to the East or the Bowers Gully in the west and south toward the sea. Parts of the town of Old Harbour slopes to the east and west to natural watercourses that flow through New Harbour Village and the Whim respectively.
Figure 2 Overall catchments including the project lands

GORE DEVELOPMENTS LIMITED - NEW HARBOUR III DEVELOPMENT
7
The watercourse that meanders through The Whim lands has been recently redirected eastward in an earth drain that is aligned south of the proposed Brampton subdivision sloping eastward toward the Old Harbour Bay lagoon. The western parts of the Brampton development lands fall southward towards the recently upgraded earth drain on the southern boundary.
Photo 1 Showing the eastern parts of the Brampton property. The eastern parts of the proposed subdivision fall toward the east and discharge surface flows into the Frasers Gully. Photo 1 shows the micro dam with the approximate location of the embankment shown as an overlay in Figure 2. This feature redirects the flows form eastern Old Harbour and New Harbour Village to the Frasers gully north of the proposed Brampton subdivision. The predevelopment land use is similar to that shown in Figure 3 below with one major difference is that New Harbor Village subdivision is now 95% completed.
Figure 3 Fairly recent satellite image showing predevelopment land use
PROPOSED BRAMPTON
DEVELOPMENT
PROPOSED WHIM
DEVELOPMENT
NEW NARBOUR VILLAGE

GORE DEVELOPMENTS LIMITED - NEW HARBOUR III DEVELOPMENT
8
ESTIMATE OF PREDEVELOPMENT SURFACE RUNOFF The predevelopment hydraulic soil group and that the ground cover evaluation is shown in Table 1.1. Table 1.1 AF ENG
Region: OLD HARBOUR Locale: SAINT CATHERINE
Sub-Area Land Use Condition Hydrologic Sub-Area CurveIdentifier Soil Area Number
Group (ha)SA-1 Brush - brush, weed, grass mix (good) C 63.39 65
Farmsteads C 50 82Total Area / Weighted Curve Number 113.39 72
SA-2 Brush - brush, weed, grass mix (fair) C 120 70SA-3 Brush - brush, weed, grass mix (fair) C 24.9 70SA-4 Brush - brush, weed, grass mix (fair) C 36 70
GDL BRAMPTON PRE-DEVELOPMENTType III rain distribution
Sub-Area Land Use and Curve Number Details
The estimated runoff from the subareas and discharge through the south drain and ultimately discharged through an east west channel into the Frasers Gully is shown in Table 1.2. Table 1.2 AF ENG GDL BRAMPTON PRE-DEVELOPMENT
Type III rain distributionRegion: OLD HARBOUR Locale: SAINT CATHERINE
Hydrograph Peak/Peak Time TablePeak Flow and Peak Time (hr) by Rainfall Return Period
Sub-Area 10-Yr 25-Yror Reach (cms) (cms)Identifier (hr) (hr)SA-1 12.76 16.69 12.73 22.81SA-2 12.33 25.36 12.33 34.98SA-3 12.61 3.85 12.61 5.32BRAMPTON EASTSA-4 12.66 5.57 12.61 7.69
REACHES 10-Yr 25-Yr(hr) (cms) (hr) (cms)
R1 12.76 16.69 12.73 22.81Down 13.25 11.21 13.15 16.26
R2 12.36 28.32 12.36 39.92Down 12.64 27.76 12.61 39.02
R3 12.64 31.61 12.61 44.33Down 12.67 31.54 12.64 44.25
OUTLET 31.54 44.25
BRAMPTON EASTR1 12.66 5.57 12.61 7.69Down 12.78 5.53 12.78 7.62
OUTLET 5.53 7.62

GORE DEVELOPMENTS LIMITED - NEW HARBOUR III DEVELOPMENT
9
ESTIMATE OF POST DEVELOPMENT SURFACE RUNOFF For the post development evaluation the subdivision was divided into various subareas. The proposed Whim development is slated to be constructed before the Brampton Development and most of the flows from that development will be directed westward toward the Bowers Gully. This significantly reduces the flow from the West into the Brampton south drain. Figure 4 shows the proposed redirected or post development catchment areas.
Figure 4 Proposed development land use

GORE DEVELOPMENTS LIMITED - NEW HARBOUR III DEVELOPMENT
10
The post development subareas sizes, land uses, and estimated runoff potential is shown in Table 1.4. Table 1.4 AF ENG
Type III rain distributionRegion: OLD HARBOUR Locale: SAINT CATHERINE
Sub-Area Land Use Condition Hydrologic Sub-Area CurveIdentifier Soil Area Number
Group (ha)SA-WS Open space; grass cover 50% to 75% (fair) C 25 79
Residential districts (1/8 acre) C 29.7 90Total Area / Weighted Curve Number 54.7 85
SA-BNW Residential districts (1/8 acre) C 29.5 90SA-BSW Residential districts (1/8 acre) C 25.4 90
Sub-Area Land Use and Curve Number Details
GDL BRAMPTON DEVELOPED
The subsequent post development flows that flow into the south drain and Frasers Gully are shown in Table 1.5. Table 1.5 AF ENG GDL BRAMPTON DEVELOPED
Type III rain distributionRegion: OLD HARBOUR Locale: SAINT CATHERINE
Hydrograph Peak/Peak Time TablePeak Flow and Peak Time (hr) by Rainfall Return Period
Sub-Area 10-Yr 25-Yror Reach (cms) (cms)Identifier (hr) (hr)SA-WS 12.69 10.88 12.66 14.01SA-BNW 12.33 8.82 12.34 11.14SA-BSW 12.35 7.61 12.33 9.63BRAMPTON EASTSA- BE 12.26 8.05 12.26 10.18
REACHES 10-Yr 25-Yr(hr) (cms) (hr) (cms)
Reach 1 12.69 10.88 12.66 14.01Down 12.69 10.86 12.72 13.98Reach 2 12.33 8.82 12.34 11.14Down 12.39 8.75 12.41 11.06
OUTLET 24.41 31.13
BRAMPTON EASTR1 12.26 8.05 12.26 10.18Down 12.36 7.89 12.34 9.95OUTLET 7.89 9.95
A drain and berm is proposed to be constructed to the north and east of the proposed housing areas that are closest to the Frasers Gully as an added storm water protection feature.

GORE DEVELOPMENTS LIMITED - NEW HARBOUR III DEVELOPMENT
11
Photo 2 Culverts in the watercourse to the south crossing the eastern parochial Road
The south drain in the pre development condition is expected to direct 44m3/s toward the existing parochial road crossing shown in Photo 2. The post development flow is anticipated to be 31m3/s. This reduction is due to the proposal to direct most of the runoff from The Whim property west to the Bowers Gully. The backwater effect from the culvert crossing the Gutters to Old Harbour Bay parochial road will be included in the drainage report for the subdivision review. METHOD OF DETERMINING DESIGN PEAK FLOWS FOR INTERNAL DRAINAGE SYSTEM 4. For drainage areas less than 200 acres, the design engineer shall use the Rational
Method (Q=CIA) procedure for determining runoff flow. For drainage areas between 200 and 2,000 acres, the design engineer shall use the most recent NRCS Method, for determining runoff rates. For drainage areas greater than 2,000 acres, or (800 hectares) the design engineer shall use the most recent WRA Regression methods or HEC HMS to estimate runoff rates.
5. Drains to be sized to United States Federal Highway Administration (FHWA) Hydraulic Engineering Circular No 22 – Urban Drainage Design HEC – 22.
6. Culverts to be sized and conform to FHWA-NHI-01-020-HDS 5 (Hydraulic Design
Series No 5 )– Hydraulic design of highway culverts – Second Edition.

GORE DEVELOPMENTS LIMITED - NEW HARBOUR III DEVELOPMENT
12
The calculation for peak runoff using the rational method is set out below: Q = C i A x 1/Ku Where: Q = Flow, m3/s (ft3/s) C = coefficient of runoff (dimensionless) i = rain intensity mm/hr (in/hr) A = drainage area, hectares, ha (acres) Ku = units conversion factor 360 (1 in English units)) Rain data is taken from the National Meteorological Service’s estimates of maximum 24 hour rainfall for selected return periods. This is converted to rainfall intensity by the following equation. i = 4.73 x R (12.25+D) 0.65 Where R = 24-hour rainfall. D = Duration of the design rainfall event equal to the time of concentration The runoff coefficients by hydraulic soil group and slope range used in the rational method were developed by Rawls et al. as shown in table 7.6 in the standard handbook of environmental engineering (by Robert Corbitt). Table 1.9 Maximum flow into drainage storm culverts of various sizes Qmax Units Min Storm Drain size at
0.5% slope0.42 m3/s 60cm Dia HDPE pipe0.77 m3/s 75cm Dia HDPE pipe1.25 m3/s 90cm Dia HDPE pipe
2.7 m3/s 120cm Dia HDPE pipe4.9 m3/s 150cm Dia HDPE pipe
GORE DEVELOPMENTS LIMITED - NEW HARBOUR III DEVELOPMENT
13
4.0 CONCLUSION The drainage approach outlined in this report uses standard methods of evaluating runoff potential and evaluating the hydraulic capacity of drains required to drain the proposed development to meet the criteria for sustainable residential communities. A minimum elevation within the housing areas is proposed to be 6.5m above MSL. The 50year water level in the Frasers Gully will be evaluated and included in the Brampton subdivision drainage report to reinforce the adequacy of the minimum finished elevation within the subdivision except for recreational areas. Low impact development measures are included in the internal drainage designs where storm drainage paths will be disconnected to allow for the maximum opportunity for infiltration to take place and to create storage along the drainage paths thereby reducing the downstream peak discharge and allowing for the optimising of drain sizes. Prepared by: Ivan Andrew Foreman P.E. AF Engineering prepared on behalf of Foreman Chung and Sykes Consultants Limited Checked by:
Lise M. Walter P.E. Senior Civil Engineer Foreman Chung and Sykes Consultants Limited DATE: June 23, 2009


![Minimising Harbour Siltation (MHS) - IZW - … below Chart Datum [m] Old Outer Harbour 100 kHz Old Outer Harbour 15 kHz New Outer Harbour 100 kHz New Outer Harbour 15 kHz Old Locks](https://img.pdfslide.us/doc/110x75/5aa108c67f8b9ac67a8b45ec/minimising-harbour-siltation-mhs-izw-below-chart-datum-m-old-outer-harbour.jpg)