Embed Size (px)
Citation preview

Brake Squeal Analysis
João G. P. da Silva – Fras-le
Érico R. Fulco – Fras-le
Paulo E. D. Variante – Fras-le
Vagner do Nascimento - Master
Fabiano N. Diesel - ESSS
Daniel Boniatti - ESSS

Introduction
Typical brake assembly
Brake disc develop friction
oscillations which are heard as “brake
squeal”

Introduction
There is three main categories of brake
noise:
Low frequency (100-1kHz) – Groan and
Moan noise
Low frequency (1k – 7kHz) – Coupling of
out of plane modes of rotor with bending
modes of pads
High frequency (8k – 16kHz) – Coupling of
in plane modes of rotor with bending
modes of pads

Disc
Gray Cast Iron
Young Modulus 110 GPa
Poisson’s Ratio 0.3
Mass Density 7800 kg/m³
CAD Model FEA Model

Experimental x Numerical Results – Disc
1273 Hz
1833 Hz
2326 Hz
2584 Hz
3115 Hz
3655 Hz
1260
1780
2320
2570
3260
3640

Friction Pad
Structural Steel
Young Modulus 210 GPa
Poisson’s Ratio 0.3
Mass Density 7700 kg/m³
Friction Material
Young Modulus 6 GPa
Poisson’s Ratio 0.2
Mass Density 1500 kg/m³

Experimental x Numerical - Pad
2424 Hz 7890 Hz
4697 Hz
9439 Hz 5768 Hz
10049 Hz
2560
4680
9640
6030
9270
7870

Workbench Setup
Geometry Pressure and Rotation Frequency
}0{}{][][ ii MK
)}({})]{([ uFuuK
2
ii

Workbench Setup
F
u
KT Where:
[KT] is the tangent stiffness matrix;
[KM] is the material stiffness matrix;
[SN] is the stress stiffness matrix;
[KL] is the loading stiffness matrix;
[KC] is the contact stiffness matrix, and;
[KSP] is the spin softening matrix.
][][][][][][ SPCLNMT KKKSKK
}0{}{][][ ii
T MK

Boundary Condition
X Displacement = 0
Y Displacement = 0
Z Displacement = Free
X Displacement = 0
Y Displacement = 0
Z Displacement = 0
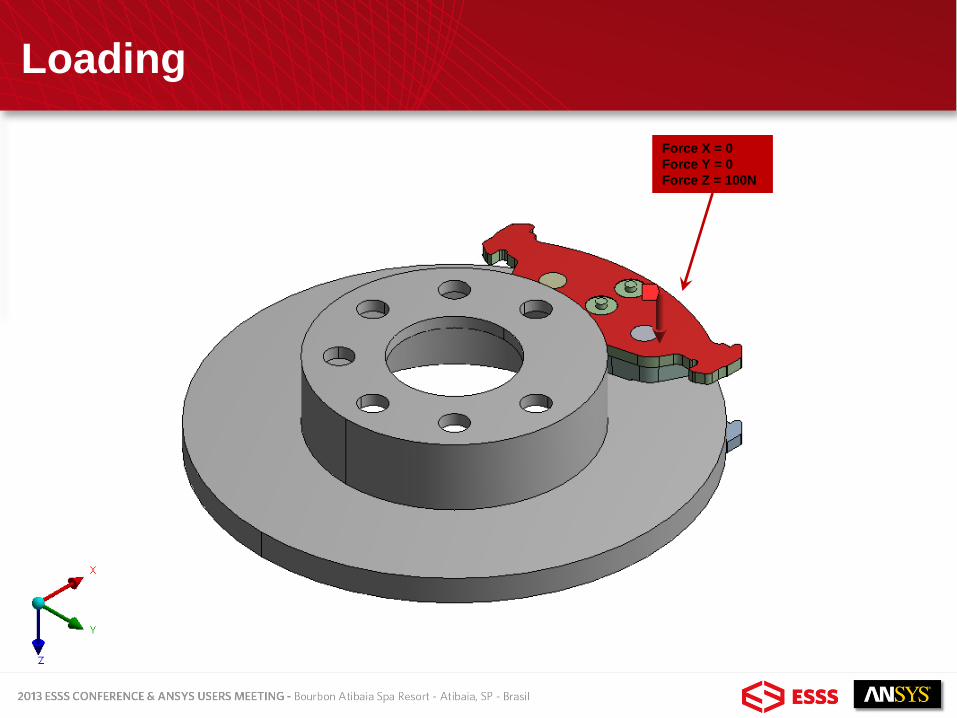
Loading
Force X = 0
Force Y = 0
Force Z = 100N
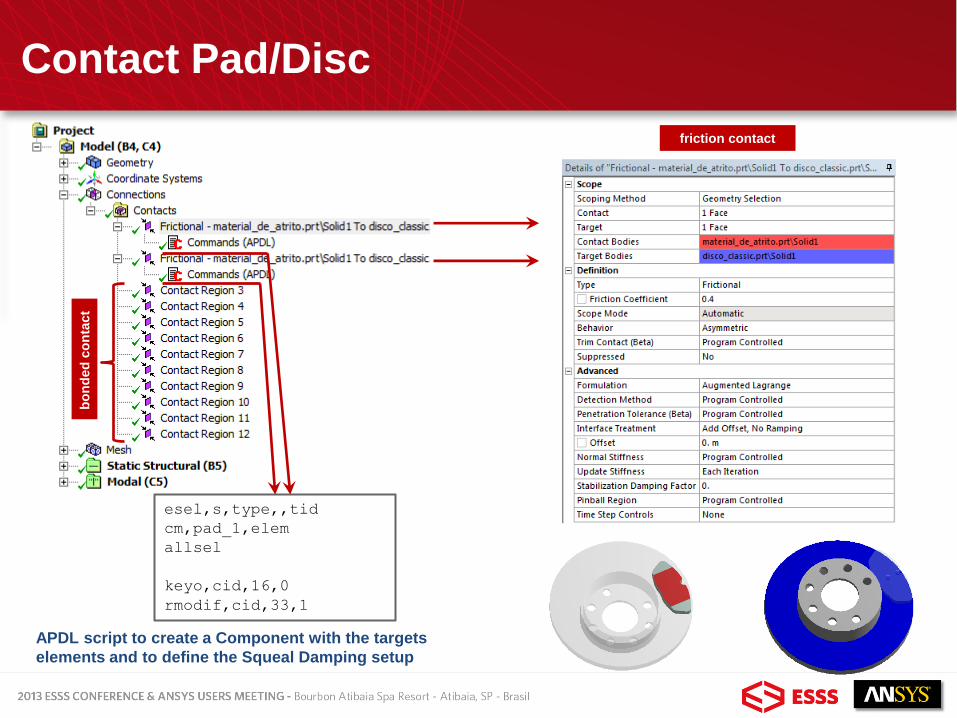
Contact Pad/Disc
friction contact
bo
nd
ed
co
nta
ct
esel,s,type,,tid
cm,pad_1,elem
allsel
keyo,cid,16,0
rmodif,cid,33,1
APDL script to create a Component with the targets
elements and to define the Squeal Damping setup

Static Analysis Setup
nropt,unsym
cmsel,s,pad_1
cmsel,a,pad_2
cm,e_pad,elem
allsel
cmrota,e_pad,,,1E-5
APDL applied at the first load step to
use Unsymmetric Newton-Raphson
Method and to create Component
with the targets elements of the
Frictional Contact.
APDL applied at the second load step
to define a rotation of the target
elements
Analysis with 2 load steps
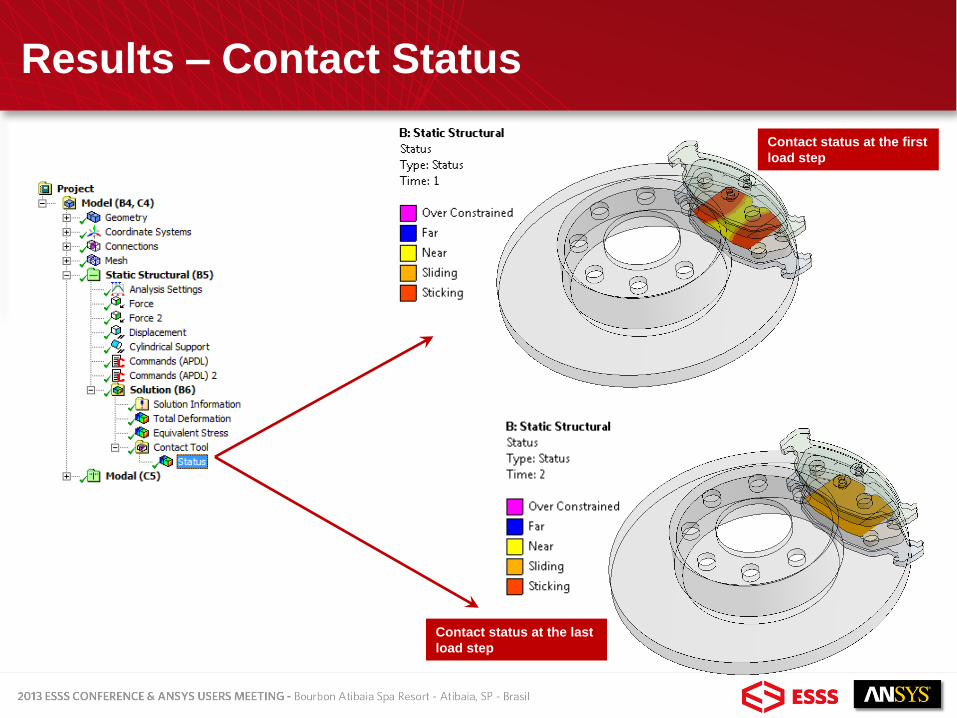
Results – Contact Status
Contact status at the first
load step
Contact status at the last
load step

Modal Analysis Setup
Pre-stress from the last time of the Static Analysis
Calculating 200 modes using QRDamped Method
}0{}{][][][ 2 iii
T MCK
iii j
Damped Frequency
Stability

Mode Stability
Evolution of the real and
imaginary part of eigenvalues
versus the damping ratio (η1/ η2)
and the friction coefficient ().
Black surface is stable mode and
white surface is unstable one.
Reference:
Sinou, Jean-Jacques and Jézéquel, Louis - Mode coupling instability in
friction-induced vibrations and its dependency on system parameters including
damping - European Journal of Mechanics - A/Solids, Volume 26, Issue 1,
January-February 2007, Pages 106-122
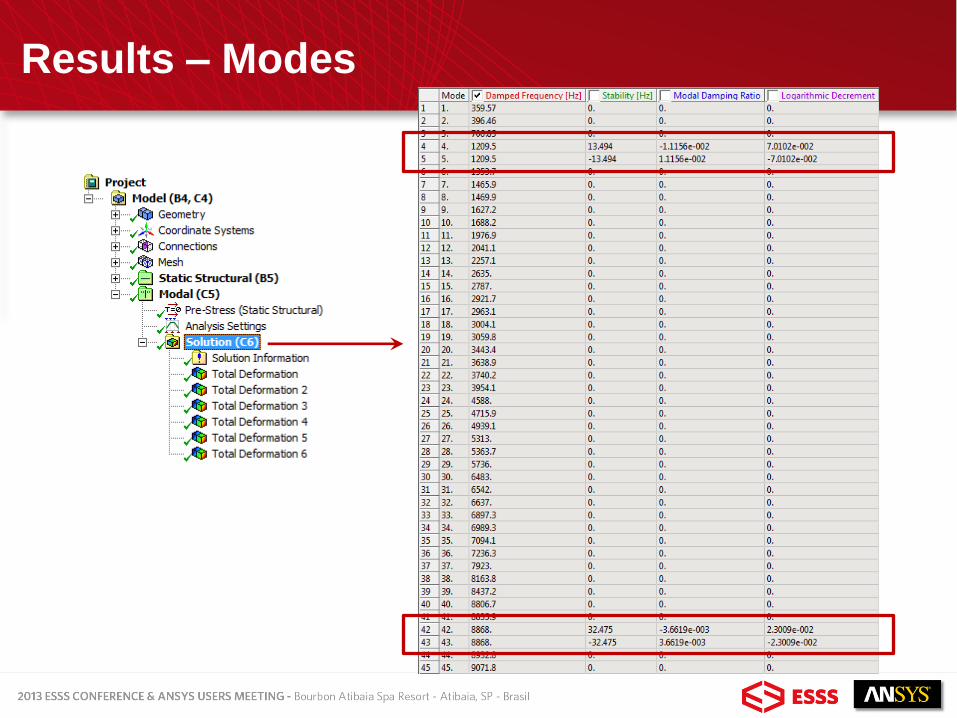
Results – Modes
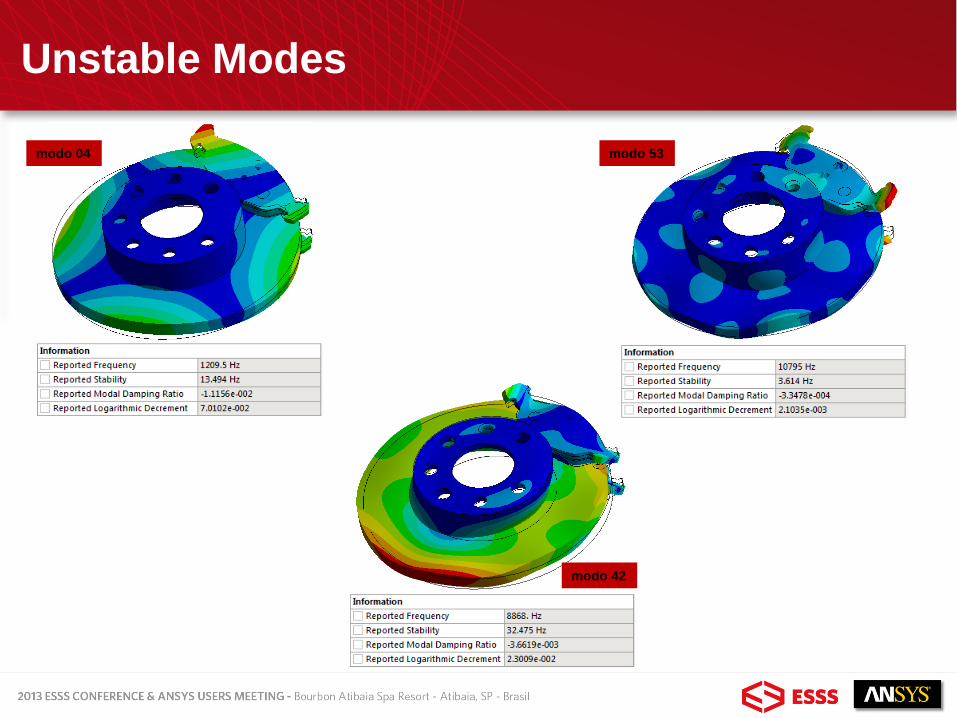
Unstable Modes
modo 04
modo 42
modo 53

Unstable Modes
modo 69
modo 106
modo 121

Experimental Analysis
Full scale brake dynamometer used in this study
Brake assembly of a test on the dynamometer
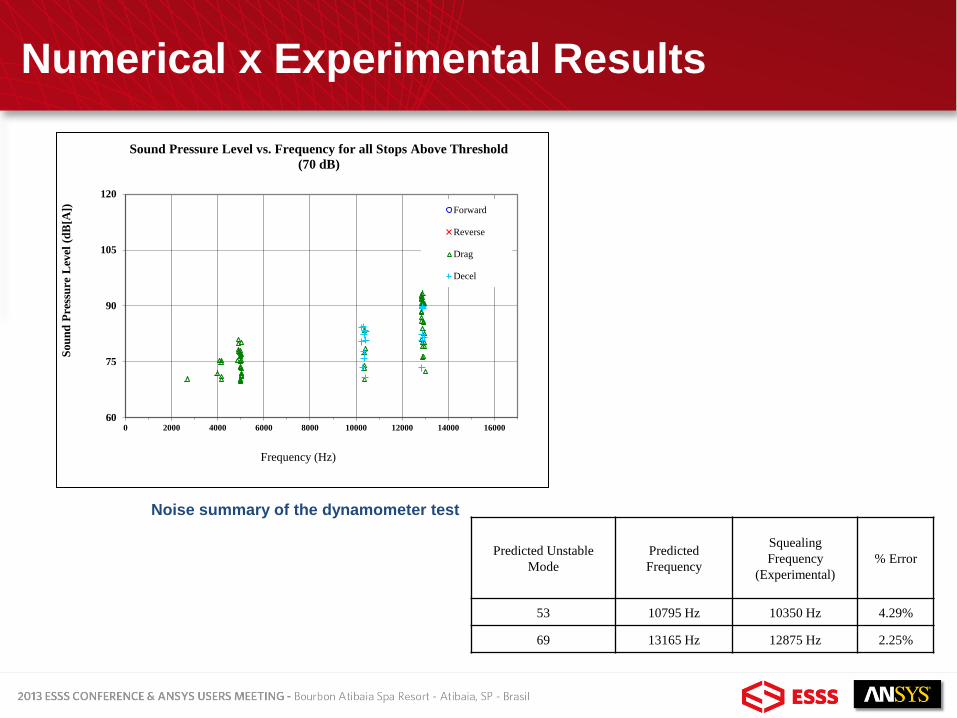
Numerical x Experimental Results
60
75
90
105
120
0 2000 4000 6000 8000 10000 12000 14000 16000
Sou
nd
Pre
ssu
re L
evel
(d
B[A
])
Frequency (Hz)
Sound Pressure Level vs. Frequency for all Stops Above Threshold
(70 dB)
Forward
Reverse
Drag
Decel
Predicted Unstable
Mode
Predicted
Frequency
Squealing
Frequency
(Experimental)
% Error
53 10795 Hz 10350 Hz 4.29%
69 13165 Hz 12875 Hz 2.25%
Noise summary of the dynamometer test
Summary / Conclusions
• In this frequency range, the error is around 4%;
• The lower frequencies occurrences were not predicted by the
numerical analysis, but this error can be attributed to the
simplified assumptions on the modeling;
• Further work to include the fastening conditions, spider and
caliper in the modeling will be addressed in the future