Embed Size (px)
Citation preview
B
Sa
b
a
ARRA
KFLNML
1
bmtsfHsca
cbwsvpioKsba
a
0h
Computerized Medical Imaging and Graphics 37 (2013) 568– 580
Contents lists available at ScienceDirect
Computerized Medical Imaging and Graphics
journa l h o me pag e: w ww.elsev ier .com/ locate /compmedimag
rain symmetry plane detection based on fractal analysis
.A. Jayasuriyaa,∗, A.W.C. Liewa, N.F. Lawb
School of Information and Communication Technology, Griffith University, Southport, QLD 4222, AustraliaDepartment of Electronic and Information Engineering, The Hong Kong Polytechnic University, Hung Hom, Kowloon, Hong Kong
r t i c l e i n f o
rticle history:eceived 3 October 2012eceived in revised form 12 April 2013ccepted 6 June 2013
a b s t r a c t
In neuroimage analysis, the automatic identification of symmetry plane has various applications. Despitethe considerable amount of research, this remains an open problem. Most of the existing work based onimage intensity is either sensitive to strong noise or not applicable to different imaging modalities. Thispaper presents a novel approach for identifying symmetry plane in three-dimensional brain magnetic
eywords:ractal analysisacunarityeuroimagingid-sagittal plane
ongitudinal fissure
resonance (MR) images based on the concepts of fractal dimension and lacunarity analysis which charac-terizes the complexity and homogeneity of an object. Experimental results, evaluation, and comparisonwith two other state-of-the-art techniques show the accuracy and the robustness of our method.
© 2013 Elsevier Ltd. All rights reserved.
. Introduction
Modern imaging techniques allow in vivo visualization of therain providing vast amount of anatomical and functional infor-ation. Especially, the advent of high quality neurological MRI has
he ability to produce three dimensional images with high soft tis-ue contrast. Precise clinical diagnosis and patient treatment canurther be supported by quantitative image analysis techniques.owever, despite the extensive research, visual interpretation is
till the common method used in clinical practice [1]. Anatomicalomplexity of the brain has made automated brain image analysis
particularly challenging task.A normal brain holds approximate bilateral symmetry. Highly
onvolved brain is separated into the left and right hemispheresy the inter-hemispheric fissure (IF) or the longitudinal fissure,hich is a long and deep furrow (see Fig. 1). Although the real
eparation surface is not perfectly planar, the plane that passesertically through this midline is considered to be the mid-sagittallane (MSP) which also aligns with the plane dividing the body
nto two symmetrical parts. The symmetry plane of the brain isften considered as a first-order approximation to the MSP [2].nowing the precise location of the MSP is an important initial
tep in neuroimage analysis, and is of great interest in a num-er of medical applications. For example, it helps in identifyingnatomical areas of interest for diagnosis, treatment and serves as∗ Corresponding author. Tel.: +61 7 555 28502; fax: +61 7 555 28066.E-mail addresses: [email protected] (S.A. Jayasuriya),
[email protected] (A.W.C. Liew), [email protected] (N.F. Law).
895-6111/$ – see front matter © 2013 Elsevier Ltd. All rights reserved.ttp://dx.doi.org/10.1016/j.compmedimag.2013.06.001
a basis for asymmetry study of the brain [3]. MSP can bring mul-tiple images into a common anatomical co-ordinate system likeTalairach–Tournoux [4] thus reducing the degrees of freedom inmultimodal registration of brain images. Usually, MSP is locatedmanually by a neuroanatomy expert whose time is taken to processa massive number of scans. Moreover, manual methods suffer fromoperator dependency and the difficulty to achieve accurate repro-ducibility. Therefore, a robust and accurate automatic technique toidentify the MSP can be useful in clinical practice.
Despite the variety of methods being proposed, MSP detectionremains a challenging issue due to the natural anatomical com-plexity, the presence of various noise artifacts [5,6], pathologies,and tilted head scans. Most of the existing work has concentratedprimarily on the image intensity analysis to detect the symmetry.However, it is the brain’s structure itself which is symmetrical.To the best of our knowledge, none of the work on brain sym-metry plane detection has tried to take advantage of the localself-similarity and bilateral symmetry in the structure present inbrain images. Nevertheless, a recent work in [7,8] assumes the MSPto be the plane that best partitions the external surface of the headinto two symmetrical parts. The brain has a complex geometricstructure which cannot completely be described using only meas-ures based on Euclidean geometry [9]. Such complex geometry canhowever be characterized by fractal geometry. Fractal dimension(FD) provides a way of quantifying the shape complexity of objects.Fractal analysis has already been successfully used in various areas
such as mathematics, science, biology and medicine. The use of afractal dimension to describe the convolution or the complexity ofa line or surface is well established in several areas of biomedicalresearch [10].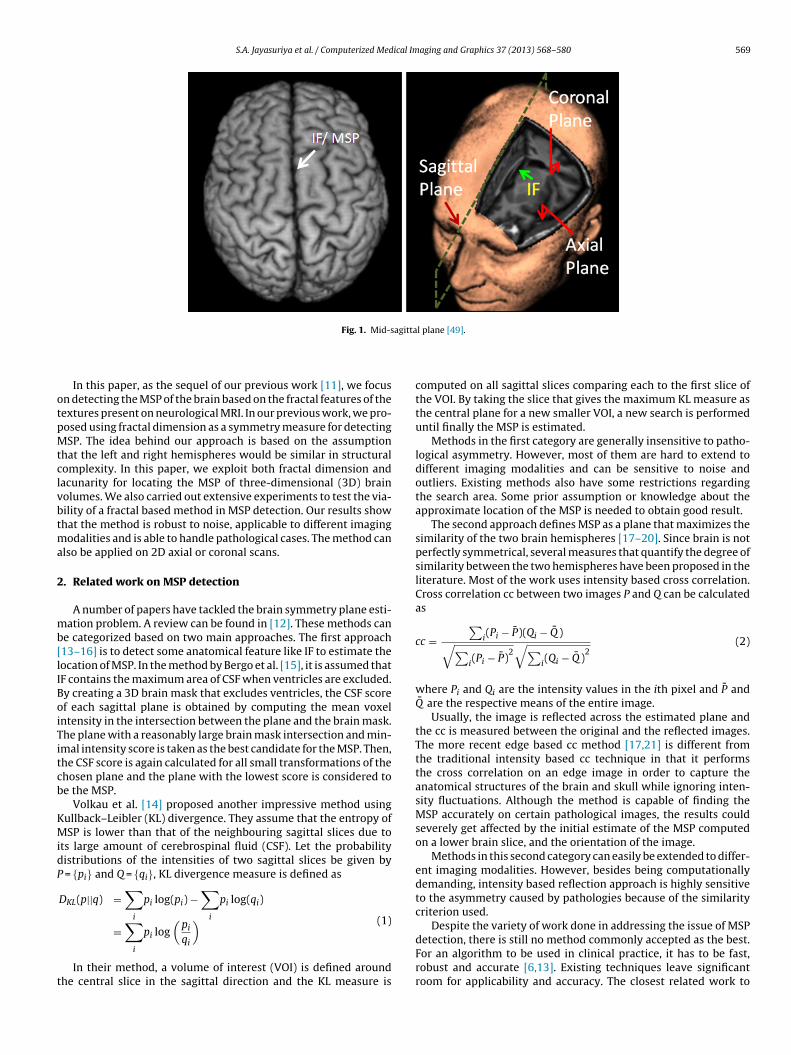
S.A. Jayasuriya et al. / Computerized Medical Imaging and Graphics 37 (2013) 568– 580 569
agitta
otpMtclvbtma
2
mb[lIBoiTitcb
KMidP
t
Fig. 1. Mid-s
In this paper, as the sequel of our previous work [11], we focusn detecting the MSP of the brain based on the fractal features of theextures present on neurological MRI. In our previous work, we pro-osed using fractal dimension as a symmetry measure for detectingSP. The idea behind our approach is based on the assumption
hat the left and right hemispheres would be similar in structuralomplexity. In this paper, we exploit both fractal dimension andacunarity for locating the MSP of three-dimensional (3D) brainolumes. We also carried out extensive experiments to test the via-ility of a fractal based method in MSP detection. Our results showhat the method is robust to noise, applicable to different imaging
odalities and is able to handle pathological cases. The method canlso be applied on 2D axial or coronal scans.
. Related work on MSP detection
A number of papers have tackled the brain symmetry plane esti-ation problem. A review can be found in [12]. These methods can
e categorized based on two main approaches. The first approach13–16] is to detect some anatomical feature like IF to estimate theocation of MSP. In the method by Bergo et al. [15], it is assumed thatF contains the maximum area of CSF when ventricles are excluded.y creating a 3D brain mask that excludes ventricles, the CSF scoref each sagittal plane is obtained by computing the mean voxelntensity in the intersection between the plane and the brain mask.he plane with a reasonably large brain mask intersection and min-mal intensity score is taken as the best candidate for the MSP. Then,he CSF score is again calculated for all small transformations of thehosen plane and the plane with the lowest score is considered toe the MSP.
Volkau et al. [14] proposed another impressive method usingullback–Leibler (KL) divergence. They assume that the entropy ofSP is lower than that of the neighbouring sagittal slices due to
ts large amount of cerebrospinal fluid (CSF). Let the probabilityistributions of the intensities of two sagittal slices be given by
= {pi} and Q = {qi}, KL divergence measure is defined as
DKL(p||q) =∑
i
pi log(pi) −∑
i
pi log(qi)
∑ (pi
) (1)
=i
pi logqi
In their method, a volume of interest (VOI) is defined aroundhe central slice in the sagittal direction and the KL measure is
l plane [49].
computed on all sagittal slices comparing each to the first slice ofthe VOI. By taking the slice that gives the maximum KL measure asthe central plane for a new smaller VOI, a new search is performeduntil finally the MSP is estimated.
Methods in the first category are generally insensitive to patho-logical asymmetry. However, most of them are hard to extend todifferent imaging modalities and can be sensitive to noise andoutliers. Existing methods also have some restrictions regardingthe search area. Some prior assumption or knowledge about theapproximate location of the MSP is needed to obtain good result.
The second approach defines MSP as a plane that maximizes thesimilarity of the two brain hemispheres [17–20]. Since brain is notperfectly symmetrical, several measures that quantify the degree ofsimilarity between the two hemispheres have been proposed in theliterature. Most of the work uses intensity based cross correlation.Cross correlation cc between two images P and Q can be calculatedas
cc =∑
i(Pi − P)(Qi − Q )√∑i(Pi − P)
2√∑
i(Qi − Q )2
(2)
where Pi and Qi are the intensity values in the ith pixel and P andQ are the respective means of the entire image.
Usually, the image is reflected across the estimated plane andthe cc is measured between the original and the reflected images.The more recent edge based cc method [17,21] is different fromthe traditional intensity based cc technique in that it performsthe cross correlation on an edge image in order to capture theanatomical structures of the brain and skull while ignoring inten-sity fluctuations. Although the method is capable of finding theMSP accurately on certain pathological images, the results couldseverely get affected by the initial estimate of the MSP computedon a lower brain slice, and the orientation of the image.
Methods in this second category can easily be extended to differ-ent imaging modalities. However, besides being computationallydemanding, intensity based reflection approach is highly sensitiveto the asymmetry caused by pathologies because of the similaritycriterion used.
Despite the variety of work done in addressing the issue of MSP
detection, there is still no method commonly accepted as the best.For an algorithm to be used in clinical practice, it has to be fast,robust and accurate [6,13]. Existing techniques leave significantroom for applicability and accuracy. The closest related work to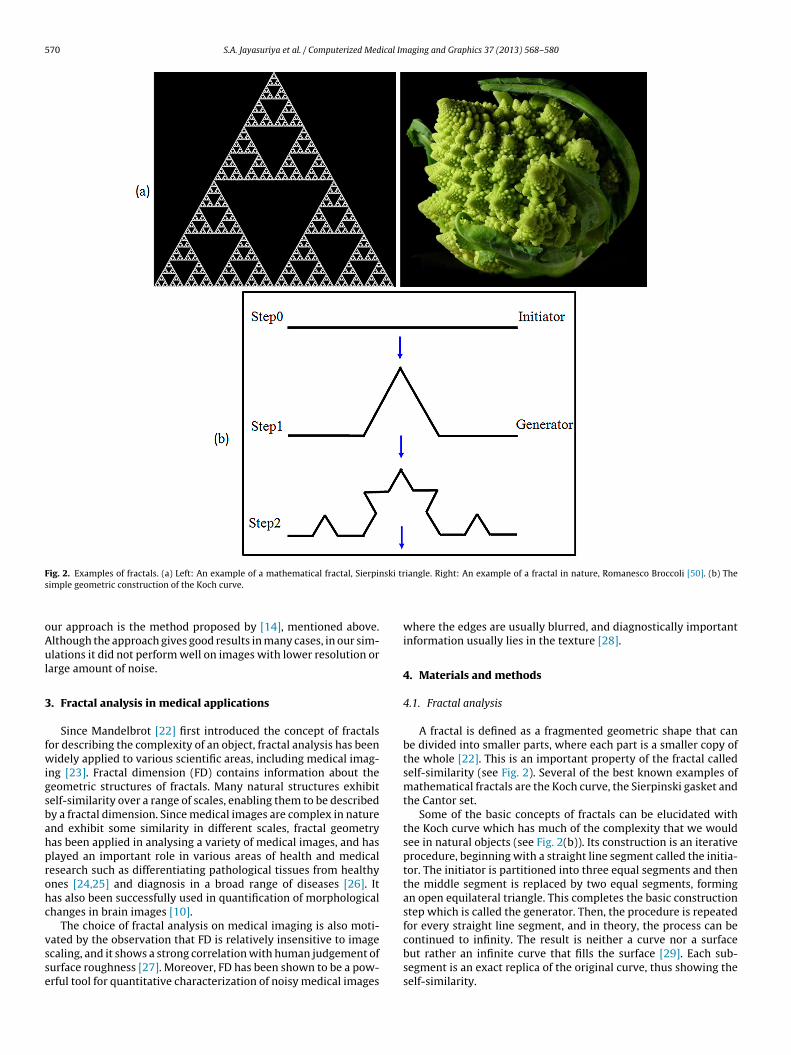
570 S.A. Jayasuriya et al. / Computerized Medical Imaging and Graphics 37 (2013) 568– 580
F ski trs
oAul
3
fwigsbahprohc
vsse
ig. 2. Examples of fractals. (a) Left: An example of a mathematical fractal, Sierpinimple geometric construction of the Koch curve.
ur approach is the method proposed by [14], mentioned above.lthough the approach gives good results in many cases, in our sim-lations it did not perform well on images with lower resolution or
arge amount of noise.
. Fractal analysis in medical applications
Since Mandelbrot [22] first introduced the concept of fractalsor describing the complexity of an object, fractal analysis has beenidely applied to various scientific areas, including medical imag-
ng [23]. Fractal dimension (FD) contains information about theeometric structures of fractals. Many natural structures exhibitelf-similarity over a range of scales, enabling them to be describedy a fractal dimension. Since medical images are complex in naturend exhibit some similarity in different scales, fractal geometryas been applied in analysing a variety of medical images, and haslayed an important role in various areas of health and medicalesearch such as differentiating pathological tissues from healthynes [24,25] and diagnosis in a broad range of diseases [26]. Itas also been successfully used in quantification of morphologicalhanges in brain images [10].
The choice of fractal analysis on medical imaging is also moti-
ated by the observation that FD is relatively insensitive to imagecaling, and it shows a strong correlation with human judgement ofurface roughness [27]. Moreover, FD has been shown to be a pow-rful tool for quantitative characterization of noisy medical imagesiangle. Right: An example of a fractal in nature, Romanesco Broccoli [50]. (b) The
where the edges are usually blurred, and diagnostically importantinformation usually lies in the texture [28].
4. Materials and methods
4.1. Fractal analysis
A fractal is defined as a fragmented geometric shape that canbe divided into smaller parts, where each part is a smaller copy ofthe whole [22]. This is an important property of the fractal calledself-similarity (see Fig. 2). Several of the best known examples ofmathematical fractals are the Koch curve, the Sierpinski gasket andthe Cantor set.
Some of the basic concepts of fractals can be elucidated withthe Koch curve which has much of the complexity that we wouldsee in natural objects (see Fig. 2(b)). Its construction is an iterativeprocedure, beginning with a straight line segment called the initia-tor. The initiator is partitioned into three equal segments and thenthe middle segment is replaced by two equal segments, formingan open equilateral triangle. This completes the basic constructionstep which is called the generator. Then, the procedure is repeatedfor every straight line segment, and in theory, the process can be
continued to infinity. The result is neither a curve nor a surfacebut rather an infinite curve that fills the surface [29]. Each sub-segment is an exact replica of the original curve, thus showing theself-similarity.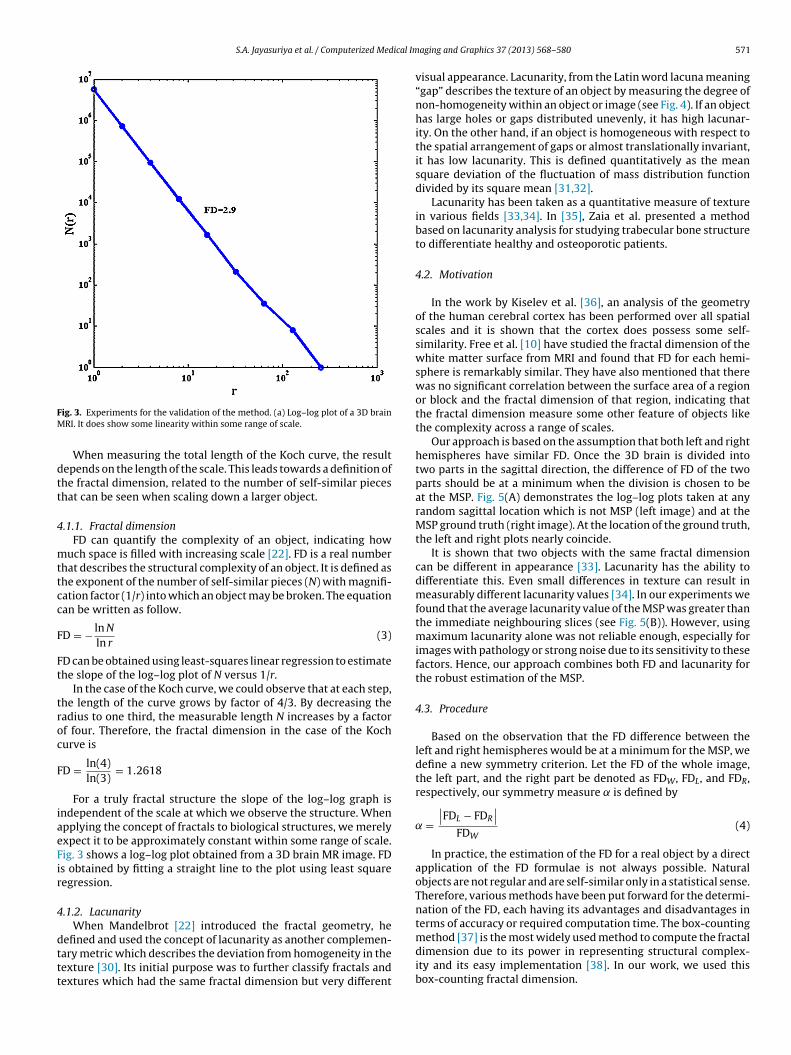
S.A. Jayasuriya et al. / Computerized Medical Im
FM
dtt
4
mttcc
F
Ft
troc
F
iaeFir
4
dttt
ig. 3. Experiments for the validation of the method. (a) Log–log plot of a 3D brainRI. It does show some linearity within some range of scale.
When measuring the total length of the Koch curve, the resultepends on the length of the scale. This leads towards a definition ofhe fractal dimension, related to the number of self-similar pieceshat can be seen when scaling down a larger object.
.1.1. Fractal dimensionFD can quantify the complexity of an object, indicating how
uch space is filled with increasing scale [22]. FD is a real numberhat describes the structural complexity of an object. It is defined ashe exponent of the number of self-similar pieces (N) with magnifi-ation factor (1/r) into which an object may be broken. The equationan be written as follow.
D = − ln N
ln r(3)
D can be obtained using least-squares linear regression to estimatehe slope of the log–log plot of N versus 1/r.
In the case of the Koch curve, we could observe that at each step,he length of the curve grows by factor of 4/3. By decreasing theadius to one third, the measurable length N increases by a factorf four. Therefore, the fractal dimension in the case of the Kochurve is
D = ln(4)ln(3)
= 1.2618
For a truly fractal structure the slope of the log–log graph isndependent of the scale at which we observe the structure. Whenpplying the concept of fractals to biological structures, we merelyxpect it to be approximately constant within some range of scale.ig. 3 shows a log–log plot obtained from a 3D brain MR image. FDs obtained by fitting a straight line to the plot using least squareegression.
.1.2. LacunarityWhen Mandelbrot [22] introduced the fractal geometry, he
efined and used the concept of lacunarity as another complemen-ary metric which describes the deviation from homogeneity in theexture [30]. Its initial purpose was to further classify fractals andextures which had the same fractal dimension but very different
aging and Graphics 37 (2013) 568– 580 571
visual appearance. Lacunarity, from the Latin word lacuna meaning“gap” describes the texture of an object by measuring the degree ofnon-homogeneity within an object or image (see Fig. 4). If an objecthas large holes or gaps distributed unevenly, it has high lacunar-ity. On the other hand, if an object is homogeneous with respect tothe spatial arrangement of gaps or almost translationally invariant,it has low lacunarity. This is defined quantitatively as the meansquare deviation of the fluctuation of mass distribution functiondivided by its square mean [31,32].
Lacunarity has been taken as a quantitative measure of texturein various fields [33,34]. In [35], Zaia et al. presented a methodbased on lacunarity analysis for studying trabecular bone structureto differentiate healthy and osteoporotic patients.
4.2. Motivation
In the work by Kiselev et al. [36], an analysis of the geometryof the human cerebral cortex has been performed over all spatialscales and it is shown that the cortex does possess some self-similarity. Free et al. [10] have studied the fractal dimension of thewhite matter surface from MRI and found that FD for each hemi-sphere is remarkably similar. They have also mentioned that therewas no significant correlation between the surface area of a regionor block and the fractal dimension of that region, indicating thatthe fractal dimension measure some other feature of objects likethe complexity across a range of scales.
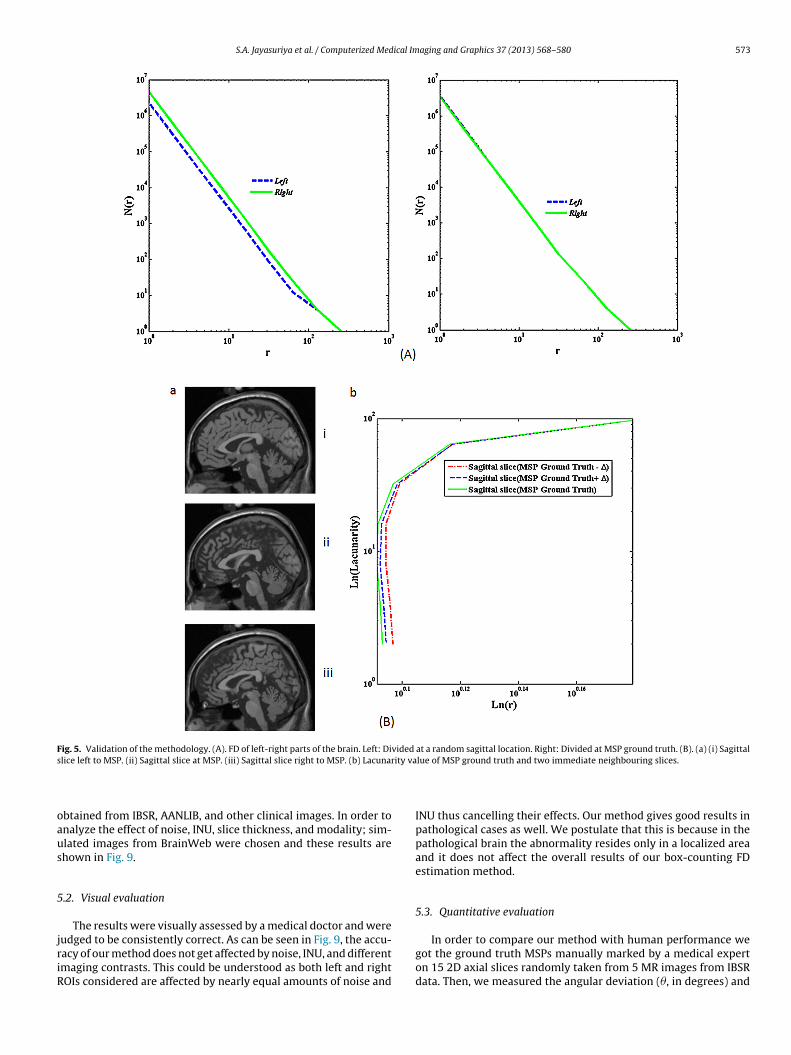
Our approach is based on the assumption that both left and righthemispheres have similar FD. Once the 3D brain is divided intotwo parts in the sagittal direction, the difference of FD of the twoparts should be at a minimum when the division is chosen to beat the MSP. Fig. 5(A) demonstrates the log–log plots taken at anyrandom sagittal location which is not MSP (left image) and at theMSP ground truth (right image). At the location of the ground truth,the left and right plots nearly coincide.
It is shown that two objects with the same fractal dimensioncan be different in appearance [33]. Lacunarity has the ability todifferentiate this. Even small differences in texture can result inmeasurably different lacunarity values [34]. In our experiments wefound that the average lacunarity value of the MSP was greater thanthe immediate neighbouring slices (see Fig. 5(B)). However, usingmaximum lacunarity alone was not reliable enough, especially forimages with pathology or strong noise due to its sensitivity to thesefactors. Hence, our approach combines both FD and lacunarity forthe robust estimation of the MSP.
4.3. Procedure
Based on the observation that the FD difference between theleft and right hemispheres would be at a minimum for the MSP, wedefine a new symmetry criterion. Let the FD of the whole image,the left part, and the right part be denoted as FDW, FDL, and FDR,respectively, our symmetry measure is defined by
=∣∣FDL − FDR
∣∣FDW
(4)
In practice, the estimation of the FD for a real object by a directapplication of the FD formulae is not always possible. Naturalobjects are not regular and are self-similar only in a statistical sense.Therefore, various methods have been put forward for the determi-nation of the FD, each having its advantages and disadvantages interms of accuracy or required computation time. The box-counting
method [37] is the most widely used method to compute the fractaldimension due to its power in representing structural complex-ity and its easy implementation [38]. In our work, we used thisbox-counting fractal dimension.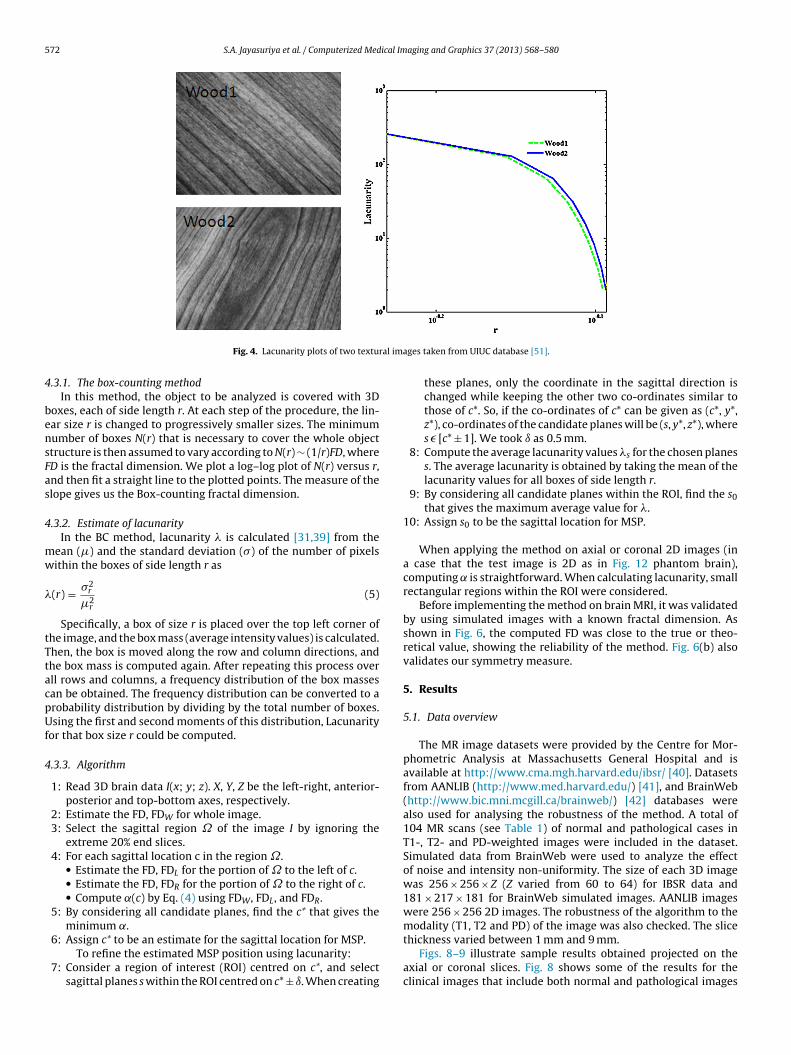
572 S.A. Jayasuriya et al. / Computerized Medical Imaging and Graphics 37 (2013) 568– 580
al ima
4
bensFas
4
mw
�
tTtacpUf
4
Fig. 4. Lacunarity plots of two textur
.3.1. The box-counting methodIn this method, the object to be analyzed is covered with 3D
oxes, each of side length r. At each step of the procedure, the lin-ar size r is changed to progressively smaller sizes. The minimumumber of boxes N(r) that is necessary to cover the whole objecttructure is then assumed to vary according to N(r) ∼ (1/r)FD, whereD is the fractal dimension. We plot a log–log plot of N(r) versus r,nd then fit a straight line to the plotted points. The measure of thelope gives us the Box-counting fractal dimension.
.3.2. Estimate of lacunarityIn the BC method, lacunarity � is calculated [31,39] from the
ean (�) and the standard deviation (�) of the number of pixelsithin the boxes of side length r as
(r) = �2r
�2r
(5)
Specifically, a box of size r is placed over the top left corner ofhe image, and the box mass (average intensity values) is calculated.hen, the box is moved along the row and column directions, andhe box mass is computed again. After repeating this process overll rows and columns, a frequency distribution of the box massesan be obtained. The frequency distribution can be converted to arobability distribution by dividing by the total number of boxes.sing the first and second moments of this distribution, Lacunarity
or that box size r could be computed.
.3.3. Algorithm
1: Read 3D brain data I(x; y; z). X, Y, Z be the left-right, anterior-posterior and top-bottom axes, respectively.
2: Estimate the FD, FDW for whole image.3: Select the sagittal region of the image I by ignoring the
extreme 20% end slices.4: For each sagittal location c in the region ˝.
• Estimate the FD, FDL for the portion of to the left of c.• Estimate the FD, FDR for the portion of to the right of c.• Compute ˛(c) by Eq. (4) using FDW, FDL, and FDR.
5: By considering all candidate planes, find the c* that gives theminimum ˛.
6: Assign c* to be an estimate for the sagittal location for MSP.To refine the estimated MSP position using lacunarity:
7: Consider a region of interest (ROI) centred on c*, and selectsagittal planes s within the ROI centred on c* ± ı. When creating
ges taken from UIUC database [51].
these planes, only the coordinate in the sagittal direction ischanged while keeping the other two co-ordinates similar tothose of c*. So, if the co-ordinates of c* can be given as (c*, y*,z*), co-ordinates of the candidate planes will be (s, y*, z*), wheres � [c* ± 1]. We took ı as 0.5 mm.
8: Compute the average lacunarity values �s for the chosen planess. The average lacunarity is obtained by taking the mean of thelacunarity values for all boxes of side length r.
9: By considering all candidate planes within the ROI, find the s0that gives the maximum average value for �.
10: Assign s0 to be the sagittal location for MSP.
When applying the method on axial or coronal 2D images (ina case that the test image is 2D as in Fig. 12 phantom brain),computing is straightforward. When calculating lacunarity, smallrectangular regions within the ROI were considered.
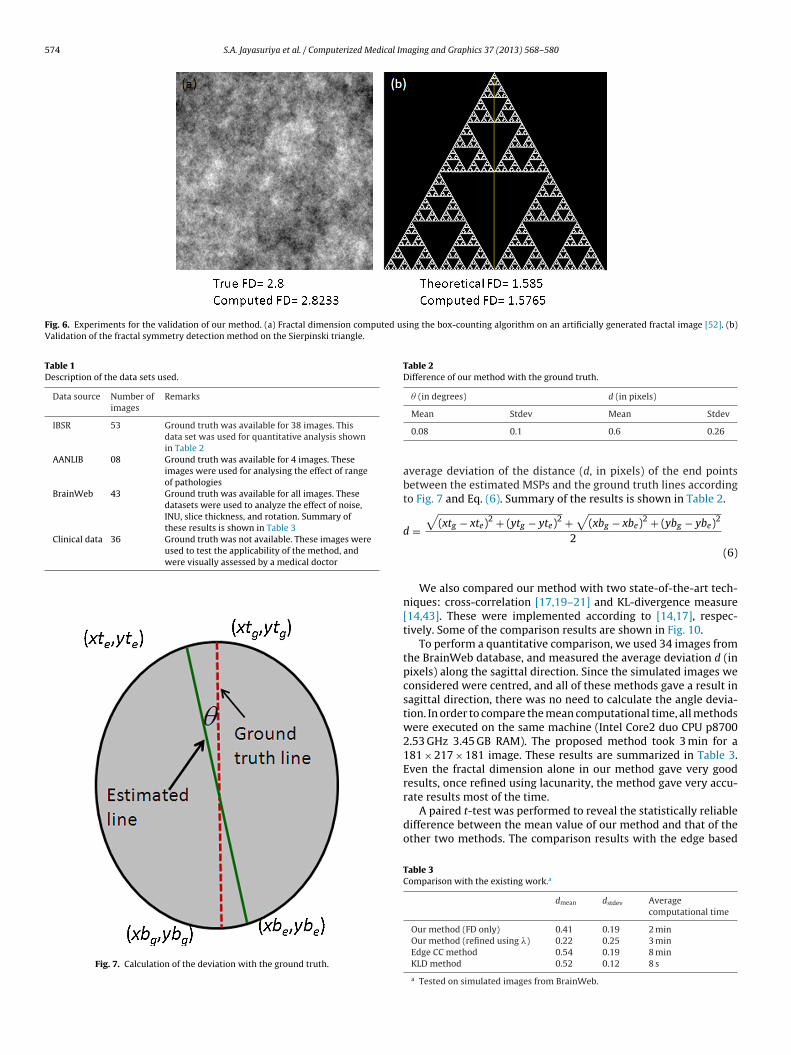
Before implementing the method on brain MRI, it was validatedby using simulated images with a known fractal dimension. Asshown in Fig. 6, the computed FD was close to the true or theo-retical value, showing the reliability of the method. Fig. 6(b) alsovalidates our symmetry measure.
5. Results
5.1. Data overview
The MR image datasets were provided by the Centre for Mor-phometric Analysis at Massachusetts General Hospital and isavailable at http://www.cma.mgh.harvard.edu/ibsr/ [40]. Datasetsfrom AANLIB (http://www.med.harvard.edu/) [41], and BrainWeb(http://www.bic.mni.mcgill.ca/brainweb/) [42] databases werealso used for analysing the robustness of the method. A total of104 MR scans (see Table 1) of normal and pathological cases inT1-, T2- and PD-weighted images were included in the dataset.Simulated data from BrainWeb were used to analyze the effectof noise and intensity non-uniformity. The size of each 3D imagewas 256 × 256 × Z (Z varied from 60 to 64) for IBSR data and181 × 217 × 181 for BrainWeb simulated images. AANLIB imageswere 256 × 256 2D images. The robustness of the algorithm to themodality (T1, T2 and PD) of the image was also checked. The slice
thickness varied between 1 mm and 9 mm.Figs. 8–9 illustrate sample results obtained projected on theaxial or coronal slices. Fig. 8 shows some of the results for theclinical images that include both normal and pathological images
S.A. Jayasuriya et al. / Computerized Medical Imaging and Graphics 37 (2013) 568– 580 573
Fig. 5. Validation of the methodology. (A). FD of left-right parts of the brain. Left: Divided at a random sagittal location. Right: Divided at MSP ground truth. (B). (a) (i) Sagittals ity va
oaus
5
jriR
lice left to MSP. (ii) Sagittal slice at MSP. (iii) Sagittal slice right to MSP. (b) Lacunar
btained from IBSR, AANLIB, and other clinical images. In order tonalyze the effect of noise, INU, slice thickness, and modality; sim-lated images from BrainWeb were chosen and these results arehown in Fig. 9.
.2. Visual evaluation
The results were visually assessed by a medical doctor and were
udged to be consistently correct. As can be seen in Fig. 9, the accu-acy of our method does not get affected by noise, INU, and differentmaging contrasts. This could be understood as both left and rightOIs considered are affected by nearly equal amounts of noise andlue of MSP ground truth and two immediate neighbouring slices.
INU thus cancelling their effects. Our method gives good results inpathological cases as well. We postulate that this is because in thepathological brain the abnormality resides only in a localized areaand it does not affect the overall results of our box-counting FDestimation method.
5.3. Quantitative evaluation
In order to compare our method with human performance wegot the ground truth MSPs manually marked by a medical experton 15 2D axial slices randomly taken from 5 MR images from IBSRdata. Then, we measured the angular deviation (�, in degrees) and
574 S.A. Jayasuriya et al. / Computerized Medical Imaging and Graphics 37 (2013) 568– 580
Fig. 6. Experiments for the validation of our method. (a) Fractal dimension computed using the box-counting algorithm on an artificially generated fractal image [52]. (b)Validation of the fractal symmetry detection method on the Sierpinski triangle.
Table 1Description of the data sets used.
Data source Number ofimages
Remarks
IBSR 53 Ground truth was available for 38 images. Thisdata set was used for quantitative analysis shownin Table 2
AANLIB 08 Ground truth was available for 4 images. Theseimages were used for analysing the effect of rangeof pathologies
BrainWeb 43 Ground truth was available for all images. Thesedatasets were used to analyze the effect of noise,INU, slice thickness, and rotation. Summary ofthese results is shown in Table 3
Clinical data 36 Ground truth was not available. These images wereused to test the applicability of the method, andwere visually assessed by a medical doctor
Fig. 7. Calculation of the deviation with the ground truth.
Table 2Difference of our method with the ground truth.
� (in degrees) d (in pixels)
Mean Stdev Mean Stdev
0.08 0.1 0.6 0.26
average deviation of the distance (d, in pixels) of the end pointsbetween the estimated MSPs and the ground truth lines accordingto Fig. 7 and Eq. (6). Summary of the results is shown in Table 2.
d =√
(xtg − xte)2 + (ytg − yte)2 +√
(xbg − xbe)2 + (ybg − ybe)2
2(6)
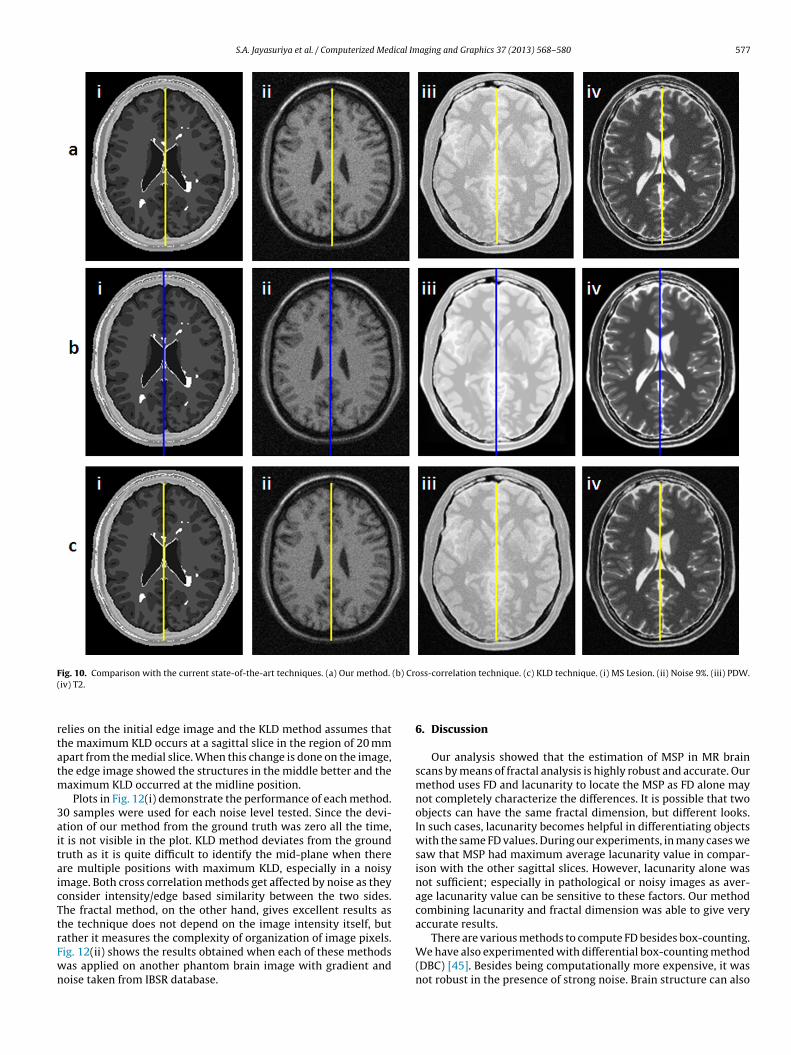
We also compared our method with two state-of-the-art tech-niques: cross-correlation [17,19–21] and KL-divergence measure[14,43]. These were implemented according to [14,17], respec-tively. Some of the comparison results are shown in Fig. 10.
To perform a quantitative comparison, we used 34 images fromthe BrainWeb database, and measured the average deviation d (inpixels) along the sagittal direction. Since the simulated images weconsidered were centred, and all of these methods gave a result insagittal direction, there was no need to calculate the angle devia-tion. In order to compare the mean computational time, all methodswere executed on the same machine (Intel Core2 duo CPU p87002.53 GHz 3.45 GB RAM). The proposed method took 3 min for a181 × 217 × 181 image. These results are summarized in Table 3.Even the fractal dimension alone in our method gave very goodresults, once refined using lacunarity, the method gave very accu-
rate results most of the time.A paired t-test was performed to reveal the statistically reliabledifference between the mean value of our method and that of theother two methods. The comparison results with the edge based
Table 3Comparison with the existing work.a
dmean dstdev Averagecomputational time
Our method (FD only) 0.41 0.19 2 minOur method (refined using �) 0.22 0.25 3 minEdge CC method 0.54 0.19 8 minKLD method 0.52 0.12 8 s
a Tested on simulated images from BrainWeb.
S.A. Jayasuriya et al. / Computerized Medical Imaging and Graphics 37 (2013) 568– 580 575
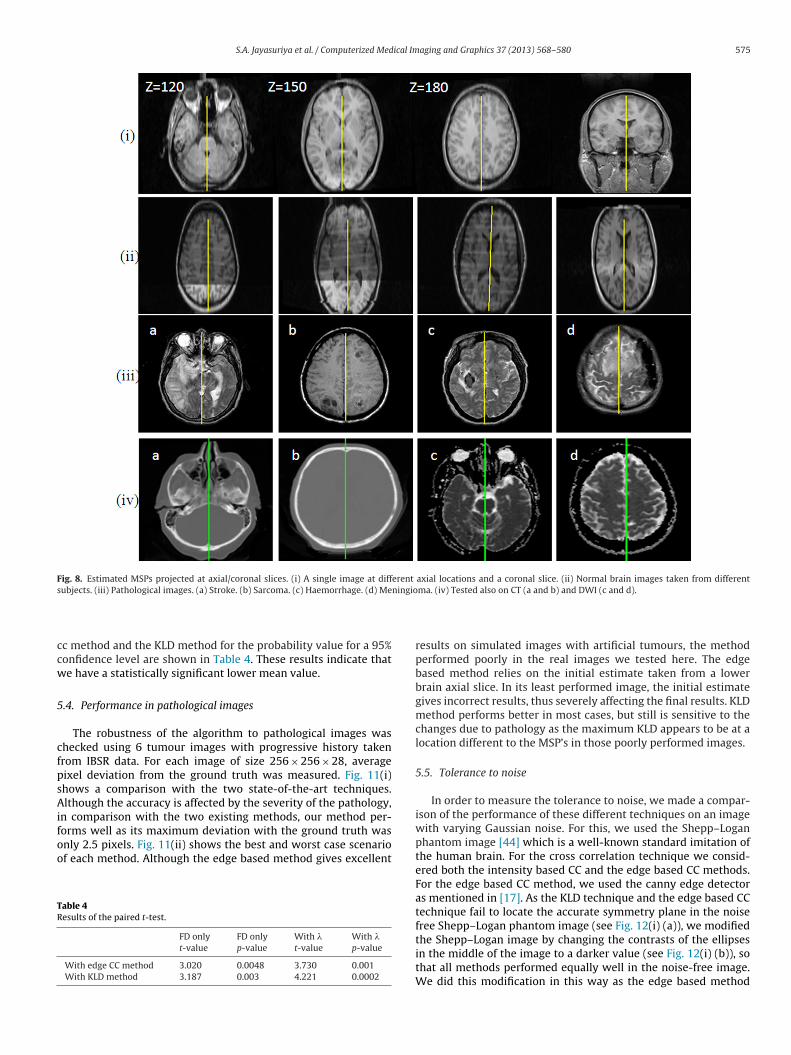
Fig. 8. Estimated MSPs projected at axial/coronal slices. (i) A single image at different axial locations and a coronal slice. (ii) Normal brain images taken from differents ningio
ccw
5
cfpsAifoo
TR
ubjects. (iii) Pathological images. (a) Stroke. (b) Sarcoma. (c) Haemorrhage. (d) Me
c method and the KLD method for the probability value for a 95%onfidence level are shown in Table 4. These results indicate thate have a statistically significant lower mean value.
.4. Performance in pathological images
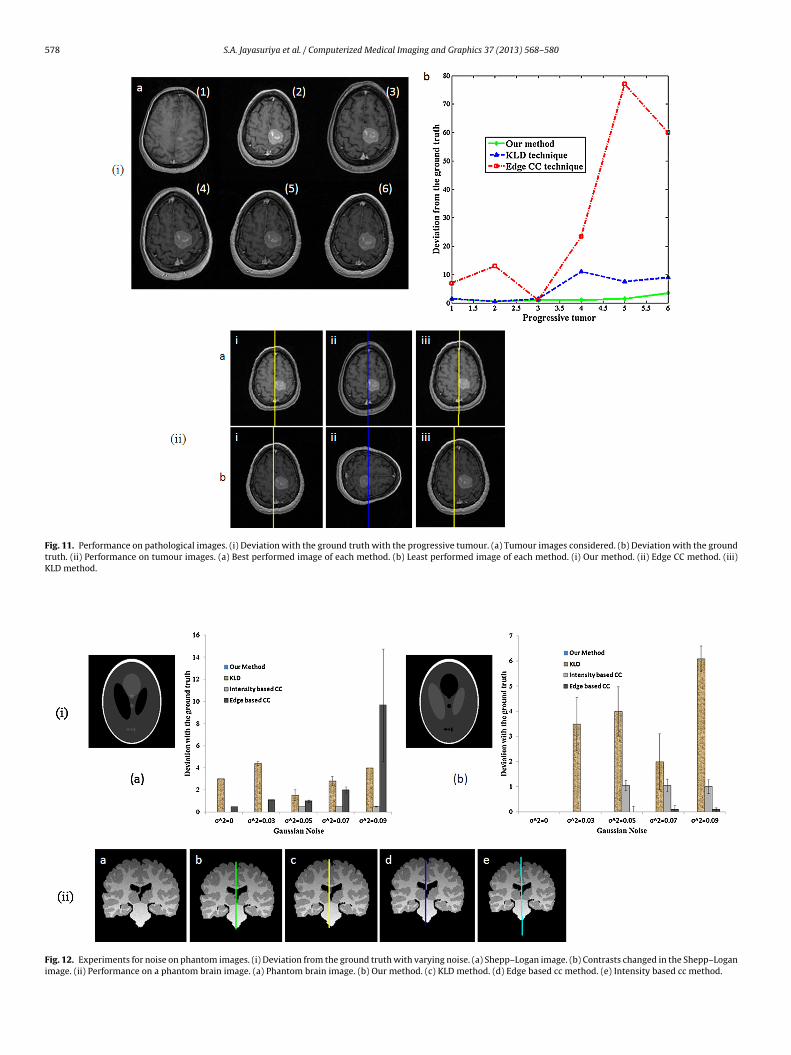
The robustness of the algorithm to pathological images washecked using 6 tumour images with progressive history takenrom IBSR data. For each image of size 256 × 256 × 28, averageixel deviation from the ground truth was measured. Fig. 11(i)hows a comparison with the two state-of-the-art techniques.lthough the accuracy is affected by the severity of the pathology,
n comparison with the two existing methods, our method per-orms well as its maximum deviation with the ground truth wasnly 2.5 pixels. Fig. 11(ii) shows the best and worst case scenariof each method. Although the edge based method gives excellent
able 4esults of the paired t-test.
FD onlyt-value
FD onlyp-value
With �t-value
With �p-value
With edge CC method 3.020 0.0048 3.730 0.001With KLD method 3.187 0.003 4.221 0.0002
ma. (iv) Tested also on CT (a and b) and DWI (c and d).
results on simulated images with artificial tumours, the methodperformed poorly in the real images we tested here. The edgebased method relies on the initial estimate taken from a lowerbrain axial slice. In its least performed image, the initial estimategives incorrect results, thus severely affecting the final results. KLDmethod performs better in most cases, but still is sensitive to thechanges due to pathology as the maximum KLD appears to be at alocation different to the MSP’s in those poorly performed images.
5.5. Tolerance to noise
In order to measure the tolerance to noise, we made a compar-ison of the performance of these different techniques on an imagewith varying Gaussian noise. For this, we used the Shepp–Loganphantom image [44] which is a well-known standard imitation ofthe human brain. For the cross correlation technique we consid-ered both the intensity based CC and the edge based CC methods.For the edge based CC method, we used the canny edge detectoras mentioned in [17]. As the KLD technique and the edge based CCtechnique fail to locate the accurate symmetry plane in the noisefree Shepp–Logan phantom image (see Fig. 12(i) (a)), we modified
the Shepp–Logan image by changing the contrasts of the ellipsesin the middle of the image to a darker value (see Fig. 12(i) (b)), sothat all methods performed equally well in the noise-free image.We did this modification in this way as the edge based method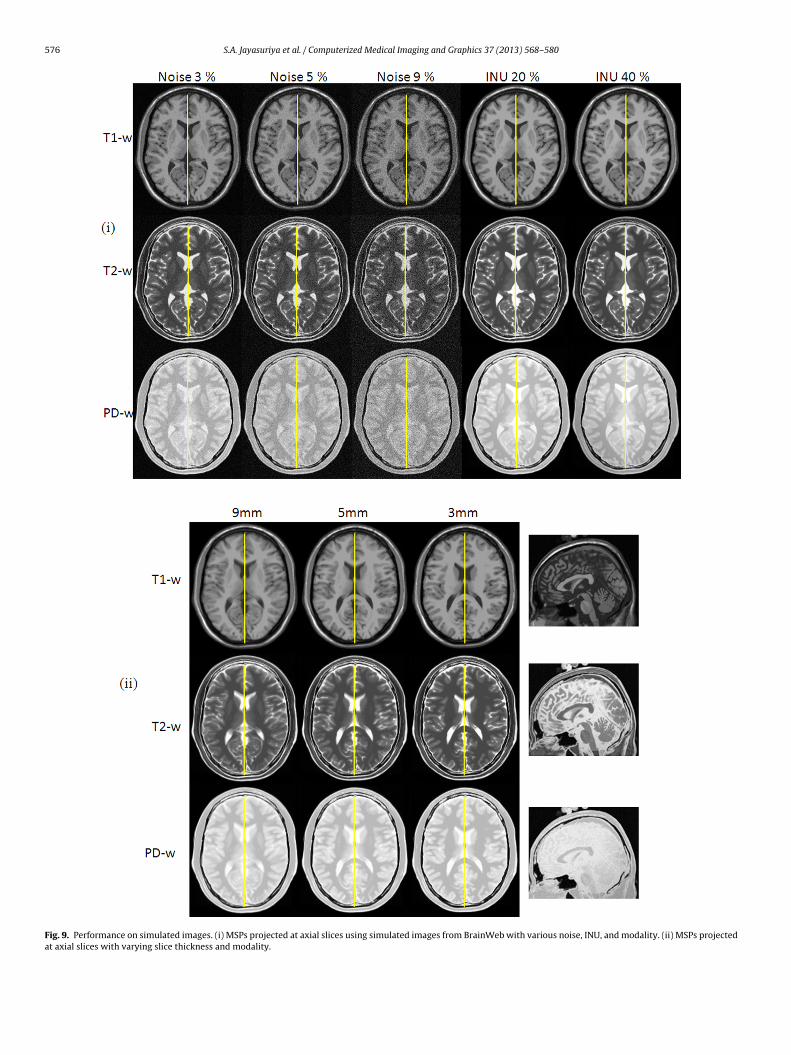
576 S.A. Jayasuriya et al. / Computerized Medical Imaging and Graphics 37 (2013) 568– 580
Fig. 9. Performance on simulated images. (i) MSPs projected at axial slices using simulated images from BrainWeb with various noise, INU, and modality. (ii) MSPs projectedat axial slices with varying slice thickness and modality.
S.A. Jayasuriya et al. / Computerized Medical Imaging and Graphics 37 (2013) 568– 580 577
F (b) Cr(
rtatm
3aitaicTtrFwn
ig. 10. Comparison with the current state-of-the-art techniques. (a) Our method.
iv) T2.
elies on the initial edge image and the KLD method assumes thathe maximum KLD occurs at a sagittal slice in the region of 20 mmpart from the medial slice. When this change is done on the image,he edge image showed the structures in the middle better and the
aximum KLD occurred at the midline position.Plots in Fig. 12(i) demonstrate the performance of each method.
0 samples were used for each noise level tested. Since the devi-tion of our method from the ground truth was zero all the time,t is not visible in the plot. KLD method deviates from the groundruth as it is quite difficult to identify the mid-plane when therere multiple positions with maximum KLD, especially in a noisymage. Both cross correlation methods get affected by noise as theyonsider intensity/edge based similarity between the two sides.he fractal method, on the other hand, gives excellent results ashe technique does not depend on the image intensity itself, but
ather it measures the complexity of organization of image pixels.ig. 12(ii) shows the results obtained when each of these methodsas applied on another phantom brain image with gradient andoise taken from IBSR database.oss-correlation technique. (c) KLD technique. (i) MS Lesion. (ii) Noise 9%. (iii) PDW.
6. Discussion
Our analysis showed that the estimation of MSP in MR brainscans by means of fractal analysis is highly robust and accurate. Ourmethod uses FD and lacunarity to locate the MSP as FD alone maynot completely characterize the differences. It is possible that twoobjects can have the same fractal dimension, but different looks.In such cases, lacunarity becomes helpful in differentiating objectswith the same FD values. During our experiments, in many cases wesaw that MSP had maximum average lacunarity value in compar-ison with the other sagittal slices. However, lacunarity alone wasnot sufficient; especially in pathological or noisy images as aver-age lacunarity value can be sensitive to these factors. Our methodcombining lacunarity and fractal dimension was able to give veryaccurate results.
There are various methods to compute FD besides box-counting.We have also experimented with differential box-counting method(DBC) [45]. Besides being computationally more expensive, it wasnot robust in the presence of strong noise. Brain structure can also
578 S.A. Jayasuriya et al. / Computerized Medical Imaging and Graphics 37 (2013) 568– 580
Fig. 11. Performance on pathological images. (i) Deviation with the ground truth with the progressive tumour. (a) Tumour images considered. (b) Deviation with the groundtruth. (ii) Performance on tumour images. (a) Best performed image of each method. (b) Least performed image of each method. (i) Our method. (ii) Edge CC method. (iii)KLD method.
Fig. 12. Experiments for noise on phantom images. (i) Deviation from the ground truth with varying noise. (a) Shepp–Logan image. (b) Contrasts changed in the Shepp–Loganimage. (ii) Performance on a phantom brain image. (a) Phantom brain image. (b) Our method. (c) KLD method. (d) Edge based cc method. (e) Intensity based cc method.
S.A. Jayasuriya et al. / Computerized Medical Im
btHg
6t
sHtaattttTemtmCioaab
bttpldemsI
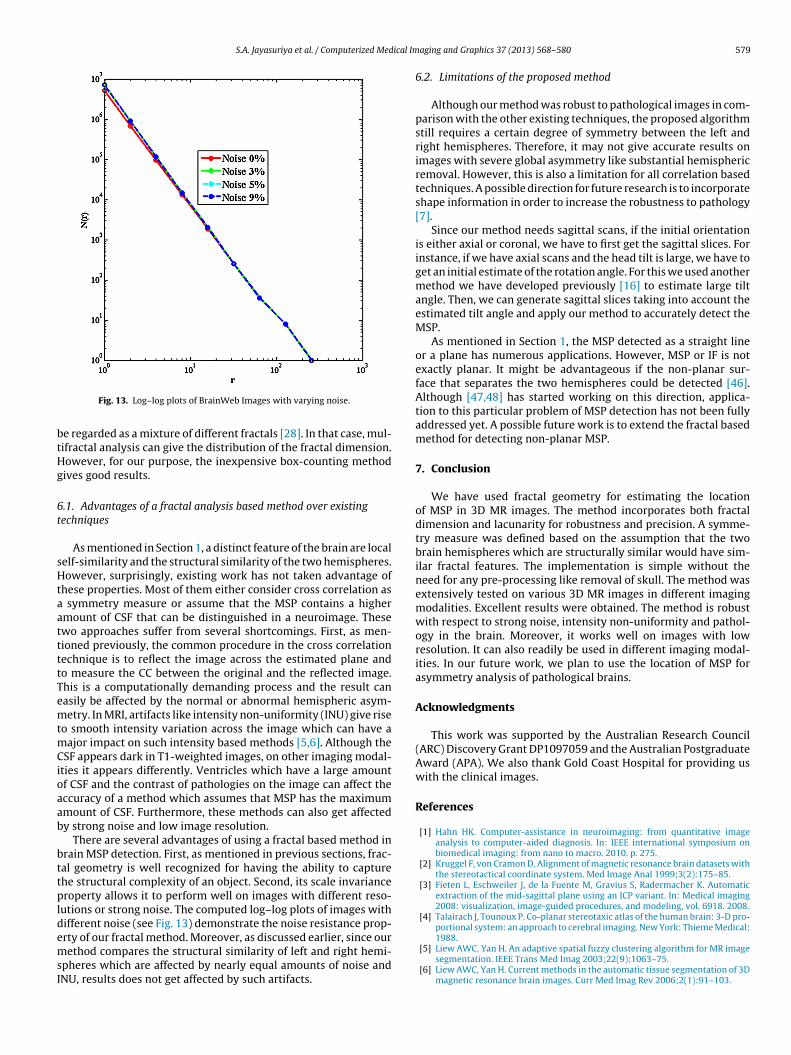
Fig. 13. Log–log plots of BrainWeb Images with varying noise.
e regarded as a mixture of different fractals [28]. In that case, mul-ifractal analysis can give the distribution of the fractal dimension.owever, for our purpose, the inexpensive box-counting methodives good results.
.1. Advantages of a fractal analysis based method over existingechniques
As mentioned in Section 1, a distinct feature of the brain are localelf-similarity and the structural similarity of the two hemispheres.owever, surprisingly, existing work has not taken advantage of
hese properties. Most of them either consider cross correlation as symmetry measure or assume that the MSP contains a highermount of CSF that can be distinguished in a neuroimage. Thesewo approaches suffer from several shortcomings. First, as men-ioned previously, the common procedure in the cross correlationechnique is to reflect the image across the estimated plane ando measure the CC between the original and the reflected image.his is a computationally demanding process and the result canasily be affected by the normal or abnormal hemispheric asym-etry. In MRI, artifacts like intensity non-uniformity (INU) give rise
o smooth intensity variation across the image which can have aajor impact on such intensity based methods [5,6]. Although the
SF appears dark in T1-weighted images, on other imaging modal-ties it appears differently. Ventricles which have a large amountf CSF and the contrast of pathologies on the image can affect theccuracy of a method which assumes that MSP has the maximummount of CSF. Furthermore, these methods can also get affectedy strong noise and low image resolution.
There are several advantages of using a fractal based method inrain MSP detection. First, as mentioned in previous sections, frac-al geometry is well recognized for having the ability to capturehe structural complexity of an object. Second, its scale invarianceroperty allows it to perform well on images with different reso-
utions or strong noise. The computed log–log plots of images withifferent noise (see Fig. 13) demonstrate the noise resistance prop-
rty of our fractal method. Moreover, as discussed earlier, since ourethod compares the structural similarity of left and right hemi-pheres which are affected by nearly equal amounts of noise andNU, results does not get affected by such artifacts.
aging and Graphics 37 (2013) 568– 580 579
6.2. Limitations of the proposed method
Although our method was robust to pathological images in com-parison with the other existing techniques, the proposed algorithmstill requires a certain degree of symmetry between the left andright hemispheres. Therefore, it may not give accurate results onimages with severe global asymmetry like substantial hemisphericremoval. However, this is also a limitation for all correlation basedtechniques. A possible direction for future research is to incorporateshape information in order to increase the robustness to pathology[7].
Since our method needs sagittal scans, if the initial orientationis either axial or coronal, we have to first get the sagittal slices. Forinstance, if we have axial scans and the head tilt is large, we have toget an initial estimate of the rotation angle. For this we used anothermethod we have developed previously [16] to estimate large tiltangle. Then, we can generate sagittal slices taking into account theestimated tilt angle and apply our method to accurately detect theMSP.
As mentioned in Section 1, the MSP detected as a straight lineor a plane has numerous applications. However, MSP or IF is notexactly planar. It might be advantageous if the non-planar sur-face that separates the two hemispheres could be detected [46].Although [47,48] has started working on this direction, applica-tion to this particular problem of MSP detection has not been fullyaddressed yet. A possible future work is to extend the fractal basedmethod for detecting non-planar MSP.
7. Conclusion
We have used fractal geometry for estimating the locationof MSP in 3D MR images. The method incorporates both fractaldimension and lacunarity for robustness and precision. A symme-try measure was defined based on the assumption that the twobrain hemispheres which are structurally similar would have sim-ilar fractal features. The implementation is simple without theneed for any pre-processing like removal of skull. The method wasextensively tested on various 3D MR images in different imagingmodalities. Excellent results were obtained. The method is robustwith respect to strong noise, intensity non-uniformity and pathol-ogy in the brain. Moreover, it works well on images with lowresolution. It can also readily be used in different imaging modal-ities. In our future work, we plan to use the location of MSP forasymmetry analysis of pathological brains.
Acknowledgments
This work was supported by the Australian Research Council(ARC) Discovery Grant DP1097059 and the Australian PostgraduateAward (APA). We also thank Gold Coast Hospital for providing uswith the clinical images.
References
[1] Hahn HK. Computer-assistance in neuroimaging: from quantitative imageanalysis to computer-aided diagnosis. In: IEEE international symposium onbiomedical imaging: from nano to macro. 2010. p. 275.
[2] Kruggel F, von Cramon D. Alignment of magnetic resonance brain datasets withthe stereotactical coordinate system. Med Image Anal 1999;3(2):175–85.
[3] Fieten L, Eschweiler J, de la Fuente M, Gravius S, Radermacher K. Automaticextraction of the mid-sagittal plane using an ICP variant. In: Medical imaging2008: visualization, image-guided procedures, and modeling, vol. 6918. 2008.
[4] Talairach J, Tounoux P. Co-planar stereotaxic atlas of the human brain: 3-D pro-portional system: an approach to cerebral imaging. New York: Thieme Medical;
1988.[5] Liew AWC, Yan H. An adaptive spatial fuzzy clustering algorithm for MR imagesegmentation. IEEE Trans Med Imag 2003;22(9):1063–75.
[6] Liew AWC, Yan H. Current methods in the automatic tissue segmentation of 3Dmagnetic resonance brain images. Curr Med Imag Rev 2006;2(1):91–103.
5 ical Im
[
[
[
[
[
[
[
[
[
[
[
[
[
[
[
[
[
[
[
[
[
[
[
[[
[
[
[
[
[
[[[[
[
[
[
[
[
[
[[
[
and Information Engineering, The Hong Kong Polytechnic University. Her research
80 S.A. Jayasuriya et al. / Computerized Med
[7] Liu SX, Kender J, Imielinska C, Laine A. Employing symmetry fea-tures for automatic misalignment correction in neuroimages. J Neuroimag2011;21(2):15–33.
[8] Liu SX, Imielinska C, Connolly Jr S, Ambrosio AD. Automatic correction of the 3Dorientation of the brain imagery. In: IEEE international symposium on signalprocessing and information technology. 2006.
[9] Uemura K, Toyama H, Baba S, Kimura Y, Senda M, Uchiyama A. Generation offractal dimension images and its application to automatic edge detection inbrain MRI. Comput Med Imag Graph 2000;24:73–85.
10] Free S, Sisodiya S, Cook M, Fish D, Shorvon S. Three-dimensional fractal analysisof the white matter surface from magnetic resonance images of the humanbrain. Cerebr Cortex 1996;6(6):830–6.
11] Jayasuriya SA, Liew AWC. Fractal dimension as a symmetry measure in 3Dbrain MRI analysis. In: IEEE international conference on machine learning andcybernetics. 2012.
12] Liu SX. Symmetry and asymmetry analysis and its implications to computer-aided diagnosis: a review of the literature. J Biomed Inform 2009;42:1056–64.
13] Hu Q, Nowinski W. A rapid algorithm for robust and automatic extraction ofthe midsagittal plane of the human cerebrum from neuroimages based on localsymmetry and outlier removal. NeuroImage 2003;20:2153–65.
14] Volkau I, Bhanu P, Ananthasubramaniam A, Aziz A, Nowinski W. Extrac-tion of the midsagittal plane from morphological neuroimages using theKullback–Leibler’s measure. Med Image Anal 2006;10:863–74.
15] Bergo F, Falcao A, Yasuda C, Ruppert G. Fast, accurate and precise mid-sagittalplane location in 3D MR images of the brain. Biomed Eng Syst Technol CommunComput Inform Sci 2009;25:278–90.
16] Jayasuriya SA, Liew AWC. Symmetry plane detection in neuroimages basedon intensity profile analysis. In: IEEE international symposium on informationtechnology in medicine and education (ITME), vol. 2. 2012. p. 599–603.
17] Liu Y, Collins R, Rothfus W. Robust Midsagittal plane extraction from nor-mal and pathological 3-D neuroradiology images. IEEE Trans Med Imag2001;20(3):175–92.
18] Thirion JP, Prima S, Subsol G, Roberts N. Statistical analysis of normal andabnormal dissymmetry in volumetric medical Images. In: IEEE workshop onbiomedical image analysis. 2000. p. 74–83.
19] Prima S, Ourselin S, Ayache N. Computation of the mid-sagittal plane in 3Dbrain images. IEEE Trans Med Imag 2001;21:122–38.
20] Tuzikov A, Colliot O, Bloch I. Evaluation of the symmetry plane in 3D MR brainimages. Pattern Recog Lett 2003;24:2219–33.
21] Ruppert G, Teverovskiy L, Yu C, Falcao A, Liu Y. A new symmetry-based methodfor mid-sagittal plane extraction in neuroimages. In: IEEE international sym-posium on biomedical imaging: from nano to macro. 2011. p. 285–8.
22] Mandelbrot B. The fractal geometry of nature. San Francisco: W.H. Freemanand Company; 1982.
23] Lopes R, Betrouni N. Fractal and multifractal analysis: a review. Med Image Anal2009;13:634–49.
24] Blackledge J, Dubovitskiy D. Object detection and classification with applica-tions to skin cancer screening. ISAST Trans Intell Syst 2008;1(2):34–45.
25] Takahashi T, Kosaka H, Murata T, Omori M, Narita K, Mitsuya H, et al. Appli-cation of a multifractal analysis to study brain white matter abnormalitiesof schizophrenia on T2-weighted magnetic resonance imaging. Psychiatr ResNeuroimag 2009;171:177–88.
26] Iftekharuddin K. Techniques in fractal analysis and their applications in brainMRI. Medical imaging systems: technology and applications. Anal ComputMethods 2005;1:63–86.
27] Chaudhuri B, Sarkar N. Texture segmentation using fractal dimension. IEEETrans Pattern Anal Mach Intell 1995;17(1):72–7.
28] Oczeretko E, Jurgilewicz D, Rogowski F. Some remarks on the fractal dimension
applications in nuclear medicine. In: Fractals in Biology and Medicine, vol. 3.2002.29] Sandu A, Rasmussen I, Lundervold A, Kreuder F, Neckelmann G, Hugdahl K,et al. Fractal dimension analysis of MR images reveals grey matter structureirregularities in schizophrenia. Comput Med Imag Graph 2008;32:150–8.
aging and Graphics 37 (2013) 568– 580
30] Pentland A. Fractal-based description of natural scenes. IEEE Trans Pattern AnalMach Intell 1984;6(6):661–74.
31] Allain C, Cloitre M. Characterizing the lacunarity of random and deterministicfractal sets. Phys Rev A 1991;44(6):3552–8.
32] Tolle C, McJunkin T, Gorsich D. An efficient implementation of the gliding boxlacunarity algorithm. Physica D 2008;237:306–15.
33] Taguchi Y. Lacunarity and universality. J Phys A Math Gen 1987;20:6611–6.34] Dougherty G, Henebry G. Fractal signature and lacunarity in the measure-
ment of the texture of trabecular bone in clinical CT images. Med Eng Phys2001;23:369–80.
35] Zaia A, Eleonori R, Maponi P, Rossi R, Murri R. MR imaging and osteoporosis frac-tal lacunarity analysis of trabecular bone. IEEE Trans Inform Technol Biomed2006;10(3):484–9.
36] Kiselev V, Hahn K, Auer D. Is the brain cortex a fractal? Neuroimage2003;20:1765–74.
37] Russell D, Hanson J, Ott E. Dimension of strange attractors. Phys Rev Lett1980;45(14):1175–8.
38] Kilic K, Abiyev R. Exploiting the synergy between fractal dimension and lacu-narity for improved texture recognition. Signal Process 2011;91:2332–44.
39] Nekka F. On lacunarity analysis. In: Fractals in Biology and Medicine, vol. 3.2002.
40] IBSR. Available from: http://www.cma.mgh.harvard.edu/ibsr/41] AANLIB. Available from: http://www.med.harvard.edu/aanlib/42] BrainWeb. Available from: http://www.bic.mni.mcgill.ca/brainweb/43] Puspitasari F, Volkau I, Ambrosius W, Nowinski W. Robust calculation of the
midsagittal plane in CT scans using the Kullback–Leibler’s Measure. Int J CARS2009;4:535–47.
44] Schabel M. 3D Shepp Logan Phantom. Available from:http://www.mathworks.com/
45] Sarkar N, Chaudhuri B. An efficient differential box-counting approach to com-pute fractal dimension of image. IEEE Trans Syst Man Cyber 1994;24(1):115–20.
46] Stegmann M, Skoglund K, Ryberg C. Mid-sagittal plane and mid-sagittal surfaceoptimization in brain MRI using a local symmetry measure. In: The proceedingsof SPIE, vol. 5747. 2005. p. 568–79.
47] Lee S, Liu Y. Curved glide-reflection symmetry detection. IEEE Trans PatternAnal Mach Intell 2012;34(2):266–78.
48] Kuijf H, Viergever M, Vincken K. Automatic extraction of the curved midsagittalbrain surface on MR images. MCV 2012 LNCS 2013;7766:225–32.
49] Rorden C, Brett M. Stereotaxic display of brain lesions. Behav Neurol2000;12:191–200.
50] Romanesco; 2004. Available from: http://pdphoto.org/51] Lazebnik S, Schmid C, Ponce J. A sparse texture representation using local affine
regions. IEEE Trans Pattern Anal Mach Intell 2005;27(8):1265–78.52] IDOLON; Available from: http://web2.wzw.tum.de/dvs/idolon/
Surani Jayasuriya received the B.Sc. in Electronic Information Engineering and M.Sc.in Information and Communication Engineering degrees from Tokyo MetropolitanUniversity, Japan, in 2006 and 2008, respectively. She is currently pursuing herPh.D. degree at Griffith University, Australia. Her research interests include medicalimaging, data mining and applications of optics.
Alan Wee-Chung Liew is currently an Associate Professor in the School of Infor-mation and Communication Technology, Griffith University. His research interestincludes computer vision, medical imaging, pattern recognition, and bioinformat-ics. He has over 100 publications in these areas in leading journals and conferences.He is a senior member of IEEE since 2005.
Ngai-Fong Law is currently an Associate Professor in the Department of Electronic
interests include signal and image processing, wavelet transform, image enhance-ment and compression, and bioinformatics. She is actively involved in variousprofessional activities and has been on the organizing committee or programmecommittee of many international conferences.