Embed Size (px)
Citation preview
1
Brain Proton Magnetic Resonance Spectroscopy
Débora Bertholdo, Arvemas Watcharakorn, Mauricio Castillo University of North Carolina at Chapel Hill
United States of America
1. Introduction Magnetic Resonance Spectroscopy (MRS) is an analytical method used in chemistry that enables the identification and quantification of metabolites in samples. It differs from conventional Magnetic Resonance Imaging (MRI) in that spectra provide physiological and chemical information instead of anatomy. MRS and MRI have their origin in Nuclear Magnetic Resonance (NMR). NMR was first described in 1946 simultaneously by the Nobel Prize winners Edward Purcell, from Harvard University, and Felix Bloch, from Stanford University. At that time, NMR was used only by physicists for purposes of determining the nuclear magnetic moments of nuclei. It was only in the mid 1970’s that NMR started to be used in vivo, after Lauterbur, Mansfield and Grannell introduced gradient into the magnetic field enabling them to determinate the location of the emitted signal and to reproduce it in an image. In vivo NMR was renamed MRI because the term “nuclear” was constantly and erroneously associated with nuclear medicine. For the same reason, NMR spectroscopy used in vivo is now named MRS. During the 1980’s, the first MRI medical scanners became available for clinical use. Since then, improvements have been made especially related to higher field strengths. MR spectra may be obtained from different nuclei. Protons (1H) are the most used nuclei for clinical applications in the human brain mainly because of its high sensitivity and abundance. The proton MR spectrum is altered in almost all neurological disorders. In some diseases proton MRS (H-MRS) changes are very subtle and not reliable without a statistical comparison between groups of patients. In these cases, H-MRS is usually used for research. In clinical practice, H-MRS is mostly used for more detailed analysis of primary and secondary brain tumors and metabolic diseases. In this chapter we discuss the physical basis of H-MRS emphasizing the different techniques, the normal spectra in adults and children, its clinical applications and the significance of brain metabolites both under normal and abnormal conditions particularly in the evaluation of brain tumors.
2. Physical Basis
Many nuclei may be used to obtain MR spectra, including phosphorus (31P), fluorine (19F), carbon (13C) and sodium (23Na). The ones mostly used for clinical MRS are protons (H-MRS). The brain is ideally imaged with H-MRS because of its near lack of motion (this prevents MRS from being used in the abdomen and thorax without very sophisticated motion-reduction techniques). The hydrogen nucleus is abundant in human tissues. H-MRS requires only standard radio-frequency (RF) coils and a dedicated software package. For non-proton MRS, RF coils tuned to the Larmor frequency of other nuclei, matching preamplifiers, hybrids and broad-band power amplifier are needed. There are different field strengths clinically used for conventional MRI, ranging from 0.2 to 3T. Since the main objective of MRS is to detect weak signals from metabolites, a higher strength field is required (1.5T or more). Higher field strength units have the advantage of higher signal-to-noise ratio (SNR), better resolution and shorter acquisition times making the technique useful in sick patients and others that cannot hold still for long periods of time. H-MRS is based on the chemical shift properties of the atom. When a tissue is exposed to an external magnetic field, its nuclei will resonate at a frequency (f) that is given by the Larmor equation:
f = γB0
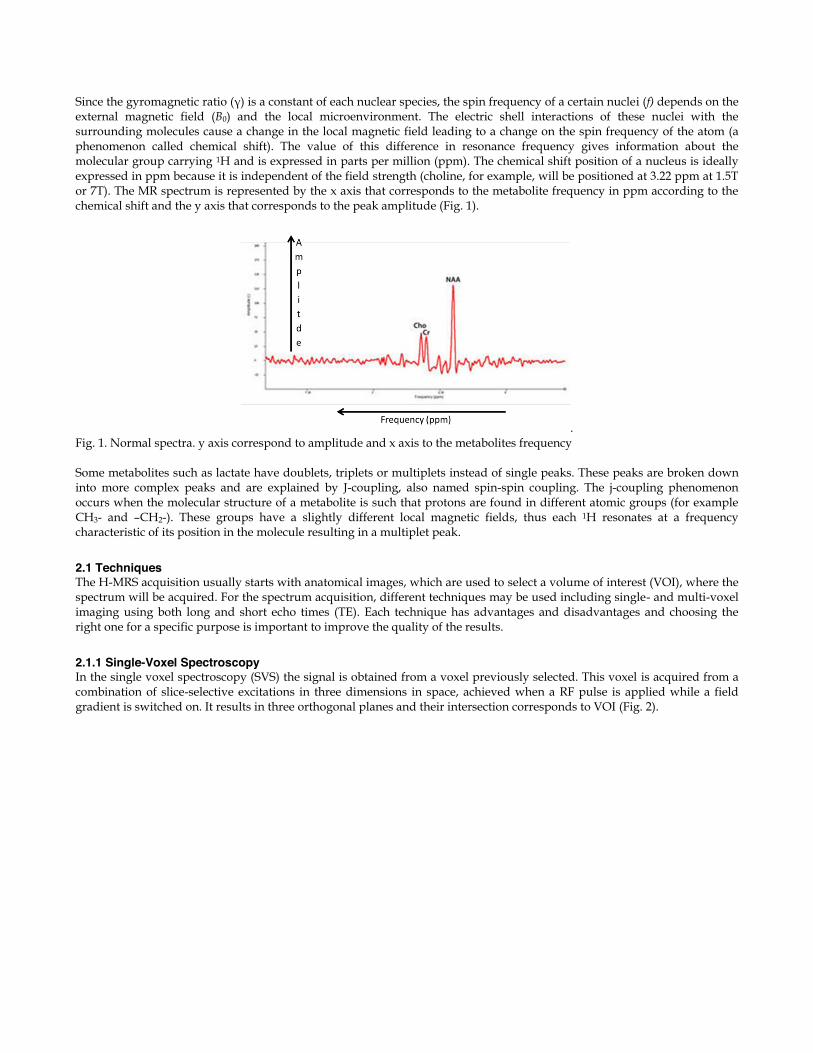
Since the gyromagnetic ratio (γ) is a constant of each nuclear species, the spin frequency of a certain nuclei (f) depends on the external magnetic field (B0) and the local microenvironment. The electric shell interactions of these nuclei with the surrounding molecules cause a change in the local magnetic field leading to a change on the spin frequency of the atom (a phenomenon called chemical shift). The value of this difference in resonance frequency gives information about the molecular group carrying 1H and is expressed in parts per million (ppm). The chemical shift position of a nucleus is ideally expressed in ppm because it is independent of the field strength (choline, for example, will be positioned at 3.22 ppm at 1.5T or 7T). The MR spectrum is represented by the x axis that corresponds to the metabolite frequency in ppm according to the chemical shift and the y axis that corresponds to the peak amplitude (Fig. 1).
. Fig. 1. Normal spectra. y axis correspond to amplitude and x axis to the metabolites frequency Some metabolites such as lactate have doublets, triplets or multiplets instead of single peaks. These peaks are broken down into more complex peaks and are explained by J-coupling, also named spin-spin coupling. The j-coupling phenomenon occurs when the molecular structure of a metabolite is such that protons are found in different atomic groups (for example CH3- and –CH2-). These groups have a slightly different local magnetic fields, thus each 1H resonates at a frequency characteristic of its position in the molecule resulting in a multiplet peak.
2.1 Techniques The H-MRS acquisition usually starts with anatomical images, which are used to select a volume of interest (VOI), where the spectrum will be acquired. For the spectrum acquisition, different techniques may be used including single- and multi-voxel imaging using both long and short echo times (TE). Each technique has advantages and disadvantages and choosing the right one for a specific purpose is important to improve the quality of the results.
2.1.1 Single-Voxel Spectroscopy In the single voxel spectroscopy (SVS) the signal is obtained from a voxel previously selected. This voxel is acquired from a combination of slice-selective excitations in three dimensions in space, achieved when a RF pulse is applied while a field gradient is switched on. It results in three orthogonal planes and their intersection corresponds to VOI (Fig. 2).
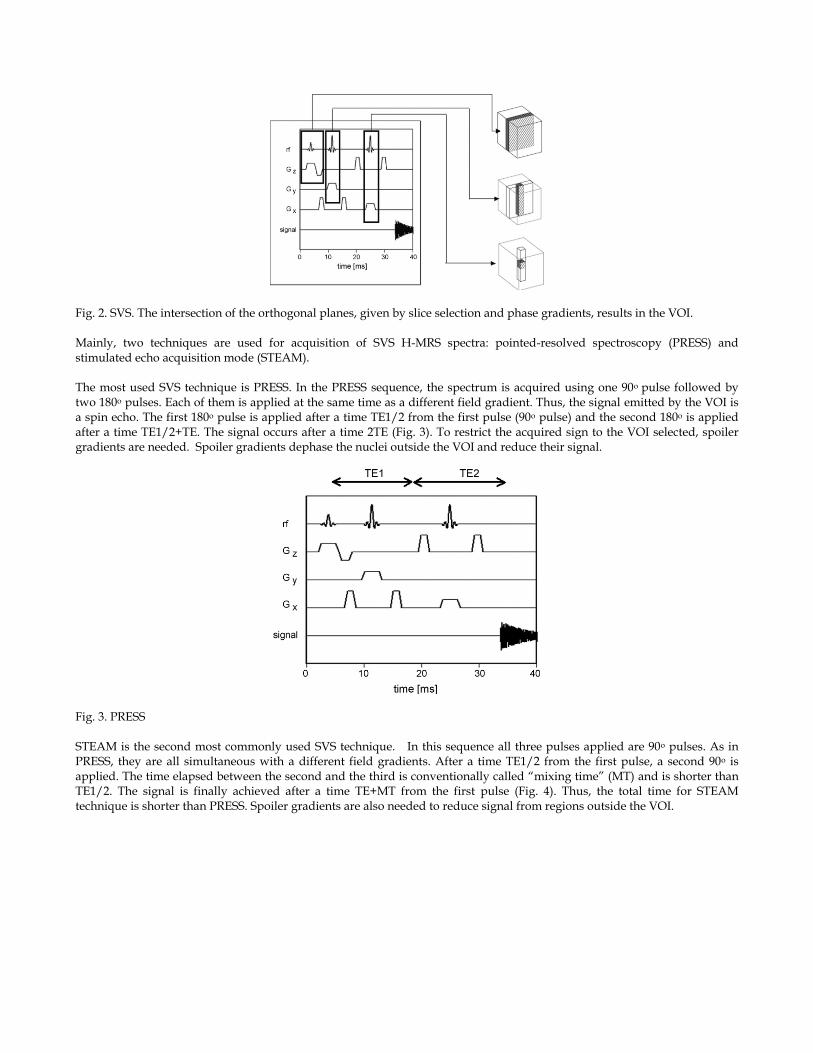
Fig. 2. SVS. The intersection of the orthogonal planes, given by slice selection and phase gradients, results in the VOI. Mainly, two techniques are used for acquisition of SVS H-MRS spectra: pointed-resolved spectroscopy (PRESS) and stimulated echo acquisition mode (STEAM). The most used SVS technique is PRESS. In the PRESS sequence, the spectrum is acquired using one 90o pulse followed by two 180o pulses. Each of them is applied at the same time as a different field gradient. Thus, the signal emitted by the VOI is a spin echo. The first 180o pulse is applied after a time TE1/2 from the first pulse (90o pulse) and the second 180o is applied after a time TE1/2+TE. The signal occurs after a time 2TE (Fig. 3). To restrict the acquired sign to the VOI selected, spoiler gradients are needed. Spoiler gradients dephase the nuclei outside the VOI and reduce their signal.
Fig. 3. PRESS STEAM is the second most commonly used SVS technique. In this sequence all three pulses applied are 90o pulses. As in PRESS, they are all simultaneous with a different field gradients. After a time TE1/2 from the first pulse, a second 90o is applied. The time elapsed between the second and the third is conventionally called “mixing time” (MT) and is shorter than TE1/2. The signal is finally achieved after a time TE+MT from the first pulse (Fig. 4). Thus, the total time for STEAM technique is shorter than PRESS. Spoiler gradients are also needed to reduce signal from regions outside the VOI.
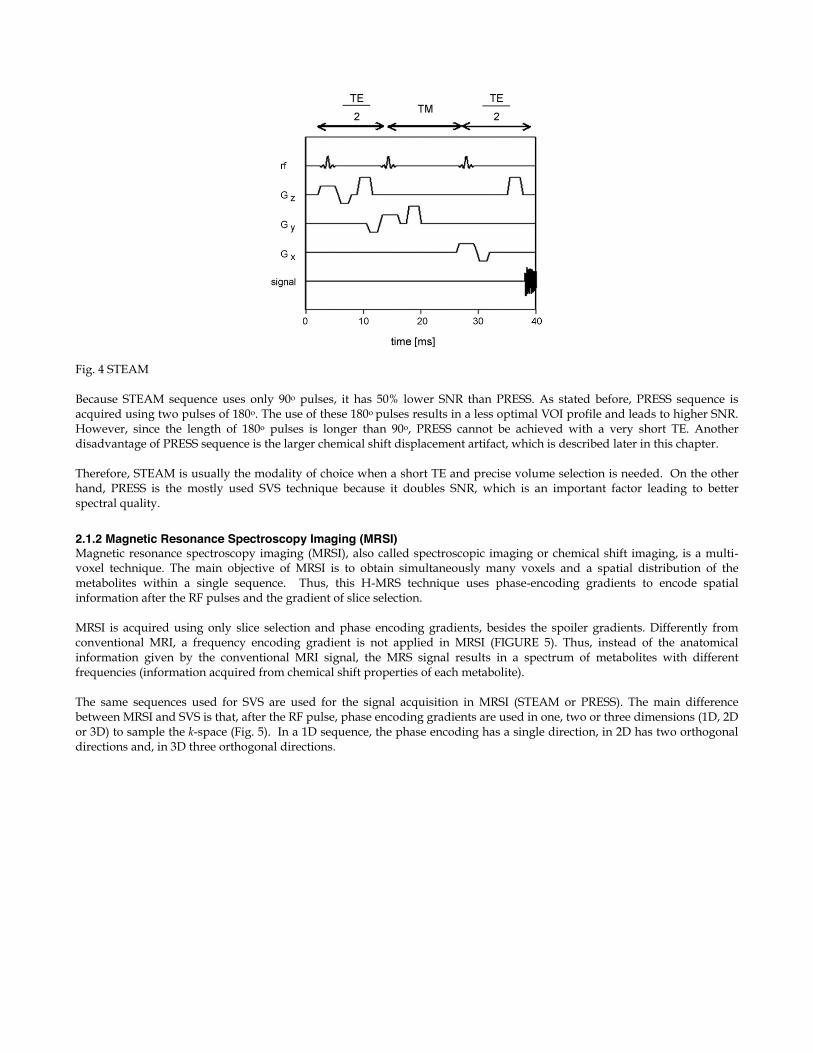
Fig. 4 STEAM Because STEAM sequence uses only 90o pulses, it has 50% lower SNR than PRESS. As stated before, PRESS sequence is acquired using two pulses of 180o. The use of these 180o pulses results in a less optimal VOI profile and leads to higher SNR. However, since the length of 180o pulses is longer than 90o, PRESS cannot be achieved with a very short TE. Another disadvantage of PRESS sequence is the larger chemical shift displacement artifact, which is described later in this chapter. Therefore, STEAM is usually the modality of choice when a short TE and precise volume selection is needed. On the other hand, PRESS is the mostly used SVS technique because it doubles SNR, which is an important factor leading to better spectral quality.
2.1.2 Magnetic Resonance Spectroscopy Imaging (MRSI) Magnetic resonance spectroscopy imaging (MRSI), also called spectroscopic imaging or chemical shift imaging, is a multi-voxel technique. The main objective of MRSI is to obtain simultaneously many voxels and a spatial distribution of the metabolites within a single sequence. Thus, this H-MRS technique uses phase-encoding gradients to encode spatial information after the RF pulses and the gradient of slice selection. MRSI is acquired using only slice selection and phase encoding gradients, besides the spoiler gradients. Differently from conventional MRI, a frequency encoding gradient is not applied in MRSI (FIGURE 5). Thus, instead of the anatomical information given by the conventional MRI signal, the MRS signal results in a spectrum of metabolites with different frequencies (information acquired from chemical shift properties of each metabolite). The same sequences used for SVS are used for the signal acquisition in MRSI (STEAM or PRESS). The main difference between MRSI and SVS is that, after the RF pulse, phase encoding gradients are used in one, two or three dimensions (1D, 2D or 3D) to sample the k-space (Fig. 5). In a 1D sequence, the phase encoding has a single direction, in 2D has two orthogonal directions and, in 3D three orthogonal directions.
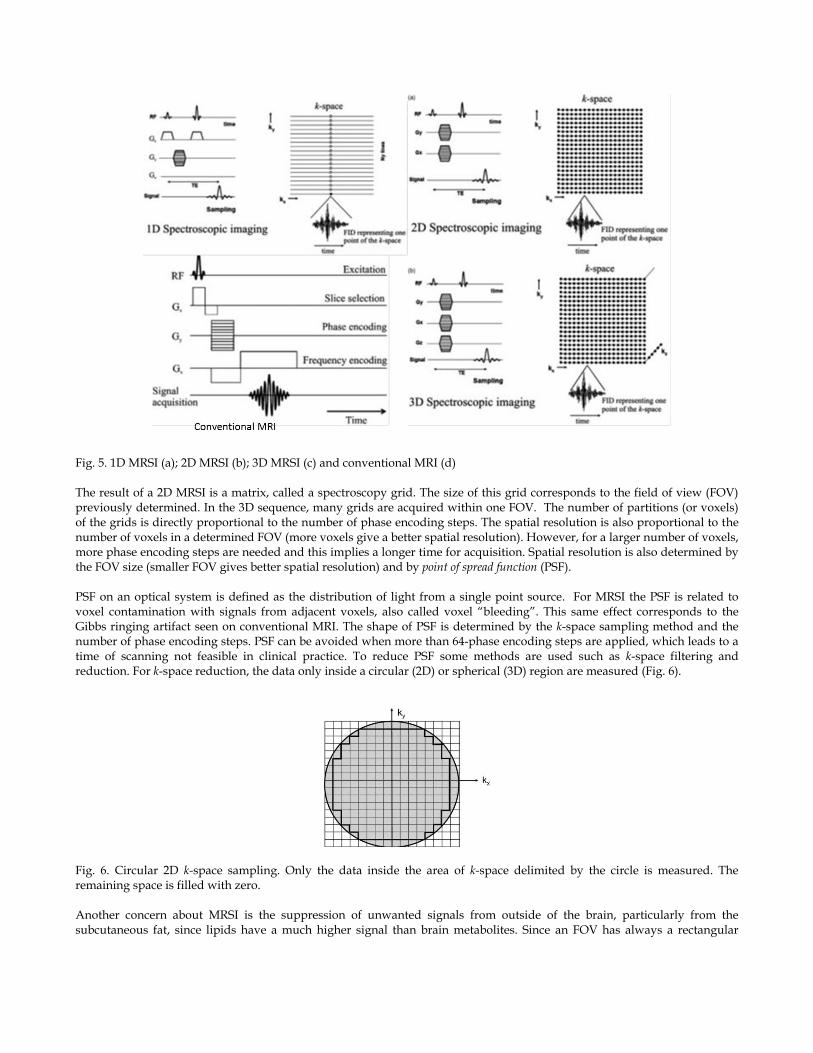
Fig. 5. 1D MRSI (a); 2D MRSI (b); 3D MRSI (c) and conventional MRI (d) The result of a 2D MRSI is a matrix, called a spectroscopy grid. The size of this grid corresponds to the field of view (FOV) previously determined. In the 3D sequence, many grids are acquired within one FOV. The number of partitions (or voxels) of the grids is directly proportional to the number of phase encoding steps. The spatial resolution is also proportional to the number of voxels in a determined FOV (more voxels give a better spatial resolution). However, for a larger number of voxels, more phase encoding steps are needed and this implies a longer time for acquisition. Spatial resolution is also determined by the FOV size (smaller FOV gives better spatial resolution) and by point of spread function (PSF). PSF on an optical system is defined as the distribution of light from a single point source. For MRSI the PSF is related to voxel contamination with signals from adjacent voxels, also called voxel “bleeding”. This same effect corresponds to the Gibbs ringing artifact seen on conventional MRI. The shape of PSF is determined by the k-space sampling method and the number of phase encoding steps. PSF can be avoided when more than 64-phase encoding steps are applied, which leads to a time of scanning not feasible in clinical practice. To reduce PSF some methods are used such as k-space filtering and reduction. For k-space reduction, the data only inside a circular (2D) or spherical (3D) region are measured (Fig. 6).
Fig. 6. Circular 2D k-space sampling. Only the data inside the area of k-space delimited by the circle is measured. The remaining space is filled with zero. Another concern about MRSI is the suppression of unwanted signals from outside of the brain, particularly from the subcutaneous fat, since lipids have a much higher signal than brain metabolites. Since an FOV has always a rectangular
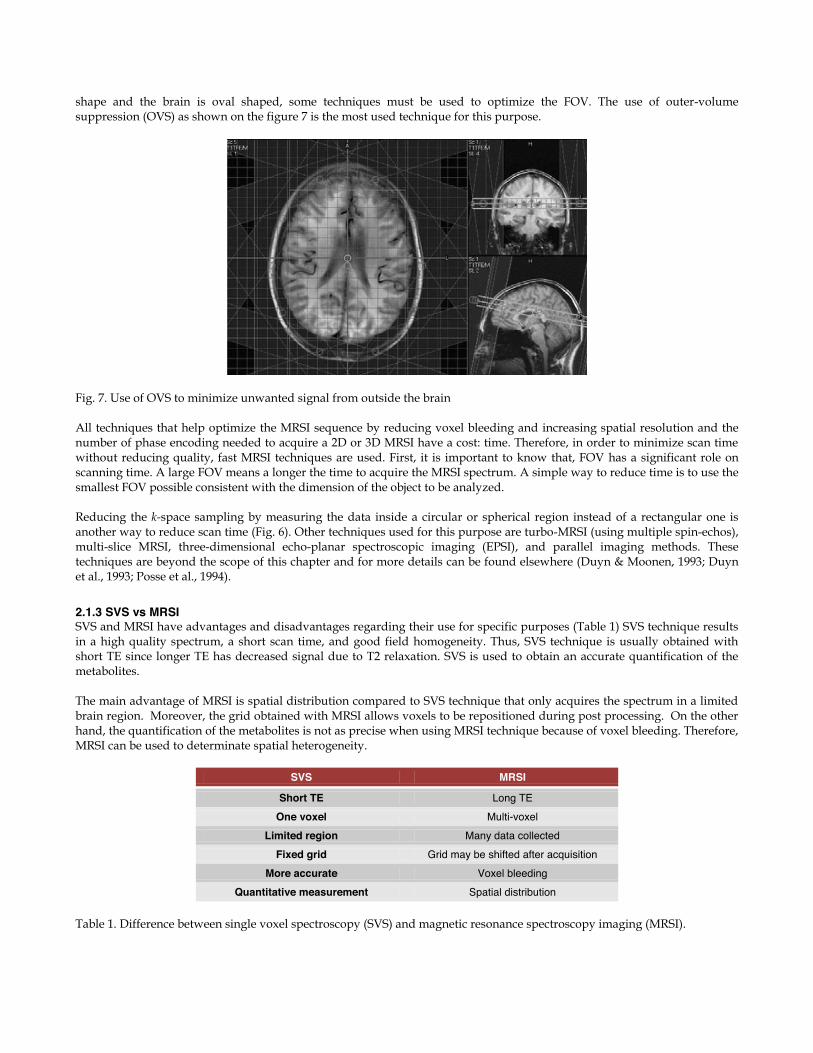
shape and the brain is oval shaped, some techniques must be used to optimize the FOV. The use of outer-volume suppression (OVS) as shown on the figure 7 is the most used technique for this purpose.
Fig. 7. Use of OVS to minimize unwanted signal from outside the brain All techniques that help optimize the MRSI sequence by reducing voxel bleeding and increasing spatial resolution and the number of phase encoding needed to acquire a 2D or 3D MRSI have a cost: time. Therefore, in order to minimize scan time without reducing quality, fast MRSI techniques are used. First, it is important to know that, FOV has a significant role on scanning time. A large FOV means a longer the time to acquire the MRSI spectrum. A simple way to reduce time is to use the smallest FOV possible consistent with the dimension of the object to be analyzed. Reducing the k-space sampling by measuring the data inside a circular or spherical region instead of a rectangular one is another way to reduce scan time (Fig. 6). Other techniques used for this purpose are turbo-MRSI (using multiple spin-echos), multi-slice MRSI, three-dimensional echo-planar spectroscopic imaging (EPSI), and parallel imaging methods. These techniques are beyond the scope of this chapter and for more details can be found elsewhere (Duyn & Moonen, 1993; Duyn et al., 1993; Posse et al., 1994).
2.1.3 SVS vs MRSI SVS and MRSI have advantages and disadvantages regarding their use for specific purposes (Table 1) SVS technique results in a high quality spectrum, a short scan time, and good field homogeneity. Thus, SVS technique is usually obtained with short TE since longer TE has decreased signal due to T2 relaxation. SVS is used to obtain an accurate quantification of the metabolites. The main advantage of MRSI is spatial distribution compared to SVS technique that only acquires the spectrum in a limited brain region. Moreover, the grid obtained with MRSI allows voxels to be repositioned during post processing. On the other hand, the quantification of the metabolites is not as precise when using MRSI technique because of voxel bleeding. Therefore, MRSI can be used to determinate spatial heterogeneity.
SVS MRSI
Short TE Long TE One voxel Multi-voxel
Limited region Many data collected Fixed grid Grid may be shifted after acquisition
More accurate Voxel bleeding Quantitative measurement Spatial distribution
Table 1. Difference between single voxel spectroscopy (SVS) and magnetic resonance spectroscopy imaging (MRSI).
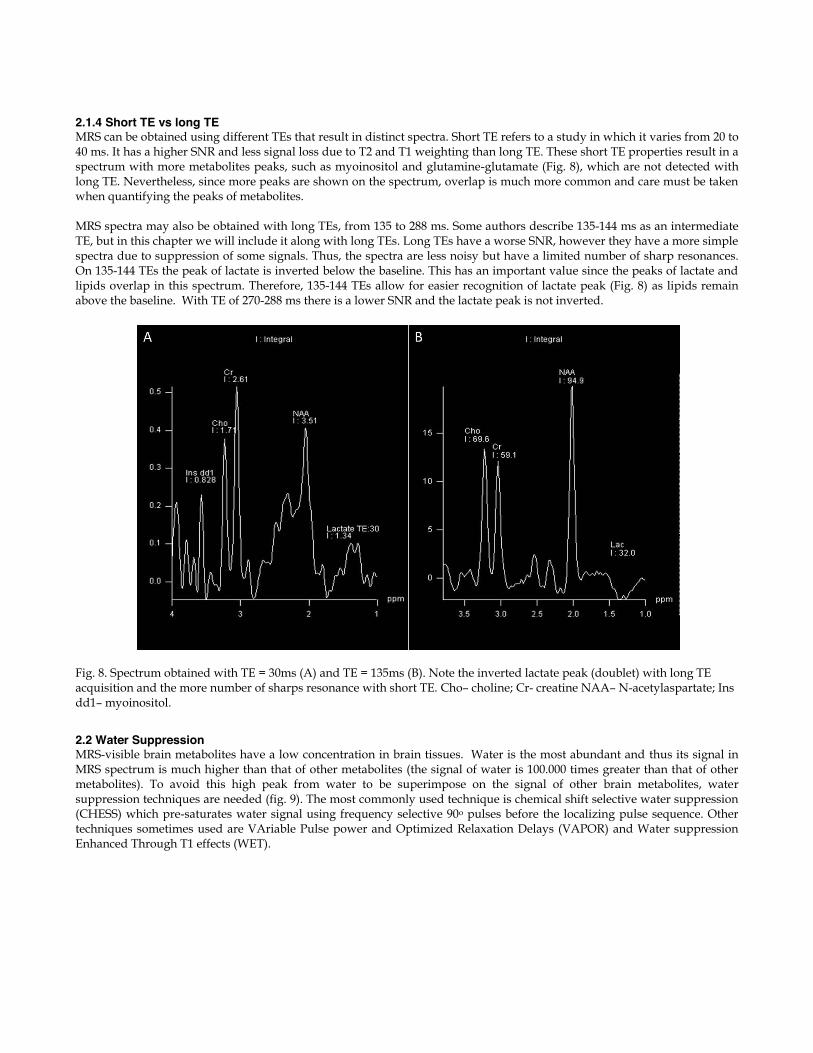
2.1.4 Short TE vs long TE MRS can be obtained using different TEs that result in distinct spectra. Short TE refers to a study in which it varies from 20 to 40 ms. It has a higher SNR and less signal loss due to T2 and T1 weighting than long TE. These short TE properties result in a spectrum with more metabolites peaks, such as myoinositol and glutamine-glutamate (Fig. 8), which are not detected with long TE. Nevertheless, since more peaks are shown on the spectrum, overlap is much more common and care must be taken when quantifying the peaks of metabolites. MRS spectra may also be obtained with long TEs, from 135 to 288 ms. Some authors describe 135-144 ms as an intermediate TE, but in this chapter we will include it along with long TEs. Long TEs have a worse SNR, however they have a more simple spectra due to suppression of some signals. Thus, the spectra are less noisy but have a limited number of sharp resonances. On 135-144 TEs the peak of lactate is inverted below the baseline. This has an important value since the peaks of lactate and lipids overlap in this spectrum. Therefore, 135-144 TEs allow for easier recognition of lactate peak (Fig. 8) as lipids remain above the baseline. With TE of 270-288 ms there is a lower SNR and the lactate peak is not inverted.
Fig. 8. Spectrum obtained with TE = 30ms (A) and TE = 135ms (B). Note the inverted lactate peak (doublet) with long TE acquisition and the more number of sharps resonance with short TE. Cho– choline; Cr- creatine NAA– N-acetylaspartate; Ins dd1– myoinositol.
2.2 Water Suppression MRS-visible brain metabolites have a low concentration in brain tissues. Water is the most abundant and thus its signal in MRS spectrum is much higher than that of other metabolites (the signal of water is 100.000 times greater than that of other metabolites). To avoid this high peak from water to be superimpose on the signal of other brain metabolites, water suppression techniques are needed (fig. 9). The most commonly used technique is chemical shift selective water suppression (CHESS) which pre-saturates water signal using frequency selective 90o pulses before the localizing pulse sequence. Other techniques sometimes used are VAriable Pulse power and Optimized Relaxation Delays (VAPOR) and Water suppression Enhanced Through T1 effects (WET).
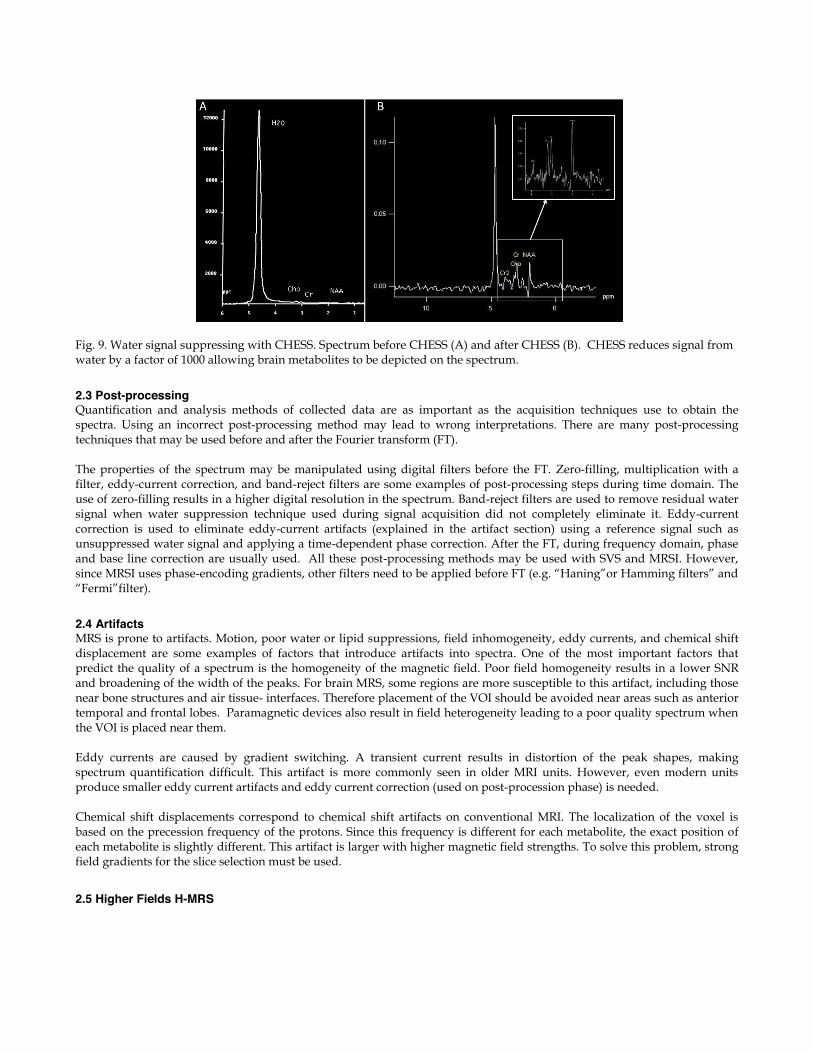
Fig. 9. Water signal suppressing with CHESS. Spectrum before CHESS (A) and after CHESS (B). CHESS reduces signal from water by a factor of 1000 allowing brain metabolites to be depicted on the spectrum.
2.3 Post-processing Quantification and analysis methods of collected data are as important as the acquisition techniques use to obtain the spectra. Using an incorrect post-processing method may lead to wrong interpretations. There are many post-processing techniques that may be used before and after the Fourier transform (FT). The properties of the spectrum may be manipulated using digital filters before the FT. Zero-filling, multiplication with a filter, eddy-current correction, and band-reject filters are some examples of post-processing steps during time domain. The use of zero-filling results in a higher digital resolution in the spectrum. Band-reject filters are used to remove residual water signal when water suppression technique used during signal acquisition did not completely eliminate it. Eddy-current correction is used to eliminate eddy-current artifacts (explained in the artifact section) using a reference signal such as unsuppressed water signal and applying a time-dependent phase correction. After the FT, during frequency domain, phase and base line correction are usually used. All these post-processing methods may be used with SVS and MRSI. However, since MRSI uses phase-encoding gradients, other filters need to be applied before FT (e.g. “Haning”or Hamming filters” and “Fermi”filter).
2.4 Artifacts MRS is prone to artifacts. Motion, poor water or lipid suppressions, field inhomogeneity, eddy currents, and chemical shift displacement are some examples of factors that introduce artifacts into spectra. One of the most important factors that predict the quality of a spectrum is the homogeneity of the magnetic field. Poor field homogeneity results in a lower SNR and broadening of the width of the peaks. For brain MRS, some regions are more susceptible to this artifact, including those near bone structures and air tissue- interfaces. Therefore placement of the VOI should be avoided near areas such as anterior temporal and frontal lobes. Paramagnetic devices also result in field heterogeneity leading to a poor quality spectrum when the VOI is placed near them. Eddy currents are caused by gradient switching. A transient current results in distortion of the peak shapes, making spectrum quantification difficult. This artifact is more commonly seen in older MRI units. However, even modern units produce smaller eddy current artifacts and eddy current correction (used on post-procession phase) is needed. Chemical shift displacements correspond to chemical shift artifacts on conventional MRI. The localization of the voxel is based on the precession frequency of the protons. Since this frequency is different for each metabolite, the exact position of each metabolite is slightly different. This artifact is larger with higher magnetic field strengths. To solve this problem, strong field gradients for the slice selection must be used.
2.5 Higher Fields H-MRS
Higher field MRI (3T, 7T and above) is used in many centers mostly for research purposes. On the past decade, 3T MRI started to be routinely used for clinical examinations and it results in better SNR and faster acquisitions factor which are important in sick patients that cannot hold still. H-MRS performed at 3T MRI has a higher SNR and a reduced acquisition time compared to 1.5T. It was believed that SNR would increase linearly with the strength of the magnetic field but SNR does not double with 3T H-MRS because others factors are also responsible for the SNR, including metabolite relaxation time and magnetic field homogeneity. Spectral resolution is improved with higher magnetic field. A better spatial resolution increases the distance between peaks making it easier to distinguish between them. This is important particularly for resonances from coupled spins such as glutamate, glutamine and myo-inositol. However, the metabolites linewidth also increases at higher magnetic field due to a markedly increase T2 relaxation time. Thus, short TE is more commonly used with 3T. The difference of T1 relaxation time from 1.5T to3T depends on the brain region studied (Ethofer, 2003). 3T H-MRS is more sensitive to magnetic field inhomogeneity andsome artifacts are more pronounced with it particularly susceptibility and eddy currents ones. Chemical shift displacement is also larger at 3T and this artifact increases linearly with the magnetic field. Not only field strength has improved on the past few years, but also receiver coils. The use of multiple radiofrequency receiver coils for MRS provides higher local sensitivity and results in higher SNR. These coils also allow a more extended coverage of the brain.
3. Spectra
H-MRS allows the detection of brain metabolites. The metabolite changes often precede structural abnormalities and MRS can demonstrate abnormalities before MRI does (Fayed et al., 2006). To detect these spectral alterations, it is fundamental to know the normal brain spectra and their variations according to the each technique, patient age, and brain region. 1H spectra of metabolites are shown on x and y axes. The x, horizontal, axis displays the chemical shift of the metabolites in units of ppm. The ppm increases from right to left. The y, vertical, axis demonstrates arbitrary signal amplitude of the metabolites. The height of metabolic peak refers to a relative concentration and the area under the curve to metabolite concentration (Fayed et al., 2006). Long TE sequences result in less noise than short TE sequences but several metabolites are better demonstrated with short TE. In 1.5T MR scanners, long TE sequences (TE = 135-288 ms) detect NAA, Cr, Cho, Lac and possibly Ala. Short TE sequences (TE = 20-40 ms) demonstrate the metabolites seen with long TE acquisitions and in addition Lip, Myo, Glx, glucose, and some macromolecular proteins) (Fig. 10).
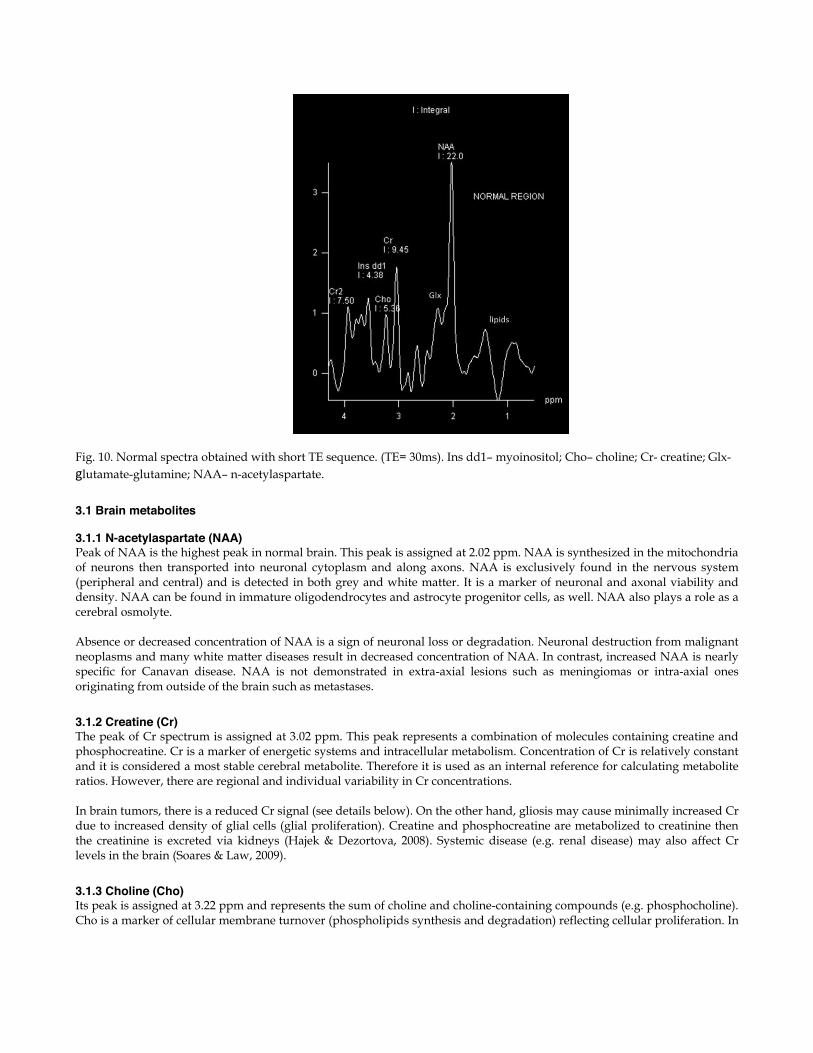
Fig. 10. Normal spectra obtained with short TE sequence. (TE= 30ms). Ins dd1– myoinositol; Cho– choline; Cr- creatine; Glx- glutamate-glutamine; NAA– n-acetylaspartate.
3.1 Brain metabolites 3.1.1 N-acetylaspartate (NAA) Peak of NAA is the highest peak in normal brain. This peak is assigned at 2.02 ppm. NAA is synthesized in the mitochondria of neurons then transported into neuronal cytoplasm and along axons. NAA is exclusively found in the nervous system (peripheral and central) and is detected in both grey and white matter. It is a marker of neuronal and axonal viability and density. NAA can be found in immature oligodendrocytes and astrocyte progenitor cells, as well. NAA also plays a role as a cerebral osmolyte. Absence or decreased concentration of NAA is a sign of neuronal loss or degradation. Neuronal destruction from malignant neoplasms and many white matter diseases result in decreased concentration of NAA. In contrast, increased NAA is nearly specific for Canavan disease. NAA is not demonstrated in extra-axial lesions such as meningiomas or intra-axial ones originating from outside of the brain such as metastases.
3.1.2 Creatine (Cr) The peak of Cr spectrum is assigned at 3.02 ppm. This peak represents a combination of molecules containing creatine and phosphocreatine. Cr is a marker of energetic systems and intracellular metabolism. Concentration of Cr is relatively constant and it is considered a most stable cerebral metabolite. Therefore it is used as an internal reference for calculating metabolite ratios. However, there are regional and individual variability in Cr concentrations. In brain tumors, there is a reduced Cr signal (see details below). On the other hand, gliosis may cause minimally increased Cr due to increased density of glial cells (glial proliferation). Creatine and phosphocreatine are metabolized to creatinine then the creatinine is excreted via kidneys (Hajek & Dezortova, 2008). Systemic disease (e.g. renal disease) may also affect Cr levels in the brain (Soares & Law, 2009).
3.1.3 Choline (Cho) Its peak is assigned at 3.22 ppm and represents the sum of choline and choline-containing compounds (e.g. phosphocholine). Cho is a marker of cellular membrane turnover (phospholipids synthesis and degradation) reflecting cellular proliferation. In
tumors, Cho levels correlate with degree of malignancy reflecting of cellularity. Increase Cho may be seen in infarction (from gliosis or ischemic damage to myelin) or inflammation (glial proliferation) hence elevated Cho is nonspecific.
3.1.4 Lactate (Lac) Peak of Lac is not seen or is hardly visualized in the normal brain. The peak of Lac is a doublet at 1.33 ppm which projects above the baseline on short/long TE acquisition and inverts below the baseline at TE of 135-144 msec. A small peak of Lac can be visible in some physiological states such as newborn brains during the first hours of life (Mullins, 2006). Lac is a product of anaerobic glycolysis so its concentration increases under anaerobic metabolism such as cerebral hypoxia, ischemia, seizures and metabolic disorders (especially mitochondrial ones). Increased Lac signals also occur with macrophage accumulation (e.g. acute inflammation). Lac also accumulates in tissues with poor washout such as cysts, normal pressure hydrocephalus, and necrotic and cystic tumors (Soares & Law, 2009).
3.1.5 Lipids (Lip) Lipids are components of cell membranes not visualized on long TE because of their very short relaxation time. There are two peaks of lipids: methylene protons at 1.3 ppm and methyl protons at 0.9 ppm (van der Graaf, 2010). These peaks are absent in the normal brain, but presence of lipids may result from improper voxel selection causing voxel contamination from adjacent fatty tissues (e.g. fat in subcutaneous tissue, scalp and diploic space). Lipid peak scan be seen when there is cellular membrane breakdown or necrosis such as in metastases or primary malignant tumors.
3.1.6 Myoinositol (Myo) Myo is a simple sugar assigned at 3.56 ppm. Myo is considered a glial marker because it is primarily synthesized in glial cells, almost only in astrocytes. It is also the most important osmolyte in astrocytes. Myo may represent a product of myelin degradation. Elevated Myo occurs with proliferation of glial cells or with increased glial-cell size as found in inflammation. Myo is elevated in gliosis, astrocytosis and in Alzheimer’s disease (Soares & Law, 2009;; van der Graaf, 2010).
3.1.7 Alanine (Ala) Ala is an amino acid that has a doublet centered at 1.48 ppm. This peak is located above the baseline in spectra obtained with short/long TE and inverts below the baseline on acquisition using TE= 135-144 msec . Its peak may be obscured by Lac (at 1.33 ppm). The function of Ala is uncertain but it plays a role in the citric acid cycle (Soares & Law, 2009). Increased concentration of Ala may occur in oxidative metabolism defects (van der Graaf, 2010). In tumors, elevated level of Ala is specific for meningiomas.
3.1.8 Glutamate-Glutamine (Glx) Glx is a complex peaks from glutamate (Glu), Glutamine (Gln) and gamma-aminobutyric acid (GABA) assigned at 2.05-2.50 ppm. These metabolite peaks are difficult to separate at 1.5 T. Glu is an important excitatory neurotransmitter and also plays a role in the redox cycle (Soares & Law, 2009; van der Graaf, 2010). Elevated concentration of Gln is found in a few diseases such as hepatic encephalopathy (Fayed et al., 2006; van der Graaf, 2010).
3.2 Regional variations of the spectra Metabolite peaks may slightly differ according to the brain region studied. Studies have shown differences between the spectra of white and gray matter and supratentorial and infratentorial structures. Nevertheless, no significant asymmetries of metabolite spectra between the left and the right hemispheres nor between genders have been found (Charles et al., 1994; Nagae-Poetscher et al., 2004) In specific quantitative techniques, concentration of NAA in grey matter is higher than that in white matter. For clinical purposes concentrations of NAA in both grey and white matter are not significantly different. Most studies have found higher Cho levels in white matter than in grey matter whereas Cr level is higher in grey matter (Hajek & Dezortova, 2008; Hetherington et al., 1994; Kreis et al., 1993a; Soher et al., 1996). There are some frontal-occipital variations too. The most outstanding difference is a caudally decreased in Cho in the cortex (Degaonkar et al., 2005; Pouwels & Frahm, 1998). Regional variations of Glx and Myo have been studied less than those of NAA, Cho and Cr. One study (Baker et al., 2008)
found higher Glx levels in grey matter than in white matter. The regional distribution of Myo is unclear but tends to be higher in grey than in white matter (Baker et al., 2008). Of the brainstem and cerebellum the highest levels of NAA are in the pons (Jacobs et al., 2001). Significantly higher levels of Cho have been found in the cerebellum and pons compared to supratentorial regions (Jacobs et al., 2001; Pouwels & Frahm, 1998). Cerebellar levels of Cr are also significantly higher than supratentorial levels while low levels of Cr are seen in the pons (Jacobs et al., 2001; Pouwels & Frahm, 1998). MRS of the hippocampus has been studied especially in epilepsy and Alzheimer disease. There are anterior-posterior gradients of metabolites in the hippocampi. Concentration of Cho increases from posterior to anterior hippocampus whereas lower NAA has been found anteriorly (Arslanoglu et al., 2004; Vermathen et al., 2000).
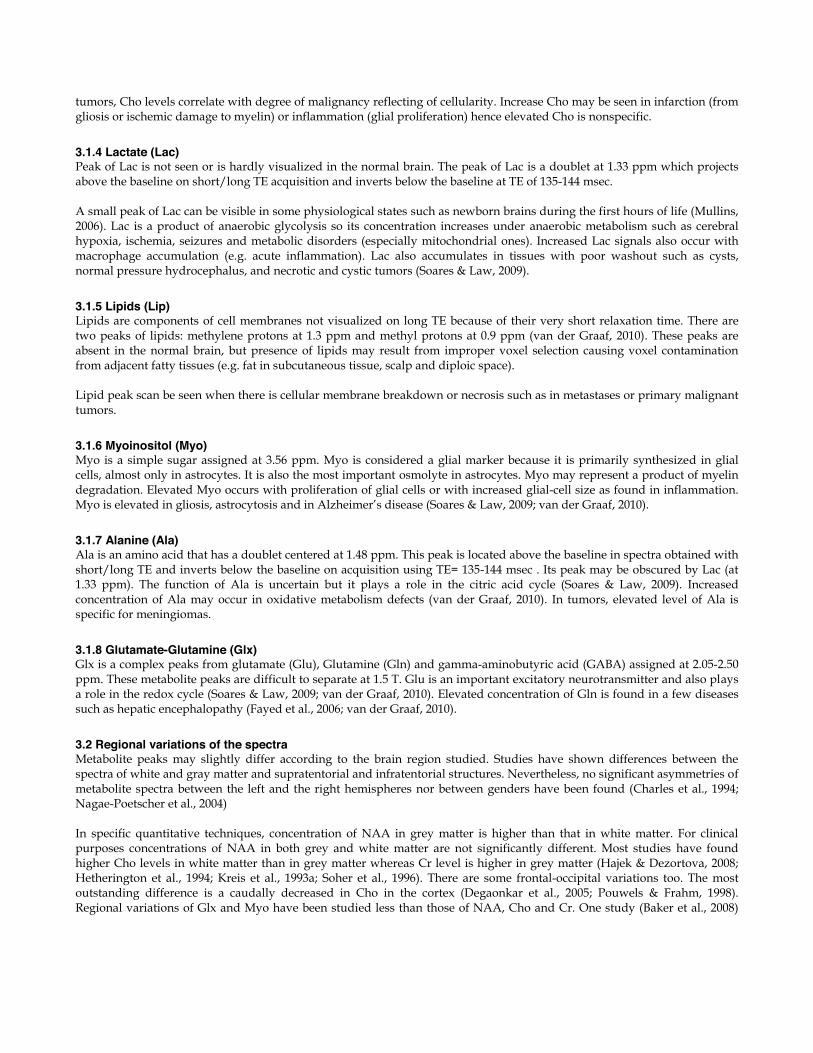
3.3 Spectra in pediatrics Regardless of the differences in methodology, there are differences in metabolite levels in the developing brain. MR spectra depend on age and during the first year of life significant changes occur. In general, the spectral pattern in pediatrics is considered to be similar to that of the adults older than 2 years of age and the concentration of metabolites is practically constant by 4 years of age (Dezortova & Hajek, 2008; Kreis et al., 1993b; Soares & Law, 2009). NAA levels are low whereas Myo and Cho levels are high at birth. Both grey and white matter show similar patterns. Myo is a prominent metabolite in brain spectra of newborns. As age increases, increased concentration of NAA and decreased concentrations of choline-containing compounds and Myo become evident (Dezortova & Hajek, 2008; Fayed et al., 2006; Soares & Law, 2009). Concentrations of creatine and phosphocreatine are constant and may be used as reference values (Fig 12). Increased concentration of NAA reflects brain maturation and its concentration correlates with myelination (Dezortova & Hajek, 2008; Hajek & Dezortova, 2008). With cerebral maturation, there is also a decrease in concentration of choline compounds. A small amount of Lac may be seen in newborn brains (Mullins, 2006). Glu and Gln do not demonstrate significant alterations with age (Dezortova & Hajek, 2008).
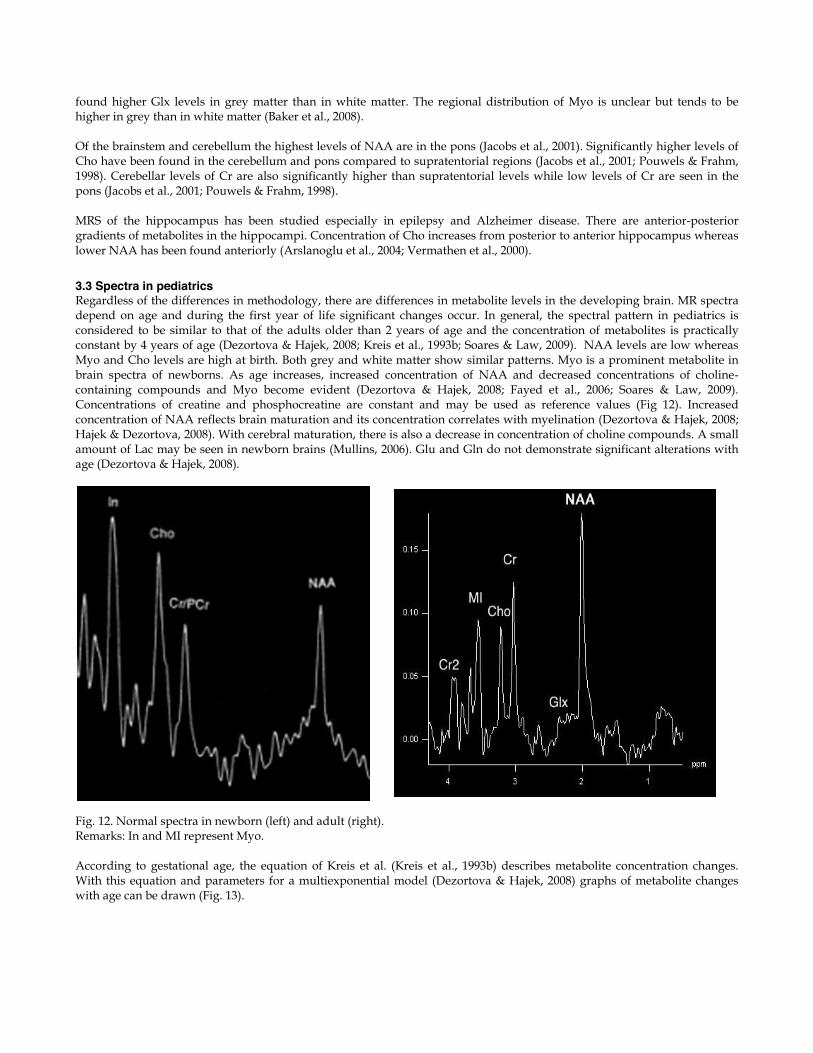
Fig. 12. Normal spectra in newborn (left) and adult (right). Remarks: In and MI represent Myo. According to gestational age, the equation of Kreis et al. (Kreis et al., 1993b) describes metabolite concentration changes. With this equation and parameters for a multiexponential model (Dezortova & Hajek, 2008) graphs of metabolite changes with age can be drawn (Fig. 13).
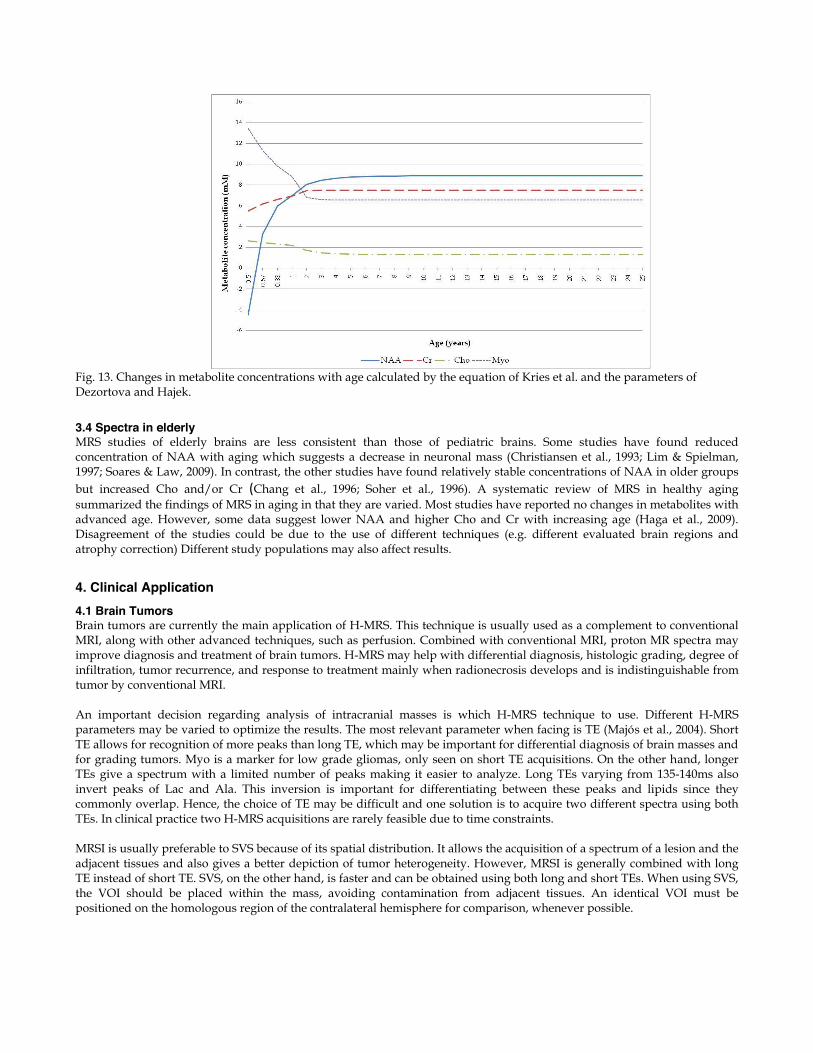
Fig. 13. Changes in metabolite concentrations with age calculated by the equation of Kries et al. and the parameters of Dezortova and Hajek.
3.4 Spectra in elderly MRS studies of elderly brains are less consistent than those of pediatric brains. Some studies have found reduced concentration of NAA with aging which suggests a decrease in neuronal mass (Christiansen et al., 1993; Lim & Spielman, 1997; Soares & Law, 2009). In contrast, the other studies have found relatively stable concentrations of NAA in older groups but increased Cho and/or Cr (Chang et al., 1996; Soher et al., 1996). A systematic review of MRS in healthy aging summarized the findings of MRS in aging in that they are varied. Most studies have reported no changes in metabolites with advanced age. However, some data suggest lower NAA and higher Cho and Cr with increasing age (Haga et al., 2009). Disagreement of the studies could be due to the use of different techniques (e.g. different evaluated brain regions and atrophy correction) Different study populations may also affect results.
4. Clinical Application 4.1 Brain Tumors Brain tumors are currently the main application of H-MRS. This technique is usually used as a complement to conventional MRI, along with other advanced techniques, such as perfusion. Combined with conventional MRI, proton MR spectra may improve diagnosis and treatment of brain tumors. H-MRS may help with differential diagnosis, histologic grading, degree of infiltration, tumor recurrence, and response to treatment mainly when radionecrosis develops and is indistinguishable from tumor by conventional MRI. An important decision regarding analysis of intracranial masses is which H-MRS technique to use. Different H-MRS parameters may be varied to optimize the results. The most relevant parameter when facing is TE (Majós et al., 2004). Short TE allows for recognition of more peaks than long TE, which may be important for differential diagnosis of brain masses and for grading tumors. Myo is a marker for low grade gliomas, only seen on short TE acquisitions. On the other hand, longer TEs give a spectrum with a limited number of peaks making it easier to analyze. Long TEs varying from 135-140ms also invert peaks of Lac and Ala. This inversion is important for differentiating between these peaks and lipids since they commonly overlap. Hence, the choice of TE may be difficult and one solution is to acquire two different spectra using both TEs. In clinical practice two H-MRS acquisitions are rarely feasible due to time constraints. MRSI is usually preferable to SVS because of its spatial distribution. It allows the acquisition of a spectrum of a lesion and the adjacent tissues and also gives a better depiction of tumor heterogeneity. However, MRSI is generally combined with long TE instead of short TE. SVS, on the other hand, is faster and can be obtained using both long and short TEs. When using SVS, the VOI should be placed within the mass, avoiding contamination from adjacent tissues. An identical VOI must be positioned on the homologous region of the contralateral hemisphere for comparison, whenever possible.
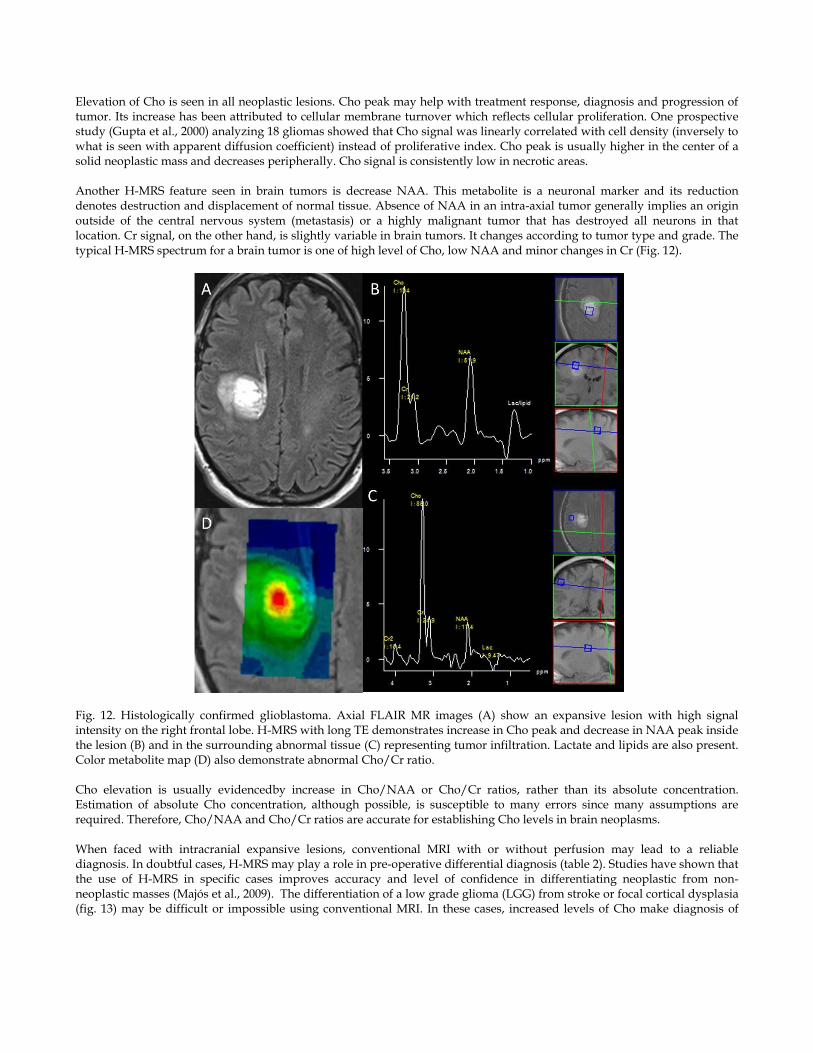
Elevation of Cho is seen in all neoplastic lesions. Cho peak may help with treatment response, diagnosis and progression of tumor. Its increase has been attributed to cellular membrane turnover which reflects cellular proliferation. One prospective study (Gupta et al., 2000) analyzing 18 gliomas showed that Cho signal was linearly correlated with cell density (inversely to what is seen with apparent diffusion coefficient) instead of proliferative index. Cho peak is usually higher in the center of a solid neoplastic mass and decreases peripherally. Cho signal is consistently low in necrotic areas. Another H-MRS feature seen in brain tumors is decrease NAA. This metabolite is a neuronal marker and its reduction denotes destruction and displacement of normal tissue. Absence of NAA in an intra-axial tumor generally implies an origin outside of the central nervous system (metastasis) or a highly malignant tumor that has destroyed all neurons in that location. Cr signal, on the other hand, is slightly variable in brain tumors. It changes according to tumor type and grade. The typical H-MRS spectrum for a brain tumor is one of high level of Cho, low NAA and minor changes in Cr (Fig. 12).
Fig. 12. Histologically confirmed glioblastoma. Axial FLAIR MR images (A) show an expansive lesion with high signal intensity on the right frontal lobe. H-MRS with long TE demonstrates increase in Cho peak and decrease in NAA peak inside the lesion (B) and in the surrounding abnormal tissue (C) representing tumor infiltration. Lactate and lipids are also present. Color metabolite map (D) also demonstrate abnormal Cho/Cr ratio. Cho elevation is usually evidencedby increase in Cho/NAA or Cho/Cr ratios, rather than its absolute concentration. Estimation of absolute Cho concentration, although possible, is susceptible to many errors since many assumptions are required. Therefore, Cho/NAA and Cho/Cr ratios are accurate for establishing Cho levels in brain neoplasms. When faced with intracranial expansive lesions, conventional MRI with or without perfusion may lead to a reliable diagnosis. In doubtful cases, H-MRS may play a role in pre-operative differential diagnosis (table 2). Studies have shown that the use of H-MRS in specific cases improves accuracy and level of confidence in differentiating neoplastic from non-neoplastic masses (Majós et al., 2009). The differentiation of a low grade glioma (LGG) from stroke or focal cortical dysplasia (fig. 13) may be difficult or impossible using conventional MRI. In these cases, increased levels of Cho make diagnosis of
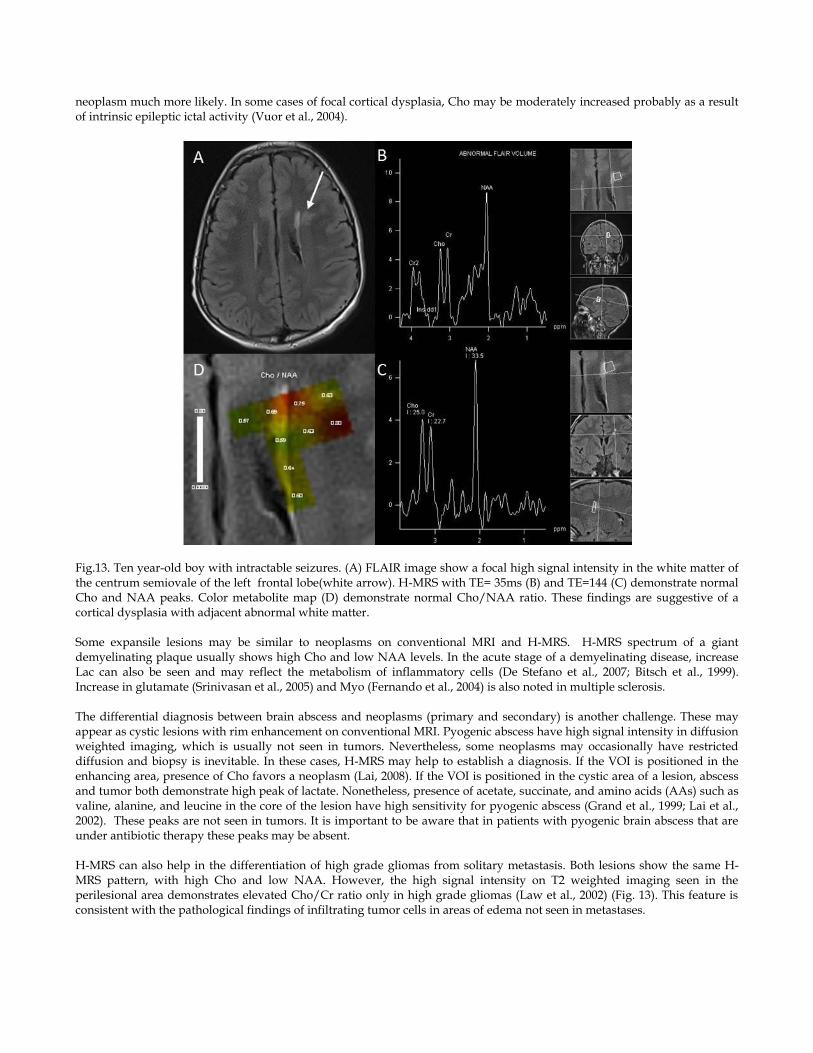
neoplasm much more likely. In some cases of focal cortical dysplasia, Cho may be moderately increased probably as a result of intrinsic epileptic ictal activity (Vuor et al., 2004).
Fig.13. Ten year-old boy with intractable seizures. (A) FLAIR image show a focal high signal intensity in the white matter of the centrum semiovale of the left frontal lobe(white arrow). H-MRS with TE= 35ms (B) and TE=144 (C) demonstrate normal Cho and NAA peaks. Color metabolite map (D) demonstrate normal Cho/NAA ratio. These findings are suggestive of a cortical dysplasia with adjacent abnormal white matter. Some expansile lesions may be similar to neoplasms on conventional MRI and H-MRS. H-MRS spectrum of a giant demyelinating plaque usually shows high Cho and low NAA levels. In the acute stage of a demyelinating disease, increase Lac can also be seen and may reflect the metabolism of inflammatory cells (De Stefano et al., 2007; Bitsch et al., 1999). Increase in glutamate (Srinivasan et al., 2005) and Myo (Fernando et al., 2004) is also noted in multiple sclerosis. The differential diagnosis between brain abscess and neoplasms (primary and secondary) is another challenge. These may appear as cystic lesions with rim enhancement on conventional MRI. Pyogenic abscess have high signal intensity in diffusion weighted imaging, which is usually not seen in tumors. Nevertheless, some neoplasms may occasionally have restricted diffusion and biopsy is inevitable. In these cases, H-MRS may help to establish a diagnosis. If the VOI is positioned in the enhancing area, presence of Cho favors a neoplasm (Lai, 2008). If the VOI is positioned in the cystic area of a lesion, abscess and tumor both demonstrate high peak of lactate. Nonetheless, presence of acetate, succinate, and amino acids (AAs) such as valine, alanine, and leucine in the core of the lesion have high sensitivity for pyogenic abscess (Grand et al., 1999; Lai et al., 2002). These peaks are not seen in tumors. It is important to be aware that in patients with pyogenic brain abscess that are under antibiotic therapy these peaks may be absent. H-MRS can also help in the differentiation of high grade gliomas from solitary metastasis. Both lesions show the same H-MRS pattern, with high Cho and low NAA. However, the high signal intensity on T2 weighted imaging seen in the perilesional area demonstrates elevated Cho/Cr ratio only in high grade gliomas (Law et al., 2002) (Fig. 13). This feature is consistent with the pathological findings of infiltrating tumor cells in areas of edema not seen in metastases.
Gliomas are the most common and the most studied lesions among neuroepithelial tumors. They originate from glial cells (e.g. astrocytes or oligodentrocytes). Gliomas have an infiltrative nature resulting in neuronal cell damage and decreased NAA. Cohen et al. found decreased whole brain NAA in patients with glial tumors beyond the main tumor. This significant whole brain NAA depletion may reflect extensive tumor infiltration in the normal-appearing brain on MRI (Cohen et al., 2005). One quantitative MRS study (Stadlbauer et al., 2006) found a correlation between the percentage of tumor infiltration from the MRS-guided biopsy samples and changes in NAA, Cho, and Cho/NAA ratio in corresponding voxels. Absolute concentration of NAA decrease, whereas absolute concentration of Cho, and Cho/NAA ratio increase with degree of tumor infiltration. Astrocytomas can be classified into low grade (grade I and II, benign) and high grade (grade III and IV, malignant). High grade gliomas (anaplastic gliomas or grade III, and glioblastoma multiforme or grade IV) have higher Cho and lower NAA than low grade ones. Elevated Cho correlates with cellular proliferation and density. Although a number of studies in one systematic review (Hollingworth et al., 2006) have reported that MRS can accurately differentiate between low and high grade gliomas, the results of glioma grading by using MRS vary widely. These wide variations may be attributed to different methods and metabolites overlapping between different tumor grades. Statistically significant higher Cho/Cr, Cho/NAA, and relative cerebral blood volume (rCBV) in high grade than in low grade gliomas have been reported (Law et al., 2003), though, threshold values of metabolite ratios for grading of gliomas are not well established. Cho/Cr is the most frequently used ratio. Some institutions use a threshold value of 2.0 for Cho/Cr to differentiate low grade from high grade gliomas while some use a cutoff value of 2.5. As stated before, Lip and Lac peaks are absent under normal conditions. Lipid peak indicates necrosis in malignant tumors. Lac, a product of anaerobic glucolysis and accumulates in necrotic portions of tumors. Presence of Lip and Lac correlate with necrosis in high grade gliomas. Low grade gliomas show higher Myo levels compared with high grade gliomas (Castillo et al., 2000; Howe et al., 2003). This may be due to low mitotic index in low grade gliomas and, thus, lower mitogens (substances that trigger cell mitosis). Some mitogens can influence the metabolism of phosphatidylinositol, and Myo is also involved in formation of phosphatidylinositol. Thus, lack of phosphatidylinositol metabolism activation results in Myo accumulation. Howe et al. concluded that high Myo was characteristic of grade II astrocytomas. On serial MRS, malignant degeneration of gliomas can be detected by using percentage changes in Cho signal (Tedeschi et al., 1997). Tedeschi et al. have demonstrated that interval percentage changes of Cho intensity in stable gliomas and progressive gliomas (malignant degeneration or recurrent disease) is less than 35 and more than 45, respectively. Interval increased Cho/Cr or Cho/NAA is suggestive of malignant progression. Gliomatosis cerebri is a distinct entity of glial tumors. This rare disease is characterized by diffuse infiltration of glial cell neoplasm throughout the brain. Gliomatosis cerebri has various histological subtypes (astrocytoma, oligodendroglioma, or mixed glioma). The WHO classification denotes grades II, III and IV gliomatosis cerebri (Taillibert et al., 2006). Therefore patients with this tumor have a widely variable prognosis. Marked elevation of Myo and Cr has been found in gliomatosis cerebri and this may be attributed to glial activation rather than glial proliferation (Galanaud et al., 2003) because Cho level is moderately elevated, suggesting low glial cell density. Oligodendroglioma is a subgroup of gliomas which has a better response to treatment (chemosensitive) and better prognosis than glioblastoma. This distinct tumor is devided into 2 groups according to the WHO classification: grades II and III. It originates from oligodendrocytes but often contains a mixed population of cells, particularly astrocytes. Loss of genes in chromosomes 1p and 19q is a characteristic genetic alteration of most oligodendrogliomas. On dynamic contrast-enhanced MR perfusion, low grade oligodendrogliomas may demonstrate high rCBV because they contain a dense network of branching capillaries (Lev et al.,2004). Thus a number of oligodendrogliomas can be misinterpreted as high grade tumors because of their high rCBV which contributes to decrease reliability of rCBV in diffentiating the high vs. from low grade gliomas. Among the low grade gliomas, low grade oligodendrogliomas also exhibit significantly higher rCBV on dymamic-contrast MR perfusion (Cha et al., 2005). In groups of the oligodendroglial tumors, MRI studies have found that contrast enhancement is not suggestive of anaplasia as it is in astrocytomas. One study showed that rCBV was not significantly different between low and high grade oligodendroglimas (Xu et al., 2005). In contrast, another study (Spampinato et al., 2007), showed that rCBV was significantly different between low and high grade oligodendrogliomas. The results of MRS studies in oligodendrogliomas are more consistent than those of MR perfusion studies. Similarly to astrocytomas, MRS of oligodendrogliomas demonstrates significantly higher Cho, Cho/Cr ratio, and a higher incidence of Lac and Lip in high grade than in low grade tumors (Rijpkema et al., 2003; Spampinato et al., 2007; Xu et al., 2005).
Nevertheless, low grade oligodendrogliomas may show highly elevated Cho, mimicking high grade tumors, because, these low grade tumors can have high cellular density but absent endothelial proliferation and necrosis (Spampinato et al., 2007). Apart from higher rCBV, the level of glutamine plus glutamate is significantly higher in low grade than in low grade astrocytomas and may help to distinguish these tumors from each other (Rijpkema et al., 2003). Accurate grading of gliomas on the basis of MRS alone may be difficult. Combining MRS with conventional and other advanced MR imaging techniques such as perfusion MRI, grading becomes more precise. Some features of tumors on conventional MRI (e.g. contrast enhancement, surrounding edema, signal heterogeneity, necrosis, hemorrhage and midline crossing) and perfusion MRI (high rCBV) suggest a high grade. MRS is complementary and helpful for glioma grading. High grade gliomas demonstrate marked elevation of Cho, decreased NAA and presence of Lac and Lip. Myo is high in low grade gliomas and decreases with increasing grades of tumors. There is an important issue about post-radiation therapy in patients with brain tumors: differentiation between recurrent brain tumor and radiation injury/change, particularly when new contrast-enhancing lesions are seen in previously operated and/or irradiated regions. Many studies have found that Cho/Cr and/or Cho/NAA ratios are significantly higher in recurrent tumor (or predominantly tumor) than in radiation injury) (Rabinov et al., 2002; Smith et al., 2009; Weybright et al., 2005; Zeng et al., 2007). One study (Zeng et al., 2007) reported that Lac/Cr ratio was significantly higher in recurrent tumor than in radiation injury whereas Lip/Cr ratio was significantly lower in recurrent tumor than in radiation injury. Another study showed that Lac or Lip signal alone was not helpful in differentiating these two conditions (Weybright et al., 2005). Rabinov et al. have also demonstrated no correlation between the signal intensity of Lip and the histopathology but they observed that Lac signal intensity in two patients with enhancing areas corresponding to recurrent tumor. It is probable that amount of Lip may be higher in an area of radiation changes than in tumor recurrence while Lac may be found in recurrent tumor but both Lip and Lac cannot differentiate these conditions.
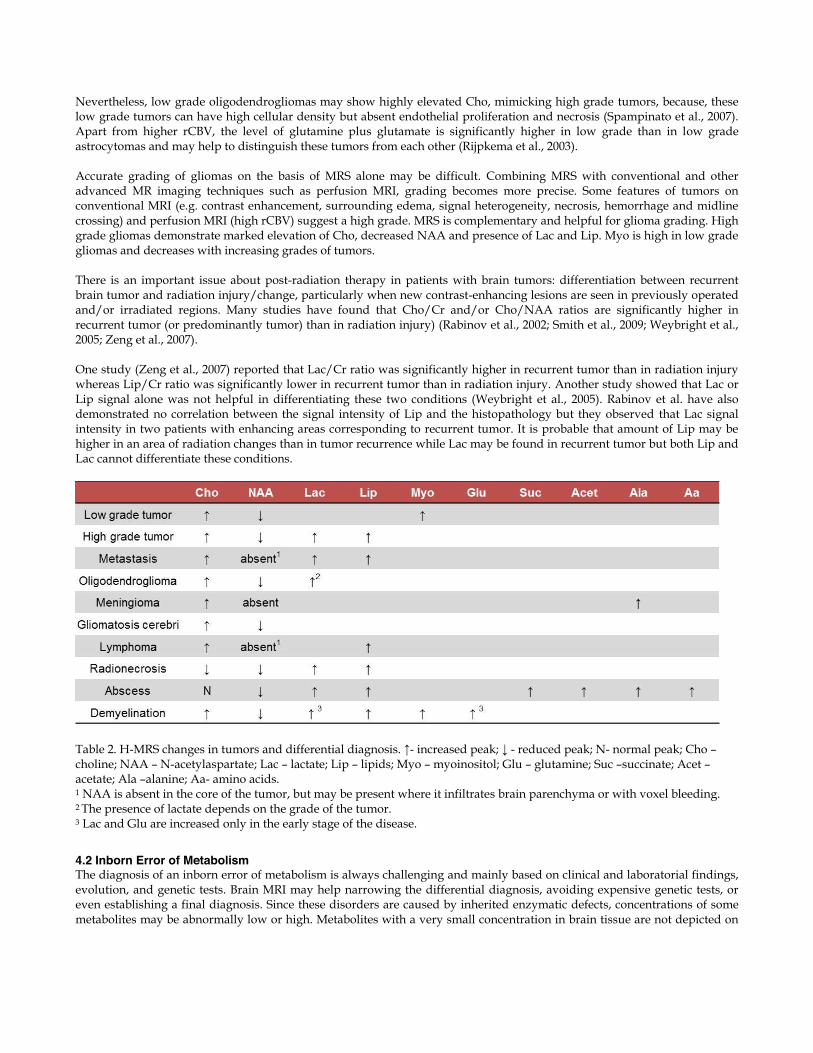
Table 2. H-MRS changes in tumors and differential diagnosis. ↑- increased peak; ↓ - reduced peak; N- normal peak; Cho – choline; NAA – N-acetylaspartate; Lac – lactate; Lip – lipids; Myo – myoinositol; Glu – glutamine; Suc –succinate; Acet –acetate; Ala –alanine; Aa- amino acids. 1 NAA is absent in the core of the tumor, but may be present where it infiltrates brain parenchyma or with voxel bleeding. 2 The presence of lactate depends on the grade of the tumor. 3 Lac and Glu are increased only in the early stage of the disease.
4.2 Inborn Error of Metabolism The diagnosis of an inborn error of metabolism is always challenging and mainly based on clinical and laboratorial findings, evolution, and genetic tests. Brain MRI may help narrowing the differential diagnosis, avoiding expensive genetic tests, or even establishing a final diagnosis. Since these disorders are caused by inherited enzymatic defects, concentrations of some metabolites may be abnormally low or high. Metabolites with a very small concentration in brain tissue are not depicted on
H-MRS. In these cases, the spectrum changes usually correspond to a general pathology, such as demyelination or ischemia. On some diseases, however, H-MRS may identify a specific biomarker that helps in the diagnosis (Barker et al, 2010). Disorders that have specific H-MRS patterns may manifest as increase or absence of particular metabolites. Specific biomarkers can be seen in phenylketonuria (phenylalanine), Canavan disease (NAA), nonketotic hyperglycinemia (glycine), creatine deficiency (Cr), and maple syrup urine disease (branched-chain amino acids and keto acids) (van der Knapp & Valk, 2005). Phenylalanine is an α-amino acid that is assigned at 7.36 ppm and can be used for diagnosis of phenylketonuria, follow up of treatment, and evolution of the disease. MRS is usually not needed because early diagnosis is made by neonatal screening tests and response to treatment can be monitored by phenylalanine blood levels and neuropsychological tests. An increase of NAA signal is characteristic of Canavan disease (a disorder caused by a defect of the enzyme aspartoacylase that results in NAA accumulation in the brain) in a child with diffusely abnormal white matter and macrocephaly. However a high peak at 2.03 ppm is also noted in Salla disease, a rare autosomal recessive free sialic acid storage disorder (Varho et al., 1999). This latter disease accumulates acetylneuraminic acid (NANA), that resonances at the same frequency of NAA. Nonketotic hyperglycinemia is an autosomal recessive disease that manifests mainly on neonatal period. There is accumulation of glycine in the brain and this metabolite shows up in H-MRS as a peak at 3.55 ppm. It is important to note that Myo resonates at 3.56ppm, therefore these peaks overlap. However, glycine has a higher T2 value, and can be seen not only with short TE sequences but also with long TE (Barker et al, 2010). H-MRS is thus an important tool for diagnosing nonketotic hyperglycinemia and long TE studies must be acquired. H-MRS can also be used for monitoring the disease, correlating more with the clinical findings than blood and CSF glycine levels. Maple syrup urine disease is an aminoacidopathy with accumulation of branched-chain α-keto and aminoacids. These metabolites resonate at 0.9 ppm, a region that is usually attributed to lipids. Lactate may also be present. In creatine deficiency there is a severe reduction of Cr peak. In both diseases, H-MRS may help with diagnosis and treatment. All mitochondrial diseases caused by disorders of pyruvate metabolism, disorders of fatty acid oxidation, or defects of the respiratory chain and may have elevation of lactate on H-MRS. However, this finding is non-specific and lactate is not always present. Nonetheless, on mitochondrial disorders, abnormal lactate peak may be present when the VOI is positioned in normal brain parenchyma on MRI and in the ventricles (Bianchi et al., 2003; Cross et al., 1993). Therefore, even if the findings of H-MRS are non-specific they may be useful in the evaluation of mitochondrial disorders. References Arslanoglu A, Bonekamp D, Barker PB, Horská A. (2004). Quantitative proton MR spectroscopic imaging of the mesial
temporal lobe. J Magn Reson Imaging 20:772-778 Baker EH, Basso G, Barker PB, Smith MA, Bonekamp D, Horská A. (2008). Regional apparent metabolite concentrations in
young adult brain measured by (1)H MR spectroscopy at 3 Tesla. J Magn Reson Imaging 27:489-499. Barker, PB; Bizzi, A; De Stefano, N; Gullapalli, R & Lin, DDM. (2010). Clinical MR Spectroscopy (1st edition), Cambridge
University Press, ISBN 9780521868983, New York, United States of America. Bianchi MC, Tosetti M, Battini R, Manca ML, Mancuso M, Cioni G, Canapicchi R, Siciliano G. (2003) Proton MR spectroscopy
of mitochondrial diseases: analysis of brain metabolic abnormalities and their possible diagnostic relevan AJNR Am J Neuroradiol. 24(10):1958-66.
Bitsch A, Bruhn H, Vougioukas V, Stringaris A, Lassmann H, Frahm J & Brück W. (1999). Inflammatory CNS demyelination: histopathologic correlation with in vivo quantitative proton MR spectroscopy. AJNR Am J Neuroradiol. 20(9):1619-27.
Castillo M, Smith JK, Kwock L. (2000). Correlation of myo-inositol levels and grading of cerebral astrocytomas. AJNR Am J Neuroradiol. Oct;21(9):1645-9.
Cha S, Tihan T, Crawford F, Fischbein NJ, Chang S, Bollen A, Nelson SJ, Prados M, Berger MS, Dillon WP. (2005). Differentiation of low-grade oligodendrogliomas from low-grade astrocytomas by using quantitative blood-volume measurements derived from dynamic susceptibility contrast-enhanced MR imaging. AJNR Am J Neuroradiol. Feb;26(2):266-73.
Chang L, Ernst T, Poland RE, Jenden DJ. (1996). In vivo proton magnetic resonance spectroscopy of the normal aging human brain. Life Sci 58:2049-2056
Charles HC, Lazeyras F, Krishnan KR, Boyko OB, Patterson LJ, Doraiswamy PM, McDonald WM. (1994). Proton spectroscopy of human brain: effects of age and sex. Prog Neuropsychopharmacol Biol Psychiatry 18:995-1004
Christiansen P, Toft P, Larsson HB, Stubgaard M, Henriksen O. (1993). The concentration of N-acetyl aspartate, creatine + phosphocreatine, and choline in different parts of the brain in adulthood and senium. Magn Reson Imaging 11:799-806.
Cohen BA, Knopp EA, Rusinek H, Babb JS, Zagzag D, Gonen O. (2005). Assessing global invasion of newly diagnosed glial tumors with whole-brain proton MR spectroscopy. AJNR Am J Neuroradiol. Oct;26(9):2170-7.
Cross JH, Gadian DG, Connelly A, Leonard JV. (1993). Proton magnetic resonance spectroscopy studies in lactic acidosis and mitochondrial disorders. J Inherit Metab Dis. 16(4):800-11.
De Stefano N, Filippi M, Miller D, Pouwels PJ, Rovira A, Gass A, Enzinger C, Matthews PM & Arnold DL. (2007). Guidelines for using proton MR spectroscopy in multicenter clinical MS studies. Neurology. 13;69(20):1942-52.
Degaonkar MN, Pomper MG, Barker PB. (2005). Quantitative proton magnetic resonance spectroscopic imaging: regional variations in the corpus callosum and cortical gray matter. J Magn Reson Imaging 22:175-179
Dezortova M, Hajek M. (2008). (1)H MR spectroscopy in pediatrics. Eur J Radiol 67:240-249 Duyn JH, Moonen CT (1993). Fast proton spectroscopic imaging of human brain using multiple spin-echoes. Magn Reson Med
30:409–414 Duyn JH, Gillen J, Sobering G, van Zijl PC, Moonen CT (1993) Multisection proton MR spectroscopic imaging of the brain.
Radiology 188:277–282 Ethofer T, Mader I, Seeger U, Helms G,Erb M, Grodd W, Ludolph A, Klose U(2003) Comparison of longitudinal metabolite
relaxation times in different regions of the human brain at 1.5 and 3 Tesla. Magn Reson Med 50:1296–1301 Fayed N, Olmos S, Morales H, Modrego PJ. (2006). Physical basis of magnetic resonance spectroscopy and its application to
central nervous system diseases. Am J Applied Sci 3:1836-1845 Fernando KT, McLean MA, Chard DT, MacManus DG, Dalton CM, Miszkiel KA, Gordon RM, Plant GT, Thompson AJ &
Miller DH. (2004). Elevated white matter myo-inositol in clinically isolated syndromes suggestive of multiple sclerosis. Brain 127(Pt 6):1361-9.
Galanaud D, Chinot O, Nicoli F, Confort-Gouny S, Le Fur Y, Barrie-Attarian M, Ranjeva JP, Fuentès S, Viout P, Figarella-Branger D, Cozzone PJ. (2003). Use of proton magnetic resonance spectroscopy of the brain to differentiate gliomatosis cerebri from low-grade glioma. J Neurosurg. Feb;98(2):269-76.
Grand S, Passaro G, Ziegler A, Estève F, Boujet C, Hoffmann D, Rubin C, Segebarth C, Décorps M, Le Bas JF, Rémy C. (1999). Necrotic tumor versus brain abscess: importance of amino acids detected at 1H MR spectroscopy--initial results. Radiology. 213(3):785-93.
Haga KK, Khor YP, Farrall A , Wardlaw JM. (2009). A systemic review of brain metabolite changes, measured with (1)H magnetic resonance spectroscopy, in healthy aging. Neurobiol Aging 30:353-363
Hajek M, Dezortova M. (2008). Introduction to clinical in vivo MR spectroscopy. Eur J Radiol 67:185-193 Hetherington HP, Mason GF, Pan JW, Ponder SL, Vaughan JT, Twieg DB, Pohost GM. (1994). Evaluation of cerebral gray and
white matter metabolite differences by spectroscopic imaging at 4.1T. Magn Reson Med 32:565-571 Hollingworth W, Medina LS, Lenkinski RE, Shibata DK, Bernal B, Zurakowski D, Comstock B, Jarvik JG. (2006). A systematic
literature review of magnetic resonance spectroscopy for the characterization of brain tumors. AJNR Am J Neuroradiol. Aug;27(7):1404-11
Howe FA, Barton SJ, Cudlip SA, Stubbs M, Saunders DE, Murphy M, Wilkins P, Opstad KS, Doyle VL, McLean MA, Bell BA, Griffiths JR. (2003). Metabolic profiles of human brain tumors using quantitative in vivo 1H magnetic resonance spectroscopy. Magn Reson Med. Feb;49(2):223-32.
Jacobs MA, Horská A, van Zijl PC, Barker PB. (2001). Quantitative proton MR spectroscopic imaging of normal human cerebellum and brain stem. Magn Reson Med 46:699-705
Kreis R, Ernst T, Ross BD. (1993a). Absolute quantitation of water and metabolites in the human brain. II. Metabolite concentrations. J Magn Reson Ser B 102:9-19
Kreis R, Ernst T, Ross BD. (1993b). Development of the human brain: In vivo quantification of metabolite and water content with proton magnetic resonance spectroscopy. Magn Reson Med 30:424-437
Lai PH, Ho JT, Chen WL, Hsu SS, Wang JS, Pan HB, Yang CF. (2002). Brain abscess and necrotic brain tumor: discrimination with proton MR spectroscopy and diffusion-weighted imaging. AJNR Am J Neuroradiol. Sep;23(8):1369-77.
Lai PH, Weng HH, Chen CY, Hsu SS, Ding S, Ko CW, Fu JH, Liang HL, Chen KH.(2008) In vivo differentiation of aerobic brain abscesses and necrotic glioblastomas multiforme using proton MR spectroscopic imaging. AJNR Am J Neuroradiol. 29(8):1511-8.
Law M, Cha S, Knopp EA, Johnson G, Arnett J, Litt AW. (2002). High-grade gliomas and solitary metastases: differentiation by using perfusion and proton spectroscopic MR imaging. Radiology. 222(3):715-21.
Law M, Yang S, Wang H, Babb JS, Johnson G, Cha S, Knopp EA, Zagzag D. (2003). Glioma grading: sensitivity, specificity, and predictive values of perfusion MR imaging and proton MR spectroscopic imaging compared with conventional MR imaging. AJNR Am J Neuroradiol. Nov-Dec;24(10):1989-98
Lev MH, Ozsunar Y, Henson JW, Rasheed AA, Barest GD, Harsh GR 4th, Fitzek MM, Chiocca EA, Rabinov JD, Csavoy AN, Rosen BR, Hochberg FH, Schaefer PW, Gonzalez RG. (2004). Glial tumor grading and outcome prediction using dynamic spin-echo MR susceptibility mapping compared with conventional contrast-enhanced MR: confounding effect of elevated rCBV of oligodendrogliomas [corrected]. AJNR Am J Neuroradiol. Feb;25(2):214-21.
Lim KO, Spielman DM. (1997). Estimating NAA in cortical gray matter with applications for measuring changes due to aging. Magn Reson Med 37:372-377
Majós C, Aguilera C, Alonso J, Julià-Sapé M, Castañer S, Sánchez JJ, Samitier A, León A, Rovira A & Arús C. (2009). Proton MR spectroscopy improves discrimination between tumor and pseudotumoral lesion in solid brain masses. AJNR Am J Neuroradiol. 30(3):544-51.
Majós C, Julià-Sapé M, Alonso J, Serrallonga M, Aguilera C, Acebes JJ, Arús C & Gili J. (2004). Brain tumor classification by proton MR spectroscopy: comparison of diagnostic accuracy at short and long TE. AJNR Am J Neuroradiol. 10:1696-704.
Mullins ME. (2006). MR spectroscopy: truly molecular imaging; past, present and future. Neuroimaging Clin N Am 16:605-618 Nagae-Poetscher LM, Bonekamp D, Barker PB, Brant LJ, Kaufmann WE, Horská A. (2004). Asymmetry and gender effect in
functionally lateralized cortical regions: a proton MRS imaging study. J Magn Reson Imaging 19:27-33 Posse S, DeCarli C, Le Bihan D (1994) Three-dimensional echoplanar MR spectroscopic imaging at short echo times in the
human brain. Radiology 192:733–738 Pouwels PJ, Frahm J. (1998). Regional metabolite concentrations in human brain as determined by quantitative localized
proton MRS. Magn Reson Med 39:53-60 Rabinov JD, Lee PL, Barker FG, Louis DN, Harsh GR, Cosgrove GR, Chiocca EA, Thornton AF, Loeffler JS, Henson JW,
Gonzalez RG. (2002). In vivo 3-T MR spectroscopy in the distinction of recurrent glioma versus radiation effects: initial experience. Radiology. Dec;225(3):871-9.
Rijpkema M, Schuuring J, van der Meulen Y, van der Graaf M, Bernsen H, Boerman R, van der Kogel A, Heerschap A. (2003). Characterization of oligodendrogliomas using short echo time 1H MR spectroscopic imaging. NMR Biomed. Feb;16(1):12-8.
Smith EA, Carlos RC, Junck LR, Tsien CI, Elias A, Sundgren PC. (2009). Developing a clinical decision model: MR spectroscopy to differentiate between recurrent tumor and radiation change in patients with new contrast-enhancing lesions. AJR Am J Roentgenol. Feb;192(2):W45-52
Soares DP, Law M. (2009). Magnetic resonance spectroscopy of the brain: review of metabolites and clinical applications. Clin Radiol 64:12-21
Soher BJ, van Zijl PC, Duyn JH, Barker PB. (1996). Quantitative proton MR spectroscopic imaging of the human brain. Magn Reson Med 35:356-363
Spampinato MV, Smith JK, Kwock L, Ewend M, Grimme JD, Camacho DL, Castillo M. (2007). Cerebral blood volume measurements and proton MR spectroscopy in grading of oligodendroglial tumors. AJR Am J Roentgenol. Jan;188(1):204-12.
Srinivasan R, Sailasuta N, Hurd R, Nelson S & Pelletier D. (2005). Evidence of elevated glutamate in multiple sclerosis using magnetic resonance spectroscopy at 3 T. Brain. 128(Pt 5):1016-25.
Stadlbauer A, Gruber S, Nimsky C, Fahlbusch R, Hammen T, Buslei R, Tomandl B, Moser E, Ganslandt O. (2006). Preoperative grading of gliomas by using metabolite quantification with high-spatial-resolution proton MR spectroscopic imaging. Radiology. Mar;238(3):958-69. Epub 2006 Jan 19.
Taillibert S, Chodkiewicz C, Laigle-Donadey F, Napolitano M, Cartalat-Carel S, Sanson M. (2006). Gliomatosis cerebri: a review of 296 cases from the ANOCEF database and the literature. J Neurooncol. Jan;76(2):201-5
Tedeschi G, Lundbom N, Raman R, Bonavita S, Duyn JH, Alger JR, Di Chiro G. (1997). Increased choline signal coinciding with malignant degeneration of cerebral gliomas: a serial proton magnetic resonance spectroscopy imaging study. J Neurosurg. Oct;87(4):516-24.
van der Graaf M. (2010). In vivo magnetic resonance spectroscopy: basic methodology and clinical applications. Eur Biophys J 39:527-540.
van der Knaap, MS & Valk, J. (2005). Magnetic Resonance of Myelin Disorders (3rd edition), Springer, ISBN 13:9783540222866, Heidelberg, Germany.
Varho T, Komu M, Sonninen P, Holopainen I, Nyman S, Manner T, Sillanpää M, Aula P, Lundbom N. (1999). A new metabolite contributing to N-acetyl signal in 1H MRS of the brain in Salla disease. Neurology. May 12;52(8):1668-72
Vermathen P, Laxer KD, Matson GB, Weiner MW. (2000). Hippocampal structures: anteroposterior N-acetylaspartate differences in patients with epilepsy and control subjects as shown with proton MR spectroscopic imaging. Radiology 214:403-410
Vuori K, Kankaanranta L, Häkkinen AM, Gaily E, Valanne L, Granström ML, Joensuu H, Blomstedt G, Paetau A & Lundbom N.(2004). Low-grade gliomas and focal cortical developmental malformations: differentiation with proton MR spectroscopy. Radiology. 230(3):703-8.
Weybright P, Sundgren PC, Maly P, Hassan DG, Nan B, Rohrer S, Junck L. (2005). Differentiation between brain tumor recurrence and radiation injury using MR spectroscopy. AJR Am J Roentgenol. Dec;185(6):1471-6.
Xu M, See SJ, Ng WH, Arul E, Back MF, Yeo TT, Lim CC. (2005). Comparison of magnetic resonance spectroscopy and perfusion-weighted imaging in presurgical grading of oligodendroglial tumors. Neurosurgery. May;56(5):919-26; discussion 919-26.
Zeng QS, Li CF, Liu H, Zhen JH, Feng DC. (2007). Distinction between recurrent glioma and radiation injury using magnetic resonance spectroscopy in combination with diffusion-weighted imaging. Int J Radiat Oncol Biol Phys. May 1;68(1):151-8. Epub 2007 Feb 7.