Embed Size (px)
Citation preview
Brain Morphometrics from MRI Scans
John AshburnerThe Wellcome Trust Centre for Neuroimaging12 Queen Square, London, UK.
Contents
• Introduction• Voxel-based Morphometry• Diffeomorphic Shape Modelling
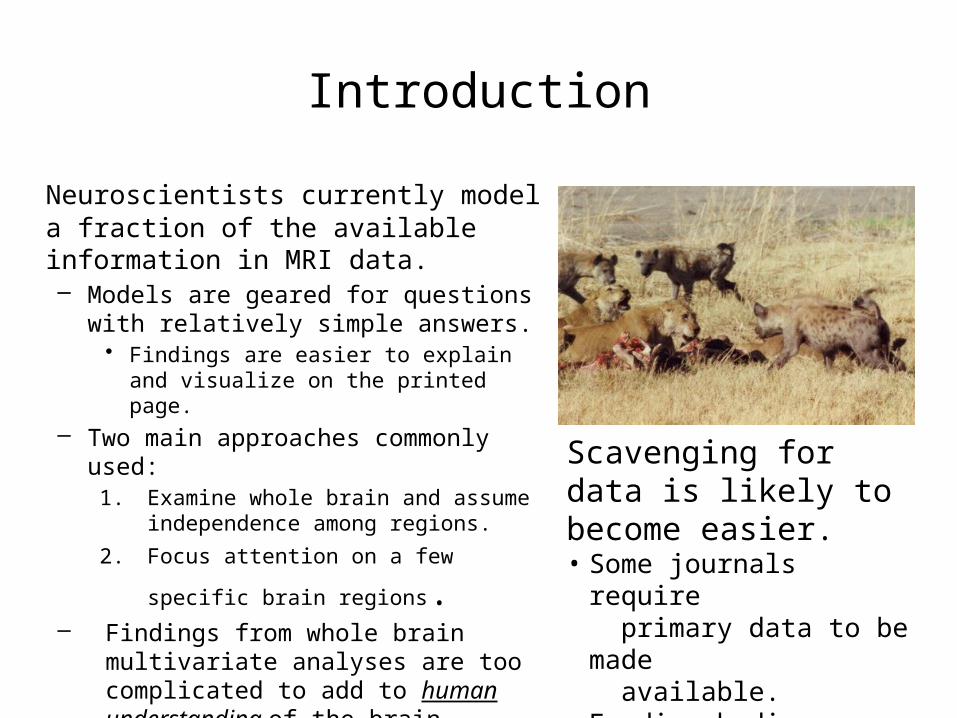
Neuroscientists currently model a fraction of the available information in MRI data.– Models are geared for questions with
relatively simple answers.• Findings are easier to explain and visualize
on the printed page.– Two main approaches commonly used:
1. Examine whole brain and assume independence among regions.
2. Focus attention on a few specific brain
regions.– Findings from whole brain multivariate
analyses are too complicated to add to human understanding of the brain.
• See what data mining can achieve from it.
Scavenging for data is likely to become easier.• Some journals require
primary data to be made available.
• Funding bodies now promote data sharing.
Introduction

Example data management and sharing policies
• UK Wellcome Trust– “The Trust considers that the benefits gained from research data will be
maximised when they are made widely available to the research community as soon as feasible, so that they can be verified, built upon and used to advance knowledge.”
– http://www.wellcome.ac.uk/About-us/Policy/Policy-and-position-statements/WTX035043.htm
• UK Medical Research Council– “The MRC Data Sharing and Preservation Initiative aims to maximise
opportunities for enabling wider and better use of this data for further high quality, ethical research.”
– http://www.mrc.ac.uk/Ourresearch/Ethicsresearchguidance/Datasharinginitiative/index.htm
• USA NIH– “Data should be made as widely and freely available as possible
while safeguarding the privacy of participants, and protecting confidential and proprietary data.”
– http://grants.nih.gov/grants/policy/data_sharing/data_sharing_guidance.htm
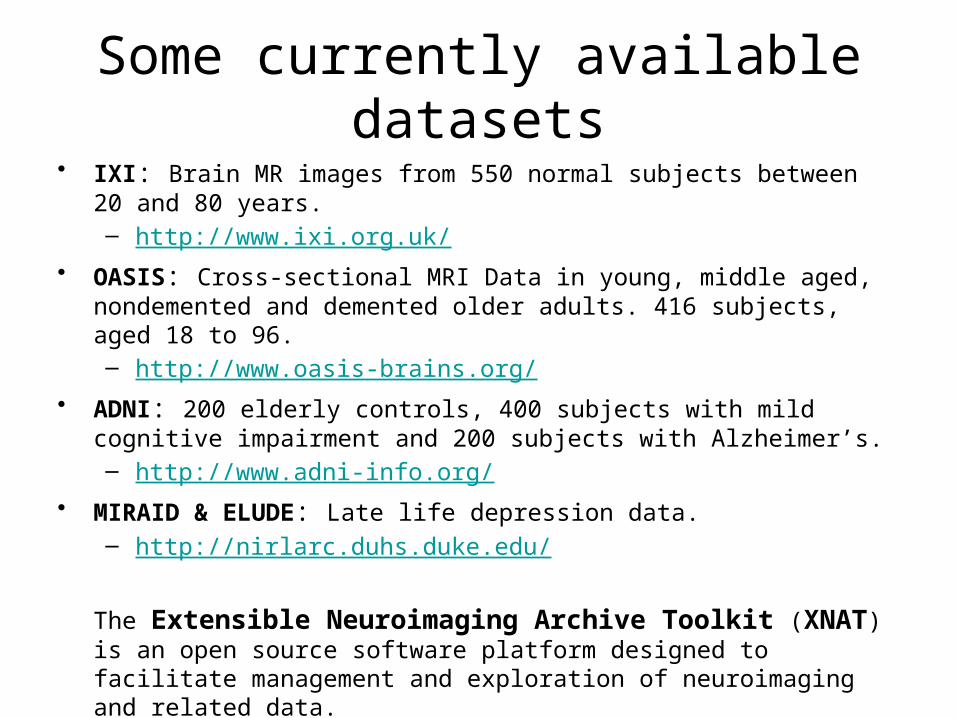
Some currently available datasets• IXI: Brain MR images from 550 normal subjects between 20 and 80 years.
– http://www.ixi.org.uk/• OASIS: Cross-sectional MRI Data in young, middle aged, nondemented
and demented older adults. 416 subjects, aged 18 to 96.– http://www.oasis-brains.org/
• ADNI: 200 elderly controls, 400 subjects with mild cognitive impairment and 200 subjects with Alzheimer’s.– http://www.adni-info.org/
• MIRAID & ELUDE: Late life depression data.– http://nirlarc.duhs.duke.edu/
The Extensible Neuroimaging Archive Toolkit (XNAT) is an open source software platform designed to facilitate management and exploration of neuroimaging and related data.– http://www.xnat.org/index.html
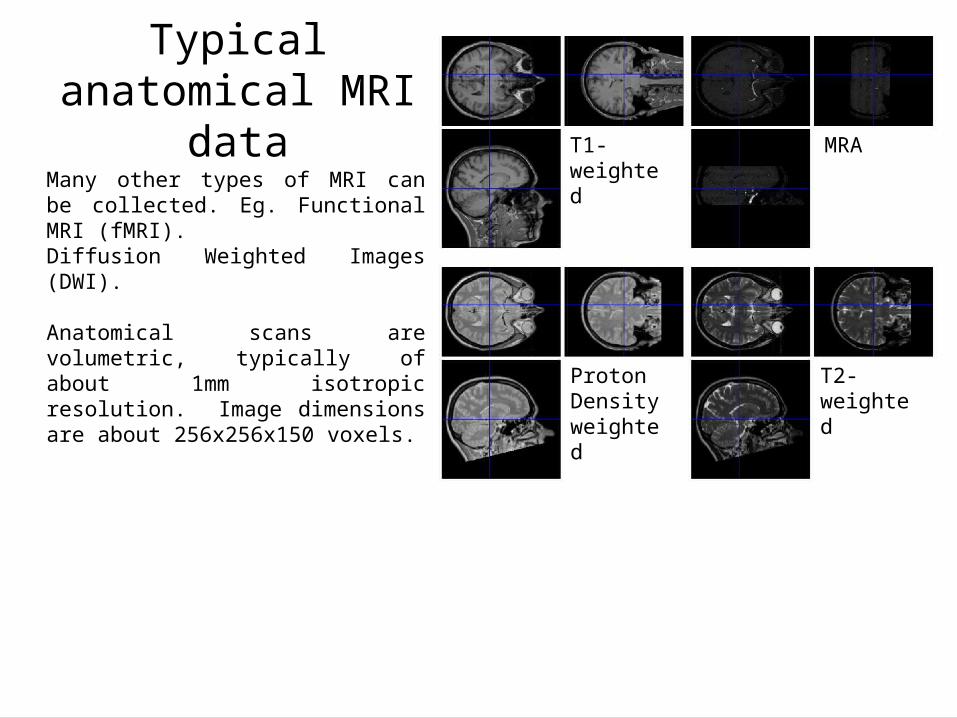
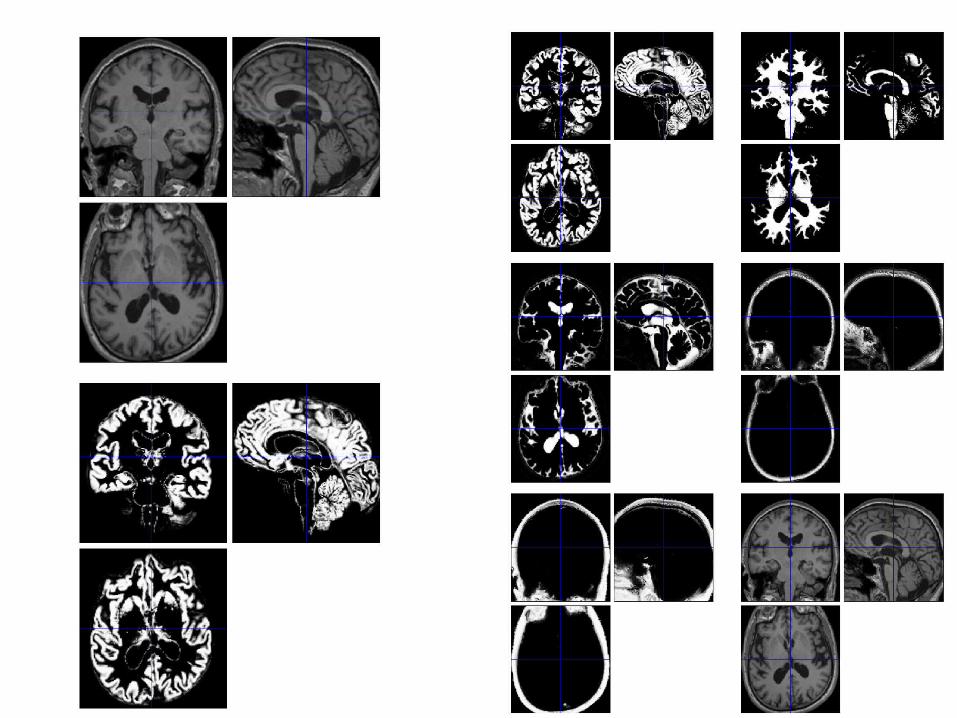
Typical anatomical MRI data
T1-weighted
MRA
T2-weighted
Proton Density weighted
Grey matter
White matter
Grey and white matter segmented from original scans.
Many other types of MRI can be collected. Eg. Functional MRI (fMRI).Diffusion Weighted Images (DWI).
Anatomical scans are volumetric, typically of about 1mm isotropic resolution. Image dimensions are about 256x256x150 voxels.
Contents
• Introduction• Voxel-based Morphometry• Diffeomorphic Shape Modeling
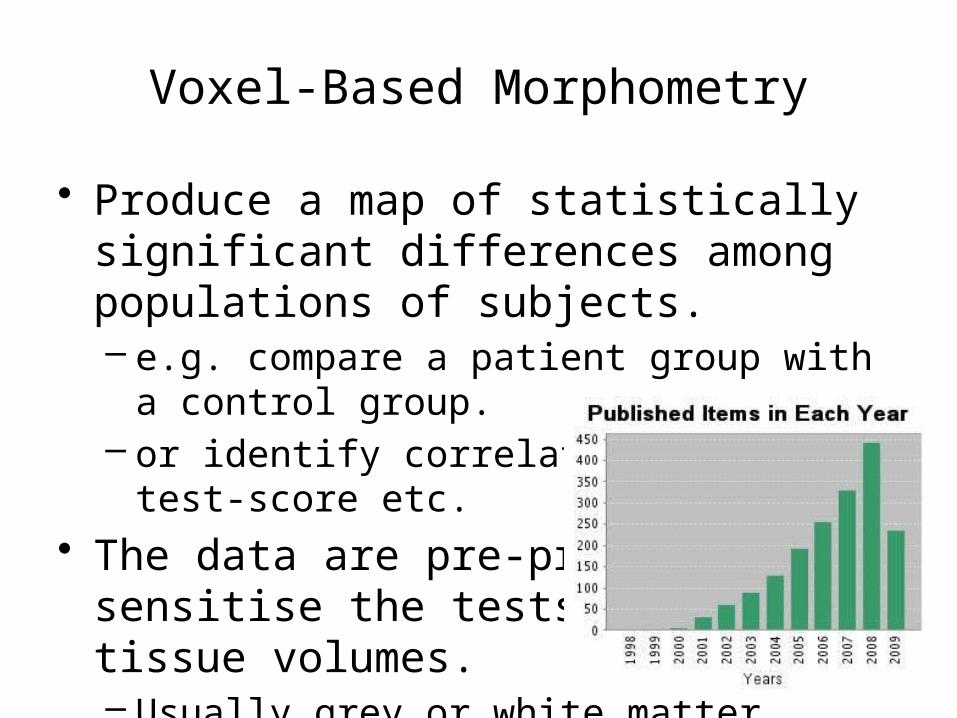
Voxel-Based Morphometry
• Produce a map of statistically significant differences among populations of subjects.– e.g. compare a patient group with a control
group.– or identify correlations with age, test-score
etc.• The data are pre-processed to sensitise
the tests to regional tissue volumes.– Usually grey or white matter.
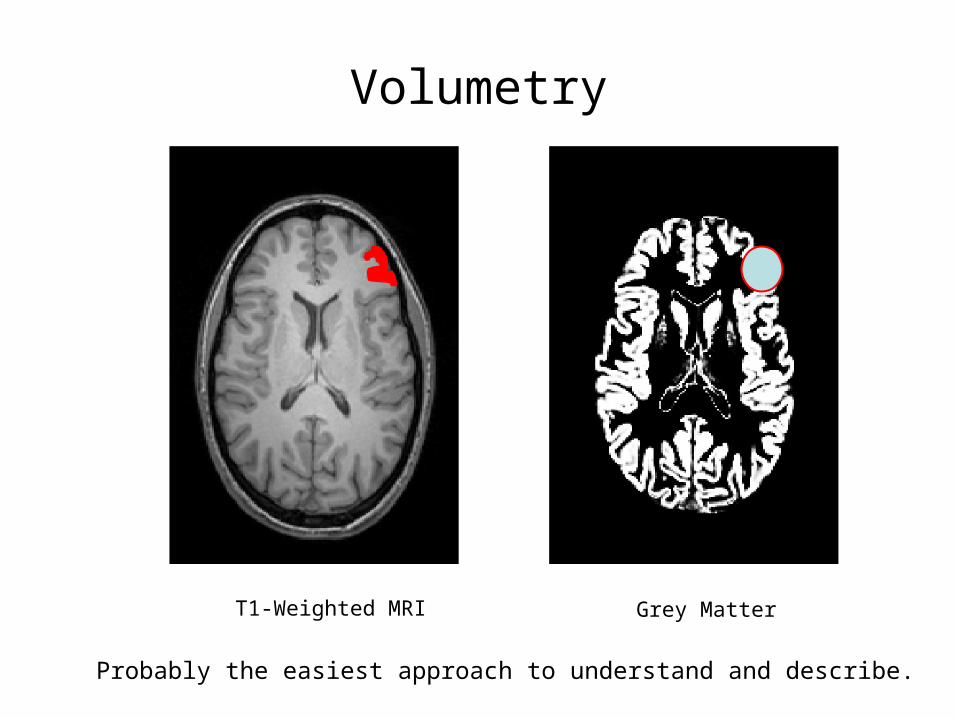
Volumetry
T1-Weighted MRI Grey Matter
Probably the easiest approach to understand and describe.
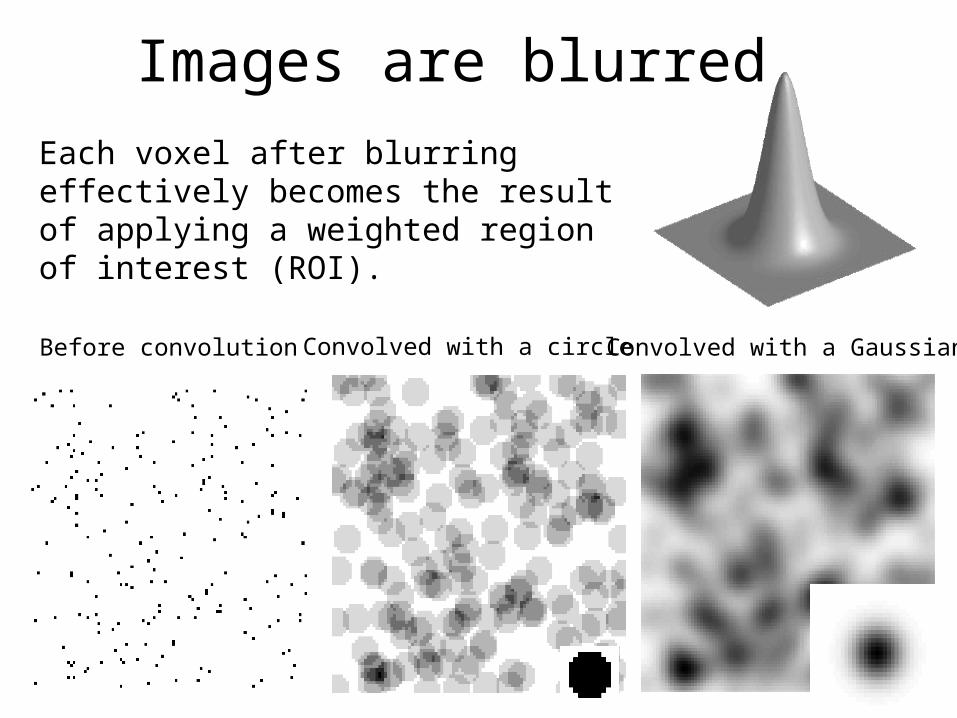
Images are blurred
Before convolution Convolved with a circle Convolved with a Gaussian
Each voxel after blurring effectively becomes the result of applying a weighted region of interest (ROI).
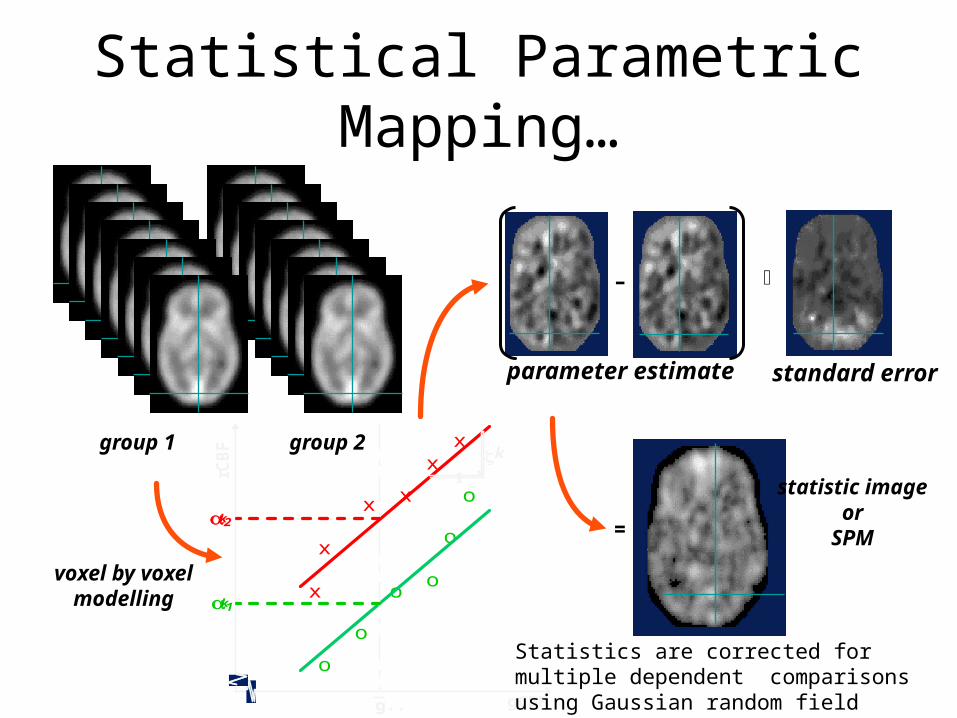
Statistical Parametric Mapping…
gCBF
rCBF
x
o
o
o
o
o
o
x
x
x
x
x
g..
k1
k2
k
group 1 group 2
voxel by voxelmodelling
– ¸
parameter estimate standard error
=
statistic imageor
SPM
Statistics are corrected for multiple dependent comparisons using Gaussian random field theory.
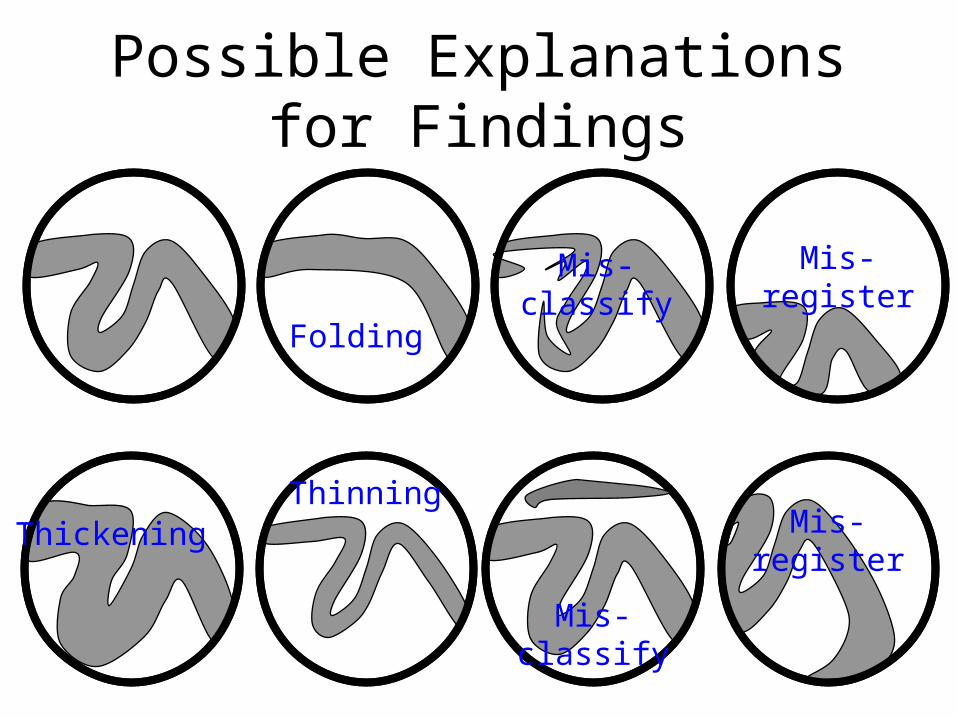
Possible Explanations for Findings
ThickeningThinning
Folding
Mis-classify
Mis-classify
Mis-register
Mis-register
Contents
• Introduction• Voxel-based Morphometry• Diffeomorphic Shape Modelling
D’Arcy Thompson (1917). GROWTH AND FORM. The morphologist, when comparing one organism
with another, describes the differences between them point by point, and “character” by “character”. If he is from time to time constrained to admit the existence of “correlation” between characters (as a hundred years ago Cuvier first showed the way), yet all the while he recognises this fact of correlation somewhat vaguely, as a phenomenon due to causes which, except in rare instances, he cannot hope to trace; and he falls readily into the habit of thinking and talking of evolution as though it had proceeded on the lines of his own descriptions, point by point and character by character. But if, on the other hand, diverse and dissimilar [fish/brains] can be referred as a whole to identical functions of very different coordinate systems, this fact will of itself constitute a proof that a comprehensive “law of growth” has pervaded the whole structure in its integrity, and that some more or less simple and recognizable system of forces has been at work.
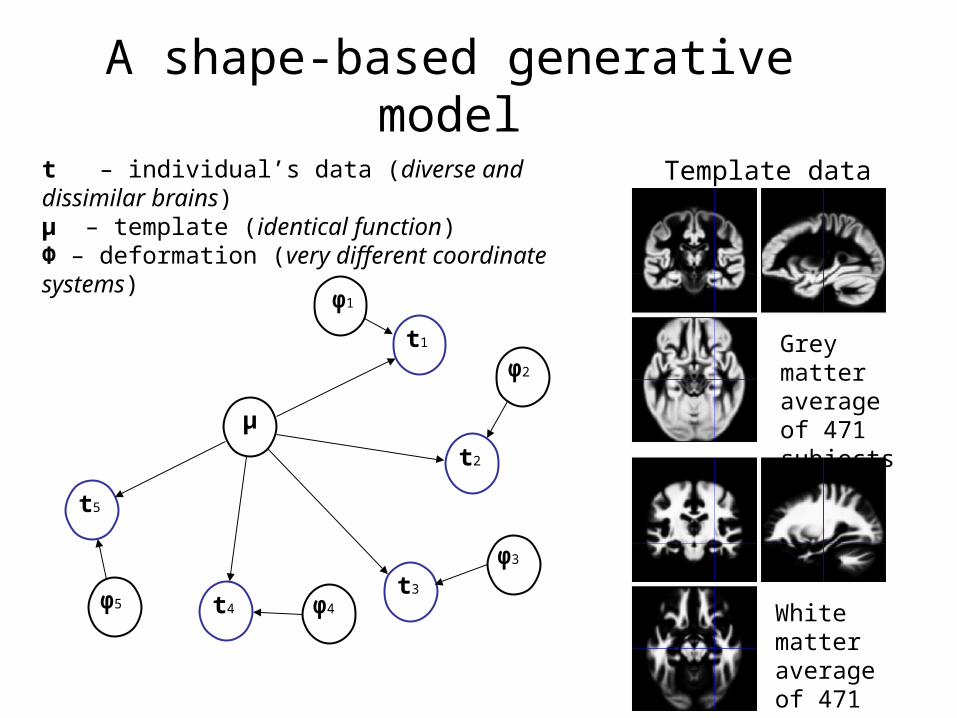
A shape-based generative model
Grey matter average of 471 subjects
White matter average of 471 subjects
μ
t1
ϕ1
t2
ϕ2
t3
ϕ3
t4 ϕ4
t5
ϕ5
t – individual’s data (diverse and dissimilar brains)μ – template (identical function)Φ – deformation (very different coordinate systems)
Template data
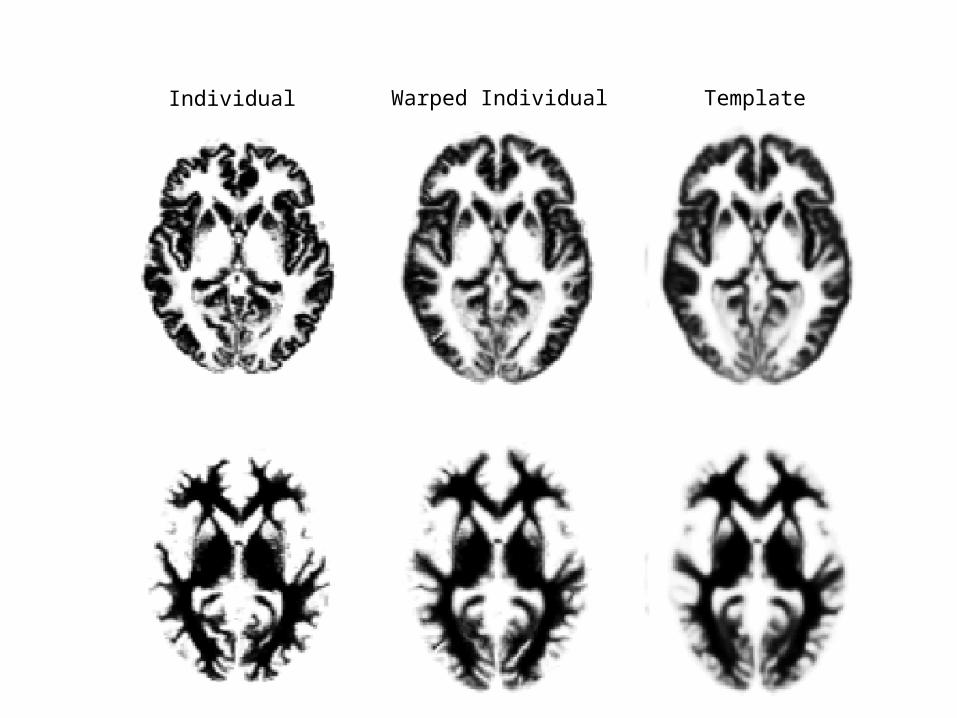
Individual Warped Individual Template
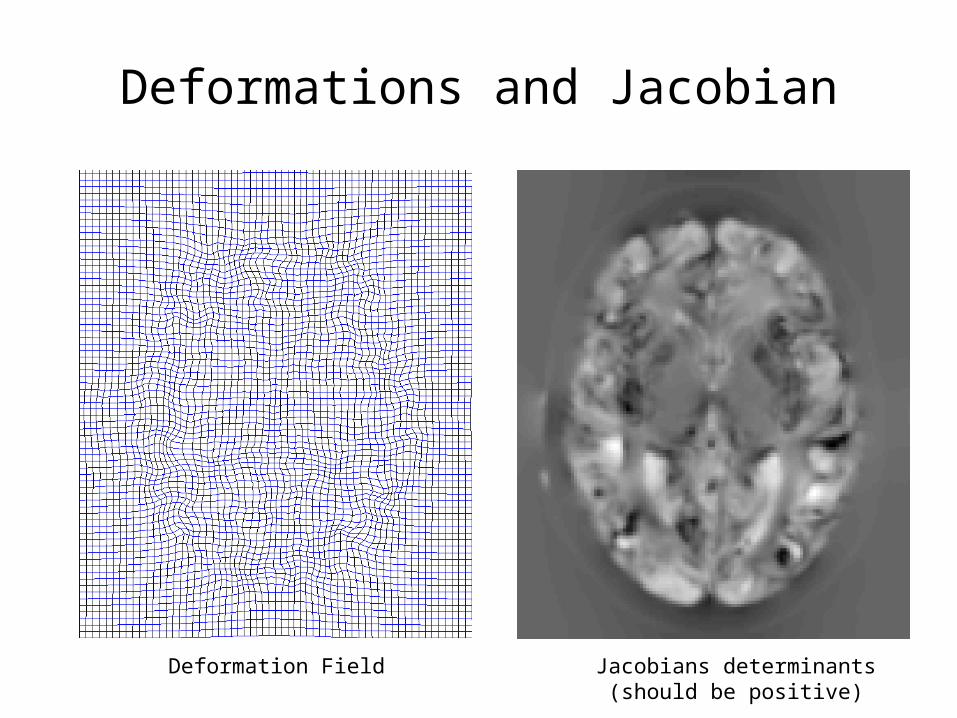
Deformations and Jacobian
Deformation Field Jacobians determinants(should be positive)
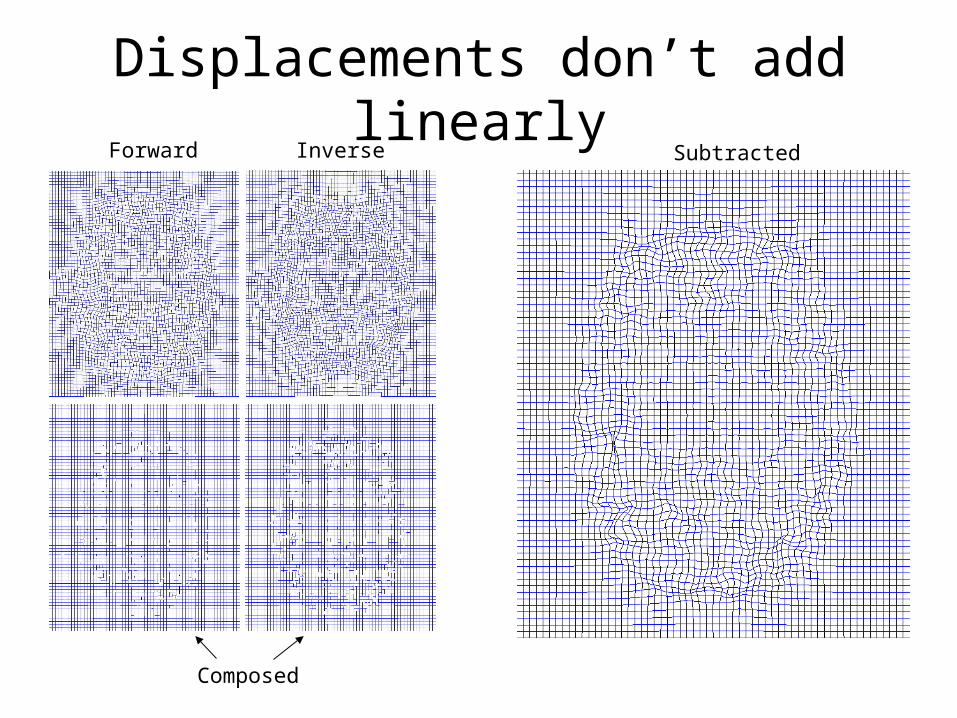
Displacements don’t add linearlyForward Inverse
Composed
Subtracted
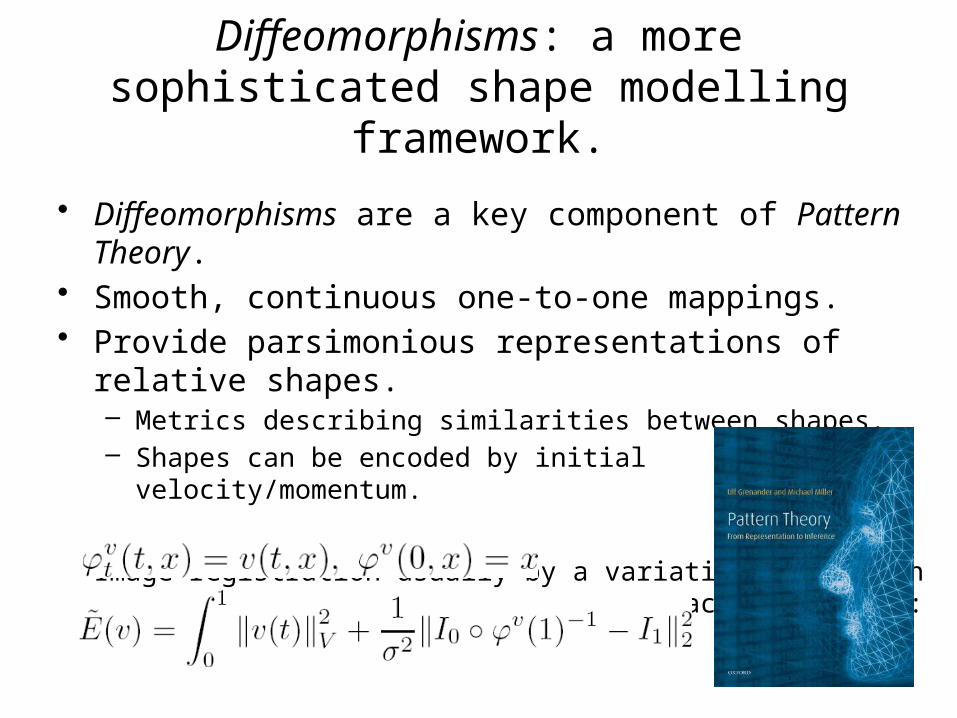
Diffeomorphisms: a more sophisticated shape modelling framework.
• Diffeomorphisms are a key component of Pattern Theory.• Smooth, continuous one-to-one mappings.• Provide parsimonious representations of relative shapes.
– Metrics describing similarities between shapes.– Shapes can be encoded by initial velocity/momentum.
Image registration usually by a variational approachbased on the principle of stationary action (LDDMM):
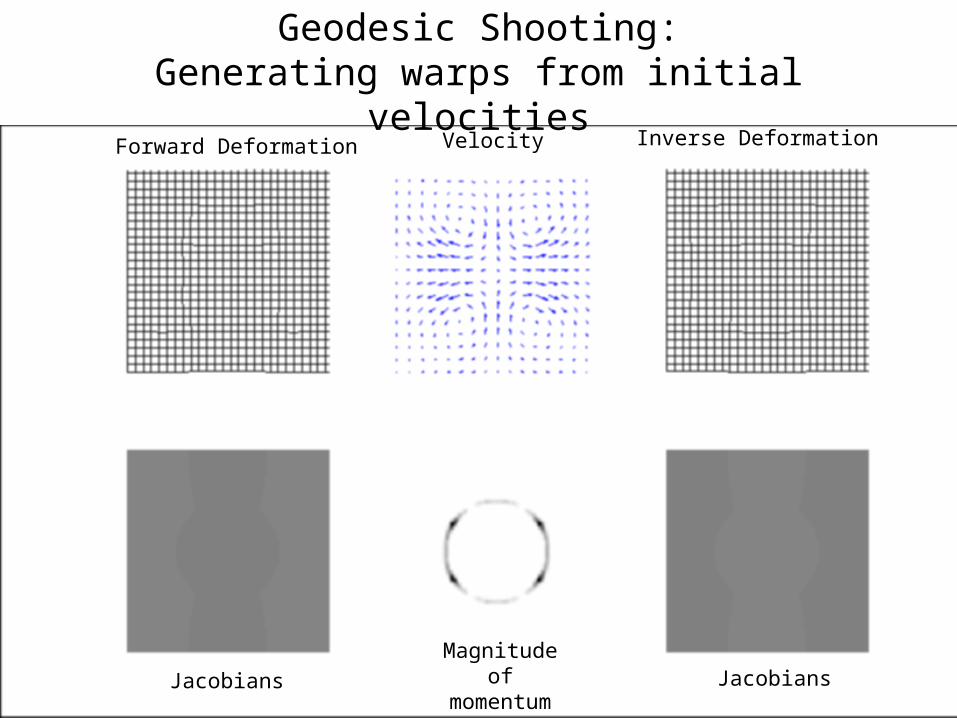
Geodesic Shooting:Generating warps from initial velocities
Magnitude of momentum
VelocityForward Deformation Inverse Deformation
Jacobians Jacobians
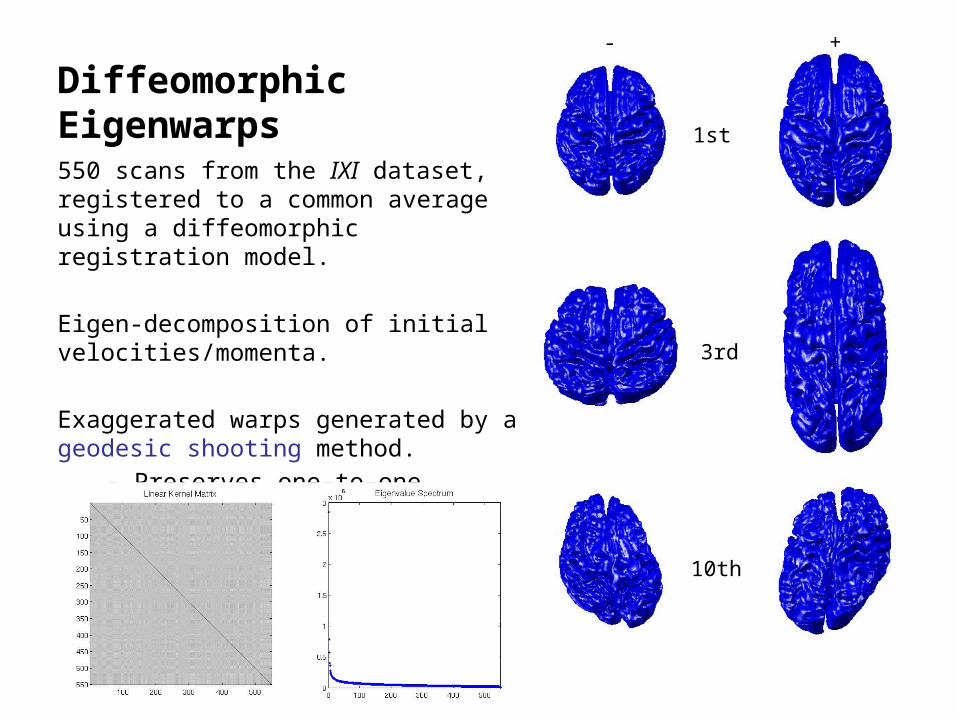
Diffeomorphic Eigenwarps550 scans from the IXI dataset, registered to a common average using a diffeomorphic registration model.
Eigen-decomposition of initial velocities/momenta.
Exaggerated warps generated by a geodesic shooting method.
- Preserves one-to-one mapping.
1st
3rd
10th
- +
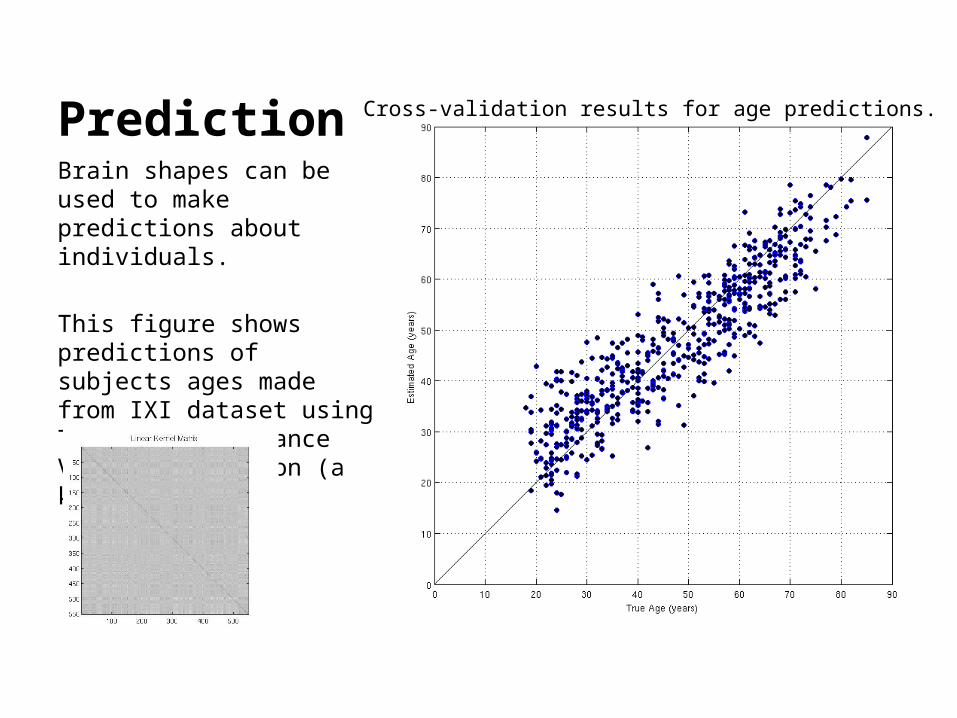
PredictionsBrain shapes can be used to make predictions about individuals.
This figure shows predictions of subjects ages made from IXI dataset using Tipping’s Relevance Vector Regression (a kernel method).
More useful predictions may be possible from other data.
Cross-validation results for age predictions.
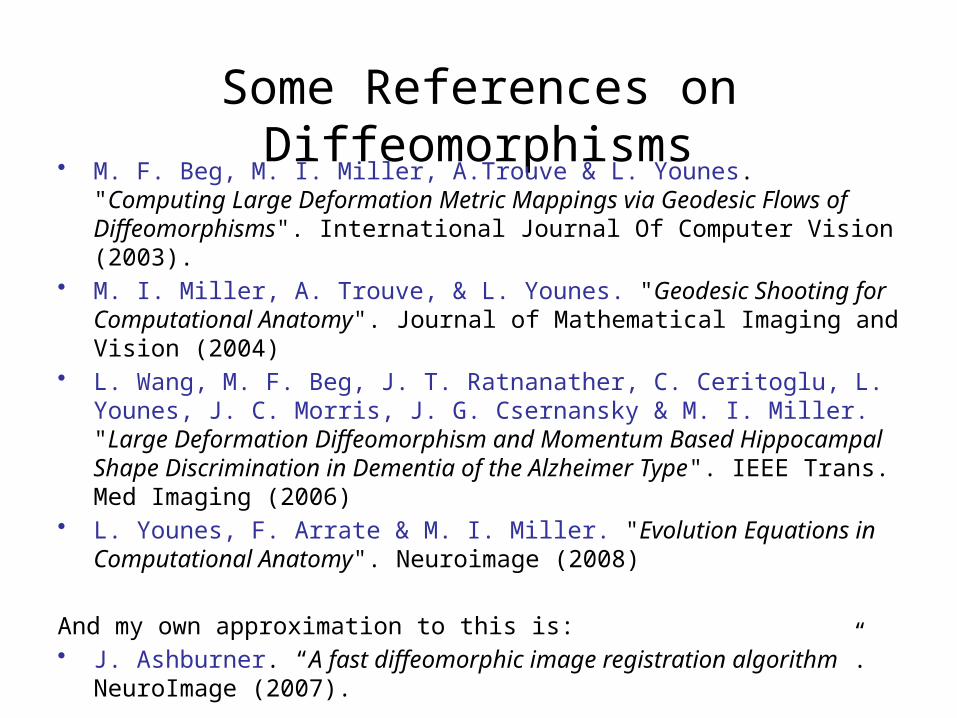
Some References on Diffeomorphisms• M. F. Beg, M. I. Miller, A.Trouve & L. Younes. "Computing Large
Deformation Metric Mappings via Geodesic Flows of Diffeomorphisms". International Journal Of Computer Vision (2003).
• M. I. Miller, A. Trouve, & L. Younes. "Geodesic Shooting for Computational Anatomy". Journal of Mathematical Imaging and Vision (2004)
• L. Wang, M. F. Beg, J. T. Ratnanather, C. Ceritoglu, L. Younes, J. C. Morris, J. G. Csernansky & M. I. Miller. "Large Deformation Diffeomorphism and Momentum Based Hippocampal Shape Discrimination in Dementia of the Alzheimer Type". IEEE Trans. Med Imaging (2006)
• L. Younes, F. Arrate & M. I. Miller. "Evolution Equations in Computational Anatomy". Neuroimage (2008)
And my own approximation to this is:• J. Ashburner. “A fast diffeomorphic image registration algorithm”.
NeuroImage (2007).


Contents
• Introduction• Voxel-based Morphometry• Segmentation• Diffeomorphic Shape Modelling
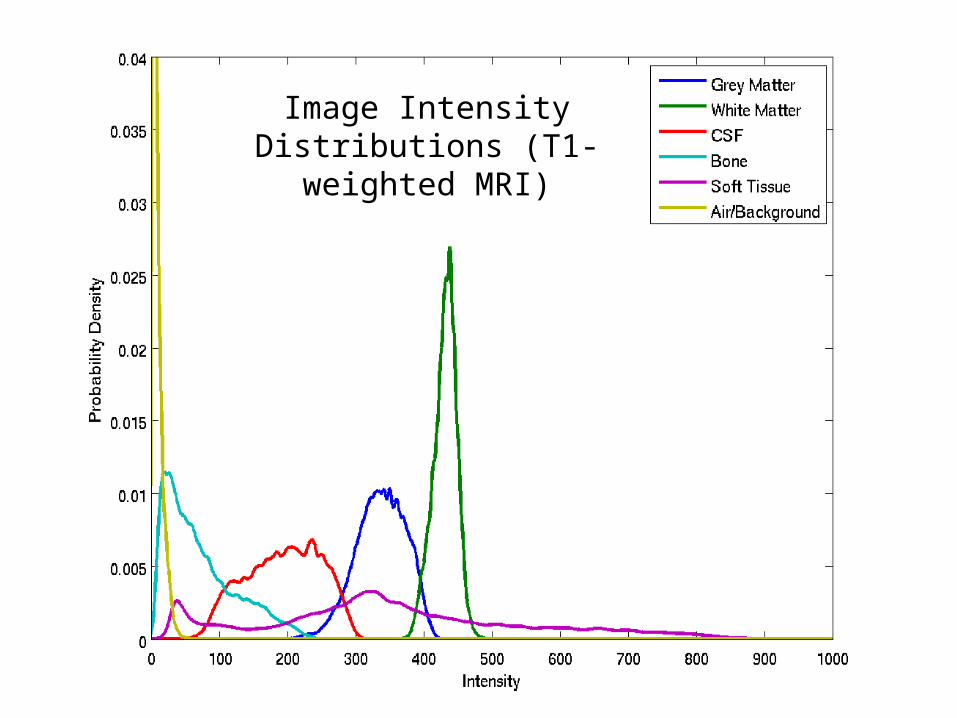
Image Intensity Distributions (T1-weighted MRI)
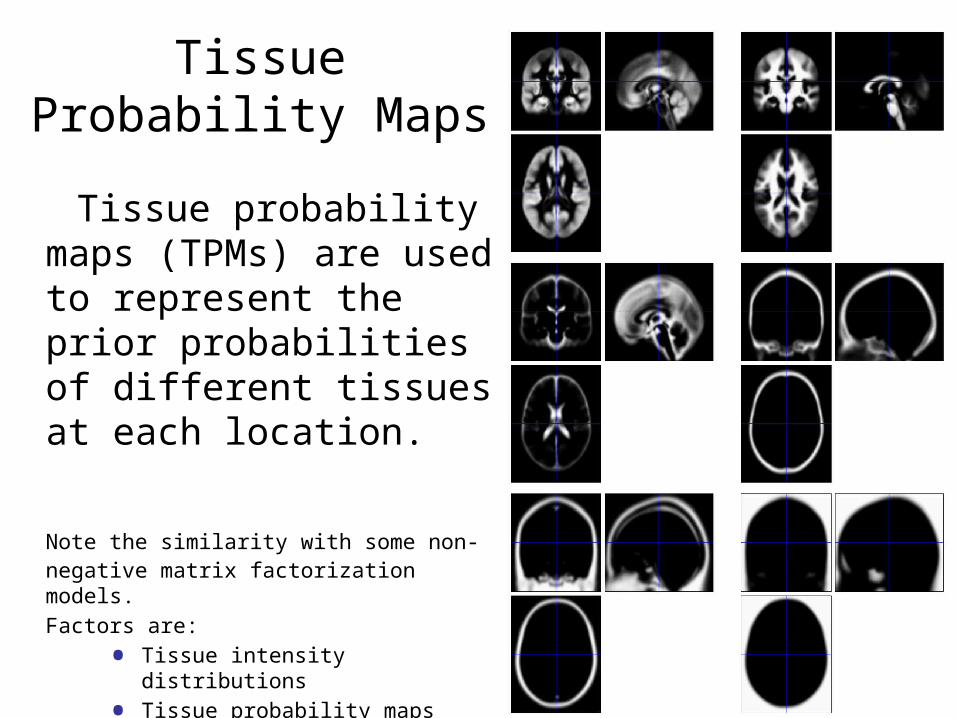
Tissue Probability Maps
Tissue probability maps (TPMs) are used to represent the prior probabilities of different tissues at each location.
Note the similarity with some non-negative matrix factorization models.
Factors are:
• Tissue intensity distributions
• Tissue probability maps
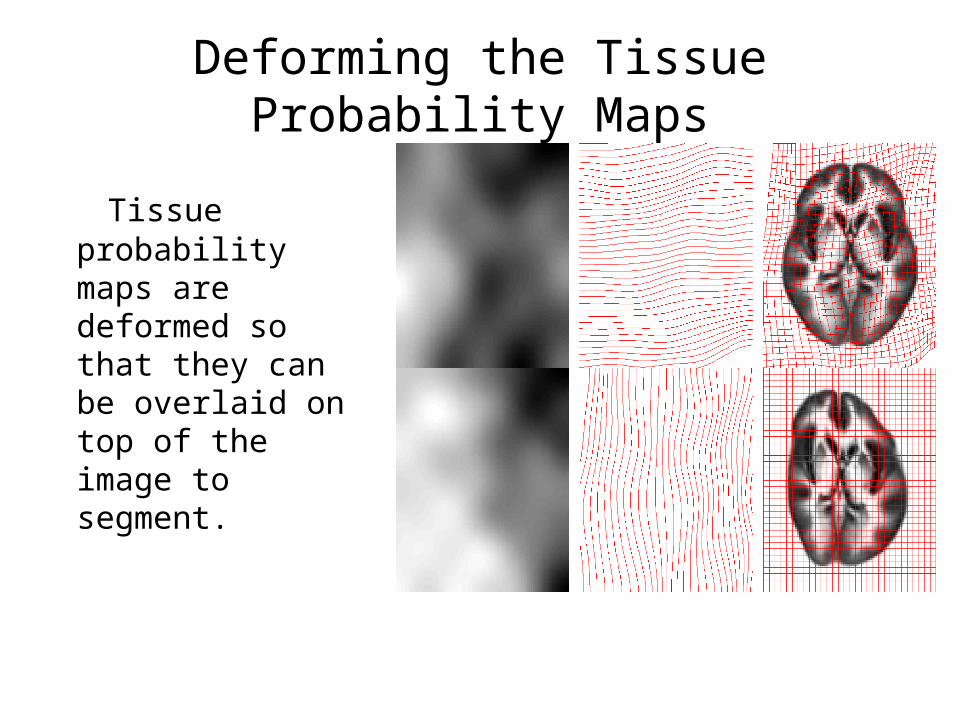
Deforming the Tissue Probability Maps
Tissue probability maps are deformed so that they can be overlaid on top of the image to segment.
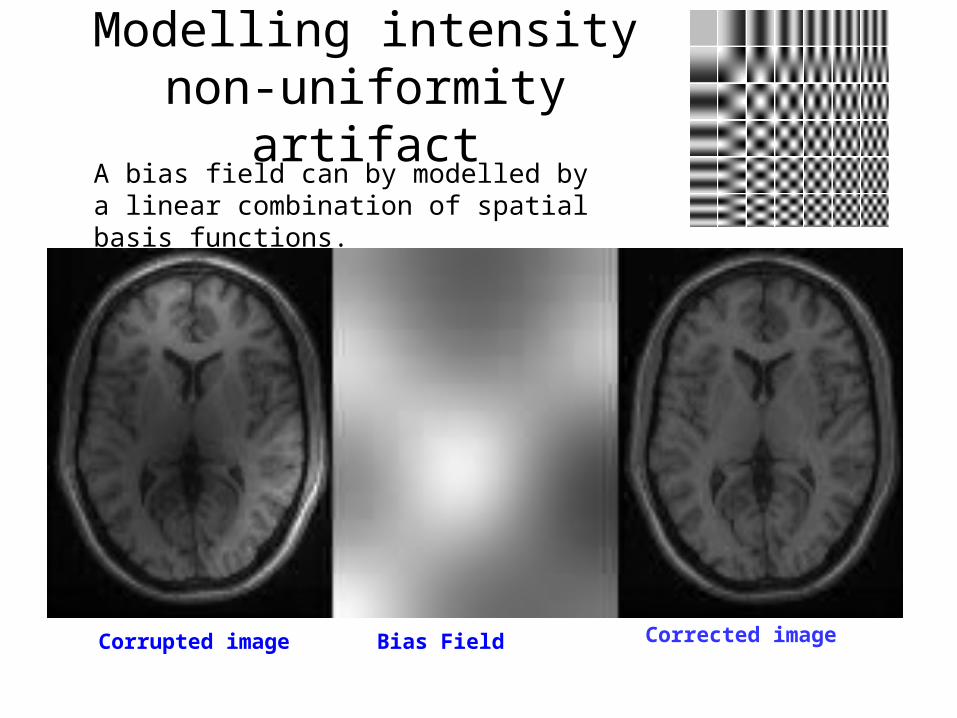
Modelling intensity non-uniformity artifact
A bias field can by modelled by a linear combination of spatial basis functions.
Corrupted image Corrected imageBias Field

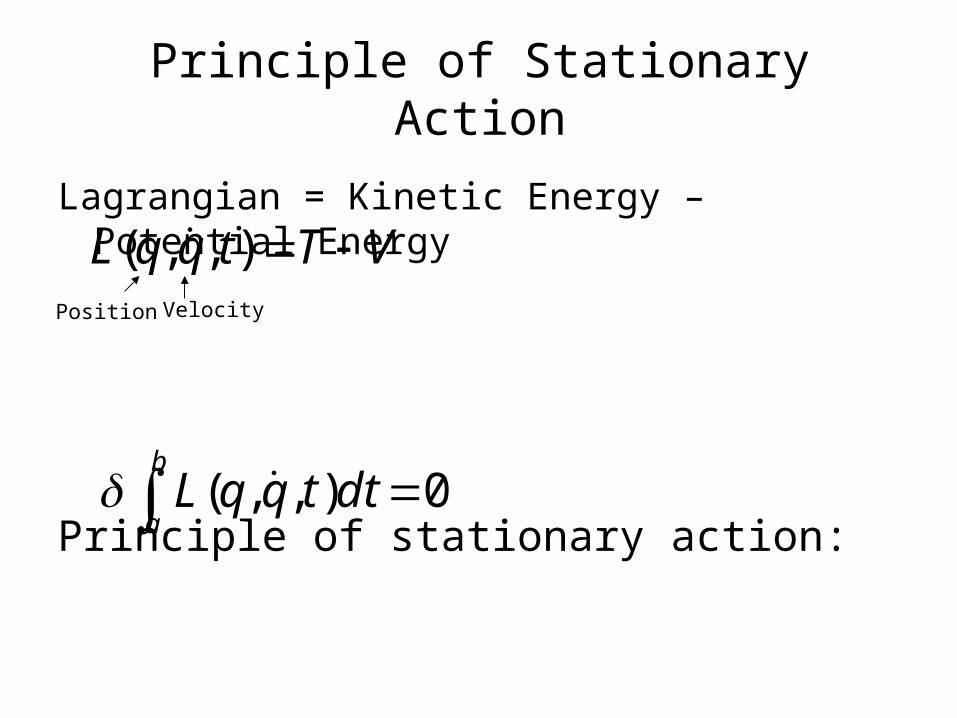
Principle of Stationary Action
Lagrangian = Kinetic Energy – Potential Energy
Principle of stationary action:
LDDMM is a variational method based on this principle.
Position Velocity
VTtqqL ),,(
0),,( b
adttqqL
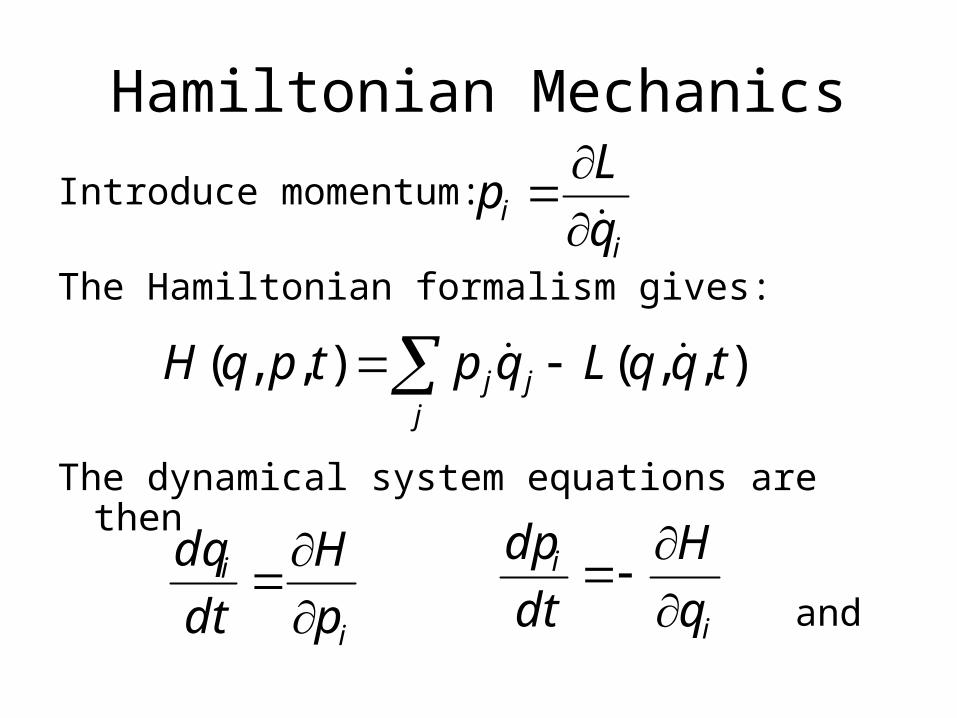
Hamiltonian Mechanics
Introduce momentum:
The Hamiltonian formalism gives:
The dynamical system equations are then
and
),,(),,( tqqLqptpqH jj
j
ii q
Lp
i
i
p
H
dt
dq
i
i
q
H
dt
dp
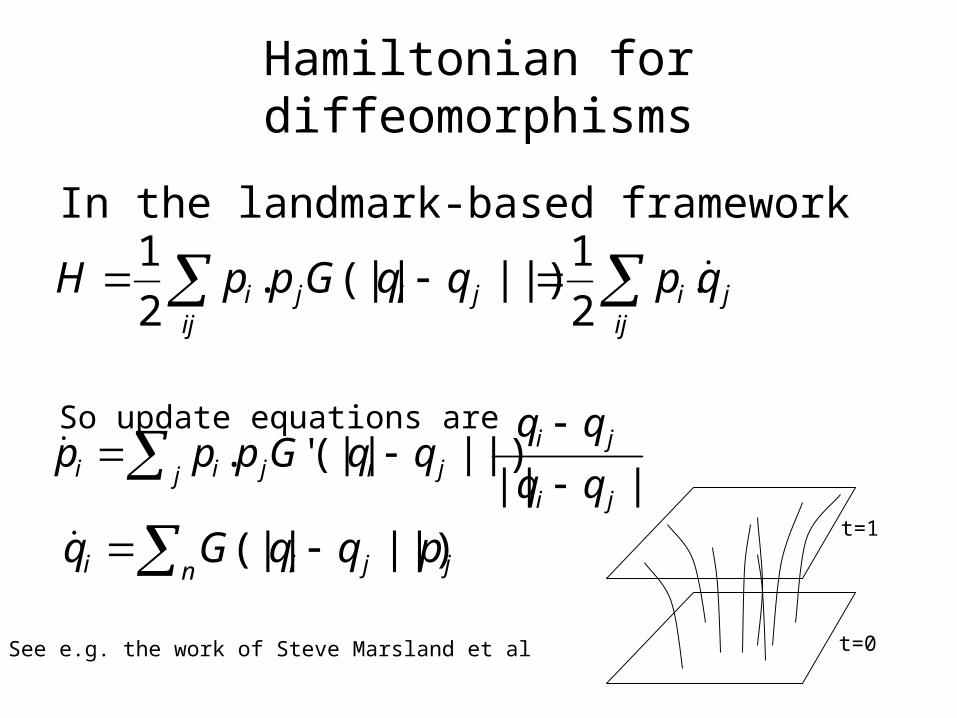
Hamiltonian for diffeomorphisms
In the landmark-based framework
So update equations are
ij
jiij
jiji qpqqGppH .2
1||)(||.
2
1
jjn ii pqqGq ||)(|| ||||
||)(||'.ji
jijj ijii qq
qqqqGppp
t=0
t=1
See e.g. the work of Steve Marsland et al