Embed Size (px)
Citation preview
Brady Pincushion Cactus(Pediocactus bradyi)
5 Year Monitoring Report
“The Cave” Monitoring SiteCoconino County, AZ
2009-2014
Prepared by A. F. HazeltonNavajo Natural Heritage Program
Department of Fish & WildlifeP.O. Box 1480
Window Rock AZ, 86515
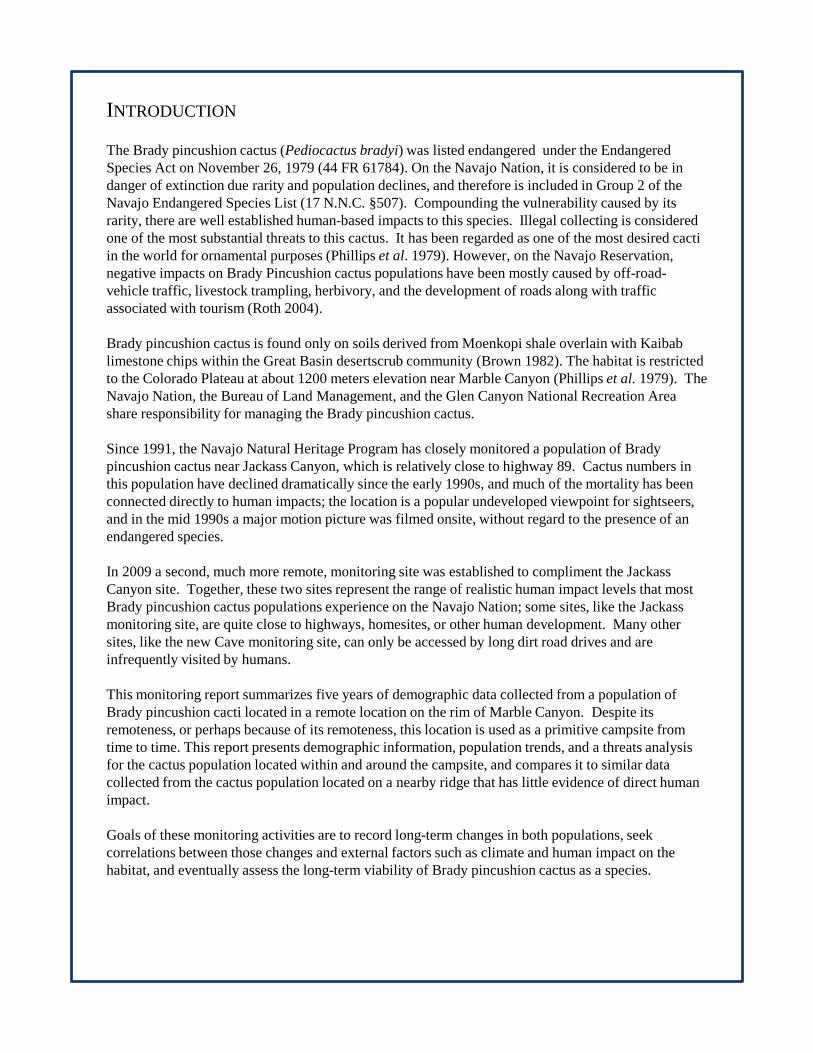
The Brady pincushion cactus (Pediocactus bradyi) was listed endangered under the Endangered Species Act on November 26, 1979 (44 FR 61784). On the Navajo Nation, it is considered to be in danger of extinction due rarity and population declines, and therefore is included in Group 2 of the Navajo Endangered Species List (17 N.N.C. §507). Compounding the vulnerability caused by its rarity, there are well established human-based impacts to this species. Illegal collecting is considered one of the most substantial threats to this cactus. It has been regarded as one of the most desired cacti in the world for ornamental purposes (Phillips et al. 1979). However, on the Navajo Reservation, negative impacts on Brady Pincushion cactus populations have been mostly caused by off-road-vehicle traffic, livestock trampling, herbivory, and the development of roads along with traffic associated with tourism (Roth 2004).
Brady pincushion cactus is found only on soils derived from Moenkopi shale overlain with Kaibab limestone chips within the Great Basin desertscrub community (Brown 1982). The habitat is restricted to the Colorado Plateau at about 1200 meters elevation near Marble Canyon (Phillips et al. 1979). The Navajo Nation, the Bureau of Land Management, and the Glen Canyon National Recreation Area share responsibility for managing the Brady pincushion cactus.
Since 1991, the Navajo Natural Heritage Program has closely monitored a population of Brady pincushion cactus near Jackass Canyon, which is relatively close to highway 89. Cactus numbers in this population have declined dramatically since the early 1990s, and much of the mortality has been connected directly to human impacts; the location is a popular undeveloped viewpoint for sightseers, and in the mid 1990s a major motion picture was filmed onsite, without regard to the presence of an endangered species.
In 2009 a second, much more remote, monitoring site was established to compliment the Jackass Canyon site. Together, these two sites represent the range of realistic human impact levels that most Brady pincushion cactus populations experience on the Navajo Nation; some sites, like the Jackass monitoring site, are quite close to highways, homesites, or other human development. Many other sites, like the new Cave monitoring site, can only be accessed by long dirt road drives and are infrequently visited by humans.
This monitoring report summarizes five years of demographic data collected from a population of Brady pincushion cacti located in a remote location on the rim of Marble Canyon. Despite its remoteness, or perhaps because of its remoteness, this location is used as a primitive campsite from time to time. This report presents demographic information, population trends, and a threats analysis for the cactus population located within and around the campsite, and compares it to similar data collected from the cactus population located on a nearby ridge that has little evidence of direct human impact.
Goals of these monitoring activities are to record long-term changes in both populations, seek correlations between those changes and external factors such as climate and human impact on the habitat, and eventually assess the long-term viability of Brady pincushion cactus as a species.
INTRODUCTION
METHODS
In 2009, Navajo Natural Heritage Program staff established seven monitoring plots in a remote location on the east rim of Marble Canyon in Coconino County, Arizona. Four of the plots were placed within and around an undeveloped campsite-- a scenic overlook with a well-established fire ring and a two-track dirt road leading to it. Three of the plots were placed on top of a nearby ridge, where there was little evidence of human visitation. Plots were circular in shape, with the center marked by a rebar, and 5 meters in radius. At the time the plots were established, all Brady pincushion cacti found within each plot were tagged, numbered and mapped. Each year, reproductive status, number of reproductive structures, plant diameter, and plant vigor are recorded for each tagged cactus. When additional plants are found, they are tagged, numbered, mapped, and monitored as well. Any dead cacti are noted as such, along with the cause of death if it is possible to determine, and the tag is removed. Cacti which cannot be located for three years in a row are assumed dead and the tag is removed. Any damage to live cacti is noted, along with the source of the damage if it possible to determine. The plots were monitored during the second week of April from 2009 to 2014, except for the year 2010, as there was no botanist working for the program that year.
RESULTS
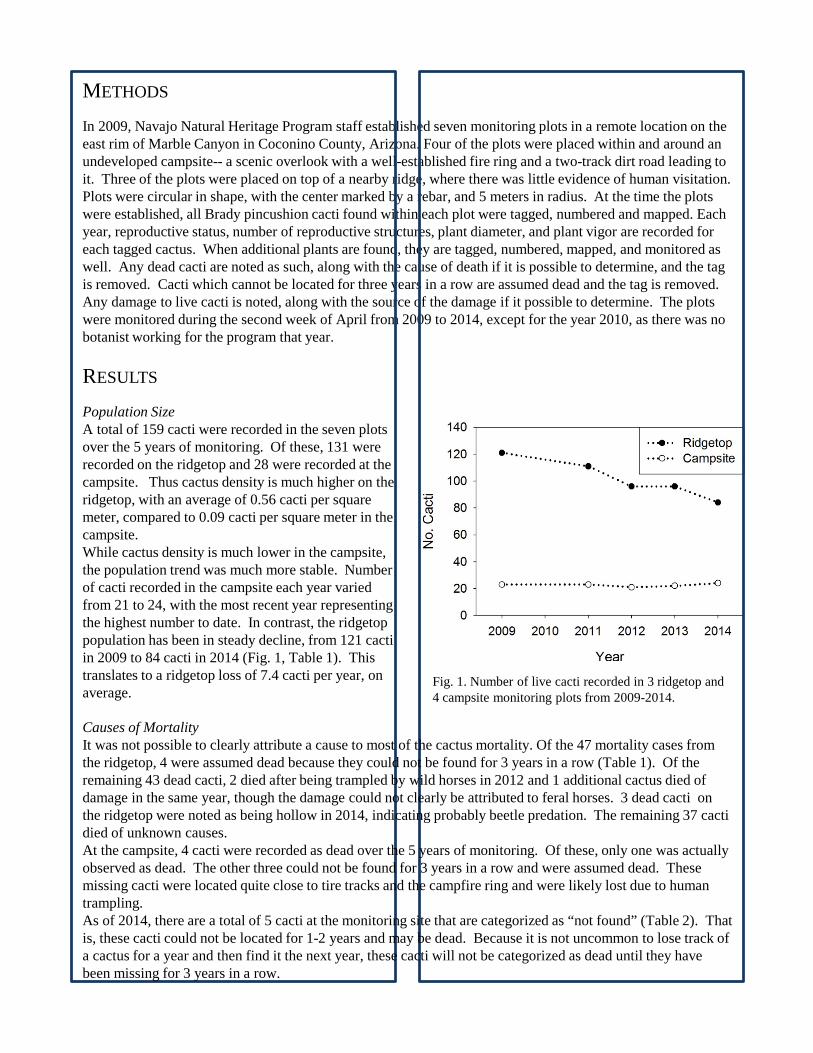
Population SizeA total of 159 cacti were recorded in the seven plots over the 5 years of monitoring. Of these, 131 were recorded on the ridgetop and 28 were recorded at the campsite. Thus cactus density is much higher on the ridgetop, with an average of 0.56 cacti per square meter, compared to 0.09 cacti per square meter in the campsite.While cactus density is much lower in the campsite, the population trend was much more stable. Number of cacti recorded in the campsite each year varied from 21 to 24, with the most recent year representing the highest number to date. In contrast, the ridgetop population has been in steady decline, from 121 cacti in 2009 to 84 cacti in 2014 (Fig. 1, Table 1). This translates to a ridgetop loss of 7.4 cacti per year, on average.
Fig. 1. Number of live cacti recorded in 3 ridgetop and 4 campsite monitoring plots from 2009-2014.
Causes of MortalityIt was not possible to clearly attribute a cause to most of the cactus mortality. Of the 47 mortality cases from the ridgetop, 4 were assumed dead because they could not be found for 3 years in a row (Table 1). Of the remaining 43 dead cacti, 2 died after being trampled by wild horses in 2012 and 1 additional cactus died of damage in the same year, though the damage could not clearly be attributed to feral horses. 3 dead cacti on the ridgetop were noted as being hollow in 2014, indicating probably beetle predation. The remaining 37 cacti died of unknown causes.At the campsite, 4 cacti were recorded as dead over the 5 years of monitoring. Of these, only one was actually observed as dead. The other three could not be found for 3 years in a row and were assumed dead. These missing cacti were located quite close to tire tracks and the campfire ring and were likely lost due to human trampling.As of 2014, there are a total of 5 cacti at the monitoring site that are categorized as “not found” (Table 2). That is, these cacti could not be located for 1-2 years and may be dead. Because it is not uncommon to lose track of a cactus for a year and then find it the next year, these cacti will not be categorized as dead until they have been missing for 3 years in a row.
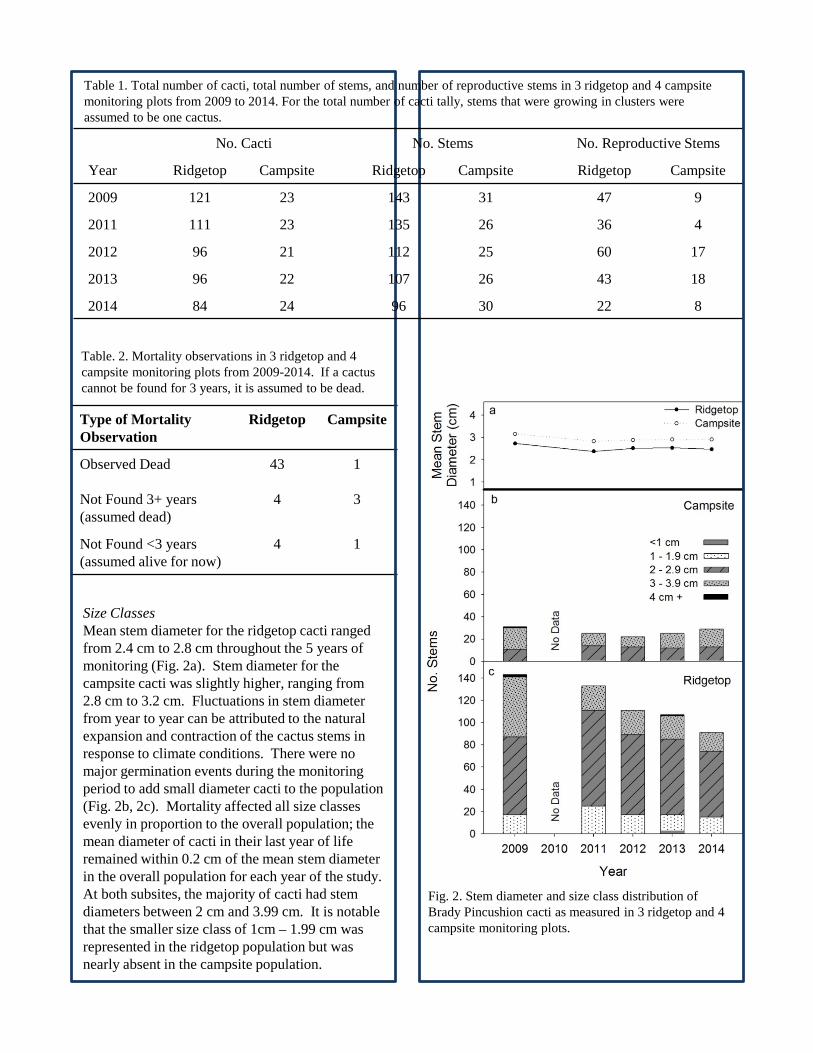
Size ClassesMean stem diameter for the ridgetop cacti ranged from 2.4 cm to 2.8 cm throughout the 5 years of monitoring (Fig. 2a). Stem diameter for the campsite cacti was slightly higher, ranging from 2.8 cm to 3.2 cm. Fluctuations in stem diameter from year to year can be attributed to the natural expansion and contraction of the cactus stems in response to climate conditions. There were no major germination events during the monitoring period to add small diameter cacti to the population (Fig. 2b, 2c). Mortality affected all size classes evenly in proportion to the overall population; the mean diameter of cacti in their last year of life remained within 0.2 cm of the mean stem diameter in the overall population for each year of the study.At both subsites, the majority of cacti had stem diameters between 2 cm and 3.99 cm. It is notable that the smaller size class of 1cm – 1.99 cm was represented in the ridgetop population but was nearly absent in the campsite population.
Fig. 2. Stem diameter and size class distribution of Brady Pincushion cacti as measured in 3 ridgetop and 4 campsite monitoring plots.
Type of MortalityObservation
Ridgetop Campsite
Observed Dead 43 1
Not Found 3+ years(assumed dead)
4 3
Not Found <3 years(assumed alive for now)
4 1
Table. 2. Mortality observations in 3 ridgetop and 4 campsite monitoring plots from 2009-2014. If a cactus cannot be found for 3 years, it is assumed to be dead.
No. Cacti No. Stems No. Reproductive Stems
Year Ridgetop Campsite Ridgetop Campsite Ridgetop Campsite
2009 121 23 143 31 47 9
2011 111 23 135 26 36 4
2012 96 21 112 25 60 17
2013 96 22 107 26 43 18
2014 84 24 96 30 22 8
Table 1. Total number of cacti, total number of stems, and number of reproductive stems in 3 ridgetop and 4 campsite monitoring plots from 2009 to 2014. For the total number of cacti tally, stems that were growing in clusters were assumed to be one cactus.
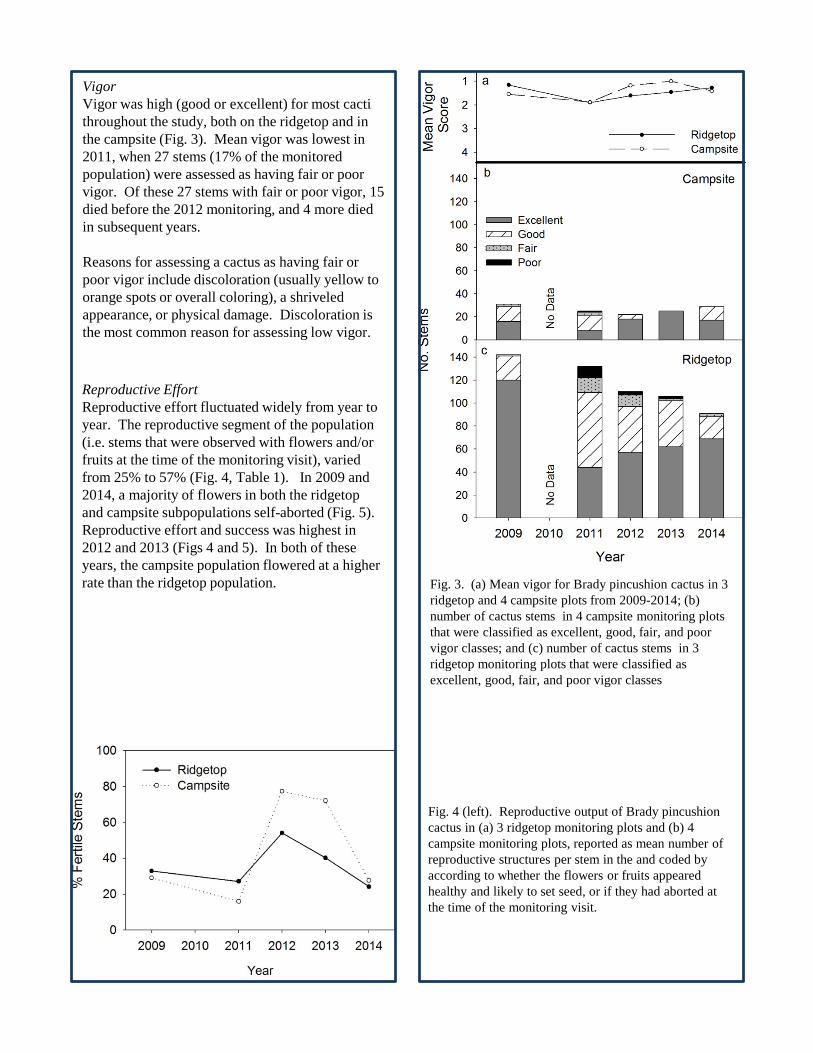
Reproductive EffortReproductive effort fluctuated widely from year to year. The reproductive segment of the population (i.e. stems that were observed with flowers and/or fruits at the time of the monitoring visit), varied from 25% to 57% (Fig. 4, Table 1). In 2009 and 2014, a majority of flowers in both the ridgetop and campsite subpopulations self-aborted (Fig. 5). Reproductive effort and success was highest in 2012 and 2013 (Figs 4 and 5). In both of these years, the campsite population flowered at a higher rate than the ridgetop population.
VigorVigor was high (good or excellent) for most cacti throughout the study, both on the ridgetop and in the campsite (Fig. 3). Mean vigor was lowest in 2011, when 27 stems (17% of the monitored population) were assessed as having fair or poor vigor. Of these 27 stems with fair or poor vigor, 15 died before the 2012 monitoring, and 4 more died in subsequent years.
Reasons for assessing a cactus as having fair or poor vigor include discoloration (usually yellow to orange spots or overall coloring), a shriveled appearance, or physical damage. Discoloration is the most common reason for assessing low vigor.
Fig. 3. (a) Mean vigor for Brady pincushion cactus in 3 ridgetop and 4 campsite plots from 2009-2014; (b) number of cactus stems in 4 campsite monitoring plots that were classified as excellent, good, fair, and poor vigor classes; and (c) number of cactus stems in 3 ridgetop monitoring plots that were classified as excellent, good, fair, and poor vigor classes
Fig. 4 (left). Reproductive output of Brady pincushion cactus in (a) 3 ridgetop monitoring plots and (b) 4 campsite monitoring plots, reported as mean number of reproductive structures per stem in the and coded by according to whether the flowers or fruits appeared healthy and likely to set seed, or if they had aborted at the time of the monitoring visit.
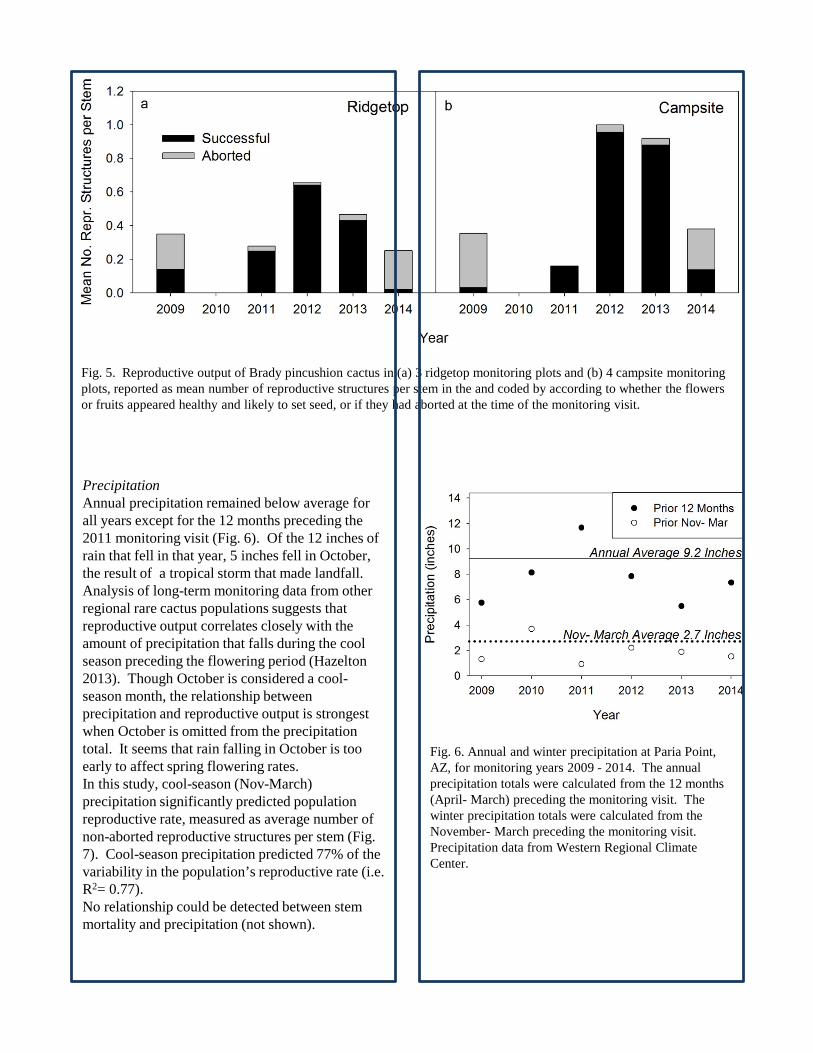
Fig. 5. Reproductive output of Brady pincushion cactus in (a) 3 ridgetop monitoring plots and (b) 4 campsite monitoring plots, reported as mean number of reproductive structures per stem in the and coded by according to whether the flowers or fruits appeared healthy and likely to set seed, or if they had aborted at the time of the monitoring visit.
Fig. 6. Annual and winter precipitation at Paria Point, AZ, for monitoring years 2009 - 2014. The annual precipitation totals were calculated from the 12 months (April- March) preceding the monitoring visit. The winter precipitation totals were calculated from the November- March preceding the monitoring visit. Precipitation data from Western Regional Climate Center.
PrecipitationAnnual precipitation remained below average for all years except for the 12 months preceding the 2011 monitoring visit (Fig. 6). Of the 12 inches of rain that fell in that year, 5 inches fell in October, the result of a tropical storm that made landfall. Analysis of long-term monitoring data from other regional rare cactus populations suggests that reproductive output correlates closely with the amount of precipitation that falls during the cool season preceding the flowering period (Hazelton 2013). Though October is considered a cool-season month, the relationship between precipitation and reproductive output is strongest when October is omitted from the precipitation total. It seems that rain falling in October is too early to affect spring flowering rates.In this study, cool-season (Nov-March) precipitation significantly predicted population reproductive rate, measured as average number of non-aborted reproductive structures per stem (Fig. 7). Cool-season precipitation predicted 77% of the variability in the population’s reproductive rate (i.e. R2= 0.77).No relationship could be detected between stem mortality and precipitation (not shown).
Demographic trends in the ridgetop and campsite populations
The first five years of monitoring the “Cave” population of Brady Pincushion Cactus paint an interesting picture of one population segment on the decline and another holding steady, probably following a previous decline. The ridgetop subpopulation, which has not been subjected to prolonged human disturbance, had higher cactus density and a greater proportion of small size classes (<2 centimeters diameter), which indicates somewhat recent recruitment. Warren (1993) reports that 2 centimeters diameter individuals of Pediocactus paradinei are approximately 10 years old, and Spence (1993) suggest that P. bradyi has a similar growth rate. Though some recruitment was evident in the ridgtop subpopulation, numbers still declined over the 5 years of monitoring due to high mortality. Based on the limited data so far, it appears improbable that the population is recruiting at a rate to replace the losses. Recruitment is difficult to detect in Brady Pincushion Cactus, because seedling cacti are tiny and incredibly difficult to find. It has been hypothesized that seedling P. bradyi remain underground for their first 2 years of life (Spence 1993, citing Brack pers. comm. 1993). Seedlings smaller than 1 centimeter diameter are sometimes detected, but this generally happens when these seedlings are immediately adjacent to an adult plant. The surveyor is able to spot the seedling only because she is closely examining the parent plant. The only seedlings less than 1 centimeter in diameter recorded in this study were in 2013, when 3 seedlings were recorded in the ridgetop plots. Unfortunately, one of these seedlings was found dead in 2014, and the other two were not found in 2014. The source of the population’s recent high mortality is uncertain. In 2012, horse tracks were observed throughout the ridgetop plots. There is solid evidence that these feral horses trampled 2 of the cacti, and there is a distinct possibility that they were responsible for additional mortality. P. bradyi habitat is rocky, so horse tracks will not always be visible. Similarly, a few cacti were observed as hollow and were likely killed by insect infestation. But overall, cacti were simply dead or missing. Drought seems like a probable cause for much of the mortality.The campsite plots, on the other hand, did not experience the steep mortality of the ridgetop plots. The density of cacti is so low in this subpopulation, that it is reasonable to hypothesize that there was a thriving population here sometime in the past, but human foot and and vehicle traffic killed many of these cacti long ago. The majority of the cacti in these campsite plots are located in protected locations underneath shrubs or adjacent to large rocks. This is not the case on the ridgetop– up there most of the cacti grow out in the open, and are not protected by shrubs or rocks (see Figs 8 and 9).In the campsite plots, there have been only 2 cacti smaller than 2 centimeters diameter found throughout the 5 years of monitoring, indicating almost no recruitment in the recent past. This lack of recruitment may be related to the ongoing disturbance, and possibly the legacy of soil compaction from vehicles and human trampling. Possibly this subpopulation is now so sparse that cross-pollination and seed set have become uncommon.
DISCUSSION
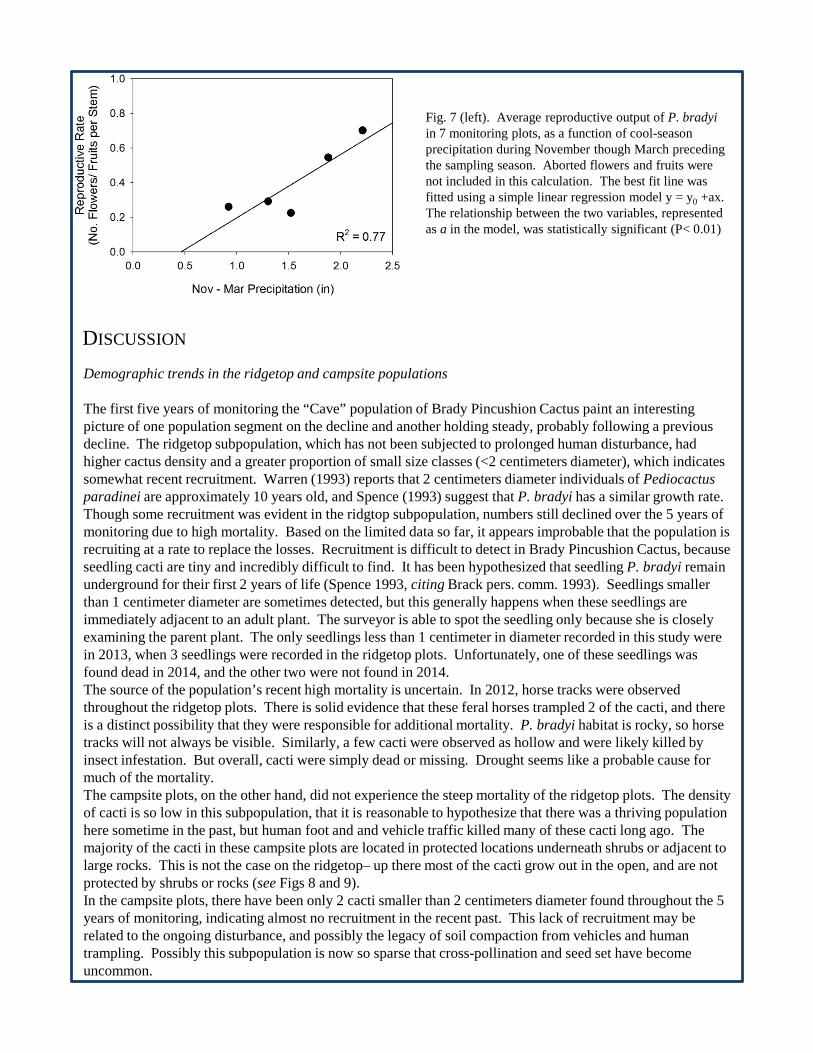
Fig. 7 (left). Average reproductive output of P. bradyiin 7 monitoring plots, as a function of cool-season precipitation during November though March preceding the sampling season. Aborted flowers and fruits were not included in this calculation. The best fit line was fitted using a simple linear regression model y = y0 +ax. The relationship between the two variables, represented as a in the model, was statistically significant (P< 0.01)
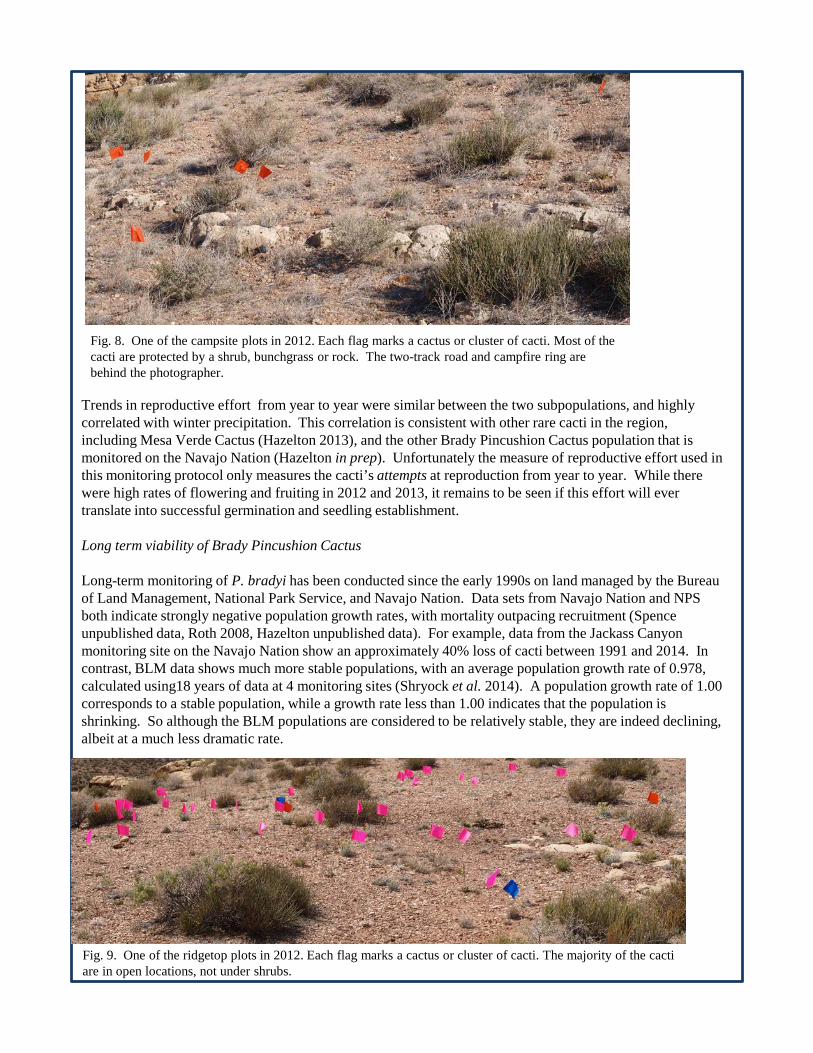
Fig. 8. One of the campsite plots in 2012. Each flag marks a cactus or cluster of cacti. Most of the cacti are protected by a shrub, bunchgrass or rock. The two-track road and campfire ring are behind the photographer.
Trends in reproductive effort from year to year were similar between the two subpopulations, and highly correlated with winter precipitation. This correlation is consistent with other rare cacti in the region, including Mesa Verde Cactus (Hazelton 2013), and the other Brady Pincushion Cactus population that is monitored on the Navajo Nation (Hazelton in prep). Unfortunately the measure of reproductive effort used in this monitoring protocol only measures the cacti’s attempts at reproduction from year to year. While there were high rates of flowering and fruiting in 2012 and 2013, it remains to be seen if this effort will ever translate into successful germination and seedling establishment.
Long term viability of Brady Pincushion Cactus
Long-term monitoring of P. bradyi has been conducted since the early 1990s on land managed by the Bureau of Land Management, National Park Service, and Navajo Nation. Data sets from Navajo Nation and NPS both indicate strongly negative population growth rates, with mortality outpacing recruitment (Spence unpublished data, Roth 2008, Hazelton unpublished data). For example, data from the Jackass Canyon monitoring site on the Navajo Nation show an approximately 40% loss of cacti between 1991 and 2014. In contrast, BLM data shows much more stable populations, with an average population growth rate of 0.978, calculated using18 years of data at 4 monitoring sites (Shryock et al. 2014). A population growth rate of 1.00 corresponds to a stable population, while a growth rate less than 1.00 indicates that the population is shrinking. So although the BLM populations are considered to be relatively stable, they are indeed declining, albeit at a much less dramatic rate.
Fig. 9. One of the ridgetop plots in 2012. Each flag marks a cactus or cluster of cacti. The majority of the cacti are in open locations, not under shrubs.
Shryock et al.’s population viability analysis is much more sophisticated than any analysis that’s been done with National Park Service or Navajo Nation data to date, and lends a certain amount of perspective to the other two data sets. For example, Shryock et al.’s analysis shows that it took 14 years of monitoring data before the confidence interval for the population growth rate did not overlap 1.00. In other words, until 14 years of data were included in the model, there was statistical uncertainty as to whether the population was increasing or declining. This should be kept in mind when interpreting the 5 years of monitoring data reported for “The Cave” monitoring site. The reason for this uncertainty, besides the basic statistical limitations of measuring samples rather than censusing a population, is that P. bradyi and many other non-clonal cactiin the region are known to recruit only sporadically, in response to exceptional precipitation events (Coles et al. 2012, Godínez-Álvarez et al. 2003, Shryock et al. 2014). It’s clear that the Marble Canyon area has not experienced one of these exceptional precipitation events since the start of the Cave monitoring in 2009.
Regardless of the length of the data sets, all data point to a decline in numbers of this species, and the causes are not completely clear. Recruitment appears to be a problem, and mortality is uncomfortably high and not always connected to measurable or controllable threats. In addition to continuing long-term monitoring, the three responsible land managers are collaborating with the Flagstaff Arboretum to explore propagation and transplantation options.
Brown, D.E. 1982. “Biotic Communities of the American Southwest– United States and Mexico.” Desert Plants 4.
Coles, J.J., K.L. Decker, and T.S. Naumann. 2012. “Ecology and Population Dynamics of Sclerocactusmesae-verdae (Boissev. & C. Davidson) L.D. Benson.” Western North American Naturalist 72(3): 311-322.
Godínez-Álvarez, H., T. Valverde, and P. Ortega-Baes. 2003. “Demographic Trends in the Cactaceae.” The Botanical Review 69(2): 173-203.
Hazelton, A.F. 2013. Mesa Verde Cactus (Sclerocactus mesae-verdae) Monitoring Report: El MalpaisMonitoring Site, 2008-2013. Navajo Natural Heritage Program, Department of Fish and Widllife, P.O. Box 1480 Window Rock, AZ. Unpublshed report.
Phillips, A.M., B.G Phillips, L.T. Green, J. Mazzoni, and M. Peterson. 1979. Status report for Pediocactusbradyi L. Benson. Prepared for the U.S. Fish & Wildlife Service, Albuquerque, NM.
Roth, D. 2008. Monitoring Report: Pediocactus bradyi, Marble Canyon, Coconino County, AZ. Unpublished report prepared for the Navajo Natural Heritage Program, Window Rock, AZ.
Roth, D. 2004. Pediocactus bradyi Status Report. Unpublished report prepared for the U.S. Fish & Wildlife Service, Tucson, AZ. Navajo Natural Heritage Program, Window Rock, AZ. <http://nnhp.navajofishandwildlife.org>.
Shyrock, D.F., T.C. Esque, and L. Hughes. 2014. Population Viability of Pediocactus bradyi (Cactaceae) in a Changing Climate. American Journal of Botany 101:1944-1953.
Spence, J.R. 1993. Final report: A monitoring program for the endangered Pediocactus bradyi L. Benson, Lees Ferry, Glen Canyon National Recreation Area. National Park Service Resource Management Division, Glen Canyon Canyon National Recreation Area, Page AZ.
Western Regional Climate Center (WRCC). Precipitation Data from Paria Point Gauge. Period of record is Sept 1994 to Sept 2014. Available online <http://www.raws.dri.edu/cgi-bin/rawMAIN.pl?azAPAR>
REFERENCES
ACKNOWLEDGEMENTS
The study design and the first year of data collection for this report is attributable to D. Roth, former botanist for the NNHP. Thank you to L. Begay for field assistance in 2011, 2013, and 2014.