Embed Size (px)
Citation preview
8/3/2019 Bradley Testimony 10-19-11 SII
http://slidepdf.com/reader/full/bradley-testimony-10-19-11-sii 1/26
1
ETFs and the Present Danger to Capital Formation
Testimony of Harold Bradley and Robert E. Litanbefore the
Subcommittee on Securities, Insurance, and Investmentsof the
Senate Banking Committee
October 19, 2011
Mr. Chairman, and members of the Subcommittee, thank you for giving me the
opportunity to testify today about ETFs and the public policy challenges they
pose. I have prepared this written testimony with my colleague at the Kauffman
Foundation, Robert Litan, who is Vice President for Research and Policy. I am
Chief Investment Officer of the Foundation. Both of us draw in this testimony on
prior studies we have done on the growing ETF market,1 by ourselves and with
experts in securities settlements. But we offer here supplemental information,
which we hope will be of use to this Committee. I will be delivering an oral
summary of this testimony at the hearing.
Our bottom line is this: While ETFs began as a constructive financial innovation
over eighteen years ago, they have grown so fast in number and in variety that
1 See Harold Bradley and Robert E. Litan, “Choking the Recovery: Why NewGrowth Companies Aren’t Going Public and Unrecognized Risks of FutureMarket Disruptions,” http://www.kauffman.org/research-and-policy/Choking-the-Recovery.aspx; andHarold Bradley and Robert E. Litan, “See “Canaries in the Coal Mine: How theRise in Settlement “Fails” Creates Systemic Risk for Financial Firms andInvestors,” http://www.kauffman.org/research-and-policy/Canaries-in-the-Coal-Mine.aspx;
8/3/2019 Bradley Testimony 10-19-11 SII
http://slidepdf.com/reader/full/bradley-testimony-10-19-11-sii 2/26
2
they now account for roughly half of all the trading in U.S. equities markets today.
In the process, in our view, ETFs have increasingly distorted the role of equities
markets in capital formation, while posing systemic risks from potential
settlement failures.
We outline below the basis for these admittedly controversial conclusions, as well
as some regulatory fixes to the problems we identify.
ETFs and the Problems US Equities Markets Today
Investors increasingly realize U.S. equity markets are broken. And it isn’t just
amateur investors burned by the financial crisis of 2008 who think so. A recent
New York Times article says professional U.S. investors believe new derivative
instruments “have turned the market into a casino on steroids”.2
What has gone wrong, and what are the consequences? It helps to first remind
ourselves why stock markets exist. They were established to provide a place for
companies to access public investment capital – money invested to make more
products, to hire more workers, to build distribution networks around the world.
That market no longer exists. As is well known, modern stock markets are
geared instead to day traders, hedge funds and other short-term investors. Add
2 “Volatility, Thy Name is ETF”. New York Times. October 10, 2011.
8/3/2019 Bradley Testimony 10-19-11 SII
http://slidepdf.com/reader/full/bradley-testimony-10-19-11-sii 3/26
3
to that list a modern “innovation”: Exchange Traded Funds (ETFs), which may be
more dangerous than all the preceding factors combined.
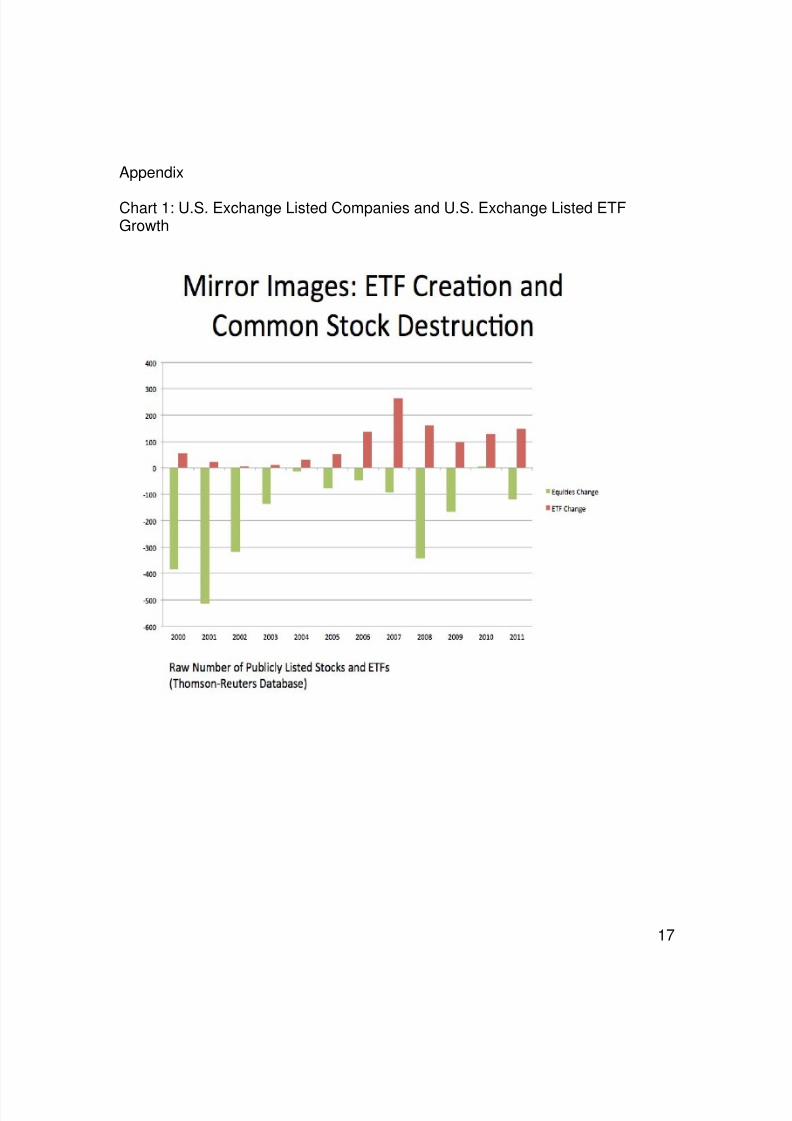
Here is why. The past 12 years reveal that fewer and fewer U.S. companies elect
to trade on primary U.S. stock markets. The number of exchange-traded stocks
dropped almost 30% -- from about 6,200 to 4,300 today. During that same time,
the Securities Exchange Commission (SEC) gave ETF sponsors a free pass
from certain U.S. securities regulations. The predictable response? The number
of ETFs grew exponentially – eleven times – from 95 to more than 1,100 (chart
1).
We have enough history with financial innovations to at least raise questions
when we see an innovation growing at very rapid rates. ETFs are no exception.
We believe that these instruments may now be undermining the fundamental role
of equities markets in pricing securities to ensure that capital is efficiently
allocated to growing businesses. When individual common stocks increasingly
behave as if they are derivatives of frequently traded and interlinked ETF
baskets, then it is trading in the ETFs that is driving the prices of the underlying
stocks rather than the other way around. This tendency is especially pronounced
for ETFs that are comprised of small cap stocks or stocks of newly listed
companies, that generally are thinly traded. The stocks of these companies are
the proverbial tiny boats being tossed around on the ETF ocean. As we outlined
in our earlier Kauffman Foundation report: “Choking the Recovery: Why New
8/3/2019 Bradley Testimony 10-19-11 SII
http://slidepdf.com/reader/full/bradley-testimony-10-19-11-sii 4/26
4
Growth Companies Aren’t Going Public and Unrecognized Risks of Future
Market Disruptions,”3 the reluctance to become such a little boat is an important
reason why growing private companies may be avoiding the public markets.
To understand why we reach this conclusion, it is useful to understand the
essential structure of an ETF. In the early days of the industry, ETF sponsors
now owned by Blackrock and State Street created baskets of securities designed
to track broad market indexes, such as the S&P 500. In contrast, today’s widely
diverse ETF products cater to every hedge fund’s unique tastes. Product design
allows hedge funds and day traders to make bets on global uranium production
companies, on market volatility, on emerging market sovereign debt, and
everything in between. Embedded in some of these ETFs are even more
derivative instruments.
Unlike mutual funds that price the basket of securities once daily and allow for
purchases and redemptions at that price, ETFs provide continuous trading
throughout the day. As electronic trading has supplanted human specialists on
the trading floor, the specialists and market makers adapted and assumed the
role as “Authorized Participants” (APs) in manufacturing ETFs. When a
customer buys shares of an ETF, the AP serves as the middleman between all
buyers and sellers. If at any time during the trading session (and especially at
the end of the day) there are far more buyers than sellers, the AP balances its
3 http://www.kauffman.org/research-and-policy/Choking-the-Recovery.aspx
8/3/2019 Bradley Testimony 10-19-11 SII
http://slidepdf.com/reader/full/bradley-testimony-10-19-11-sii 5/26
5
books and buys shares in the underlying stocks of the ETF basket – say lithium
stocks – to create ETF units and offset its risk. When there are more sellers than
buyers, the AP must destroy these same units by selling stocks or offset its risk
by selling similar instruments, like futures and options. On most days, buyers
and sellers nearly match – and the AP can go home and sleep well, hedged
against adverse price moves.
When buyers stampede into ETFs, the AP (now short the ETF to the buyer) must
quickly purchase related instruments or stocks to balance his risk. An old adage
of the trading business says that APs are in the moving business and not the
storage business – they are traders and facilitators, never intending to be the
beneficial owner of a stock. This act creates extremely tight linkages between the
movement of ETFs and common stock prices. And the effect can be much larger
on some stocks than others, with some stocks being the largest holdings in many
different ETFs. For example, Apple Computer is reported to be one of the top 10
holdings in more than 57 ETFs, IBM in 52 ETFs and WalMart in 30 ETFs.4
These same stocks are held in varying weights in dozens of other ETFs.
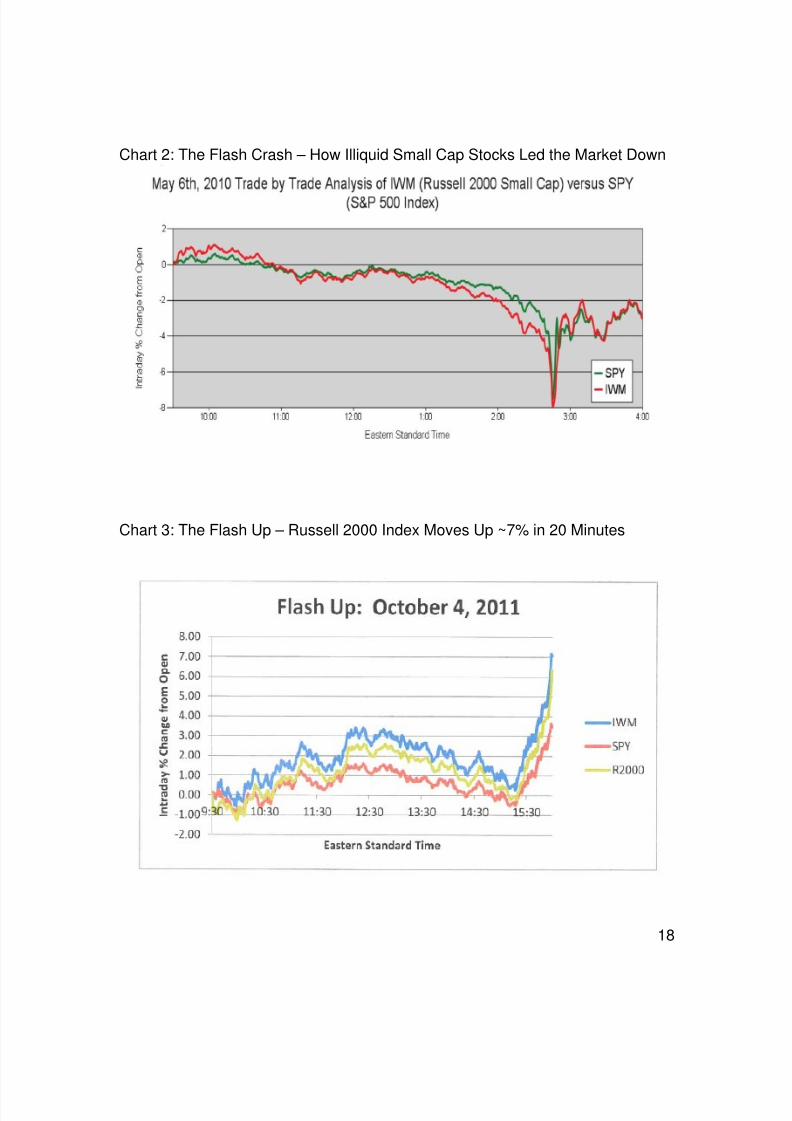
With the preceding mechanics in mind, it will come as no surprise that there can
be enormous one-way moves in ETF-driven stocks in very short periods of time.
This happened en masse in May 2010 during the so-called Flash Crash (chart 2),
and again in October 2011 when stocks experienced a “Flash Up” as the Russell
4 www.etfdb.com

8/3/2019 Bradley Testimony 10-19-11 SII
http://slidepdf.com/reader/full/bradley-testimony-10-19-11-sii 6/26
6
IWM (Russell 2000 small cap ETF) rallied almost 7% in the 20 minutes prior to
the close (chart 3). This happens as buyers of futures and ETFs, generally
triggered by news or technical price patterns, all jump in the water at the same
time. The APs, who by regulatory requirements must provide constant bid and
ask prices for each ETF, then scramble to purchase other closely related
packages of the same securities or the underlying stocks themselves.
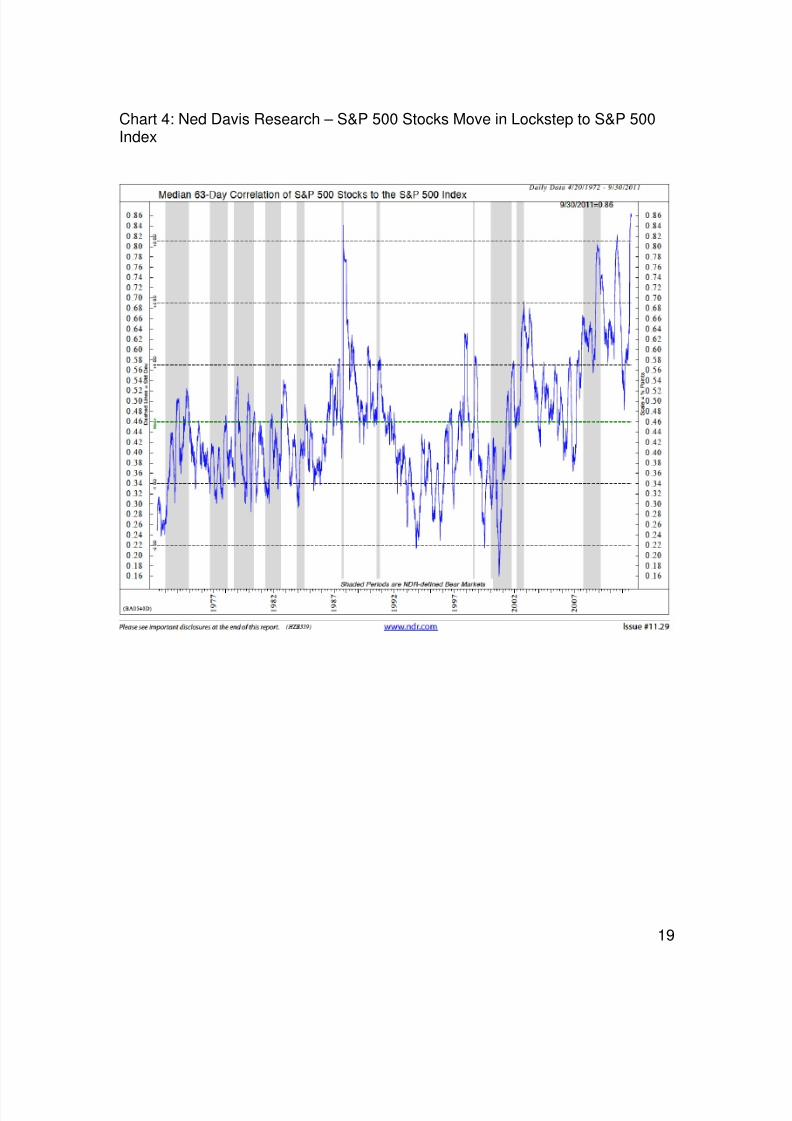
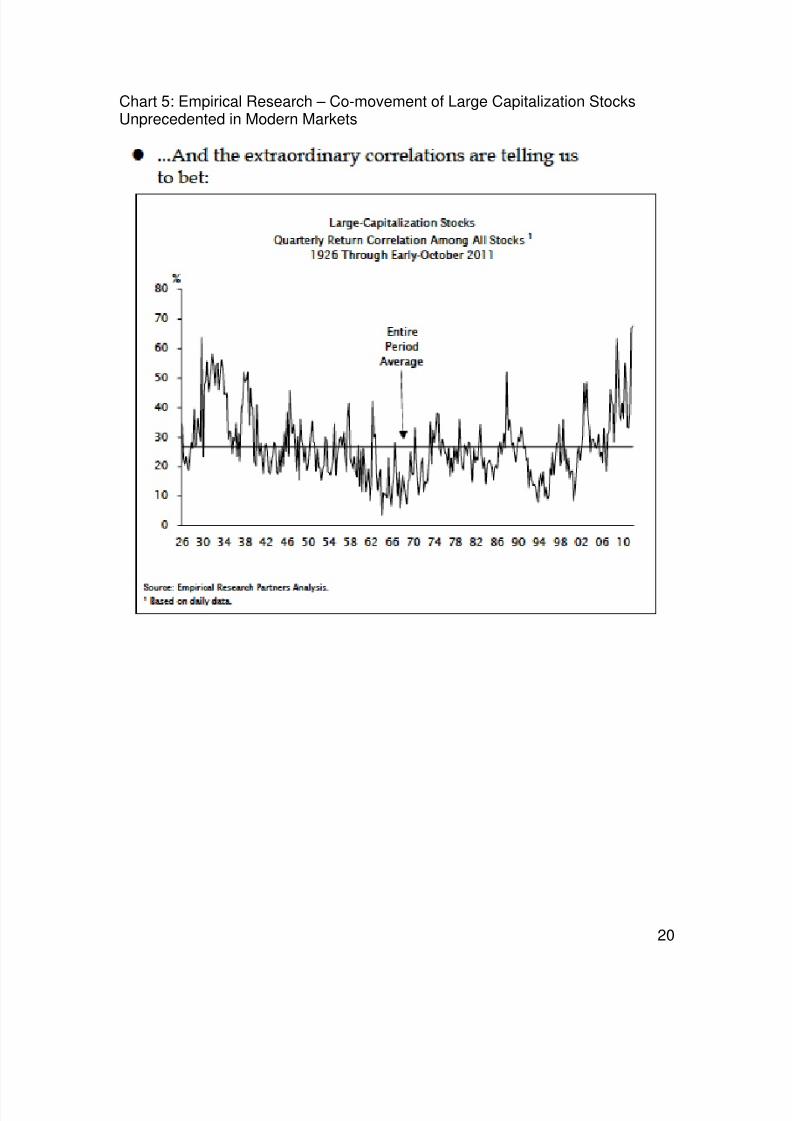
High co-movement of securities is not new, often occurring when markets reflect
crowd panic or euphoria. What is new, however, is how ETFs decrease
diversification benefits, with stocks and sectors worldwide moving together, even
when there is no panic . Stocks move together today more than at any time in
modern market history with recent data indicating that individual common stock
prices that make up the S&P 500 index now move with the index 86% of the time
(chart 5 and chart 6). As has been described, there are now so many products
consisting of the same common stocks that it would be surprising only if this tight
linkage was not evident.
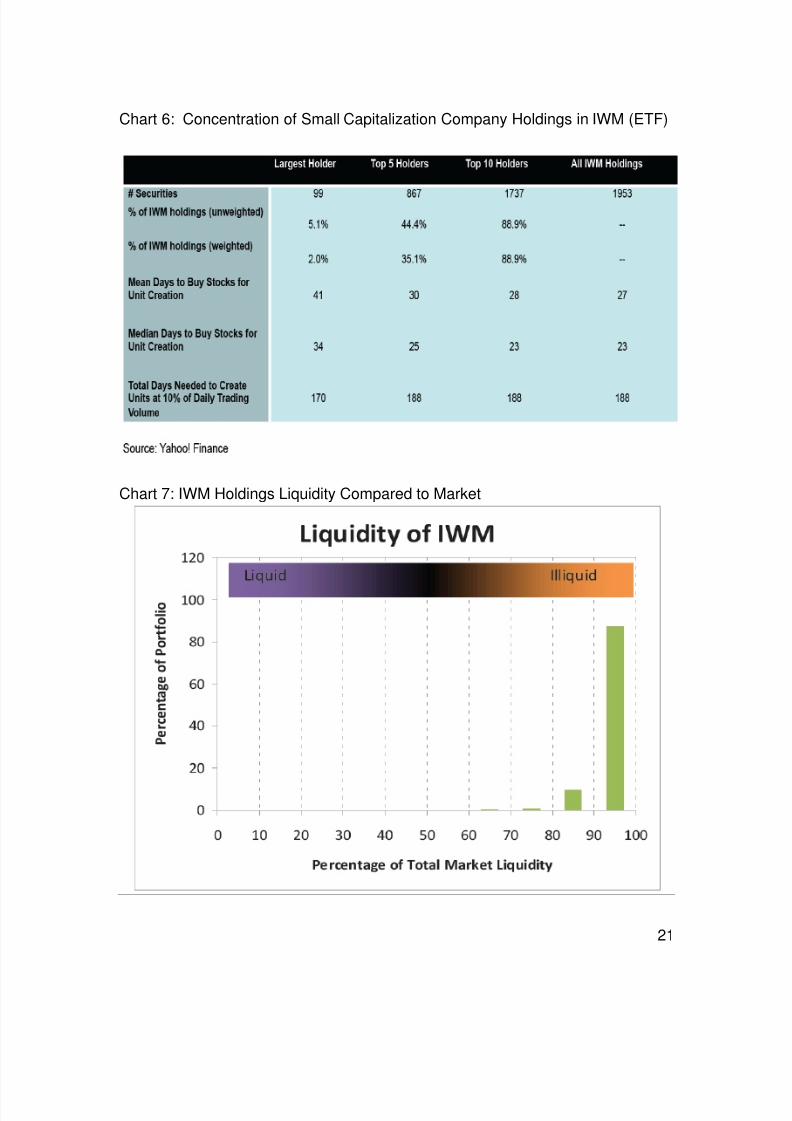
ETFs only work if market makers can purchase component equities in the index
they intend to track. We think ETFs like the small capitalization IWM have
outgrown a market maker’s ability to buy component securities. Indeed, this
particular ETF is reported to be one of the top five stockholders in almost 900
small capitalization stocks held in the IWM (chart 7). As the one of us who is a
former trader and portfolio manager of small capitalization companies (Bradley)
8/3/2019 Bradley Testimony 10-19-11 SII
http://slidepdf.com/reader/full/bradley-testimony-10-19-11-sii 7/26
7
can safely assert, most of these companies trade with poor liquidity and will
move significantly in price when immediate demands for liquidity are made (chart
8). Consequently, market makers can often only match their positions against
futures, options or other ETFs, or they must employ derivatives and synthetic
securities. Perceived easy to trade ETFs cannot ever make hard to trade stocks
easier to buy or sell. Absent easily accessible and liquid hedges for APs,
investors must anticipate that extreme stock price volatility will persist.
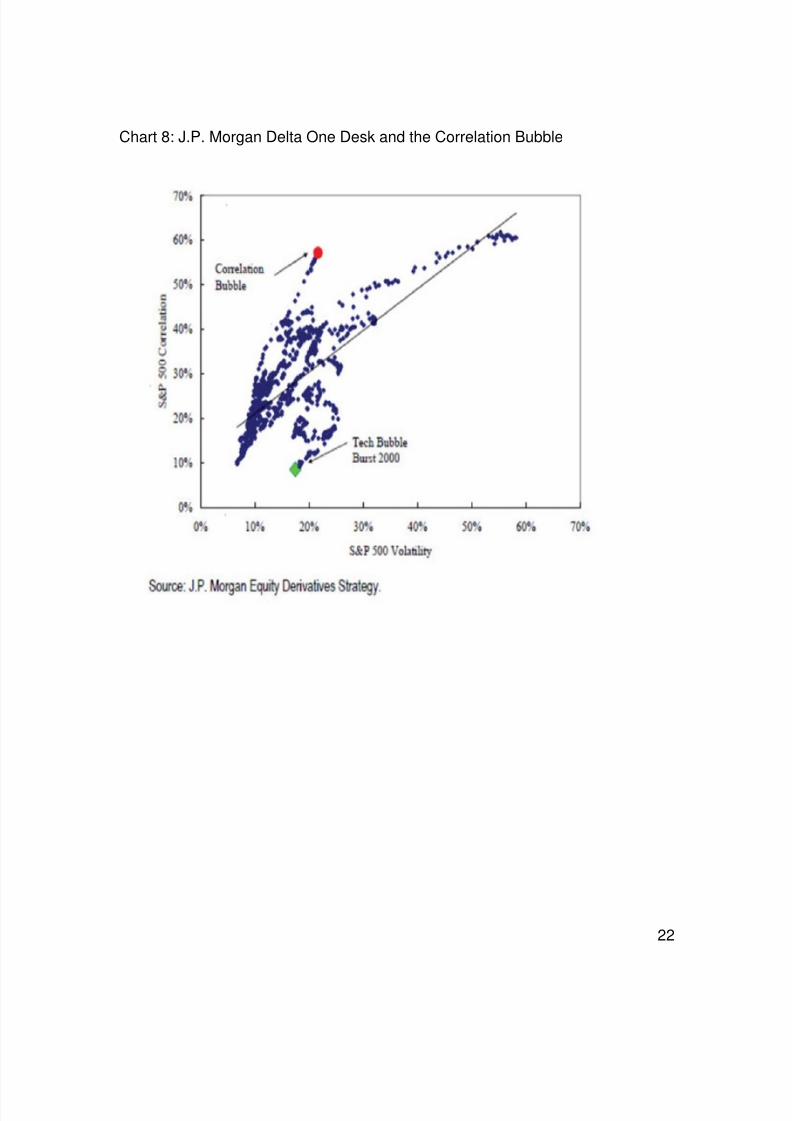
When financial assets move in highly correlated ways, regulators should worry
that capital markets are not doing their principal job – that is, properly allocating
capital between different assets or financial instruments in such a way as to
properly discipline risk and reward success. J.P. Morgan’s Delta One derivatives
team published a chart late in 2010 that displays the historically unprecedented
correlations found in today’s stock trading which they term a “correlation bubble”:
in which stocks move together 60% of the time even when the Volatility Index
(VIX), a measure of panic, remains at relatively subdued levels (chart 8).
These are deep changes, with implications that go far beyond whether IBM and,
say, HP trade together. Richard Bookstaber, current adviser to the Securities
Exchange Commission staff and author of the seminal 2007 book A Demon of
Our Own Design, observes that “(t)he complexity at the heart of many recent
market failures might have been surmountable if it were not combined with
another characteristic we have built into markets, one that is described by the
8/3/2019 Bradley Testimony 10-19-11 SII
http://slidepdf.com/reader/full/bradley-testimony-10-19-11-sii 8/26
8
engineering term tight coupling . Tight coupling means that components of a
process are critically interdependent; they are linked with little room for error or
time for recalibration or adjustment.”
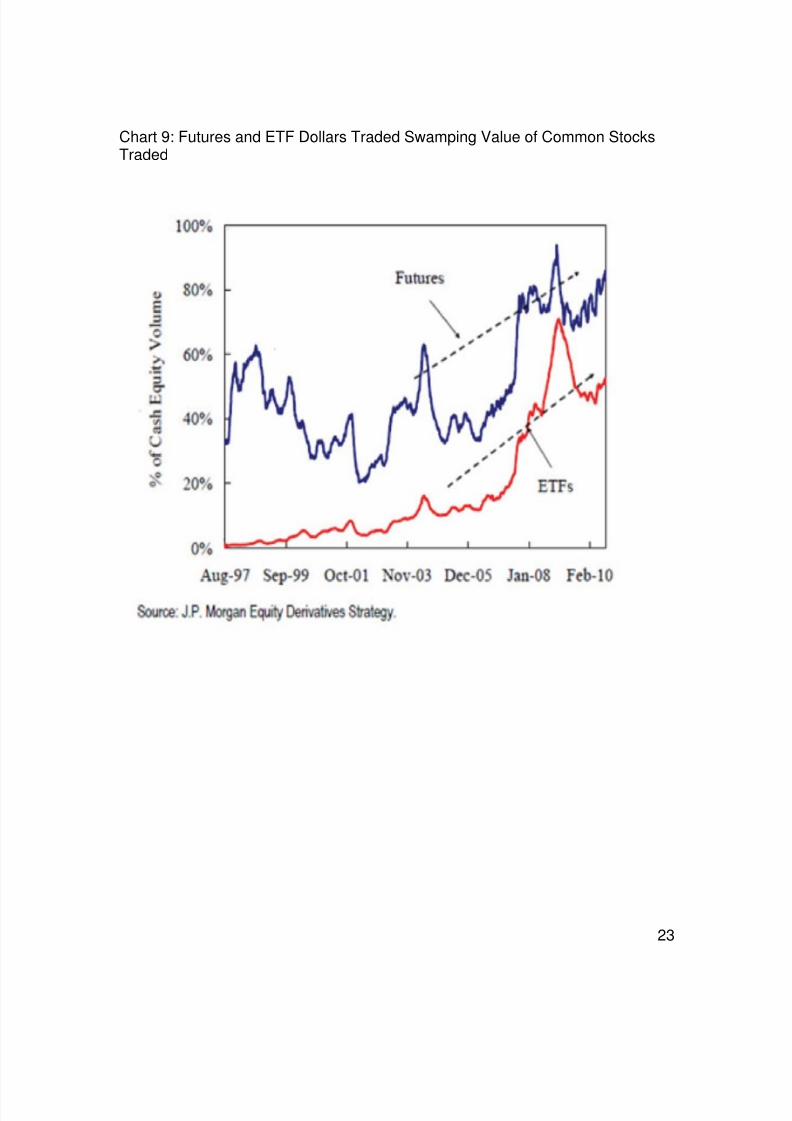
The increasing co-movement of individual stocks reflects the intensity of trading
in instruments whose total value and daily trading volumes eclipse the value of
the instruments they are designed to “track” (chart 9). There is no time for an AP
to call time-out to calmly hedge one-sided trading markets. There is also no
ability to create liquidity where there isn’t any, with liquid ETFs trading around
baskets of illiquid stocks. As assets balloon in ETFs, investors should all worry
about the disconnect between the size of these funds, liquidity and possible
market price disruptions in small company stocks, commodities, bonds, and
pretty much everything else.
Given all these risks, and given investor nervousness, why do these instruments
grow in popularity? Follow the money. Financial advisers earn brokerage
commissions every time they tactically allocate assets in a client’s portfolio by
mixing and matching industry, sector and country ETFs. The same advisers
often promise clients an immediate trading response to unexpected news or
world events. Operating expenses of some ETFs are lower than those of similarly
invested mutual funds. But far more important is that Investors have learned to
love ETFs largely for tax reasons because they are taxed like stocks: investors
only pay capital gains taxes if they sell the ETF for a higher price than the one at

8/3/2019 Bradley Testimony 10-19-11 SII
http://slidepdf.com/reader/full/bradley-testimony-10-19-11-sii 9/26
9
which it was bought. In contrast, mutual fund investors have no control over
whether or not they pay capital gains taxes or recognize losses, since these
decisions are made by the manager of the mutual fund. This explains why many
mutual fund investors were shocked to find out that they owed money on realized
capital gains in 2008 even though the net asset value of these funds dropped
significantly that year during the financial crisis (the managers held on to their
losers, but sold their winners). The pass through nature of taxes to mutual fund
shareholders may be the biggest driver of the rapid expansion of assets under
management in ETFs.
ETF Risks
Innovations in nascent markets with small trading volumes often attract moths to
the flame with promises that often cannot be delivered in times of market stress,
or when the innovation becomes over-large. Markets grow rapidly. They become
more complex. Regulators have been slow to react to this very profitable and fast
growing niche of the financial markets, one that may endanger capital formation
by its very design.
The proliferation in the number and trading volumes of ETFs raise larger
concerns beyond just their potential impact on initial public offerings. With ETFs
making it so easy to effectively trade hundreds or even thousands of stocks in
fractions of a second, it is no surprise that they are account for about half of all
trading in equities markets. ETFs make it so easy and inexpensive to translate
8/3/2019 Bradley Testimony 10-19-11 SII
http://slidepdf.com/reader/full/bradley-testimony-10-19-11-sii 10/26
10
investor highs and lows into the entire market or large portions of it virtually
instantaneously. Thus it comes as no surprise, at least to us, that the markets
themselves have become so volatile, not only day to day, but within each day.
Price volatility is scaring individual investors. It is not an accident that mutual
funds have seen such large net redemptions. These investors are either going
into ETFs, and thus perhaps unknowingly contributing to market volatility in the
process, or out of the markets altogether in cash. In either case, the net result is
not helpful for long run economic growth.
ETFs have other more prosaic risks. They can be used easily in the service of
fraud, as was demonstrated recently when a single UBS “rogue trader” lost more
than $2 billion on bad ETF trades that were not properly hedged in the markets.
Shortly before this event, we, and two experts in securities settlement warned of
potentially even greater potential dangers if regulators remain lax about the
industry’s policing of timely trade settlement. Increasingly, terms like “create to
lend” find their way into the lexicon of the ETF industry. Market makers enjoy
significant and historically arcane exemptions from rules applying to trading and
settlement that extend to all other market participants – we worry these special
privileges may lead to high levels of trading “fails” and greater systemic risks to
8/3/2019 Bradley Testimony 10-19-11 SII
http://slidepdf.com/reader/full/bradley-testimony-10-19-11-sii 11/26
11
the overall market.5 Such trading “fails” in ETFs during times of market stress
could domino into a greater systemic risk issue for our markets (chart 11).
Time has proven that shorter settlement periods and high levels of compliance
are the best antidotes for systemic risks that might involve the failure of a very
large trading party. Congress specifies that buyers of equities deliver cash and
sellers of equities deliver securities three days after a trade. When money arrives
from buyers, but the securities do not, a failure to deliver occurs. This happened
frequently in government securities before large fines were imposed on those
failing to either receive or deliver a trade. Congress and the SEC invested much
time analyzing similar problems in naked short selling of small capitalization
stocks. So why then, in 2010, did two of the biggest ETFs, the SPY (the SPDR
S&P 500 TR ETF) and the IWM (iShares Russell 2000 index ETF) constitute
21% of the failures in the entire stock market (chart 12)? Why would such broad
indexes with supposedly instant arbitrage characteristics fail to deliver in such a
significant manner? We fear that hedge funds and commercial banks may be
relying on lax enforcement of settlement rules to create a cheap funding source
for their trades – as has previously occurred in other parts of the capital markets.
The industry argues that fails in ETFs don’t really matter – that an AP need only
buy more physical securities to create necessary units and relieve the failed
5 See “Canaries in the Coal Mine: How the Rise in Settlement “Fails” CreatesSystemic Risk for Financial Firms and Investors”, March 2011,http://www.kauffman.org/research-and-policy/Canaries-in-the-Coal-Mine.aspx
8/3/2019 Bradley Testimony 10-19-11 SII
http://slidepdf.com/reader/full/bradley-testimony-10-19-11-sii 12/26
12
trade settlement. We believe that to be a false narrative. A cursory analysis of
trading volumes in IWM component securities indicates it would take more than
180 trading days, or more than six months, trading at 10% of each stock’s
volume every day, to offset reported short interest in that ETF. Attempts to
purchase these mostly hard to trade common stocks, held in very large
concentrations already by ETFs, will create sharp price movements up and
down. The math, given the current size of short positions, the history of high
settlement failure rates in ETFs, and the illiquidity of many component stocks in
the IWM, just doesn’t work.
What Should Be Done?
We believe that, as Richard Bookstaber has warned, it is time to recalibrate the
regulation of our capital markets. That starts with an emphasis on what’s good
for companies in our public markets rather than what’s good for trading volumes
in the nation’s futures markets, options markets and stock exchanges.
First, it is important for the SEC to begin to recognize some fundamental
differences in the risks posed to the market by price volatility in stocks and ETFs.
Take, for example, the circuit breakers pioneered by the NYSE Euronext before
the Flash Crash that created a brief five-minute trading halt for individual stocks
that move more than 10% in price during the preceding five minutes. While this
was a surprise to competing exchanges that ignored the exchange’s trading halt

8/3/2019 Bradley Testimony 10-19-11 SII
http://slidepdf.com/reader/full/bradley-testimony-10-19-11-sii 13/26
13
and were forced to cancel large numbers of “bad trades,” the NYSE Euronext
canceled no trades as a result of this market anomaly.
Believing that ETFs and stocks are equivalent, the SEC recently applied the
same circuit breaker logic to ETFs. While this approach may seem logical, it
ignores the volatility-creating effect of ETFs themselves, which to us, demands
even tighter constraints on ETF price movement than on common stocks. The
essential characteristic of portfolio construction is to achieve a diversification
benefit; that is, a single stock exhibits much higher volatility than does a portfolio
of stocks.
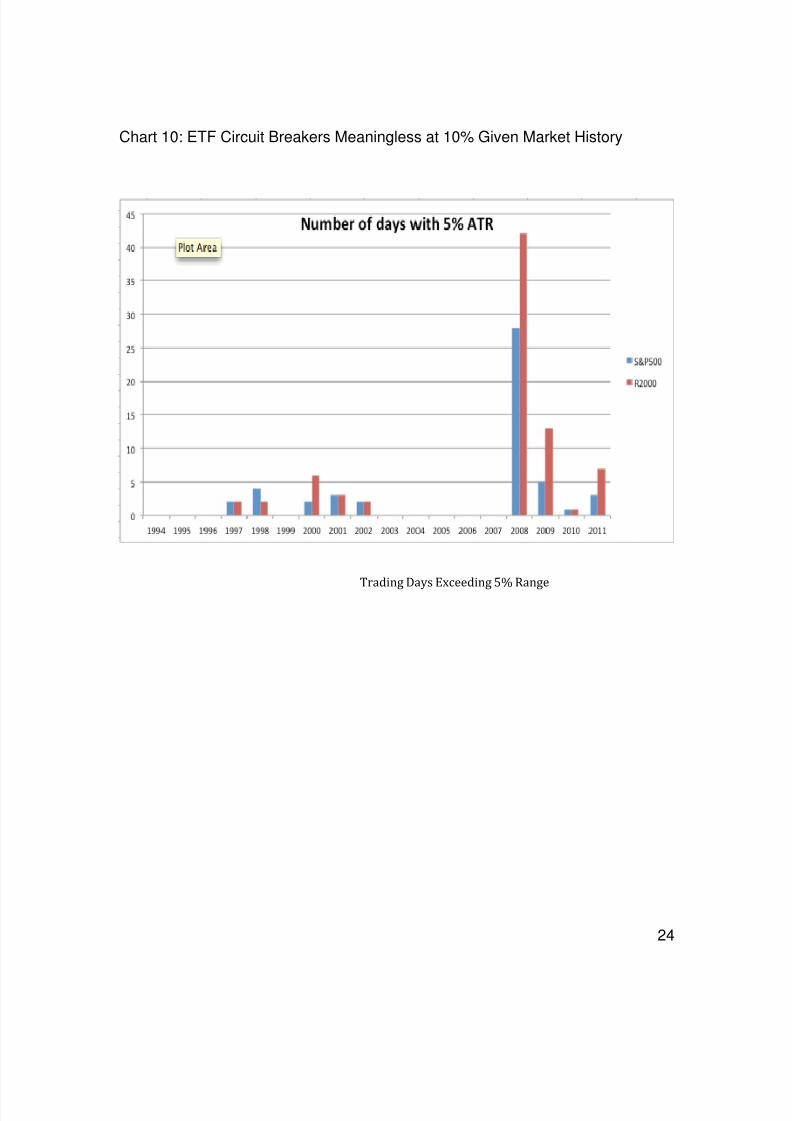
Said another way, a 10% movement of a broad based index would necessarily
imply far higher volatility in components of that index. Consequently, we think
the SEC should ask Self-Regulatory Organizations (SROs) to require a circuit
breaker time out whenever an ETF moves more than 5% in the preceding five
minutes. During more than 17 years of trading history, 5% moves over an entire
trading session were rare; so a 5% constraint on short term price changes should
not interfere with day trading interests too much and will keep ETFs in certain
indexes or industries from overly affecting the price behavior of component
stocks on days like May 6, 2010 (chart 10).
Second, we are concerned that after years of indifference to the increasing co-
movement between indexes and common stocks regulators will now put still
8/3/2019 Bradley Testimony 10-19-11 SII
http://slidepdf.com/reader/full/bradley-testimony-10-19-11-sii 14/26
14
worse “fixes” in place. Comment is being solicited on the SEC’s desire to restrict
trading beyond fixed, arbitrary highs and lows each trading session – what are
called limit up, limit down constraints on price movement for stocks and for
indexes. These types of trading constraints have been in place for some time at
the nation’s commodity exchanges where contracts trade on margin and such
hard limits have been used to collect additional margin on outstanding bargains.
At worst, while infrequent, these limits historically “trapped” traders on the wrong
side of a move when markets move quickly and remain frozen (for example,
consider traders who sold short hard winter wheat just prior to reports that the
Chernobyl nuclear reactor melted down). At best, such limit up, limit down rules
serve as enormous magnets to day traders. As markets approach daily price
limits that may suspend trading for either a brief time or for the day, customers
quickly cancel resting orders that stand in the way of the big waves, awaiting a
more opportune time to take the opposite side of the trade. Often commodities
that close “locked limit up” will “gap” open to higher levels on the ensuing market
opening before enticing sellers back into the market.
Third, the SEC should reconsider its past policy of granting blanket exemptions
to ETFs from its rules governing mutual funds. We are not advocating that ETFs
be treated identically to mutual funds, because clearly the two instruments are
different. But a new regulatory regime is called for, one that takes account of and
ideally attempts to mitigate the adverse impacts and risks of ETFs we have
8/3/2019 Bradley Testimony 10-19-11 SII
http://slidepdf.com/reader/full/bradley-testimony-10-19-11-sii 15/26
15
identified. At the very least, the SEC should begin a broad inquiry into the nature
and magnitude of these impacts and risks with a view toward improving its own
and the public’s understanding of the market-wide impacts of these financial
instruments.
In particular, we question whether market making exemptions are really
necessary in an age of high frequency trading and instantaneous access to
market liquidity. Questions should be asked about ETF creation and destruction
practices, about securities lending operations, and the new ownership of ETF
sponsors by custody banks engaged in large lending operations. And regulators
should investigate the theoretical “reason” that explains away large outstanding
short ETF positions as easily “covered” in the cash markets, which appears
impossible from a cursory examination of the small capitalization IWM ETF and a
simple mathematical analysis of stock holdings and liquidity.
Fourth, in the interim, we suggest significant improvements into the transparency
of ETF construction and trading including the consideration of the following
prescriptions:
Require ETF sponsors to explicitly describe unit creation and destruction
processes in their prospectuses and summary information, including
provisions to align short interest in an ETF with the liquidity of ETF
constituents.
8/3/2019 Bradley Testimony 10-19-11 SII
http://slidepdf.com/reader/full/bradley-testimony-10-19-11-sii 16/26
16
Require custodian banks to report each week fails-to-receive and fails-to-
deliver of equity and ETF securities in an analogous fashion to the
requirements imposed by the Federal Reserve on primary dealers of
U.S. debt securities.
Eliminate market maker exemptions and impose significant penalties or
fees for all transaction fails.
Establish broader fails reporting, including all transaction activity for
systemically important financial institutions, especially primary custody
banks, including:
o Aggregate dollar value of securities lending pools by asset class on
a monthly basis so that investors and regulators might anticipate
shifts of the security supply and its implications for market stability
(as customers often cease lending at the beginning of a serious
liquidity crisis);
o Fails-to-deliver (receive) securities and stratify by customer
segment;
o Fails data according to custody bank business lines, e.g. trading,
securities lending, financing (repo services), etc.
Thank you Mr. Chairman, and members of the committee, for allowing me
to present our views. I look forward to your questions.
8/3/2019 Bradley Testimony 10-19-11 SII
http://slidepdf.com/reader/full/bradley-testimony-10-19-11-sii 17/26
17
Appendix
Chart 1: U.S. Exchange Listed Companies and U.S. Exchange Listed ETFGrowth
8/3/2019 Bradley Testimony 10-19-11 SII
http://slidepdf.com/reader/full/bradley-testimony-10-19-11-sii 18/26
18
Chart 2: The Flash Crash – How Illiquid Small Cap Stocks Led the Market Down
Chart 3: The Flash Up – Russell 2000 Index Moves Up ~7% in 20 Minutes
8/3/2019 Bradley Testimony 10-19-11 SII
http://slidepdf.com/reader/full/bradley-testimony-10-19-11-sii 19/26
19
Chart 4: Ned Davis Research – S&P 500 Stocks Move in Lockstep to S&P 500Index
8/3/2019 Bradley Testimony 10-19-11 SII
http://slidepdf.com/reader/full/bradley-testimony-10-19-11-sii 20/26
20
Chart 5: Empirical Research – Co-movement of Large Capitalization StocksUnprecedented in Modern Markets
8/3/2019 Bradley Testimony 10-19-11 SII
http://slidepdf.com/reader/full/bradley-testimony-10-19-11-sii 21/26
21
Chart 6: Concentration of Small Capitalization Company Holdings in IWM (ETF)
Chart 7: IWM Holdings Liquidity Compared to Market
8/3/2019 Bradley Testimony 10-19-11 SII
http://slidepdf.com/reader/full/bradley-testimony-10-19-11-sii 22/26
22
Chart 8: J.P. Morgan Delta One Desk and the Correlation Bubble
8/3/2019 Bradley Testimony 10-19-11 SII
http://slidepdf.com/reader/full/bradley-testimony-10-19-11-sii 23/26
23
Chart 9: Futures and ETF Dollars Traded Swamping Value of Common StocksTraded
8/3/2019 Bradley Testimony 10-19-11 SII
http://slidepdf.com/reader/full/bradley-testimony-10-19-11-sii 24/26
24
Chart 10: ETF Circuit Breakers Meaningless at 10% Given Market History
Trading Days Exceeding 5% Range

8/3/2019 Bradley Testimony 10-19-11 SII
http://slidepdf.com/reader/full/bradley-testimony-10-19-11-sii 25/26
25
Chart 11: Persistent and Climbing ETF Fails to Deliver as Percent ofETF Dollars Traded

8/3/2019 Bradley Testimony 10-19-11 SII
http://slidepdf.com/reader/full/bradley-testimony-10-19-11-sii 26/26
26
Chart 12: U.S. Exchange-Traded Funds – Top 10 ETF Fails (Full Year 2010)
Symbol Description Value of FailsReported
# ofDays
Failing
%Value
of ETFFails
% Value ofAll Fails
SPYSPDR S&P 500ETF Tr $74,770,649,095
248 27.4% 15.3%
IWM
iShares Russell2000 Index $27,542,976,085
249 10.1% 5.6%
QQQQ
PowersharesQQQ $9,726,205,729
247 3.6% 2.0%
FAZDirexion DailyFinancial Bear $8,917,534,272
245 3.3% 1.8%
FAS
Direxion Daily
Financial Bull $8,615,461,265
245 3.2% 1.8%XLF Financial SPDR
$6,316,149,807
240 2.3% 1.3%XRT SPDR S&P
Retail $5,645,840,903
240 2.1% 1.2%XLE Energy Sector
SPDR $4,491,801,629
241 1.4% .8%IYR iShares DJ US
Real Estate $3,805,037,250
240 1.4% .8%XLI Industrial Sector
SPDR $3,762,812,985
233 1.4% .8%
Top 10 ETFsFails Value $153,594,469,019
31.4%
All ETF FailsValue $272,767,713,480
55.8%
All SecuritiesFails Value $488,297,395,379
Average Year = 250 Trading DaysSource: Fred Sommers Basis Point Group