Embed Size (px)
Citation preview

Second quarter 2015 Interim Financial Report
Press Release – Brussels, 06/08/2015 – 17:45pm (CET) Regulated information
www.bpost.be/ir
Page 1 of 29
bpost: second quarter 2015 results Second quarter 2015 highlights
• Operating income (revenues) at EUR 597.6m, down 2.6%, due to elections in 2014, lower
SGEI compensation, management’s decision to curtail some International Mail activities but also due to a bad performance in Advertising Mail. However, very strong parcels growth.
• Underlying Domestic Mail volume decline at -6.1% (-5.1% for 2Q14) due to Advertising Mail.
• Domestic Parcels volumes up 12.6% (+4.7% for 2Q14) driven by strong e-commerce growth and continued positive trend in C2C. Negative price/mix effect of -3% but to a lesser extent than in the first quarter of 2014.
• International Parcels up EUR 9.3m, driven by organic growth from US, positive FX contribution and good milk powder volumes to China.
• Additional Sources of Revenues mainly impacted by the curtailment of the very low margin International Mail business, while overall profitability improved.
• Costs (excluding one-offs and transport) down EUR 14.0m, perfectly under control with strong productivity improvement (average FTE reduction of 829).
• EBITDA down EUR 3.8m, of which elections EUR -4.6m and SGEI impact EUR -4.2m, while our operating model continues to work.
• Net profit of bpost SA/NV under BGAAP only down EUR 0.4m at EUR 83.8m.
CEO quote
Koen Van Gerven, CEO, commented: “Through excellent growth in parcels and better than planned cost savings, we managed to minimize the impact on our profitability of the reduction in compensation received from the Belgian State for SGEI and a bad performance of advertising mail. These results again prove that our solid operating model continues to deliver. We are on track to realize our outlook for this year. I am also very glad to welcome Koen Beeckmans as new CFO. Philippe Dubois will also join the Group Executive Management as Mail Services Operations Director in replacement of Kurt Pierloot who becomes responsible for our fast growing Parcels division combined with his current responsibility for the international activities.” Outlook
• We expect mail volumes to remain under substantial pressure. As a consequence we plan
for an underlying Domestic Mail volume decline of around -6%. • The compensation for the SGEI (management contract) will be EUR 16.5m lower than in
2014 as the government has decided to reduce the compensation above and beyond the already lower contractual cap.
• We now expect high single digit growth in Domestic Parcels in spite of the intensification of competition. We also expect continued growth in the US and Asia parcels segment.
• Productivity improvements are on track and will deliver as expected at the low end of our 800 to 1,200 FTE/year range.
• In spite of the lower Domestic Mail volume guidance, we will maintain recurring EBIT(DA) at the high level achieved in 2014 thanks to the partial effects of the Alpha plan and a continued focus on costs. Alpha restructuring cost should be recorded in the third quarter of 2015.
• We confirm our ambition to achieve the same level of dividend payment. • Cash generation should follow normal seasonality and net capex is expected at around
EUR 90m. Working capital evolution will be negatively affected by the favorable phasing on terminal dues payment in 2014 and tax payments relating to 2013.

Second quarter 2015 Interim Financial Report
Press Release – Brussels, 06/08/2015 – 17:45pm (CET) Regulated information
www.bpost.be/ir
Page 2 of 29
Key figures
2nd quarter (in million EUR)
Reported/Normalized
2014 2015 % change
Total operating income (revenues) 613.5 597.6 -2.6%
Operating expenses 449.9 437.9 -2.7%
EBITDA 163.6 159.8 -2.3%
Margin (%) 26.7% 26.7% EBIT 142.3 138.3 -2.9%
Margin (%) 23.2% 23.1% Profit before tax 135.5 139.2 2.8%
Income tax expense 42.3 48.1 Net profit 93.2 91.2 -2.1%
FCF (4.0) (21.3) -
bpost S.A./N.V. net profit (BGAAP) 84.2 83.8 -0.4%
Net Debt/(Net cash), at 30 June (684.3) (720.3) 5.3%
Year-to-date (in million EUR) Reported/Normalized
2014 2015 % change
Total operating income (revenues) 1,240.2 1,214.2 -2.1%
Operating expenses 903.6 881.7 -2.4%
EBITDA 336.6 332.5 -1.2%
Margin (%) 27.1% 27.4% EBIT 294.4 289.8 -1.5%
Margin (%) 23.7% 23.9% Profit before tax 289.0 288.2 -0.3%
Income tax expense 97.0 100.5 Net profit 192.1 187.7 -2.3%
FCF 363.4(*) 276.8 -23.9%
bpost S.A./N.V. net profit (BGAAP) 171.5 171.1 -0.2%
Net Debt/(Net cash), at 30 June (684.3) (720.3) 5.3% (*)In 2014 normalized FCF amounted to EUR 363.6m
For more information: Fred Lens T. +32 495 47 11 52 (media only) Saskia Dheedene T. +32 2 276 7643 (IR only) www.bpost.be/ir [email protected]

Second quarter 2015 Interim Financial Report
Press Release – Brussels, 06/08/2015 – 17:45pm (CET) Regulated information
www.bpost.be/ir
Page 3 of 29
Second quarter 2015 - Income Statement
Total operating income decreased by EUR 15.9m (-2.6%) to EUR 597.6m, partially due to the non-recurrence of the 2014 elections (EUR -4.6m), the lower SGEI compensation (EUR -4.2m), management’s decision to curtail International Mail (EUR -6.2m), but also due to a bad performance in Advertising Mail (EUR -5.9m, excluding elections). However, we recorded very strong growth in Parcels (EUR +12.4m). Despite the negative impact of the non-recurrence of the 2014 elections and the reduced SGEI compensation (together EUR -8.8m), EBITDA and EBIT were only down EUR 3.8m and EUR 4.1m respectively, thanks to cost savings of EUR 12.0m. EBITDA and EBIT margins were in line with last year. Net financial result decreased by EUR 5.2m due to last year’s increase of non-cash financial charges related to IAS 19 employee benefits as a result of the decrease in the discount rates. Income Tax expense increased compared to last year, with the effective tax rate standing at 34.5%. IFRS group net profit stood at EUR 91.2m. Belgian GAAP net profit of the parent company amounted to EUR 83.8m, only down by EUR 0.4m.
+12.0
+12.4
EBITDA 2Q15
+159.8
CostsCorporate
+0.6
Additional sources of revenues
-6.2
ParcelsDomestic Mail
-18.5
-13.9
-4.6
SGEIcompensation
-4.2
EBITDA 2Q14
+163.6
Total operating income (revenues)
€ +0.3m / +0.2%
€ million
2014 elections
Second quarter 2015 Interim Financial Report
Press Release – Brussels, 06/08/2015 – 17:45pm (CET) Regulated information
www.bpost.be/ir
Page 4 of 29
First half of 2015 - Income Statement
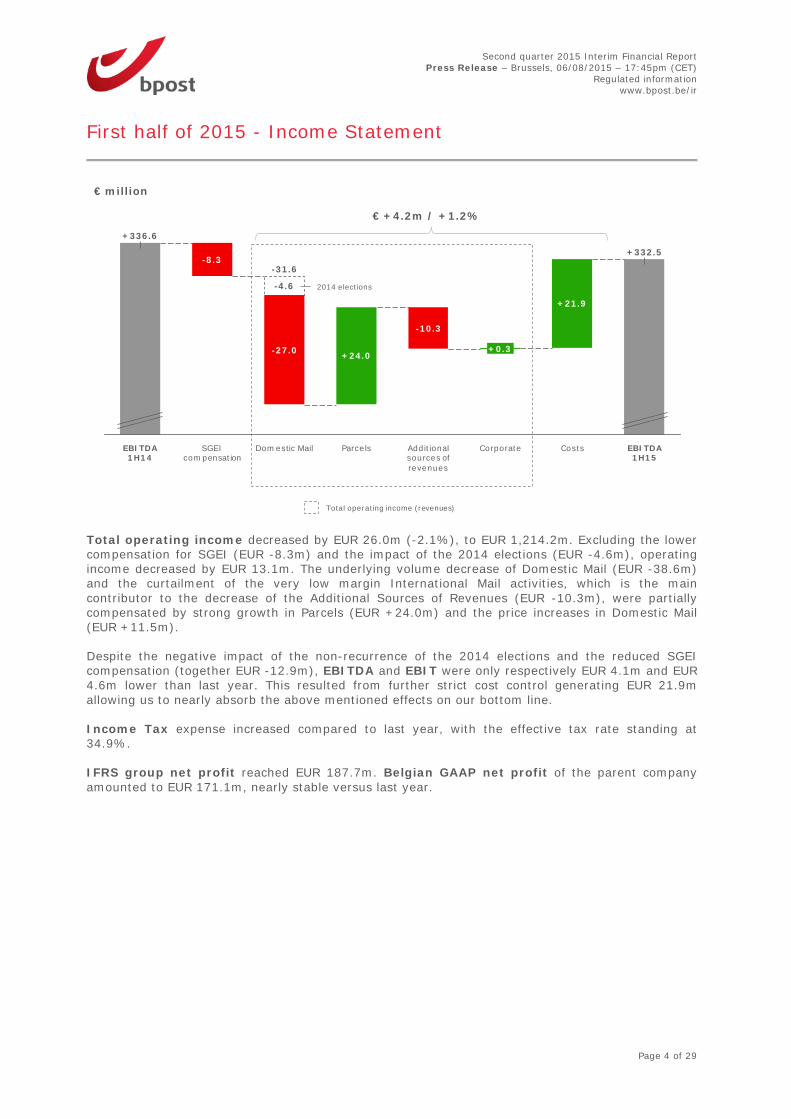
Total operating income decreased by EUR 26.0m (-2.1%), to EUR 1,214.2m. Excluding the lower compensation for SGEI (EUR -8.3m) and the impact of the 2014 elections (EUR -4.6m), operating income decreased by EUR 13.1m. The underlying volume decrease of Domestic Mail (EUR -38.6m) and the curtailment of the very low margin International Mail activities, which is the main contributor to the decrease of the Additional Sources of Revenues (EUR -10.3m), were partially compensated by strong growth in Parcels (EUR +24.0m) and the price increases in Domestic Mail (EUR +11.5m). Despite the negative impact of the non-recurrence of the 2014 elections and the reduced SGEI compensation (together EUR -12.9m), EBITDA and EBIT were only respectively EUR 4.1m and EUR 4.6m lower than last year. This resulted from further strict cost control generating EUR 21.9m allowing us to nearly absorb the above mentioned effects on our bottom line. Income Tax expense increased compared to last year, with the effective tax rate standing at 34.9%. IFRS group net profit reached EUR 187.7m. Belgian GAAP net profit of the parent company amounted to EUR 171.1m, nearly stable versus last year.
+21.9
+24.0
EBITDA 1H15
+332.5
CostsCorporate
+0.3
Additional sources of revenues
-10.3
ParcelsDomestic Mail
-31.6
-27.0
-4.6
SGEIcompensation
-8.3
EBITDA 1H14
+336.6
Total operating income (revenues)
€ +4.2m / +1.2%
€ million
2014 elections

Second quarter 2015 Interim Financial Report
Press Release – Brussels, 06/08/2015 – 17:45pm (CET) Regulated information
www.bpost.be/ir
Page 5 of 29
Total operating income: group overview
Second quarter of 2015 Following a correction of the allocation of cash sales (stamps and franking machines) to various product portfolios as of January 1, 2015 some revenues are shifting from Domestic Parcels to Transactional Mail. Furthermore, some intercompany eliminations mainly relating to international activities previously reported in Other revenues are now being reported under their corresponding product portfolios. Taking into account these changes, the 2014 figures at the level of the product portfolios have been made comparable to reflect these changes. The comparable figures are shown under the heading “comparable”. The variances mentioned hereafter compare the 2015 figures with the 2014 comparable figures.
2Q14 Reclassi-
fications 2Q14
Comparable SGEI Organic 2Q15 % Org underlying vol. % ∆
In million EUR
Domestic Mail 385.1 0.5 385.5 (3.0) (18.5) 364.0 -4.8% -6.1%
Transactional Mail 235.8 0.6 236.5 (7.6) 228.8 -3.2% -5.3%
Advertising Mail 71.4 (0.2) 71.2 (9.8) 61.4 -13.7% -9.9%
Press 77.9 0.0 77.9 (3.0) (1.1) 73.8 -1.4% -4.0%
Parcels 70.8 (1.9) 68.9 0.0 12.4 81.2 17.9%
Domestic Parcels 37.0 (0.9) 36.1 3.3 39.4 9.3% +12.6%
International Parcels 30.8 (0.7) 30.0 9.3 39.4 31.0%
Special logistics 3.1 (0.3) 2.8 (0.3) 2.5 -11.6% Additional Sources of Revenues 151.3 1.5 152.8 (1.1) (6.2) 145.4 -4.1%
International Mail 49.6 (1.2) 48.4 (6.4) 42.1 -13.1% Value Added Services 24.1 (0.9) 23.2 0.2 23.4 0.9%
Banking and Financial products 52.0 (0.0) 51.9 (0.1) (0.1) 51.7 -0.2%
Others 25.6 3.6 29.2 (1.0) 0.0 28.2 0.1%
Corporate 6.3 0.0 6.3 0.6 6.9 10.2%
TOTAL 613.5 0.0 613.5 (4.2) (11.7) 597.6 -1.9%
Revenues from Domestic Mail decreased by EUR 18.5m (-4.8%) to EUR 364.0m. Reported volume decline came in at -7.6% while underlying volume decline (i.e. excluding the requalification of Advertising to Administrative Mail and the impact of the 2014 elections) reached -6.1% (vs. -5.3% for the first quarter of 2015). Reported volume decline in Transactional Mail stood at -5.8% while the underlying figure remained stable at -5.3%, as no worsening trends in e-substitution were observed during the quarter. Advertising Mail recorded a bad volume performance at -15.4% on a reported and -9.9% on an underlying basis (excluding requalification and 2014 elections), which is partially due to a sluggish advertising market. Press volumes declined (-4.0%) slightly more than previous quarters mostly due to the tough environment for periodicals. Excluding the impact of the elections in 2014 (EUR -4.6m), total mail volume declines impacted revenues by EUR 20.7m, partially compensated by the net improvement in price/mix in line with the announced policy, amounting to EUR 6.8m. Parcels recorded an excellent performance, with organic growth at EUR 12.4m. Volume growth in Domestic Parcels accelerated to 12.6% versus the already high 10.2% in the first quarter of 2015 and 7.0% for full year 2014. This increase was due to the excellent growth of e-tailing customers

Second quarter 2015 Interim Financial Report
Press Release – Brussels, 06/08/2015 – 17:45pm (CET) Regulated information
www.bpost.be/ir
Page 6 of 29
and the continued recovery of the C2C parcels thanks to the new product offering. Revenue evolution was impacted by a negative price/mix effect of -3.0%, but to a lesser extent than in the first quarter of 2015. This is explained by the faster growth of large e-tailers with high volumes and lower prices than the smaller customers. International Parcels grew by EUR 9.3m, mainly driven by the increased traffic on lanes from the US and China (EUR +9.4m, helped by a favorable exchange rate impact of EUR +5.5m) combined with good milk powder volumes to China (EUR +1.2m). Additional Sources of Revenues performed in line with last year apart from International Mail, leading to an organic decrease by EUR 6.2m to reach EUR 145.4m. International Mail sales were impacted by the curtailment of very low margin activities (EUR -6.2m). Revenues for Value Added Services (EUR +0.2m) increased while Banking and Financial Services revenues decreased as the lower commission related to AUM growth in bpost bank is almost compensated by growth of other financial services such as prepaid cards and Western Union sales. Revenues from Corporate increased slightly by EUR 0.6m to EUR 6.9m. First half of 2015
YTD14 Reclassi-
fications YTD14
Comparable SGEI Organic YTD15 % Org underlying vol. % ∆
In million EUR
Domestic Mail 771.9 1.1 773.0 (6.1) (31.6) 735.3 -4.1% -5.7%
Transactional Mail 474.7 1.5 476.2 (14.8) 461.4 -3.1% -5.3%
Advertising Mail 141.6 (0.4) 141.2 (15.1) 126.1 -10.7% -7.9%
Press 155.6 0.0 155.6 (6.1) (1.8) 147.7 -1.2% -3.5%
Parcels 144.2 (3.7) 140.5 0.0 24.0 164.5 17.1%
Domestic Parcels 75.2 (1.9) 73.3 5.6 78.9 7.6% +11.4% International Parcels 62.2 (1.2) 61.0 19.6 80.6 32.1%
Special logistics 6.8 (0.6) 6.2 (1.2) 5.0 -18.8% Additional Sources of Revenues
306.0 2.6 308.7 (2.3) (10.3) 296.1 -3.3%
International Mail 99.9 (2.1) 97.8 (10.5) 87.3 -10.7% Value Added Services 48.7 (1.8) 47.0 0.8 47.7 1.6%
Banking and Financial products 104.4 (0.1) 104.3 (0.2) (0.6) 103.4 -0.6%
Others 53.1 6.6 59.6 (2.0) (0.0) 57.6 -0.0%
Corporate 18.1 0.0 18.1 0.3 18.3 1.5%
TOTAL 1,240.2 0.0 1,240.2 (8.3) (17.7) 1,214.2 -1.4%
Domestic Mail revenues amounted to EUR 735.3m in the first half of 2015, a EUR 31.6m organic decline versus last year (including impact elections for EUR -4.6m), due to a reported volume evolution of -6.5% and an underlying volume evolution of -5.7% (i.e. excluding the requalification of Advertising to Administrative Mail and the impact of the 2014 elections), partly compensated by a price/mix improvement. Parcels revenues attained EUR 164.5m (EUR +24.0m organic growth), driven by volume growth of +11.4% in Domestic Parcels and by strong development in International Parcels, helped by a favorable exchange rate impact (EUR +11.1m). Additional Sources of Revenues amounted to EUR 296.1m, down EUR 10.3m, mainly as a result of the curtailment of the very low margin International Mail activities.

Second quarter 2015 Interim Financial Report
Press Release – Brussels, 06/08/2015 – 17:45pm (CET) Regulated information
www.bpost.be/ir
Page 7 of 29
Operating expenses
Second quarter of 2015
2Q14 2Q15 % Org
In million EUR
Payroll & interim costs 303.6 282.8 -6.9%
FTE 25,259 24,430 -829
SG&A (excl. interim and transport costs) 88.7 90.3 1.8%
Transport costs 48.4 50.3 4.1%
Other costs 9.2 14.4 57.0%
TOTAL OPERATING EXPENSES 449.9 437.9 -2.7%
Total operating expenses reached EUR 437.9m and decreased by 2.7%. Excluding one-offs and transport costs, operating expenses were down EUR 14.0m on an underlying basis. Payroll and interims costs went down by EUR 20.8m but were impacted by a one-off positive settlement of social charges (EUR 5.7m). Excluding this item, payroll and interim costs decreased by EUR 15.1m mainly driven by productivity improvements in our network and the partial effects of Alpha which together led to an average year-on-year reduction by 829 FTE generating savings of EUR 10.0m. The recruitment of auxiliary postmen created a positive mix effect of EUR 1.7m. Additionally, a lower number of managers due to the Alpha project and the related hiring freeze created a positive mix effect of EUR 1.5m. The price effect was positive this quarter (EUR 0.8m) due to a phasing effect in the second quarter last year in which two quarters of CLA impact were booked. This was partially offset by normal salary and merit increases. Finally, a favorable evolution of the holiday arrears (down EUR 1.3m) was partially offset by a slight increase of the costs of employee benefits (up EUR 0.8m). SG&A excluding interim and transport costs slightly increased by 1.8%, or EUR 1.6m in the second quarter of 2015. A limited increase at several cost lines was noted. Transport costs amounted to EUR 50.3m, EUR 2.0m higher compared to previous year (or 4.1%), negatively impacted by exchange rates (EUR 6.1m), lower favorable settlements of previous year’s terminal dues (EUR 2.2m) and the growth in International Parcels. These effects were partially compensated by the curtailment of International Mail wholesales activities. Other costs increased by EUR 5.2m. Excluding 2 one-offs, i.e. the less favorable evolution of provisions (EUR 3.7m) and the impact of the Gout earn-out (EUR 2.0m), the improvement amounted to EUR 0.5m.
Second quarter 2015 Interim Financial Report
Press Release – Brussels, 06/08/2015 – 17:45pm (CET) Regulated information
www.bpost.be/ir
Page 8 of 29
First half of 2015
YTD14 YTD15 % Org
In million EUR
Payroll & interim costs 610.3 577.3 -5.4%
FTE 25,201 24,446 -755
SG&A (excl. interim and transport costs) 178.4 176.9 -0.8%
Transport costs 99.0 103.0 4.0%
Other costs 15.9 24.6 54.6%
TOTAL OPERATING EXPENSES 903.6 881.7 -2.4%
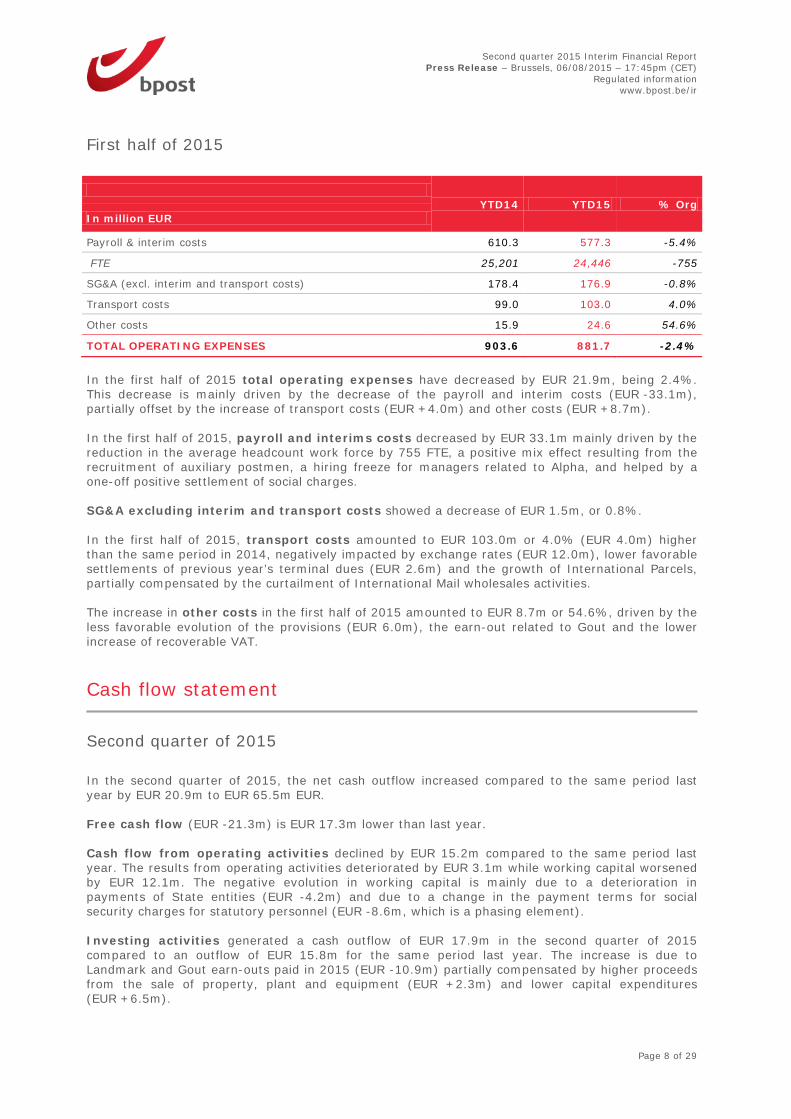
In the first half of 2015 total operating expenses have decreased by EUR 21.9m, being 2.4%. This decrease is mainly driven by the decrease of the payroll and interim costs (EUR -33.1m), partially offset by the increase of transport costs (EUR +4.0m) and other costs (EUR +8.7m). In the first half of 2015, payroll and interims costs decreased by EUR 33.1m mainly driven by the reduction in the average headcount work force by 755 FTE, a positive mix effect resulting from the recruitment of auxiliary postmen, a hiring freeze for managers related to Alpha, and helped by a one-off positive settlement of social charges. SG&A excluding interim and transport costs showed a decrease of EUR 1.5m, or 0.8%. In the first half of 2015, transport costs amounted to EUR 103.0m or 4.0% (EUR 4.0m) higher than the same period in 2014, negatively impacted by exchange rates (EUR 12.0m), lower favorable settlements of previous year’s terminal dues (EUR 2.6m) and the growth of International Parcels, partially compensated by the curtailment of International Mail wholesales activities. The increase in other costs in the first half of 2015 amounted to EUR 8.7m or 54.6%, driven by the less favorable evolution of the provisions (EUR 6.0m), the earn-out related to Gout and the lower increase of recoverable VAT.
Cash flow statement
Second quarter of 2015 In the second quarter of 2015, the net cash outflow increased compared to the same period last year by EUR 20.9m to EUR 65.5m EUR. Free cash flow (EUR -21.3m) is EUR 17.3m lower than last year. Cash flow from operating activities declined by EUR 15.2m compared to the same period last year. The results from operating activities deteriorated by EUR 3.1m while working capital worsened by EUR 12.1m. The negative evolution in working capital is mainly due to a deterioration in payments of State entities (EUR -4.2m) and due to a change in the payment terms for social security charges for statutory personnel (EUR -8.6m, which is a phasing element). Investing activities generated a cash outflow of EUR 17.9m in the second quarter of 2015 compared to an outflow of EUR 15.8m for the same period last year. The increase is due to Landmark and Gout earn-outs paid in 2015 (EUR -10.9m) partially compensated by higher proceeds from the sale of property, plant and equipment (EUR +2.3m) and lower capital expenditures (EUR +6.5m).

Second quarter 2015 Interim Financial Report
Press Release – Brussels, 06/08/2015 – 17:45pm (CET) Regulated information
www.bpost.be/ir
Page 9 of 29
The cash outflow relating to financing activities amounted to EUR 44.2m. This is EUR 3.7m higher than the same period last year mainly due to a higher dividend pay-out in 2015. First half of 2015 In the first half of 2015, bpost generated EUR 232.4m of net cash. This is a decrease of EUR 89.8m compared to the net cash inflow of EUR 322.2m for the same period last year. Cash flow from operating activities resulted in a cash inflow of EUR 303.2m, EUR 93.2m less than the same period last year. The results of operating activities decreased by EUR 3.2m and EUR 42.0m income taxes relating to the 2013 results were paid in the first quarter of 2015. Besides this, working capital deteriorated by EUR 48.2m mainly due to last year’s earlier reception of two settlements with postal operators (EUR -24.8m), a change in payment terms for social security charges for statutory personnel (EUR -8.6m, phasing element), a lower SGEI remuneration received in the first half of 2015 (EUR -5.4m) and a negative phasing impact in VAT (EUR -4.1m). Investing activities generated a cash outflow of EUR 26.4m in the first half of 2015 compared to an outflow of EUR 33.1m for the same period last year. This decrease is mainly due to lower capital expenditures (EUR +6.4m) and higher proceeds from the sale of property, plant and equipment (EUR +2.5m). These effects were partially counterbalanced by higher cash outflows related to the subsidiaries (EUR -2.2m). The cash outflow relating to financing activities amounted to EUR 44.4m, an increase by EUR 3.3m compared to last year.
Key events during the second quarter
bpost, the only candidate for the press contracts The BIPT (Belgian Institute for Postal services and Telecommunications) announced that bpost is the only candidate to have submitted a bid for the concession of the distribution of both newspapers and magazines as from January 1st, 2016 for a period of five years. At this stage, no decision has been taken yet. bpost and CityDepot join forces bpost and CityDepot have agreed to join forces, pool their experience and combine their geographic presence to take a leading position on the city distribution market and roll out their service offering to other parts of the country. Together they form a new entity “CityDepot NV”, which will be led by CityDepot’s founder Marc Schepers. bpost will be the biggest shareholder with the intention to increase its stake in the coming years. CityDepot, which was created in 2011, was the first to launch a city distribution system in Hasselt and subsequently also in Brussels. In 2014 bpost launched a comparable service in Antwerp, under the City Logistics name. The new entity will take over the activities and the 25 employees of the existing CityDepot and City Logistics entities. The Belgian government approved a draft to modify the law of 1991 related to public companies The purpose of this draft is to foresee a level playing field for public companies compared to their competitors. It provides the possibility to these companies to appeal in addition of statutory employees, to contractual employees and in some cases to self-employed. Furthermore this draft foresees the possibility for the government to sell, in accordance with certain requirements, a part or the totality of their majority participation. Finally, it also addressed some corporate governance issues such as the appointment of directors which should only be done by the General Assembly and the appointment of the CEO by the Board of Directors.

Second quarter 2015 Interim Financial Report
Press Release – Brussels, 06/08/2015 – 17:45pm (CET) Regulated information
www.bpost.be/ir
Page 10 of 29
Pierre Winand, Chief Financial Officer of bpost and member of the Executive Committee, left bpost as from July, 1st.
Financial calendar
07.08.15 (10:00 CET) Analyst Conference Call 06.10.15 Start of quiet period ahead of 3Q15 results 05.11.15 (17:45 CET) Announcement 3Q15 results 06.11.15 (10:00 CET) Analyst Conference Call 03.12.15 (17:45 CET) Financial results first 10 months of 2015 08.12.15 Ex-dividend date (interim dividend) 09.12.15 Record date (interim dividend) 10.12.15 Payment date of the interim dividend

Second quarter 2015 Interim Financial Report
Press Release – Brussels, 06/08/2015 – 17:45pm (CET) Regulated information
www.bpost.be/ir
Page 11 of 29
Interim Condensed Consolidated Financial Statements1 Interim Consolidated Income Statement Year-to-date 2nd quarter
In million EUR NOTES 2014 2015 2014 2015
Turnover 6 1,231.7 1,206.3 609.2 593.7
Other operating income 8.5 7.9 4.2 3.9
TOTAL OPERATING INCOME 1,240.2 1,214.2 613.5 597.6
Materials cost )15.1( )13.7( )7.1( )6.3(
Services and other goods 7 )292.4( )294.8( )146.4( )148.8(
Payroll costs )595.3( )562.4( )294.3( )274.7(
Other operating expenses )0.8( )10.9( )2.1( )8.1(
Depreciation, amortization )42.2( )42.6( )21.2( )21.5(
TOTAL OPERATING EXPENSES )945.8( )924.4( )471.1( )459.4(
PROFIT FROM OPERATING ACTIVITIES (EBIT) 294.4 289.8 142.3 138.3
Financial income 2.1 2.1 0.9 0.7
Financial cost )13.7( )8.3( )10.4( )5.1(
Share of profit of associates 6.3 4.6 2.7 5.4
PROFIT BEFORE TAX 289.0 288.2 135.5 139.2
Income tax expense )97.0( )100.5( )42.3( )48.1(
PROFIT OF THE PERIOD 192.1 187.7 93.2 91.2
Attributable to:
Owners of the Parent 190.7 186.7 92.2 91.0
Non-controlling interests 1.4 1.0 0.9 0.1
EARNINGS PER SHARE
Year-to-date 2nd quarter
In EUR 2014 2015 2014 2015 ►basic, profit for the year attributable to ordinary equity holders of the parent
0.95 0.93 0.46 0.46 ►diluted, profit for the year attributable to ordinary equity holders of the parent 0.95 0.93 0.46 0.46
1 The interim condensed consolidated financial statements have been prepared in accordance with IAS 34 Interim Financial
Reporting

Second quarter 2015 Interim Financial Report
Press Release – Brussels, 06/08/2015 – 17:45pm (CET) Regulated information
www.bpost.be/ir
Page 12 of 29
In accordance with IAS 33, diluted earnings per share amounts have to be calculated by dividing the net profit attributable to ordinary equity holders of the parent (after adjusting for the effects of all dilutive potential ordinary shares) by the weighted average number of ordinary shares outstanding during the year plus the weighted average number of ordinary shares that would be issued on conversion of all the dilutive potential ordinary shares into ordinary shares. As far as bpost is concerned, no effects of dilution affect the net profit attributable to ordinary equity holders and the weighted average number of ordinary shares.

Second quarter 2015 Interim Financial Report
Press Release – Brussels, 06/08/2015 – 17:45pm (CET) Regulated information
www.bpost.be/ir
Page 13 of 29
Interim Consolidated Statement of Comprehensive Income As of 30 June As of 30 June
In million EUR 2014 2015
PROFIT FOR THE YEAR 192.1 187.7
OTHER COMPREHENSIVE INCOME
Other comprehensive income to be reclassified to profit or loss in subsequent periods (net of tax):
Exchange differences on translation of foreign operations 0.0 0.5
NET OTHER COMPREHENSIVE INCOME/(LOSS) TO BE RECLASSIFIED TO PROFIT OR LOSS IN SUBSEQUENT PERIODS 0.0 0.5
Other comprehensive income not to be reclassified to profit or loss in subsequent periods (net of tax):
Fair value for financial assets available for sale by associates 58.6 (38.5) (Loss)gain on available for sale financial assets
88.9 (58.3)
Income tax effect (30.3) 19.8
Fair value of actuarial results on defined benefit plans (0.2) 4.2
Actuarial gains/(losses) on defined benefit plans (2.3) 4.8
Income tax effect 2.1 (0.6)
NET OTHER COMPREHENSIVE INCOME/(LOSS) NOT TO BE RECLASSIFIED TO PROFIT OR LOSS IN SUBSEQUENT PERIODS 58.3 (34.3)
OTHER COMPREHENSIVE INCOME/(LOSS) FOR THE YEAR, NET OF TAX 58.3 (33.8)
TOTAL COMPREHENSIVE INCOME FOR THE YEAR, NET OF TAX 250.4 154.0
Attributable to:
Owners of the Parent 249.0 153.0
Non-controlling interest 1.4 1.0

Second quarter 2015 Interim Financial Report
Press Release – Brussels, 06/08/2015 – 17:45pm (CET) Regulated information
www.bpost.be/ir
Page 14 of 29
Interim Consolidated Statement of Financial Position As of 31 December As of 30 June In million EUR NOTES 2014 2015 Assets Non-current assets
Property, plant and equipment 8 565.7 547.9
Intangible assets 89.5 90.6
Investments in associates 9 416.5 382.6
Investment properties 8.7 7.6
Deferred tax assets 61.0 53.8
Trade and other receivables 2.6 2.2
1,144.0 1,084.8 Current assets
Assets held for sale 2.8 0.7
Inventories 12.5 10.7
Income tax receivable 1.9 2.2
Trade and other receivables 10 398.3 324.0
Cash and cash equivalents 11 562.3 795.9
977.8 1,133.5
TOTAL ASSETS 2,121.8 2,218.3
Equity and liabilities Equity attributable to equity holders of the Parent
Issued capital 364.0 364.0
Treasury shares 0.0 0.0
Reserves 229.4 235.4
Foreign currency translation 0.6 1.1
Retained earnings 87.5 187.7
681.4 788.2 Non-controlling interests 0.0 0.0
TOTAL EQUITY 681.4 788.2
Non-current liabilities
Interest-bearing loans and borrowings 65.7 65.7
Employee benefits 12 368.6 353.7
Trade and other payables 13 79.8 57.0
Provisions 37.1 35.7
Deferred tax liabilities 1.4 1.4
552.5 513.5 Current liabilities
Interest-bearing loans and borrowings 10.0 9.5
Bank overdrafts 0.3 0.2
Provisions 27.7 30.3
Income tax payable 14 67.3 115.9
Trade and other payables 15 782.6 760.8
887.8 916.7 TOTAL LIABILITIES 1,440.4 1,430.1
TOTAL EQUITY AND LIABILITIES 2,121.8 2,218.3
Second quarter 2015 Interim Financial Report
Press Release – Brussels, 06/08/2015 – 17:45pm (CET) Regulated information
www.bpost.be/ir
Page 15 of 29
Interim Consolidated Statement of Changes in Equity Attributable to equity holders of the parent
In million EUR
Authorized & issued
capital Treasury
shares Other
reserves
Foreign currency
translation Retained earnings Total
Non-controlling
interests Total
equity AS PER 1 JANUARY 2014 364.0 0.0 111.0 0.0 101.9 576.9 0.0 576.9
Profit for the year 2014 190.7 190.7 1.4 192.1 Other comprehensive income 160.2 (101.9) 58.3 58.3
TOTAL COMPREHENSIVE INCOME
0.0 0.0 160.2 0.0 88.8 249.0 1.4 250.4
Dividends (Pay-out) (40.0) (40.0) 0.0 (40.0)
Other 0.3 1.4 1.7 (1.4) 0.3
AS OF 30 JUNE 2014 364.0 0.0 231.5 0.0 192.1 787.6 0.0 787.6
AS PER 1 JANUARY 2015 364.0 0.0 229.4 0.6 87.5 681.4 0.0 681.4
Profit for the year 2015 186.7 186.7 1.0 187.7 Other comprehensive income 53.2 0.5 (87.5) (33.8) (33.8)
TOTAL COMPREHENSIVE INCOME
0.0 0.0 53.2 0.5 99.2 153.0 1.0 154.0
Dividends (Pay-out) (44.0) 0.0 (44.0) 0.0 (44.0)
Other (3.2) 1.0 (2.2) (1.0) (3.2)
AS OF 30 JUNE 2015 364.0 (0.0) 235.4 1.1 187.7 788.2 0.0 788.2
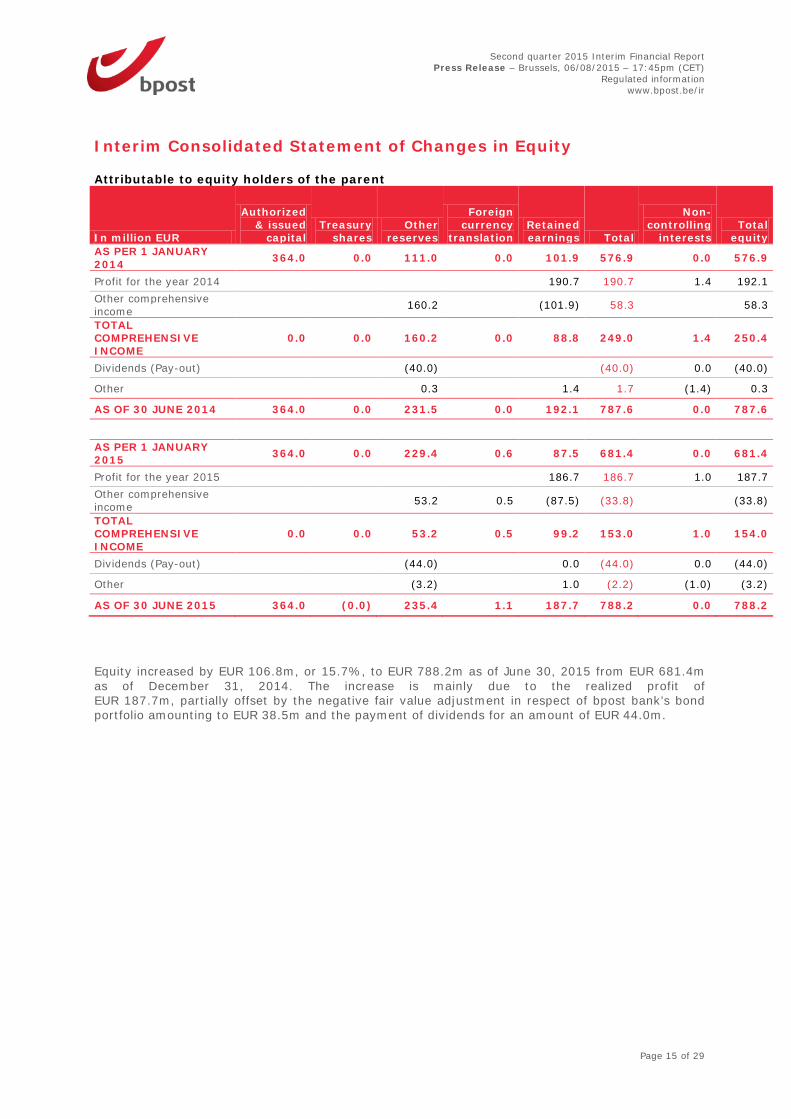
Equity increased by EUR 106.8m, or 15.7%, to EUR 788.2m as of June 30, 2015 from EUR 681.4m as of December 31, 2014. The increase is mainly due to the realized profit of EUR 187.7m, partially offset by the negative fair value adjustment in respect of bpost bank’s bond portfolio amounting to EUR 38.5m and the payment of dividends for an amount of EUR 44.0m.

Second quarter 2015 Interim Financial Report
Press Release – Brussels, 06/08/2015 – 17:45pm (CET) Regulated information
www.bpost.be/ir
Page 16 of 29
Interim Consolidated Statement of Cash Flows Year-to-date 2nd quarter
In million EUR 2014 2015 2014 2015
Operating activities
Profit before tax 289.0 288.2 135.5 139.2
Depreciation and amortization 42.2 42.2 21.2 21.1
Impairment on bad debts 1.1 0.2 1.3 0.5
Gain on sale of property, plant and equipment (4.7) (5.0) (2.3) (2.7)
Change in employee benefit obligations (1.9) (10.1) (0.1) (6.4)
Share of profit of associates (6.3) (4.6) (2.7) (5.4)
Income tax paid (3.6) (4.3) (1.7) (1.9)
Income tax paid on previous years 0.0 (42.0) 0.0 0.0
CASH FLOW FROM OPERATING ACTIVITIES BEFORE CHANGES IN WORKING CAPITAL AND PROVISIONS 315.8 264.6 151.2 144.4
Decrease/(increase) in trade and other receivables 89.0 75.7 8.0 (8.9)
Decrease/(increase) in inventories (0.3) 1.6 (0.1) 0.7
Increase/(decrease) in trade and other payables (3.1) (39.8) (144.0) (140.0)
Deposits received from third parties (0.2) 0.0 (0.0) 0.0
Increase/(decrease) in provisions (4.9) 1.2 (3.2) 0.5
NET CASH FROM OPERATING ACTIVITIES 396.4 303.2 11.8 (3.3)
Investing activities
Proceeds from sale of property, plant and equipment 5.7 8.2 3.0 5.3
Acquisition of property, plant and equipment (24.5) (17.4) (15.7) (9.5)
Acquisition of intangible assets (5.6) (6.3) (3.2) (2.8)
Acquisition of other investments (0.0) 0.0 0.0 (0.0)
Acquisition of subsidiaries, net of cash acquired (8.7) (10.9) 0.0 (10.9)
NET CASH USED IN INVESTING ACTIVITIES (33.1) (26.4) (15.8) (17.9)
Financing activities
Payments related to borrowings and financing lease liabilities (1.2) (0.4) (0.5) (0.2)
Dividends paid (40.0) (44.0) (40.0) (44.0)
NET CASH FROM FINANCING ACTIVITIES (41.2) (44.4) (40.5) (44.2)
NET INCREASE IN CASH AND CASH EQUIVALENTS 322.2 232.4 (44.5) (65.5)
NET FOREIGN EXCHANGE DIFFERENCE 0.0 1.3 0.0 0.5
Cash and cash equivalent less bank overdraft as of 1st January 448.0 562.0 Cash and cash equivalent less bank overdraft as of 30 June 770.2 795.7 MOVEMENTS BETWEEN 1ST JANUARY AND 30 JUNE 322.2 233.7

Second quarter 2015 Interim Financial Report
Press Release – Brussels, 06/08/2015 – 17:45pm (CET) Regulated information
www.bpost.be/ir
Page 17 of 29
Notes to the Interim Condensed Consolidated Financial Statements
1. Corporate Information The interim condensed consolidated financial statements of bpost for the first six months ended June 30, 2015 were authorized for issue in accordance with a resolution of the Board of Directors on August 6, 2015. Business activities bpost and its subsidiaries (hereinafter referred to as “bpost”) provide national and international mail and parcels services comprising the collection, transport, sorting and distribution of addressed and non-addressed mail, printed documents, newspapers and parcels. bpost, through its subsidiaries and business units, also sells a range of other products and services, including postal, banking and financial products, express delivery services, document management and related activities. bpost also carries out Services of General Economic Interest (SGEI) on behalf of the Belgian State. Legal status bpost is a limited-liability company under public law of Belgium. bpost has its registered office at the Muntcentrum-Centre Monnaie, 1000 Brussels.
2. Basis of preparation and accounting policies Basis of preparation These interim financial statements are subject to review by the independent auditor (see statement of limited review). The interim condensed consolidated financial statements for the six months ended June 30, 2015 have been prepared in accordance with IAS 34 Interim Financial Reporting. The interim condensed consolidated financial statements do not include all the information and disclosures required in the annual financial statements, and should be read in conjunction with bpost’s annual financial statements as at December 31, 2014. Significant accounting policies The accounting policies adopted in the preparation of the interim condensed consolidated financial statements are consistent with those followed in the preparation of bpost’s annual financial statements for the year ended December 31, 2014, except for the adoption of new standards and interpretations effective as from January 1, 2015. As of January 1, 2015 bpost bank applies IFRIC 21 “levies”. This interpretation stipulates that an entity recognises a liability for a levy when the activity that triggers payment, as identified by the relevant legislation, occurs. It also clarifies that a levy liability is accrued progressively only if the activity that triggers payment occurs over a period of time, in accordance with the relevant legislation. The application of this interpretation has mainly an impact on the seasonality of the results of bpost bank. The results of bpost bank are being reflected within the share of result of associates of the income statement of bpost. The following table shows a comparison of the results of bpost bank for which 2014 reported figures are being made comparable with 2015 for the impact of IFRIC 21.

Second quarter 2015 Interim Financial Report
Press Release – Brussels, 06/08/2015 – 17:45pm (CET) Regulated information
www.bpost.be/ir
Page 18 of 29
Year-to-date 2nd quarter
2014 2014 2015 2014 2014 2015 In million EUR Reported Comparable Reported Comparable Share of result of associates 6.3 3.8 4.6 2.7 3.9 5.4 The following new standards and amendments, entered into force as from January 1, 2015, don’t have any effect on the presentation, the financial performance or position of bpost:
IAS 19 – Amendment – Employee Benefits – Defined benefit plans: Employee Contributions
Annual improvements to IFRSs 2010-2012 Cycle Annual improvements to IFRSs 2011-2013 Cycle
Standards and Interpretations not yet applied by bpost The following new IFRS Standards and IFRIC Interpretations, endorsed but not yet effective or which are yet to become mandatory, have not been applied by bpost for the preparation of its interim condensed consolidated financial statements.
Standard or interpretation
Effective for in reporting
periods starting on or
after
IFRS 9 – Financial Instruments – (issued on July 2014)(*) 1 January 2018
IFRS 14 – Regulatory Deferral Accounts (*) 1 January 2016
IFRS 15 – Revenue from Contracts with customers (*) 1 January 2018 IFRS 11 – Amendment – Accounting for acquisitions of interests in Joint Operations (*) 1 January 2016
IFRS 10 – IAS 28 - Amendments – Sale or contribution of assets between an investor and its Associate or Joint Venture (*)
1 January 2016
IFRS 10, IFRS 12 & IAS 28 – Amendments - Investment Entities: Applying the consolidation exception (issued on December 2014) (*)
1 January 2016
IAS 27 – Amendments - Equity method in Separate Financial Statements (*)
1 January 2016
IAS 16 - IAS 38 – Amendments – Clarification of acceptable methods of depreciation and amortisation (*)
1 January 2016
IAS 16 – IAS 41 – Amendments - Agriculture: Bearer plants (*) 1 January 2016
IAS 1 – Amendments – Disclosure Initiative (issued on December 2014) (*) 1 January 2016
Annual improvements to IFRSs 2012-2014 Cycle (*) 1 January 2016 (*) Not yet endorsed by the EU as per date of this report bpost has not early adopted any other standard, interpretation, or amendment that was issued but is not yet effective.

Second quarter 2015 Interim Financial Report
Press Release – Brussels, 06/08/2015 – 17:45pm (CET) Regulated information
www.bpost.be/ir
Page 19 of 29
3. Seasonality of Operations
Pursuant to the 5th Management Contract, bpost is the provider of certain SGEI. These services include, among others, the operation of the retail network, the distribution of newspapers and periodicals, the distribution of electoral materials, the acceptance of cash deposits at post offices and the home delivery of state pensions and social allowances. bpost is compensated for providing these services based on a net avoided cost (“NAC”) methodology. Compensation on SGEI is equally distributed over the four quarters. During the year, calculations are made according to the Net Avoided Cost methodology to ensure the remuneration is in line with the amounts recorded. This methodology provides that compensation shall be based upon the difference in the net cost between bearing or not the provision of SGEI. The compensation for providing the SGEI is subject to a cap, which will be adjusted to the extent the Belgian consumer price index exceeds 2.2% in a given year.
4. Business Combinations Additional consideration Landmark During the second quarter of 2015, bpost NV-SA paid USD 7.6m (EUR 7.0m) in execution of the contingent consideration agreement and based upon the 2014 performance of Landmark. The fair value of the contingent consideration was recognized as a financial liability. The payment has no impact on the original calculated goodwill. Additional consideration Gout International BV and BEurope Consultancy BV The purchase agreement between both acquired entities and Landmark Global Inc., a 51% subsidiary of bpost NV-SA, included a contingent consideration arrangement and foresaw three possible additional earn-out amounts, based on the EBITDA respectively achieved in 2014, 2015 and 2016. Based on the business plan of the two acquired entities, the fair value of the contingent consideration was recognized for an amount of EUR 2.1m as a financial liability. In May 2015, all parties agreed, in an amended agreement, that the additional contingent consideration would be replaced by a single, lump sum earn-out payment of EUR 4.0m. In accordance with the accounting policies, as the amount of contingent consideration changed as a result of a post-acquisition event, the increase in fair value is recognized in cost for an amount of EUR 2.0m. The payment has no impact on the original calculated goodwill. Acquisitions of the six months ended June 30, 2015 On May 8, 2015 bpost NV-SA and CityDepot have agreed to join forces to take a leading position on the city distribution market and roll out their service offering to other parts of the country. Together they form a new entity: CityDepot NV. bpost has acquired 48% of the shares of the new company and will increase its participation in the coming years. The purchase price allocation of the partial acquisition is still under review.
5. Operating Segments Following a correction of the allocation of cash sales (stamps and franking machines) to products as of January 1, 2015 some revenues are shifting from Domestic Parcels to Transactional Mail. Taking into account these changes, the 2014 figures have been made comparable to reflect these changes. The comparable figures are shown under the heading “comparable”. The variances mentioned hereafter compare the 2015 figures with the 2014 comparable figures.

Second quarter 2015 Interim Financial Report
Press Release – Brussels, 06/08/2015 – 17:45pm (CET) Regulated information
www.bpost.be/ir
Page 20 of 29
The table below presents revenue information about bpost’s operating segments:
Year-to-date 2nd quarter
In million EUR 2014 Comparable 2015 Change % 2014
Comparable 2015
MRS 997.1 956.8 -4.0% 496.4 473.3
P&I 225.0 239.1 6.3% 110.8 117.4
TOTAL OPERATING INCOME OF OPERATING SEGMENTS 1,222.1 1,195.8 -2.1% 607.2 590.7
Corporate (Reconciling category) 18.1 18.3 1.5% 6.3 6.9
TOTAL OPERATING INCOME 1,240.2 1,214.2 -2.1% 613.5 597.6 Revenues attributable to the MRS operating segment decreased by EUR 23.0m compared to the second quarter of 2014, to EUR 473.3m, mainly due to:
- the 6.1% underlying volume decline of Domestic Mail,
- impact of last year’s elections (EUR -4.6m),
- partially compensated by price and mix improvement in Domestic Mail.
Growth of P&I revenues in the second quarter amounted to EUR 6.5m. The decrease of International Mail (EUR 6.3m), mainly as a result of the curtailment of very low margin International Mail activities to optimize profitability, is more than compensated by the increase of the Parcels product portfolio. The latter increased by EUR 12.4m and is favorably influenced by
- the performance of International Parcels, driven by the solid growth in the lanes from the US and from / to China, supported by a positive foreign exchange rate impact,
- the volume growth in Domestic Parcels, driven by e-commerce related activities (12.6% for the second quarter of 2015 vs. 10.2% for the first quarter of 2015).
Inter-segment sales are immaterial. There is no internal operating income. Excluding the compensation received to provide the services as described in the Management Contract (see note 6), no single external customer exceeded 10% of bpost’s operating income. The following table introduces the revenues from external customers attributed to Belgium and to all foreign countries in total from which bpost derives its revenues. The allocation of the revenues of the external customers is based on their location.
Year-to-date 2nd quarter
In million EUR 2014 2015 Change % 2014 2015
Belgium 1,086.1 1,051.2 -3.2% 537.3 518.8
RoW 154.1 163.0 5.8% 76.2 78.8
TOTAL OPERATING INCOME 1,240.2 1,214.2 -2.1% 613.5 597.6 The following tables present EBIT and EAT information about bpost’s operating segments for the period ended June 30, 2015 and 2014:
Year-to-date 2nd quarter
In million EUR 2014 Comparable 2015 Change % 2014
Comparable 2015
MRS 282.7 267.1 -5.5% 139.8 126.7

Second quarter 2015 Interim Financial Report
Press Release – Brussels, 06/08/2015 – 17:45pm (CET) Regulated information
www.bpost.be/ir
Page 21 of 29
P&I 20.6 30.2 46.9% 10.1 12.8
TOTAL EBIT OF OPERATING SEGMENTS 303.2 297.4 -1.9% 149.8 139.5
Corporate (Reconciling category) (8.9) (7.5) -14.9% (7.5) (1.3)
TOTAL EBIT 294.4 289.8 -1.5% 142.3 138.3 In the second quarter of 2015, EBIT of the MRS operating segment decreased by EUR 13.1m to EUR 126.7m. The price increases, productivity improvements and other costs reductions could not compensate the volume decline and project-related costs. EBIT attributable to the P&I operating segment improved by EUR 2.7m from EUR 10.1m to EUR 12.8m in the second quarter of 2015 mainly thanks to performance improvements in the domestic and International Parcels product portfolios combined with a better performance of some P&I subsidiaries and last year’s start up project costs of Shop and Deliver (“Combo”). This improvement is counterbalanced by the Gout earn-out (EUR 2.0m) and the lower contribution of the wholesale business in the EBIT attributable to this segment.
Year-to-date 2nd quarter
In million EUR 2014 Comparable 2015 Change % 2014
Comparable 2015
MRS 282.7 267.1 -5.5% 139.8 126.7
P&I 20.6 30.2 46.9% 10.1 12.8
TOTAL EAT OF OPERATING SEGMENTS 303.2 297.4 -1.9% 149.8 139.5
Corporate (Reconciling category) (111.2) (109.6) -1.4% (56.6) (48.4)
TOTAL EAT 192.1 187.7 -2.3% 93.2 91.2
Financial income, financial costs, share of profit of associates and income tax expenses are all included in the reconciling category “Corporate”. The following table provides detailed information on the reconciling category “Corporate”:
Year-to-date 2nd quarter
In million EUR 2014 Comparable 2015 Change % 2014
Comparable 2015
OPERATING INCOME 18.1 18.3 1.5% 6.3 6.9 Central departments (Finance, Legal, Internal Audit, CEO, …) (29.5) (31.7) 7.7% (15.0) (15.7)
Other reconciliation items 2.5 5.9 132.5% 1.2 7.5
OPERATING EXPENSES (26.9) (25.9) -3.9% (13.8) (8.2) EBIT CORPORATE (RECONCILING CATEGORY) (8.9) (7.5) -14.9% (7.5) (1.3)
Share of profit of associates 6.3 4.6 -27.5% 2.7 5.4
Financial Results (11.6) (6.2) -46.7% (9.5) (4.4)
Income Tax expense (97.0) (100.5) 3.6% (42.3) (48.1) EAT CORPORATE (RECONCILING CATEGORY) (111.2) (109.6) -1.4% (56.6) (48.4)
Profit from operating activities (EBIT) attributable to the Corporate reconciliation category increased by EUR 6.2m to negative EUR 1.3m EUR for the second quarter of 2015 from negative EUR 7.5m for the second quarter of 2014. This improvement is mainly driven by a favourable settlement of social charges (EUR 5.7m) and higher revenue recognition (EUR 1.4m), partially offset by cost increases in

Second quarter 2015 Interim Financial Report
Press Release – Brussels, 06/08/2015 – 17:45pm (CET) Regulated information
www.bpost.be/ir
Page 22 of 29
the central departments (EUR 0.8m) due to some projects and lower proceeds from the sales of buildings compared to the second quarter of 2014. Assets and liabilities are not reported per segment in the company.
6. Turnover
Year-to-date 2nd quarter
In million EUR 2014 2015 2014 2015
Turnover excluding the SGEI remuneration 1,079.5 1,062.5 533.2 521.8
SGEI remuneration 152.2 143.9 76.1 71.9
TOTAL 1,231.7 1,206.3 609.2 593.7
7. Operating expenses
Year-to-date 2nd quarter
In million EUR 2014 2015 Change % 2014 2015 Change %
Rent and rental costs 34.3 33.7 -1.9% 17.2 17.5 1.6%
Maintenance and repairs 36.0 36.4 1.1% 17.9 18.4 2.8%
Energy delivery 19.2 18.5 -3.7% 9.0 9.0 -0.2%
Other goods 9.6 8.8 -8.8% 4.6 4.4 -4.3%
Postal and telecom costs 2.7 2.9 8.7% 1.1 1.5 32.8%
Insurance costs 6.4 5.7 -10.6% 3.0 3.3 8.4%
Transport costs 99.0 103.0 4.0% 48.4 50.3 4.1%
Publicity and advertising 6.4 5.9 -8.0% 3.1 3.5 10.3%
Consultancy 5.2 3.1 -41.3% 3.4 1.4 -58.8%
Interim employees 15.0 14.9 -0.9% 9.3 8.1 -12.9%
Third party remuneration, fees 49.3 52.2 5.8% 24.5 26.3 7.5%
Other services 9.2 9.7 6.0% 4.9 5.1 5.4%
TOTAL 292.4 294.8 0.8% 146.4 148.8 1.6%
8. Property, plant and equipment In the first half of the year 2015 property, plant and equipment decreased by EUR 17.7m, or 3.1%, to EUR 547.9m as of June 30, 2015. The decrease is mainly due to depreciations of EUR 35.3m, partially offset by capital expenditures of EUR 17.4m.
9. Investments in associates Investments in associates decreased by EUR 33.9m, or 8.1%, to EUR 382.6m as of June 30, 2015. This decrease is due to the decrease in the unrealized gain on the bond portfolio in the amount of EUR 38.5m, reflecting an average increase of the underlying yield curve by 14 basis points (bps), partially offset by bpost’s share of bpost bank’s gain for the first six months of 2015 in the amount

Second quarter 2015 Interim Financial Report
Press Release – Brussels, 06/08/2015 – 17:45pm (CET) Regulated information
www.bpost.be/ir
Page 23 of 29
of EUR 4.6m. As of June 30, 2015, investments in associates comprised net unrealized gains in respect of the bond portfolio in the amount of EUR 187.1m, which represented 48.9% of total investments in associates. The unrealized gains were generated by the lower level of interest rates compared to the acquisition yields of the bonds. Unrealized gains are not recognized in the income statement but are rather recognized directly in equity in other comprehensive income.
10. Current trade and other receivables Current trade and other receivables decreased by EUR 74.3m, or 18.7%, to EUR 324.0m as of June 30, 2015. The decrease is mainly driven by the usual settlement of the SGEI receivable for the last quarter of 2014 and the curtailment of very low margin UK and US wholesales activities.
11. Cash and cash equivalents Cash and cash equivalents increased by EUR 233.6m, or 41.5%, to EUR 795.9m as of June 30, 2015. This increase is mainly due to the normalized free cash flow (EUR 276.8m), partially offset by the payment of a EUR 44.0m dividend during the second quarter.
12. Employee benefits
As of 31 December As of 30 June
In million EUR 2014 2015
Post-employment benefits (85.4) (79.1) Long-term employee benefits (118.3) (118.6) Termination benefits (13.3) (10.9) Other long-term benefits (151.5) (145.0) TOTAL (368.6) (353.7) Employee benefits decreased by EUR 14.9m, or 4.0%, to EUR 353.7m as of June 30, 2015. The decrease mainly reflects:
• The payment of benefits for an amount of EUR 18.9m, which included EUR 3.4m for the payment of early retirement and part-time work benefits.
• Operational actuarial gains (EUR 7.0m), mainly linked to the Workers Compensation Accidents and medical expenses benefits.
• Additional service costs (EUR 12.0m), past service costs (EUR 1.1m) and interest costs (EUR 2.7m)
• An actuarial gain of EUR 4.8m related to post-employment benefits, recognized through Other Comprehensive Income.
13. Non-current trade and other payables
Non-current trade and other payables decreased by EUR 22.8m, to EUR 57.0m as of June 30, 2015 mainly due to the transfer of the acquisition of 24.5% of the shares of Landmark from long term to short term, partially offset by the commitments relating to the full acquisition of CityDepot.

Second quarter 2015 Interim Financial Report
Press Release – Brussels, 06/08/2015 – 17:45pm (CET) Regulated information
www.bpost.be/ir
Page 24 of 29
14. Income tax payable Income tax payable increased by EUR 48.6m, to EUR 115.9m as of June 30, 2015 and is mainly explained by the accrued income taxes partially offset by the income taxes related to the 2013 results which were paid in the first quarter of 2015.
15. Current trade and other payables Current trade and other payables decreased by EUR 21.8m, or 2.8%, to EUR 782.6m as of June 30, 2015. This decrease is due to the decline of the trade payables and social payables respectively by EUR 52.9m and EUR 59.6m, partially offset by the increase in other payables by EUR 90.8m. The decrease of the social payables is mainly caused by a timing difference as 2014 full year social accruals (holiday pay, bonuses,...) have been paid during the first half of 2015. The increase of the other payables is primarily caused by the advance payment received from the Belgian State in respect of the SGEI compensation (EUR 64.1m) as well as the transfer from long term to short term for the acquisition of 24.5% of the shares of Landmark, partially offset by the payment of the contingent consideration arrangement for the acquisition of Landmark.
16. Contingent Liabilities and Contingent Assets As of June 30, 2015, bpost had 5,650 auxiliary postmen. 53 auxiliary postmen have initiated a lawsuit against bpost in various labor courts claiming equal salary and benefits by reference to baremic contractual or statutory employees performing the same work. All claims and allegations are contested by bpost. Until now, no courts have upheld the claims. Various court cases are still pending at appeal levels. If courts, especially at appeal level, were to find that the auxiliary postmen can claim equal treatment, bpost could be ordered to increase the salary and benefits of the auxiliary postmen to the level of relevant baremic contractual or statutory employees and it cannot be excluded that other employees could bring similar claims.
17. Events After the Reporting Period On July 23, 2015 during the joint committee, bpost management and the representatives of the workforce reached an agreement concerning the social plan related to the Alpha project in the support departments. The agreement contains the conditions for early retirement and determines the layoff conditions, in case certain employees are not selected for a new job. At this time, bpost cannot make a reliable estimate of the total cost of this social plan, given the uncertainty on the number of employees who will accept an early retirement or whose employment will eventually be terminated. Therefore, no provision has been included in the figures per end of June.

Second quarter 2015 Interim Financial Report
Press Release – Brussels, 06/08/2015 – 17:45pm (CET) Regulated information
www.bpost.be/ir
Page 25 of 29
Limited review report
Report of the Joint Auditors to the shareholders of bpost SA de droit public / bpost NV van publiek recht on the review of the interim condensed consolidated financial statements as of 30 June 2015 and for the six month period then ended Introduction We have reviewed the accompanying interim condensed consolidated statement of financial position of bpost SA de droit public / bpost NV van publiek recht (the “Company”), and its subsidiaries (collectively referred to as “the Group”) as at 30 June 2015 and the related interim condensed consolidated statements of income, comprehensive income, changes in equity and cash flows for the six month period then ended, and explanatory notes, collectively, the “Interim Condensed Consolidated Financial Statements”. These statements show a consolidated statement of financial position total of EUR 2,218.3m and a consolidated profit for the six month period then ended of EUR 187.7m. Management is responsible for the preparation and presentation of these Interim Condensed Consolidated Financial Statements in accordance with International Financial Reporting Standard IAS 34 Interim Financial Reporting (“IAS 34”) as adopted for use in the European Union. Our responsibility is to express a conclusion on these Interim Condensed Consolidated Financial Statements based on our review. Scope of Review We conducted our review in accordance the International Standard on Review Engagements 2410 “Review of Interim Financial Information Performed by the Independent Auditor of the Entity” applicable to review engagements. A review of interim financial information consists of making inquiries, primarily of persons responsible for financial and accounting matters, and applying analytical and other review procedures. A review is substantially less in scope than an audit conducted in accordance with the International Standards on Auditing and, consequently, does not enable us to obtain assurance that we would become aware of all significant matters that might be identified in an audit. Accordingly, we do not express an audit opinion.
Conclusion
Based on our review, nothing has come to our attention that causes us to believe that the accompanying Interim Condensed Consolidated Financial Statements do not give a true and fair view of the financial position of the Group as at 30 June 2015, and of its financial performance and its cash flows for the six month period then ended in accordance with IAS 34. Diegem, 6 August 2015 The Joint Auditors Ernst & Young Bedrijfsrevisoren BCVBA PVMD Bedrijfsrevisoren BCVBA Represented by Represented by Eric Golenvaux Caroline Baert Partner Partner

Second quarter 2015 Interim Financial Report
Press Release – Brussels, 06/08/2015 – 17:45pm (CET) Regulated information
www.bpost.be/ir
Page 26 of 29
Other financial information (unaudited)
Reconciliation of Reported to Normalized Financial Metrics bpost also analyzes the performance of its activities on a normalized basis or before non-recurring items. Non-recurring items represent significant income or expense items that due to their non-recurring character are excluded from internal reporting and performance analyses. bpost strives to use a consistent approach when determining if an income or expense item is non-recurring and if it is significant enough to be excluded from the reported figures to obtain the normalized ones. A non-recurring item is deemed to be significant if it amounts to EUR 20m or more. All profits or losses on disposal of activities are normalized whatever the amount they represent. Reversals of provisions whose addition had been normalized from income are also normalized whatever the amount they represent. The presentation of normalized results is not in conformity with IFRS and is not audited. The normalized results may not be comparable to normalized figures reported by other companies as those companies may compute their normalized figures differently from bpost. Normalized financial measures are presented below. Income Statement related During the first and second quarter of 2015 and 2014 no non-recurring income statement related items were identified. Cash Flow Statement related
Year-to-date 2nd quarter
In million EUR 2014 2015 Change % 2014 2015 Change %
Net Cash from operating activities 396.4 303.2 -23.5% 11.8 (3.3) -128.3%
Net Cash used in investing activities (33.1) (26.4) 20.2% (15.8) (17.9) -13.4%
OPERATING FREE CASH FLOW 363.4 276.8 -23.8% (4.0) (21.3) -433.9%
Deposits received from third parties 0.2 0.0 -100.0% 0.0 0.0 -100.0%
NORMALIZED OPERATING FREE CASH FLOW 363.6 276.8 -23.9% (4.0) (21.3) -433.9%

Second quarter 2015 Interim Financial Report
Press Release – Brussels, 06/08/2015 – 17:45pm (CET) Regulated information
www.bpost.be/ir
Page 27 of 29
From IFRS Consolidated Net Profit to Belgian GAAP Unconsolidated Net Profit
Year-to-date 2nd quarter
In million EUR 2014 2015 Change % 2014 2015 Change
% IFRS Consolidated Net Profit 192.1 187.7 -2.3% 93.2 91.2 -2.1%
Results of subsidiaries and deconsolidation impacts (15.2) (13.6) -10.4% (8.9) (4.9) -45.0%
Differences in depreciation and impairments (4.4) (4.0) -9.7% (2.2) (1.3) -40.2%
Differences in recognition of provisions (5.3) (0.9) -83.8% (2.1) (0.2) -91.7%
Effects of IAS19 0.7 (10.5) 2.5 (5.3) Deferred taxes 4.3 6.6 53.4% 1.3 3.0 133.0%
Other (0.8) 5.7 0.5 1.3 188.8%
Belgian GAAP unconsolidated net profit 171.5 171.1 -0.2% 84.2 83.8 -0.4%
bpost’s unconsolidated profit after taxes prepared in accordance with Belgian GAAP can be derived from the consolidated IFRS profit after taxes in two stages. The first stage consists of un-consolidating the profit after taxes under IFRS, i.e.:
• Subtracting the results of the subsidiaries, i.e. removing the profit after tax of the subsidiaries; and
• Eliminating any other Income Statement impact the subsidiaries had on bpost (such as impairments) and adding the dividends received from these subsidiaries. During the second quarter of 2015 Alteris paid a dividend of EUR 4.0m to bpost.
The table below sets forth the breakdown of the above mentioned impacts:
Year-to-date 2nd quarter
In million EUR 2014 2015 2014 2015
Profit of the Belgian fully consolidated subsidiaries (local GAAP) (4.6) (4.9) (2.8) (2.3)
Profit of the international subsidiaries (local GAAP) (3.9) (4.8) (2.6) (2.7)
Share of profit of bpost bank (local GAAP) (5.9) (7.2) (2.6) (3.6)
Other deconsolidation impacts (0.7) 3.4 (1.0) 3.7
TOTAL (15.2) (13.6) (8.9) (4.9)
The second stage consists of deriving the Belgian GAAP figures from the IFRS figures and is achieved by reversing all IFRS adjustments made to local GAAP figures. These adjustments include, but are not limited to the following:
• Differences in the treatment of depreciation and impairments: Belgian GAAP allows different useful lives (and hence depreciation rates) for fixed assets from IFRS. Goodwill is amortized under Belgian GAAP while IFRS requires impairment testing for goodwill. IFRS also allows intangible assets to be recorded on the balance sheet under different conditions from Belgian GAAP;
• Recognition of provisions is subject to different criteria under Belgian GAAP and IFRS;
• IFRS requires that all future obligations to personnel be recorded as a liability under IAS 19, whereas Belgian GAAP has no such obligation. The movements in the IFRS liability are reflected on bpost’s Income Statement under personnel costs or provisions, except for the impact of changes in the discount rates for the future obligations, which is recorded as a financial result;

Second quarter 2015 Interim Financial Report
Press Release – Brussels, 06/08/2015 – 17:45pm (CET) Regulated information
www.bpost.be/ir
Page 28 of 29
• Deferred taxes require no accounting entries under Belgian GAAP, but are recorded under IFRS.
• The year-over-year evolution in the second quarter is mainly explained by last year’s increase of the financial charges related to employee benefits, which is due to the decrease in the discount rates at that time.
Statement of legal representatives
The bpost Management Committee declares that to the best of its knowledge, the condensed consolidated financial statements, established in accordance with International Financial Reporting Standards (“IFRS”), give a true and fair view of the assets, financial position and results of bpost and of the entities included in the consolidation. The financial report gives an accurate overview of the information that needs to be disclosed pursuant to article 13 of the Royal Decree of 14 November 2007. The bpost Management Committee is represented by Koen Van Gerven, Chief Executive Officer.
Forward Looking Statements
The information in this document may include forward-looking statements2
, which are based on current expectations and projections of management about future events. By their nature, forward-looking statements are not guarantees of future performance and involve known and unknown risks, uncertainties, assumptions and other factors because they relate to events and depend on circumstances that will occur in the future whether or not outside the control of the Company. Such factors may cause actual results, performance or developments to differ materially from those expressed or implied by such forward-looking statements. Accordingly, no assurance is given that such forward-looking statements will prove to have been correct. They speak only as at the date of the Presentation and the Company undertakes no obligation to update these forward-looking statements contained herein to reflect actual results, changes in assumptions or changes in factors affecting these statements.
2 as defined among others under the U.S. Private Securities Litigation Reform Act of 1995

Second quarter 2015 Interim Financial Report
Press Release – Brussels, 06/08/2015 – 17:45pm (CET) Regulated information
www.bpost.be/ir
Page 29 of 29
Glossary
• Operating free cash flow (FCF): cash flow from operating activities + cash flow from investing activities
• Net debt/(net cash) represents interest and non-interest bearing loans less cash and cash equivalents