Embed Size (px)
Citation preview

BPA’s NonBPA’s Non--Wires Solutions OverviewWires Solutions Overview
Mike WeedallVice President, Energy Efficiency
Bonneville Power Administration
March 20, 2006
How are we changing the Pacific Northwest?How are we changing the Pacific Northwest?

Slide 2 of 25BPA’s Energy Efficiency OverviewBPA’s Energy Efficiency Overview
Overview Overview
BPA Profile
Energy Efficiency’s legacy
Current efforts
Overview of the EnergyWeb
How Gridwise/EnergyWeb fits regional and national efforts
Solving real problems in the region
Leveraging BPA dollars

Slide 3 of 25BPA’s Energy Efficiency OverviewBPA’s Energy Efficiency Overview
BPA ProfileBPA Profile
Congress created the Bonneville Power Administration in 1937 to market and transmit the power produced at Bonneville Dam
BPA markets the power from 31 federal dams and one non federal nuclear plant in the Pacific Northwest, and maintains one of the largest and most reliable transmission systems in the United States
BPA’s service area includes Oregon, Washington, Idaho, western Montana and small parts of Wyoming, Nevada, Utah, California, and eastern Montana
BPA sells wholesale power to publicly owned and investor-owned utilities, large industries, and federal entities
Slide 4 of 25BPA’s Energy Efficiency OverviewBPA’s Energy Efficiency Overview
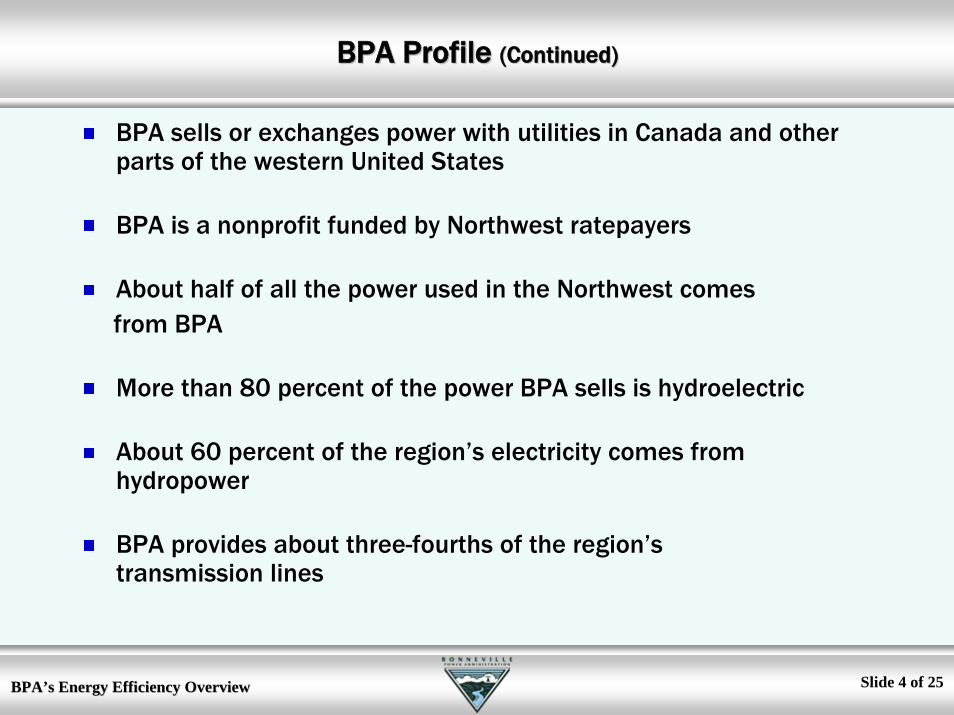
BPA Profile BPA Profile (Continued)(Continued)
BPA sells or exchanges power with utilities in Canada and other parts of the western United States
BPA is a nonprofit funded by Northwest ratepayers
About half of all the power used in the Northwest comes from BPA
More than 80 percent of the power BPA sells is hydroelectric
About 60 percent of the region’s electricity comes from hydropower
BPA provides about three-fourths of the region’s transmission lines

Slide 5 of 25BPA’s Energy Efficiency OverviewBPA’s Energy Efficiency Overview
BPA’s Energy Efficiency MissionBPA’s Energy Efficiency Mission
Northwest Power and Conservation Act of 1980 mandates BPA to meet load growth in the Northwest
Conservation is the first “resource of choice” and gets a 10 percent credit for cost-effectiveness
Since 1980, BPA has pursued energy efficiency through a variety of initiatives and funding levels
Since 1980, conservation is the second largest source of power in the Pacific Northwest, exceeded only by hydropower

Slide 6 of 25BPA’s Energy Efficiency OverviewBPA’s Energy Efficiency Overview
BPA’s Historical Conservation SavingsBPA’s Historical Conservation Savings
Only Grande Coulee and John Day dams produce more energy on an average annual basis than BPA’s conservation programs.
1,000
900
800
700
600
500
400
300
200
100
0
1982 1983 1984 1985 1986 1989 1988 1889 990 1991 1992 1993 1994 1995 1996 1997 1998 1999 2000 2001 2002 2003
Residential
Commercial
Industrial
AgriculturalMulti-sector
Building Code
MarketTransformation
Con/Mod
Cum
ulat
ive aM
W
Adjusted Cumulative Savings (aMW)FY 1982 through 2003

Slide 7 of 25BPA’s Energy Efficiency OverviewBPA’s Energy Efficiency Overview
Delivered and Planned SavingsDelivered and Planned SavingsBPA’sBPA’s Existing Conservation Programs (Current Rate Period, in Existing Conservation Programs (Current Rate Period, in aMWaMW))
Programs 01 02 03 04 05 06 Total ------------------------------- delivered ------------------------------------ /// planned C&RD/CRC 4.6*+ 16.4+ 16.3+ 14.0+ 10.3+ 5.0 66.6 Bilateral Contracts 3.7* 21.5 20.7 14.6 15.0 20.0 95.5 (ConAug/CAA/3rd Party) Market Transformation -- 12.0 16.0 14.0 17.0 12.0 71.0 Low Income Wx -- 0.3 0.3 0.3 0.3 0.3 1.5 Fed. Reimbursable 0.3* 0.0 0.1 0.1 0.3 3.0 3.8 (non-ConAug)
Totals 8.6* 50.2 53.4 43.0 42.9 40.3 238.4#
+++++++++++++++++++++++++++++++++++++++++++++++++++++++++++++++++++++++++++++++++++++++++++++++ Rate Period Target (Steady Production) 44.0 44.0 44.0 44.0 44.0 220.0 Note: BPA’s target from all conservation programs is 220 aMW minus the 198.1 aMW we achieved in FYs 01, 02, 03, 04 and 05 = 21.9 aMW left to capture in FY 06. + - The actual numbers include the aMW savings associated with the C&RD donations to the Alliance and the Energy Trust of Oregon; they exclude the irrigation scheduling savings since they have less than a 1-year measure life. * - Because of the 2000-01 energy crisis, BPA started these programs 8 months earlier than the planned 10/1/01 launch date. # - This number represents the potential savings that could result from the approved funding levels for BPA’s conservation programs over the rate period. Because all programs will not be completed at the targeted level, these preliminary numbers will be adjusted as we get closer to BPA’s 220 aMW target.

Slide 8 of 25BPA’s Energy Efficiency OverviewBPA’s Energy Efficiency Overview
Regional Conservation Resource Acquisition TargetsRegional Conservation Resource Acquisition Targets
Note: BPA’s share is 40%, or 280 aMW total or 56 aMW/year
0
20
40
60
80
100
120
140
160
2005 2006 2007 2008 2009
Reso
urce
Pot
entia
l (aM
W) Residential –
Lost Opportunity
Commercial –Lost OpportunityIrrigated Agriculture –Non Lost OpportunityIndustrial –Non Lost OpportunityResidential –Non Lost Opportunity
Commercial –Non Lost Opportunity
From 2005 through 2009, capture 700 aMW savings

Slide 9 of 25BPA’s Energy Efficiency OverviewBPA’s Energy Efficiency Overview
PostPost--2006 Conservation Program2006 Conservation Program
3rd
Party3rd
Party
ConservationAcquisitionAgreement
(CAA)
ConservationAcquisitionAgreement
(CAA)
Utility & Federal Agency
Customers
Utility & Federal Agency
Customers
ConservationRate
Credit(CRC)
ConservationRate
Credit(CRC)
Regional Acquisition
Support
Regional Acquisition
Support
Proposed Structure, including Early Start UtilitiesProposed Structure, including Early Start Utilities

Slide 10 of 25BPA’s Energy Efficiency OverviewBPA’s Energy Efficiency Overview
Gridwise Energy Web/NonGridwise Energy Web/Non--Wires HistoryWires History
Early 1999
EnergyWeb concept evolves out of BPA strategic planning on Conservation and Renewables
2001
EnergyWeb is cover article for July 2001 Wiredmagazinehttp://www.wired.com/wired/archive/9.07/juice.html
2002
EnergyWeb concept leads to first Non-Wires report (E3, Erik Hirst, Tom Foley)
http://www.transmission.bpa.gov/PlanProj/Non-Wires_Round_Table/NonWireDocs/bpa_tbl_planning.pdf
Non-Wires Round Table is formedhttp://www.transmission.bpa.gov/PlanProj/Non-Wires_Round_Table/default.cfm?page=arc

Slide 11 of 25BPA’s Energy Efficiency OverviewBPA’s Energy Efficiency Overview
EnergyWebEnergyWeb
Residence
Factory
Wind
Commercial
Central Generation
Fuel Cell
Flywheel
Substation
Photovoltaic
Battery
MicroturbineFuell Cell Car
Regenesys
Pumped StorageDispatchable DSM
(Demand Exchange)
GISMapping
Residence
Factory
Wind
Commercial
Central Generation
Fuel Cell
Flywheel
Substation
Photovoltaic
Battery
MicroturbineFuell Cell Car
Regenesys
Pumped StorageDispatchable DSM
(Demand Exchange)
GISMapping

Slide 12 of 25BPA’s Energy Efficiency OverviewBPA’s Energy Efficiency Overview
The Energy FutureThe Energy Future
CURRENT ENERGY WEB TRANSITIONAL PROGRAMS FUTUREStage of
developmentHydrogen Economy
Organization: Linear Smart Network Self Healing NetworkGoal:
(10 years from now WSJ
mentions Smart Energy and the
world thinks PNW, just like saying chips
and think Silicon Valley)
Universal service & Reliable power for all consumers
1) to optimize loads on the electrical network2) reduce costs to consumers and utilities 3) facilitate the integration of renewable resources4) increase electrical system reliability 5) reduce environmental impacts of load growth
100% Load Factor 100% overtime All load met near real time with lowest cost (Integrated Resource Planning on a grand scale)
H2 economy - sustainable, renewable & clean (no imported oil/energy?)
Basis: Iron in ground technologiesHydro & fossils
Emerging Tech - Supports grid with temporal & locational value intelligence
Processing power, communication & control advances balances all loads and resources in real time
Efficiency valued over all else, very secure, 100% renewable generation, H2 stored for peaks
Concept Supporters:
Consumers, regulators, utilities, RTO - ISO's, ETO, NEEA, Unions
BPA, BC Hydro, DOE, PNNL, CIEDS, EPRI, E2I, NGO's, NWETC, PDC, CTED, CEC, Universities
VCs, Start ups, Investors, PGE, Pacific, NW Natural (with return on investment), Portland Business Alliance
DOE, NWHA, NHA, NGO's
Sector: All users Public Private Govt., NGOReasons: System works well Economic growth & new jobs Make $ & grow jobs Research/Policy
How to make it happen:
In place Support for regional conferences like BPA Non Wires Solutions in Sept. & NWETC, PBA Smart Energy meetings, broaden the BETC to include new technologies that lower long term utility costs and support system reliability - for end users
Technology Innovation cost recovery for utilities (PUC), regulatory change to encourage adoption of new technology purchases by utilities, involve high tech compnies like Intel, HP
Fund Technology Innovation for system efficiency & prioritze needs/technology via a public board
Generation
Transmission DistributionUltimate Customers
of Electricity
Substation
Residence
Factory
Wind
Commercial
Central Generation
Fuel Cell
Flywheel
Substation
Photovoltaic
Battery
MicroturbineFuell Cell Car
Regenesys
Pumped Storage Dispatchable DSM(Demand
Exchange)
GISMapping
MARKET

Slide 13 of 25BPA’s Energy Efficiency OverviewBPA’s Energy Efficiency Overview
EnergyWeb/NonEnergyWeb/Non--Wires Solutions (NWS)Wires Solutions (NWS)
BPA searches for cost-effective solutions for transmission from an engineering, economic, and environmental perspective
EnergyWeb and Non-Wires Solutions
Founding Member of Gridwise Alliance
Participant in EPRI’s Intelligrid Initiative
Pursuing Pacific Northwest Initiatives (e.g., Northwest Energy Technology Collaborative)
All efforts are under the NWS umbrella
BPA is integrating NWS into its transmission planning process

Slide 14 of 25BPA’s Energy Efficiency OverviewBPA’s Energy Efficiency Overview
Non Non –– Wires Solutions (NWS)Wires Solutions (NWS)
The Bonneville Power Administration (BPA) wants to ensure it is providing the most cost-effective solutions for the region’s transmission needs, from an engineering, economic, and environmental perspective
BPA is investigating how to fully and effectively integrate Non-Wires Solutions into its transmission planning process

Slide 15 of 25BPA’s Energy Efficiency OverviewBPA’s Energy Efficiency Overview
NWS NWS –– AccomplishmentsAccomplishments
Established a Non-Wires Round Table
Meets quarterly
Comprised of regional stakeholders & industry leaders
Addresses barriers to NWS implementation
Lost revenues for BPA and distribution utilities
Lack of incentives for distribution utilities to do accurate forecasting
Lack of coordination and transparency in transmission planning process
Poor price signals
Reliability of NWS to transmission upgrades
Funding, implementation -- who is responsible?

Slide 16 of 25BPA’s Energy Efficiency OverviewBPA’s Energy Efficiency Overview
NWS NWS –– Accomplishments Accomplishments (Continued)(Continued)
Completed a number of NWS analyses, developing BPA’s expertise
2003 Analyses
Olympic Peninsula
Kangley-Echo Lake
Lower Valley
2004 Analyses
North Idaho
Southern Oregon Coast
Olympic Peninsula Detailed Study
EE Measures Reliability Study
RFP for Pilot Demonstrations

Slide 17 of 25BPA’s Energy Efficiency OverviewBPA’s Energy Efficiency Overview
NonNon--Wires Wires –– Accomplishments Accomplishments (Continued)(Continued)
2005 Activities
Screen all transmission projects for non-wires opportunities
Pursue implementation of non-wires solutions for
Olympic Peninsula project deferral
2006 Activities
Continue pilots in the field
Complete detailed study of southern Oregon coast resource availability
Screen all transmission projects for potential NWS

Slide 18 of 25BPA’s Energy Efficiency OverviewBPA’s Energy Efficiency Overview
PROJECT COMPONENTS EXPECTED MW
Demand Response ≥ 16
Direct Load Control (DLC) ≥ 20 (5 from pilots)
Distributed Generation (DG) 0
Energy Efficiency 15
Total 51
Sample ProjectSample Project
Developed draft package of NWS measures for the Olympic Peninsula Transmission Project Deferral(MWs shown are all in public’s service territory)

Slide 19 of 25BPA’s Energy Efficiency OverviewBPA’s Energy Efficiency Overview
Olympic Peninsula Transmission Project DeferralOlympic Peninsula Transmission Project Deferral
Five (5) year transmission deferral needs about 50 MW
Proposed non-wires solution measures capable of at least 5-year deferral
Portfolio passes Total Resource Cost Test
Puget Sound Energy through DG & EE could potentially contribute additional MW
BPA’s Transmission Business Line NWS portfolio costs less than avoided cost of transmission
Slide 20 of 25BPA’s Energy Efficiency OverviewBPA’s Energy Efficiency Overview
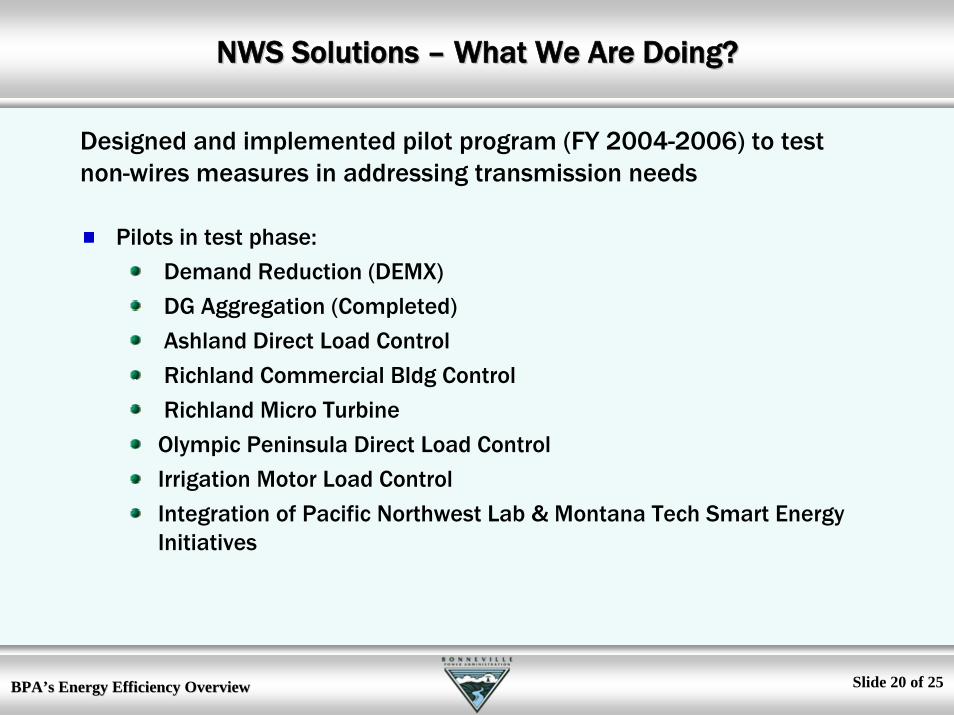
NWS Solutions NWS Solutions –– What We Are Doing?What We Are Doing?
Pilots in test phase:
Demand Reduction (DEMX)
DG Aggregation (Completed)
Ashland Direct Load Control
Richland Commercial Bldg Control
Richland Micro Turbine
Olympic Peninsula Direct Load Control
Irrigation Motor Load Control
Integration of Pacific Northwest Lab & Montana Tech Smart EnergyInitiatives
Designed and implemented pilot program (FY 2004-2006) to test non-wires measures in addressing transmission needs

Slide 21 of 25BPA’s Energy Efficiency OverviewBPA’s Energy Efficiency Overview
GoalsGoals
Near-Term
Demonstrate Gridwise/EnergyWeb concepts in the field
Long-Term
Use Gridwise/EnergyWeb concepts to:
Defer needed system improvement projects
Enhance Pacific Northwest system efficiencies

Slide 22 of 25BPA’s Energy Efficiency OverviewBPA’s Energy Efficiency Overview
Montana
CaliforniaNevada Utah
Wyoming
Idaho
Washington
Oregon
Twin Falls
Idaho Falls
Helena
Butte
Jackson
LibbyKootenai
SpokaneSeattleKangley
TillamookPortland
Boise
Ashland
Bend
Brookings
BPA Service Territory
Coeur d’Alene
Eugene
Olympic Peninsula(1,4,5,7,8)
Kangley-Echo Lake (5)
Richland (2,3)Tri-Cities (6)
Ashland (1,2)
S. Oregon Coast (5)
N. Idaho (5)
Lower Valley (5)
Portland (3)
1 – Direct Load Control2 – Load Control3 – Micro-turbine4 – Distributed Generation
5 – Study6 – Irrigation Motor Load Control Pilot7 – Demand Reduction8 – Grid Friendly Appliance
BPA NWS ProjectsBPA NWS Projects

Slide 23 of 25BPA’s Energy Efficiency OverviewBPA’s Energy Efficiency Overview
Montana
CaliforniaNevada Utah
Wyoming
Idaho
Washington
Oregon
Twin Falls
Idaho Falls
Helena
Butte
Jackson
LibbyKootenai
SpokaneSeattleKangley
Tillamook Portland
Boise
Ashland
Bend
Brookings
= BPA Service Territory
Coeur d’Alene
Eugene
1 – Direct Load Control2 – Load Control3 – Biomas4 – Co-Generation
5 – Policy Development6 – Fuel Cell7 – Demand Reduction8 – Wind Farms
9 – Solar10 – Cold Climate Heat Pump
OPALCO Under Water Cable Deferral (1)
Newberg (4)
Tillamook (3)
Chelan County PUD (9)
Ashland (9)
Milton-Freewater(1)
Portland(3, 6,10)
Vancouver (6, 9)
Bend (6)
Salem PUC (5)
Klamath Falls (10) Burley (10)
Aberdeen (9)Ellensburg (9)Tacoma (9)
Okanogan (9)
Eugene (9)
Foote Creek Projects (8)
Stateline (8)
Condon (8)
Klondike (8)
Other Other EnergyWebEnergyWeb ProjectsProjects

Slide 24 of 25BPA’s Energy Efficiency OverviewBPA’s Energy Efficiency Overview
SynergiesSynergies
The Pacific Northwest is a leader due to active federal, state, public, and private groups with a strong commitment to NWS
NW Energy Technology Collaborative: PNW labs, Avista, Puget Sound Energy, Washington State, BC Hydro, Tacoma Power andLight, Snohomish PUD
Pacific Northwest Gridwise Test Bed: Portland General Electric, PacifiCorp, City of Post Angeles, Mason County PUD #1, Mason County PUD #3 BPA, Whirlpool, PNW labs, Montana Tech Grid Testing Facility
Gridwise Alliance BPA chairs Demonstration Committee
Intelligrid Initiative: Participant
Gridwise Architecture Committee: Member

Slide 25 of 25BPA’s Energy Efficiency OverviewBPA’s Energy Efficiency Overview
Synergies Synergies (Continued)(Continued)
Olympic Peninsula Demonstration: PNL, BPA, AREVA, Celerity Energy, City of Port Angeles, Mason PUD #1, Mason PUD #3, Clallam PUD, Montana Tech Grid Testing Facility
Intellegrid Initiative – Founding Member and Participant
Gridwise Architecture Council: BPA participant is Don Watkins
Poised for Profit Study