Embed Size (px)
Citation preview

r
DOCONENT'RESWIE
1ED 155 202 TM 007 114
AUTHOR Boyd, Lenore A.; Chissom, BradTITLE The AAMD Adaptive Behavior Scale--Pdblic School
Version: A Normative Study.INSTITUTION' Texas A and M Univ., College Station. Coll. of
Education.-PUB DATE 77NOTE 40p.; Appendix may be marginally legible due to small
type
EDRS PRICE MF-$0.83 HC-$2.06 Plus Postige.DESCRIPTORS *Adjustment (to Environment); *Behavior Rating
Scales; Educable Mentally Handicapped; ElementaryEducation; Handicapped Children; Item Analysis;'Learning Disabilities; Maturity Tests; *MentallyHandicapped; Norms; *Screening Tests; SpecialEducation; *Student Placement; Test Reliability;*Test Validity; Trainable Mentally,Handicapped
IDENTIFIERS *Adaptive Behavior Scale; Test Length
ABSTRACTThis normative study of tlie American Association on
Mental Deficiency (AAMD) Adaptive Behavior Scale -- Public SchoolVersion was based on 291 Texas public school children.flivided into 12categories. The categories were: age, ethnic, or racial groupwhiteor non-whiteWand assignment to regular classes cr special educationclasses for the educable mentally retarded, trainable mentallyretarded, or learning disabledPart-I-of-the-scile was emphasized inthis-;cport;--it-gf-ovides measures of independent functioning,physical development, economic activity, language development, numberand time concepts, vocational activity, self-direction,reponsitility, and socialization. Reliability estimates were based onthe total group includipg eight, tenl'and twelve -yea; old children. ,
Item validity analysis was based on the discrimination betweenregular and special education groups, although it appears tiat theraters ew the ,group membership of the children at the time theymade th-A;j,tings. The norms from this study were found to be similaito the or gindl,AAMD norms for this-scale. The authors suggeit thatthe construction and validation of a shortened version of the scalewould be useful; and that it has potential for screening children for'placement in special education classes.' (CTM)
4:0
************************************************************************ Reproductions supaied by EDRS are the best that'can be aide * \* from the original document. , ************************************************************************
. ,,
1111116,

toto
U S DEPARTMENT OF HEALTH,'ft ,,.,
EDUCATION & WELFARENATIONAL INSTITUTE OF
EDUCATION
I
THIS DOCUMENT HAS BEEN REPRODUCE 0 EXACTLY AS RECEIVED FROMTHE PERSON OR ORGANIZATION ORIGIN-ATING IT POINTS OF VIEW OR OP)4IIONSSTATED 00 NOT NECESSARILY RERRESENT OFFICIAL NATIONAL INSTITUTE OFEDUCATION POSITION OR POLICY
4
PERMISSION TO REPRODUCE THISMATERIAL HAS BEEN GRANTED BY
TO THE EDUCATIONAL RESOURCESINFORMATION CENTER (ERIC) ANDUSERS OF THE ERIC SYSTEM '
S

A
/,
I
1'
izr
The AAMO Aldaptive Behavior Scale--Public
School Version: A Normative Study
by
Lenore A. Boyd and Brad Chissom
9
Final Report of a Research Project Funded by= The College,of EdUcation
Texas AM UniversityCollege Station, Tex4S' -77843
3
St.a
1977
a,

Acknowledgements
c' We sincerely appreciate the efforts and assistance of many teachers
and other school personnel in the recording and collection of information.
We wish to acknowledge the direct contributions Of the following school
districts and cooperatives and express our appreciation to, for
sharing their data:
A&M,Consolidated Independent School District, Special Services;
Brenham Independent School District, Special Services;
Bryan Independent School District, Special Services;
Giddings Special Services Cooperative:
Lamar Consolidated Independent School District, Rosenberg, Texas;
Navasota- Anderson - Shiro - Richards Special Services Cooperative;
Robertson County Special Services Cooperative.
in addition we wish to acknowledge with sincere appreciation the
time and effort contributed by the following graduate assistants,
//
DermTtmem4of Educational Psychology: Richard Baither, Gary Elkins,
Shirley Gruen, Robert Henry, Frank Miller and Robert Rios.
4
Lenore BoydBrad Chissom
THE AAMD ADAPTIVE BEHAVIOR SCALE--PUBLIC SCHOOL VERSION:
A NORMATIVE STUDY
ABSTRACT
,.Many state agencies have ruled that assignment of students to
special education classes for the mentally retarded must be determined
by assessment of verbal, performance, and, adaptive behaviors. The AAMD
Adaptive Belfavior Scale -- Public School Version was subjected to a'
normative and validation study using 291 subjects from the southcentral
area of Texas. Normative and validity data were collected and analyzed
from groups of regular and special education students, both white and
non-white, at 8, 10, and 12 years of age. Results were compared to the
original normative data provided in the AAMD Manual and, ndicated that
(1) the instrument is effective in discriminating between regular and
special education groups; (2) a shortened version may be feasible and
more practical; and ..(3) the derived total score may be useful and
effective when used as a cut-off score for placement in special education
.... for the mentally retarded.
A
ve.

.Th Adaptive Behavior Scale--yublie School Version:
A Normative Study
The oconcep f adaptive behavior as a criterion for judging degree
or. extent of mental retardation is not new. The requirement for its
formal assessment, however, is a current issue of much interest. Since
the publication of the Stanford-Billet Increasing emphasis has been
plaCed on standardized intelligence test scores to define mental retard-
ation. Such scores, namely IQ's, have often been the major criterion
fbr determining mental deficiencies in school-aged Children with sub-
sequent classification, labeling, and placement in special education '
programs for the retarded.
Use of the LQ as the primary or sole criterion for defining
retardation has proved to'be less than satisfactory. Most of the tests
available were standardized on white, middle-class populations and are
increasingly viewed as biased and discriminatory when used with minority
. groups who are culturally or economically different. Emphasis on IQ's-,
has resulted in the inappropriate classification and placement of many
children whose learning difficulties were in fact due to differences in
4
language, cultural, or economic background (Mercer, 1973), Because of
the` disproportionate number o-children from minority groups in 'classro*
for the mentally retarded, the use'of a measure of adaptive behavior has
been added to the requi4ements for assessment of mental retardation.
'Texas Education Agency Guldelines (TEA 1976) s'tate specific
regulations for determination ot pupil eligibility for placement in 'a
special education program, for theyntall retarded. A comprehensive
appraisal must now include the assessMe of'verbal
41
6 ,4

2 el.
performance abilities, and adaptive behaviors. Classification and
placement in an educational program for the mentally retarded is
merited only when scores on all three scales are two or mere standard
...deviations below the mean for the general population. As is true in
.many other states, these Guidelines also provide lists of approved
tests Ito be used in the evaluation of verbal, performance, and adaptive
behaviors.
A ,recent survey by Morrow and Coulter (1977) identified a number
of measures of adaptive behaviors available to the practitioner. Only
two, however, were placed on the approved Texas list: Mercer's
Adaptive Behavior Inventory for Children (ABIC) and the AAMD Adaptive
BehaviorScale --'Public School Version (ABS-PSV). Since Mercerrs scale
will not be available to the general public 'until its release by the
Psychological Corporation, the ABS-PSV is being widely used in Texas.
. ° The ABS-PSV gists of two parts. Part One organized along
4 developmental lines, is made up of.56items. It, is designed to evaluate
-an individual's competencies in nine domains: Independent Functioning,
Physical Development, Economic Activity, Language Development, Number and
Time, Vo ational 4Ctifity, Self-direction, Responsibility, and Social-
ization. Part Two is desjgned to measure or evaluate maladaptjve
behaviors closely related to personality and emotional disorders. Part
II is yieWed as less important in the assessment of mental retardation
and of limited usefulness. The present study, therefore, is concerned
with# j
data collected by use of Part One of the ABS-PSV.
The ABS-PSV is primarily restandardized.version of an instrument

)kv
I3
widely used with severely handicapped, institutionalized retardate's:
Normative data available in the Manual (Lambert, Windmiller, Cole &
Figueroa, 1974).were obtained from teacher ratings QT. approximately
'2600 children from 14 California schoOl districts.,-The standardization.1
sample included an equal number of boys and girl% ages 7 to 13 from
three ethnic groups in regular and special education programs.
The purposesof this study were to collect normative.data for the
ABS-PSV for children in Texas schools and to determine the validity of
the instrument in disp'iminating between children in special education_
and those io regular education programs. Data collected in this-tudy
may then be compared to the California' data provided in the AAMD Manu'al.
Specific objectives for this study were: 4
\
'1) To establish normative data forthe AAMD. Adaptive Behavior
Scale--Public School Version for Texas children in three age groups, 8;
10; and 12c from three ethnic groups in regular and special education
programs;
2) To determine the,validity of the instrument in discriminating,
I ,
between children identified as special education and those in the.regular
curriculum. An item analysis will be conducted "to assess the discrimina-
tion ability of each item.
3) To.compare normative data obtained fromthis study Texas4
childrenwith norms provided by the AAMD.
4) To determine the feasibility of establishing a shortened
version of the scale based on normative and validity data obtained from
o'
'I.
-
the investigation.
PROCEDURES
'ects
The Region VI Educational Service Center area served as the focal
point for the data collection procedures, and subjects were selected
from an area within a sixty mile radius of Texas A&M University. A-
total of 291 subjects were included in the sample. The ABS -PSV forms
were completed for each subject by classroom teachers. This represents
'an important aspect of the data collection process. If adaptive
behavior can be adequately assessed by a classroom teacher, then it may
not be necessary to collect data from parent interviews and other sources
that are not as readily available.
A workshop was held at Texas A&M University to assist teachers in
. data collection techniques and procedures for the Adaptive Behavior
Scale. In addition to the workshop, consultantskere available to
assist teachers with problems encountered in the data collection process.
The subjects for the study were divided into three age groups, 8,
10% and 12-year olds. For comparison purposes, age ranges for each group,
were calculated in months as follows: Age 8: 84-108 months;:Age 10:
109-132 months; and Age 12: 133- 1.57' months.
The stratified sampling procedure of the original proposal called
for subdivision by ethnicity into groups of white, black, and Mexican-
American subjects. Due to the difficulty in obtaining subjects in the

5
Mexican-American category,dthe sample was classified, only as white and
non-white groups. In addition, subjeCts were selected from the categories
of regular and special education. Any subject classified by the school
as Educable or Trainable Mentally Retarded (EMR or TMR)o;' Learning
Disabled (LD) was assigned.to the Special Education category.
Table 1 indicates the number of subjects forpach of the
categories described. Of the totarsample of 291 subjects 41% (119) were
TABLE 1
Table of Subject Groups byAge, Ethnic Group, and School Classification
Regular Special
Age 1hite Non-white Total White Non-white Total
8
10
12
Total
11 51 62 18 47 65
14 23 . 37 20 49' % 69',
2 10- 12 9 37 46
27 84 111 47 133 180
female and. 59% (172) were male. These percentages Were approximately the
same for, most of the categories previously described.
Data Collection .
The ABS-PSV forms were completed for each subject by classroom
teachers. Demographic data was used tb calculate a measure of socio-,
economic status (SES) and IQ's were obtained when available. SES
.10

. ..4.0.- -
.0
_ *
3
'information was collected for 162 subjects and IQ scores were available
for 170. The.data were collected from public Schools who valunteeed to
participate in the Spring of 1977 following the workshop previously
described.
Results.
Data were analFzed first to determine the reliability of eachlof the
nine subscales. These reliabilities were internal consistency estimates
calculated through thezaverage correlation among scale items. As shown
in Table 2,.these tenability estimates were'sat;isfactory for most of
the suebscaleS with .the,lowest reliability coefficient Of .68 ia.the
PhysicalDevelopment domain.
TABLE 2 ft
INTRASCALE RELIABILITIES -
Scale Reliability
I. Independent Functioning .916- .92
II. Physical Development .681 .68
III. Economic Activity ,.810 r .81
IV. Language Development .872 .87
Ir.. Number and Time Concepts. . -
.786' .79
VI. Vocational Activity .859 .86
VII. Self Direction .779 .78
VIII. Responsibility .796 .80
IX. Socialization .779 .78
,
Objective One as modifiekwaS to establish normativ0 data for the.
s
1
k
4
t

4
7
ABS-PSV for white and non-white gyps And for regular and special.--,
. ;,s
education classificAations. Norm tables (Appendix) are presented_with. . . ..t
percentile equivalents for the raw scores for each subscale and for a
derived total score. The norm tables were constructed to resemble the
formatused in the AAMD Manual' for ease of comparability with the-.
original data.- The major deviation from the preVious norm tables is the
IncTusion'Of the derived total score.
Objective Two of this-project was to etermine'the ability of each
of the 56 items and the total scores from nine'domains to discriminate
between groupS of subjects identified as regular or special education11.
students. In addition to the item validity inforMation and domain.
. 0
score.lidity data, it was important to determine whether or notk
items in the scale were related to. the subjeCt characteristics of
.ethnIcity, sex, or SES: The results of,the correlational analyse
between items and ethnic group, se, and SES are shown in Tables 3,.4, cz,
and 5 respectively. (See pages 8'thrul0).
An inspection of the tables shows little indication df discrimination
on the part of scale items for any of the three variables of concern. No
pattern is apparent in the data, and items Were seldom repeated as
discriminating among. the 18 categories of analysis. Thus only a few
specific, unrelated items in the total scale appear to discriminate on
the basis of ethnic group, sex or SES.
Results of the final analysis, the correlations between items and
classification (regular vs special education) and correlations between
domain total scores and classification are contained in Table 6. (See
1 .2-Na
,

01.
TABLE 3
SUMMARY OF CORRELATIONS BETWEEN ITEMSAND ETHNIC GROUP (WHITE VS. NON:WHITE)
BY AGE AND CLASSIFICATION
Number of -
Domains Items Items which were significantly correlated with ethnic'group
I. Independent
, 8
Age Group and Classification
10 . 12
Reg. Spec, E291 Pfe, Rs, Spec.
Functioning 17 % N$* 17- NS 14 NS NS
II. Physical
Development 6 NS 23 NS '24 NS NS
III. EconomicActivity 4 NS NS NS, 31 NS NS
IV. LanguageDevelopment '9 , NS NS 32 NS NS NS'
V. Number and TimeConcepts 3 NS , NS NS. NS NS NS
VI. Vocational Activ. 3 NS NS NS.
50 , 'NS NS)
'VII. Self Direction 5 - NS 56 NS 55, 57 NS NS
VIII. Responsibilitya2
NS NS. NS NS 58 NS
IX. Socialization 7 62** NS NS NS NS
T tal Number of 56 1 3 1 6 1 0
S gnificant Items
*NS= None Significant **Actual Item NuMber.from Scale7
3

.
t
-' TABLE 4
- SUMMARY OF CORRELATIONS OF ITEMS WITHSIGNIFICANCE OF SEX BY AGE AND CLASSIFICATION,
DomainsNumber of-Items Itebs which were significantly correlated with sex
Age Group and Classification
10 . 12
Reg. Spec. Reg. spec. Ea, Spec.
I. IndependentFunctioning ' 17 NS* NS NS NS NS NS
II. Physical
,Development.
6 ,NS NS NS NS NS NS
III. EconomicActivity
IV. 'Language .
41 NS NS NS NS NS ' NS
Development 9 NS NS.
NS NS 32 NS
V. Number andConcepts 3 NS. NS NS NS NS NS
VI: Vocational Attiv. 3 NS NS ' NS NS NS NS
VII. 'Self Dir'ection 5 'NS .. NS '.NS NS NS NS
yin. Responsibility 2 NS NS NS NS NS
IX. Socialization 7 NS 59** NS NS NS NS
Total Number of
Significant Items 56 ° 0 1 0 0 1 0
15
*NS = None Significant **Actual Item from Scale
16

- TABLE 5
SUMMARY OF CORKLATEAS OF ITEMS WITHSOCIO - ECONOMIC STATUS BY,AGE AND CLASSIFICATION
.
Domains
I. Independent 'Functioning 17 NS 17 NS 3, 15 NS NS
./
II. PhysicalDevelopment 6 NS 26 NS 24 NS NS
III. Economic.
Activity 4 11S NS NS NS NS NS
IVLanguage,.Development" . 9 NS NS 32, 40 'NS 4 NS NS
l' I
V: Number andTime Concepts 3 NS NS NS NS
VI. Vocational Activ. 3 NS NS NS NS
VII. Self Direction 5 V NS NS NS
VIII, Responsibility 2 NS NS NS NS
IX. Socialization 7 62 ** NS 0 NS 65
Total Number of'
..Significant Items 56 1 2
Number ofItems
Items which were significantly correlated withSocio-ecOnomic status
Aige Group and Classification .
8 10 125 Reg, Spec. Reg. Spec. Reg. .Spec.
4
17
2 4.
NS NS
NS NS
NS NS
NS NS
NS NS
*NS = None Significant **Actual Item Number from Scale
O
18

0.4 0
de
ao 00 4
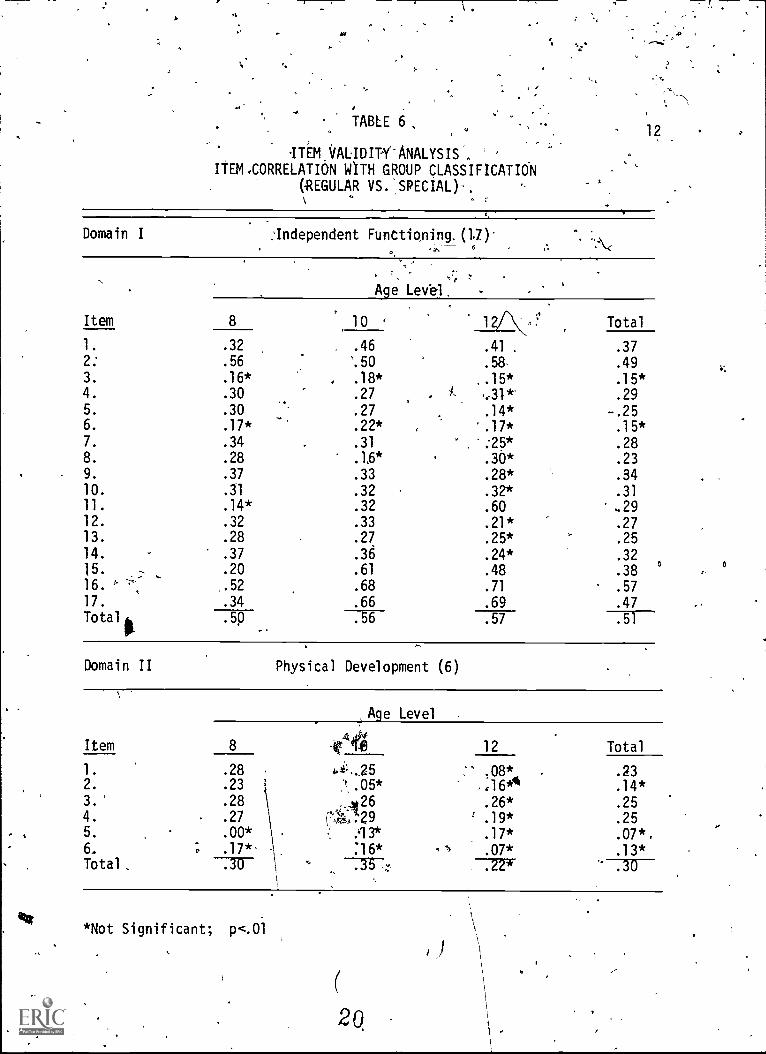
pages12 --14.).' It should be noted that a major portion of the 56 items
. within the Hite domains discriminate satisfactorily betwe n regular and.4
special education groups at each of the three age levels , 10, and 12,
and fOr the total population. There he a few items that do not appear
to be functioning as intended, however, most of them at the upper age
level. Their deletion from the scale might aid in the Tevision of the
procedure.
Obj ctive Three was to compare the normative data obtained from
this st dy 'of Texas children With the norms provided by he AAMD. A
visual inspection of the two sets of norms indicates a h igh degree of
agreement, between the norms obtained from the present study and the1
original California.data. No further comparison was considered
Inecessary once it was established that there were no major discrepancies
between the two sets of norms. . A total score was calculated for theI
instrumentIand norms provided for subjects-in this study. \De originalI
normative dta did not provide a pleasure like this, and fur her research
. -
seems warra\
ted concerning. its usefulness.
The fin 1 objective of this project'was to examine the- possibility
of shortening the Scale by discarding items that are not funqioning
well within the scale. One of the problems with the ABS-PSV W been
the amount of time required to record the )-if rmation. If theIscdle
can be shortened by deleting itenis,it would e more practical \for use
by'classroom teachers. Theresults of ,this project indicate tht
several items may be discarded from the scale without changing 10s.
overall effectiveness. IA shortened; version will need to be valiatedI°
19
rr
i.
F
TABLE 6 ,
ITEM VALIDIY'ANALYSIS'ITEM,CORRELATION WITH GROUP CLASSIFICATION
(REGULAR VS.'SPECIAL)0,
12
Domain I :Independent Functioning, (1!)'"..\<
Age Level.
Item 8 10 Total
1. .32 .46 .41 . .372: .56 '.50 .58, .493. .16* .18* .15* .15*4. .30 .27 ..-31*' .295. .30 .27 .14* -.256. .17* .22* .17* .15*7. .34 .31 :25* .288. .28 .1,6* .30* .23
9. .37 .33 .28* .3410. .31 .32 .32* .31
11. .14* .32 .60 .2912. .32 .33 .21* .2713. .28 .27 .25* .25
14.
15.
.37
.20
.36
.61
.24*
.48
.32
.38a
16. ,.52 .68 .71 .5717. .34 .66 .69 .47
Total. .5p .56 .57 .51
(es
Domain II Physical Development (6)
Age Level
Item 8 12 Total
1. .28 .08* .232. .23 ;1604 .14*3. .28 26 .26* .254. .27 .29 .19* .255. .00* .413* .17* .07*.6. .17*- :16* "ts .07* .13*Total .30 .35 .22* .30
*Not Significant; p<.01
)
2Q

0
13
Domain III Economic Activity (4)
Age Level
Item 8 10 12- Total
1. .43 .73 .70 . .572. .37 f- .55 .67 .463. .34 '.46 .33* .32-4. .57 .44 . .46 .43.
Total -7-56 .65- .65 7 , .55
Domain IV Language Development (9)'
Age Level
Item / 8 10 'Total .
1.
2.
.55
-.09*
.53
-.11*
.55
.06*
.51
-.08*.3. .28 . .31 .35 .32
.4. .37 .35to
.32* :355. .206. .67 .60 .57 -.607.. .35 .20* .41 .,298. :44 .29 .25* .32
9. .48 .50 ..65 .49
Total .55 .49 .53 .49
Domain .V Numbers and Time (3)
Age LeVel
Item 8 10 12 Total
1.. .37 .27( .20* .29'2. :52 ' ..40k .42 .453. . ..57 .40 .42 .45Total .60. - .56.--,, .59
,75T7--.
* Not significant; p<.01
ow.

,
o \
0
1
DoMain of - Vocational Activity (3)
Age Level,
.
Item 8 10 . 12
i~
TOtal1.. .11* , .29 .58 ;23
.35 .30 444 1 .353.
,,
.30 .33 .38 .32
Total - .33 .34 .46 .35,1-
dmain VII Self Direction. (5)'
Age LevelI
Item' 8 10 12 Total
. .31 .22* .45 .30
2,. .37 ,.31 .45 , . :,373. .23 .39 .28*/ .27
4. .29 .38 .44 .355. .35 A0 .41 \ .37
Total .41 :47 .54 , .45
Domain VIII Responsibility (2)
Age Level
Item 8 aall 12 Total
1. .22* .18* .47 , .22'
:31 .30
.29 .27 .52 .31
Domain IX , SoCialization (7)-
Age Level4
Item g 8 10 12 Total
1. .32..
".29 .,7* .322. .16* .35 .33* .24
3. .10* .39 .34 .20_
4. .32 .18* .16* .225. .22* .40 .50 p.31
.22* -.22* .29* .247. .28 .24* .25* .27
Total .34 741 .44 . .38
*Not Significant; p<.01
22
I
15
with' Other samples of subjects, but the results indicate that such an
effdrt may be feasible.
SUMMARY AND IMPLICATIONS
''A review of the findings of this investigation indicates that the
ABS-PSV seems to.bea suitable and effective instrument for measuring
adaptive behavior within the limits of the AAMD definition. The
majority of the items lied adequate discriminatory power to differentiate
between regularand special education groups. However, since a.few
specific items do not appear to be adequate discriminators, it is
°yecommended that a shortened version of the instrument be devised and
validated Deletion of such items could save data collection time and
effort, which are concerns often expressed by those using the Adaptive,
Behavior Scale in its preSent form....
.Further attentjon should be devoted to the use of the derived total
score since it seems to be a satisfactory discriminator between groups
of regular and special ed6cation students. It appears to have potential
yse.in screening children who are being 'considered for possible placement
.. " .0%tpeti41,3 education classes. 65",,
, . , .`f '',.,, -. .. ..--- Further replication of this study is:recommended to add more
,:information to the present bank of normative data. With additional
information about the instrument available to educators"faced w4th the
-prgblems of assessing adaptive behaviors, the AAMD Adaptive Behavior
Scale-Public School Version may p;dve to be an effective procedure.
23
,e0.411"
A.

.4
References
6
16. .
Lambert,,N., WindMiller, M., Cole, L., & Figueroa, R. AAMDAdaptive Behavior Scale: Public School Version." Washington, D.C.:American Association on Mental Deficiency, 1974.
Mercer, J.R. Labeling the mentally retarded: Clinical and socialsystem perspectives on mental retardates. Los Angeles: Universityof California Press,1973.
Morrow, H.W. & Coulter, W.A. A collection of adliAve behavior measures.In Coulter, W.A. & Morrow, H.W. (Eds). The concept and measurement ofadaptive behavior within the scope of psychological assessment. Austin,Texas: Texas Regional Resource Center, 1977.
Texas Education Agency. Administrative Guide and'Handbook for SpecialEducation (Revised). Austin, Tx.: 1976.
10-
r.
24

,.
P-""-.....".."..'".,"..........'"A .... .4.. .... 00000000000.0,0,00.0,0,0.0,0.
JMCOCOMM0,0,000,0000000000
NO
0...J4.00-4.40-.J4aWMJ2470,-.J4aW0J0,00-.J4.00,J0,00-.J4.00,200-.J4aWCAJm00-6J4a0smJm0.+j,,,,,,,m0orJ4a010,00
2
~'1
Ul
U,
CA
CA
r7,
C7,
4MN
J J
411A,
J. 0
"
Ut
N N N
Q.48
N 00,
Ut
CO
O
0a
U,
rs
0 J
CO
O
-a
CO
0,
cy,
NCO
CO
mm
CO
0,
U,
LI,
Ne
0a
1.11
-0
On.
1I.
r0 0 0
000
0 0
JJ
a0,
.)
NN
0 4
0 V.
0
rr-

1)1
PART I
Class 5pidEthnic Al
PROFILE SUPMARY -- ADAPTIVE BEHAVIOR SCALE Sox TAIAge
r.ou
o..aC
ka
I,
a, 0c C...0 CC00 .CL1.713 CC 7..1..
II
IatC0
.-. a01.70..0»
, r .'CI. 0
III
u ->..6.40C.0a+
1.7
t./ 0
IV
.C
CO00110Z.00C>
IIEW40
V
u.0C U
c0
li. I-06 E3,4a k
VII
-oc C.0. .40.1.70>.0
VIII
co.I u4.4
.... la0.C00
IX
5............0
C00II0
X
co...
a;0N
..a
oom
....S
12
.
.4,
:
999897969594939291
908988878685 ,
84838281
8079787776 '7574
3237271
70. 6968676665646362
416059585756
, 555453 ,
--,5251504948474t,4544434241
40 1
39383736353433323130'
29.28
2726252423 "222120'i1918171615141.5
1711100
Y. .
7 '
6
543
2
1
0
75
a y
Sit
72
70
69
-
68
67
66 \_..
65
64,
.62
61
56
'55
54
5251
50 ,
47 ,
46
'
44
.
42l'
40
38
36,
35
28
27
26
25
24 -,
-
24
C?
.
,
'----.,
ary.
...
23 '..
.
22
21
.
.
20 .
'"19
18
17
16
*.
15
14
9
1110
9
7
-
6
5
. .
q
3
, 2
-
0
0
r
.
36
34
33
32
-
31
30
-
?9 .""
28
-27
26,
'
25
24'
23
i22
21
.
20
1$.
18
17
1615
1413
12.
11
108
7
1211
109
8
.
.
7
..
5
.
g
3
'2
1
0
11
10
-
9
-
8
7
6
5
3
2
1
0
q
201918
.
.
17
/
16
, .
41.c.,
15,
1
.
14
13
12 4
11y
.
10
-..
9.
8
1
7
6. .
5
4
6
.
1
.
4
%
3
,
1
2
1
0
26
25
..
24
23
22
21
20
19
.
18
17
16
15
14
13
11
9
,.
.
212209204
.
200
199
195
194
193
191.
190
189
184
181 -
180
172
170
168
167
162
.
158 .
153
146
145
143
139
138
137
129
124
121
114
111
108
02
98
94
90
89
87
77
43
66
N -865
27 _
0

t I
u .41.
."
........
,0 017,0 MO. 00,,,,,,,,,,M 00/000020202 0 .15.0.0000.0.1.1013
0,NWO.J1M,.00,,,OMM,MCC1,,WOMM,M4117,1,1.40MM,M00,,U0MM,WC17,,W0MM,.....,,,,a0/0m,m..,,o/...../0m,mcp,,,a0mm,m.0,1,401AM,M.
_-
.4,
Per
cent
ile,,......
.,...,.
m sm
m mm ,
m . .
, _., 44
, ., m
, m.
, ,, .
, .o. o
,
. _.. "
Independent
runctioning
,
1.7 ...
1.7 ,s,
..-...
.. ...
..--
''',
1.4 0
PhY
0iC
alDevelopment
..
..
,.1.1O
_. 0
... +
a_.
to
_. W
_. 0
_.
.1"
_.
-4 -Economic
Activity
..
..
.
_. w
1.7 m
19 . ,
1... o
to ..,,
,..1.
4c.
a1.
.. ut.
W M-(... ,
m co'
m .. 0
Language
Development
<
.
o,
,
m'
`0
.., 0
.
.., -
- "- 'n
umber end
Tim
eConcectsi
c
oOD
05.
.
,
M: )
4,-
-.. o
-
_. r
Vocational
Act
ivity
-
......
.,W
0M
..
...1
.
_,..
.
...
.:1:.
...,
`0
A.'
5014::
Dirrction
C .4 ....,
2-
...,
(-
----
A.
im
mco
a_.
Responsibility
x
--
-...
,N
IP
...
...,
-.-
*7-
4-..4
-t
..." m
Socialization
t
x
to
o0 ca
. a-',,o
'0- -
a
.) 0 NI
.. 0 co
... ao
1.7
1.7 -
IV IV {A
1,1
1.4 .
K1
1.4 (A
1,1
1.4 M
1.7 . 0
1.7 w M
Part I
Total
A
z
0
>W
M1-
100
I...
OX7070

.3 OR
......
.... .
41.4
0414
.7...
......
NN
UE
.144
4444
440.
A...
A...
.000
0000
0000
0MM
MM
M00
0.4.
4.4.
4,1,
7.4.
4.4.
4070
707M
CO
MM
CO
MM
43,1
2474
343.
4747
47.3
1410
01T
.SC
ON
4 00
M70
.0N
4ALA
T40
,10+
44A
001,
0,10
+N
UA
00.4
0,10
+04
4000
,4.,.
+44
0,10
4.%
0.+
440
,p0J
.,.+
440p
0),.,
.+44
010,
00.
p °Menu".s
ppre
+04 -..
r..1
IV0
m04
4v3
o4 N
J4 fll
4 M4 .
0 0
O+
0 47u' 0
U, -.
M.
...)
U, 4
U, U
,00
.U
, -4U
,O
aIn .o
Cr, -.
Cr, u
Cr, .
Cr, ci
m ITm -4
m 03m 43
..,, 0
...,
......,
,...,
.4 U
..2 0
Inde
pend
ent
func
tioni
ng...
-.-.
O,..
-....
.a.
cr.
_. .-.
-. 41...
3.
0IV ...
1.4
...3
IV Lar4
04
0-4
Phy
sica
lD
evel
opm
ent
at .
c-,
._.
...3
(.1
0U
,M
.03
..o_. 0
-' ...3
Eco
nom
itA
ctiv
ity... ... _
-. -
.43
r4C
4-. ti,
_. M- 03
...3 -
04 NN
J 4...
3 0...
3 M' -
,
IV...
3 .IV co
,
IV .otA .
La ...tA
uN
Juca .
,
4 CA
,44 0'
.Lang
uage
Dev
elop
men
t...
O,..
),..
..
0cm
._m
.03
..o
-. ca...
...+
^lN
umbe
r en
dT
ime
Con
cect
s<
O...
..).
win
,...
.1
.m
vl_ o
_, -.V
ocat
iona
lA
ctiv
ity< ... .
O{1
M.
03.0
... 0... ...
....
IV... 4
... 0... U
,...
.M .
... .... M
- ..°Self-
11.
Dir0
CtiO
r1- ...
..4
O_.
...3
ua, .
wm
.
gesp
one$
bilit
y...
N...
...m
-. N
J... (.
1... 0
... M., M
... ....
.03
IV ...IV IV
IV (.1
IV 0IV M
"S
ocia
lizat
ion
,X
NJ
-.lo
,02
10V
"0
.0ke.
Om
-. 0 ca
-. -
.O
',0
rtt
-. -. La
-. -
.N
J (.
1ca
a-. 4 co
-. 4 V,
... ..
.00 -4
03
... U, 0
-. U, -.
-. M ..,
-. U, 4
-. U, A
-....
.M
M 0+...
...
0.0
1. -
1,
-0 . -.- . ..1
... ..
. .. Olt
... . 03
... 03 4...
a
Oa IT
... Oa .
- -
.0 .0
O+
.... .0 4
43 0-/
70U
,
......
.0.0
.43
k, 0 0...
) ...
1o. 1.
. 01,
Par
t IT
otal
e.
V 3-
V 9 0' 0 C 3 3 1 0 V 2 r.

r
A
I
-.
' 2N.
M.
'-
e.
...
,-
-,,,
NIes
" n.
, 4 ..
n.,,,
.. (A
u L
A L
A C
A <
A L
. (.1
LA
(.1
s. J
t.x4
Jt.
o $4
4. O
.tn
an
Ln 0
C. 0
, C. f
p(I
n c.
n a+
c a
+0,
0ce
. cr.
cr.
cr.
0 -4
-4-7
-.1
-.I
-.I
-.I
-.1
-4-_
.1 0
3au
aa
0ee
.y, O
ps a
s 22
. .1,
, isg
.±3.
2 n
Ven
,e, .
4 ke
. :2
.4,4t.....m-iscc-,4,.....immo440.....m.immo.........)mmo+4up..-Imm04.)...m-4mm04?...c.-.4e,o. au.c.no-smm04r4m.
..
,
Percentile seore
.
-.)
.3
.,
.
-.)
-.)
.^1 ,
..
m ,m .
Independent
runctiontng
... .
..
e4 U
1.., aPhysical
Development
....
....
.. .
. 1.4
. ..
. .
..
. u, ,
. .Economic
Activity
....
....
4
4, 1.1
.
.N
4..
..4
LA
42
, oLanguage
Development
..4
.
, "',lumber end
Time Concects
.
CAI)
C.:)
.
..
. 4
0_. .Vocational
Activity
..$
c 4 ...
,
4 -.)
... m
N °Self- 4
Direction
c ....
...
...
-
..
,neeponeibility
ce
0.
_
-
x: ..)
N
,
4
r.:
..
" ..
J
Socialization
x
'2. o
4
.., , m
..)
..) ,
..,
r.:
c..4
r.:
r.: m
--..-
---4
.
,..,
r.0
,..,
(.4 o
J o ,. cn
Dart I
Totill
Z 4'0
V 0 .1[ 0 C 9 rr

5
I
4."
PART I
Cl.., SpEdEthnic All
PROFILE SUMMARY ADAPTIVE BEHAVIOR SCALE Sex i3731.11.-
Age rr
0
eC
C0
aCC.
CC 0.
0C
C
9998979695
' 94939291908988878685848382818079787776757473727170
.68676665646362616059585756555453525150494847464544434241403938, 3736353433323130292827262524.232221201918'1716151413121110
765432
o
78
73
72
70
69
68
67
64
62
61
60
59
58
57
55
53
51
49
48
44
42
40
38
35
6
II
-Ca*>.).0MCI
2524
23
III
E.004.0 0LJC
IV
OasCoDo.C
'111
VII
00C
0C C0 Oa,
1.1.5
.0 10.E 0a.Z. 0 0
D4C
VIII
0.s
1 0.LOCI
IX
a
X
0
aa
11
9
8
7
6
3736
35
34
33
32
31
29
28
27
26
25
24
23
22 22
521 0
214
20 3' 20
19
192
18
1 . 130 11
1017
3
5 0
12 10
1 0'
9
9
8
7
4
1
19
18
17
16
15
14
13
12
11
6
5
4
26
25
24
23
22
21
20
19
17
16
15
14
13
12
1
0
215202
200
195
191
189
188
1 87
186
185
183
182
180
177
175
173
171
1 68
167
1 66
164
162
161
159
158
154
152
51
46
41
33
29
122
119
112
89
62/
14
N
46

PART
Class Ertl
Ethnic mr- 4PROFILE SUPMARr -- ADAPTIVE BEHAVICR SCALE' Sex '90th
Ann
I ( I 1 I I I IV V VII VIII IX . X
o -r.O S.u a1/' a ... 8 7« rr « . - -e c c C C. a c .... a fS'o . o 0. o c u o eDC .-*E UT. OE OC'. C T. , 0.0 CO 00 4 . 00 0 0.4 . 0C 0... 0 0 E .1 0 0 14 0 . . . C .V 00 . 4.) 0 0 3_1 0 14 S I U 0 0P.
ADODC 0 C . 0,>.0 0 0 CD
.0 0 . 4. a CIE E Dal ...6 I.. 0.
0 CD GO LIU 00 3. OU Oft. 0 \E0 .I... ao I..)C ,0 <. >.c coo cr 01
99 75 24 11 33 . 12 11 20 6 26 2049897 10 , 11 19 2596 7D95 74 .200949,3 9 9
9291, 72y
1 8,
90 8 3289 1938887 '%rt, 5 2486 6885 191848382 - 2381 3080 8
1907978 17 2277 6576757s
14
189
73 62.
72 287170 6
69 16 21180
68 61-
6766 - 27 4
65 17064 5863 266261 .
5 760 16759 555857 - .56 23 2455 158.54 ,53 4 20525150 52 , 8 15 3 534948 -....
446
51
1947 23
14644 . 14'4342 741 47 .22 1340 6 1383938 . 537 3 5 . \....---'"36 463534 183332 ' ' 1231 21 21 1730 2 13729 428 2027 44 4 ,2625 0 11 1112423 42 S.
22 20, .,21 .1
.20' 10819 19 18 1018 38 3
.1716 1615 1-02a14 .1.3 17 16 3 8 1511 ...1110 \ t 2 ' 98
28 16 14 7 ? 14`3
7 0 1 '5 14 13 6 1 95 944 25
filf''
1 9 122 .
01
34"_
. N . la.
0
k

2 Z.
il...
......
. AN
NN
NN
N V
N N
N 4
44J
4 4
4 4
4. .
D. t
......
.(ft tr
UlC
. t. N
I U3
N c
omas
Os
0, M
0, 0
, 0, 0
, 0, 0
, -4
-4 -
4 -4
-4
-4 -
4 -4
N -
4C
o O
a C
o C
o 03
Co
Co
Co
03 C
O .0
.0 .0
.0 J
3 .0
.0 J
3 D
`330
0-N
tAt.,
74.c
C0-
.4.t3
30,4
0.00
-N4.
OM
N0.
00-4
4.00
".0,
32-N
.NM
403.
00-r
O4.
4410
,400
0-4.
WM
-o.0
0-N
433.
010,
4000
-.4.
.CO
No.
00-4
..CO
NoN
..
n..,.
. 33,
..
N iN o
.---
N -.)
lo)
cplo
) c. N
t. .01 N
-.7 °
Inde
pend
ent
Fun
ctio
ning
....
.. vn.. o.
-. -3.. C
ov.
, aN _.
....."
--7
N 4N 'P
hysi
cal
Dev
elop
men
t,..
. -
-
.. '
._.
N4
''''.
'''E
cono
mic
Act
ivity
.., - ...,
.,- ts
't0,
-. co-. s,
- ul-. -3
N lo)
N tae
s, mLa
ngua
geD
evel
opm
ent
c4.)
.---
----
--
.c,
_.'
.
D.
-o
Num
ber
end
Tim
e C
onco
cts
'o
._
s.+
uo
a,-
so
-- _
. 0V
ocat
iona
lA
ctiv
ity,c ...
, -
.cn
.
cr
.m
'0.
-. 0S
elf-
Dire
ctio
n.. - .
.-.
NL
A,
onsi
bilit
e py
.
.-. x
6
41.
r rr 4
r ar o
r 0 1....
....
1:3
Soc
ializ
atio
n-
x
o ON
4.
-3 -30 -3
C° .0
.0 0-. o N
_. N ....
. N 33
,, a 4.0
0 U
.
.P
art 1
7 T
otal
.on
rt
0 x
i 33
.2 0
1241
4.1

0
a'.2.
.......... ,,,,, .......... a..4Paaaaaana. mmmmmmmmmmm,,,N,,,,,,,mmommommom.o.o...........,u....m,..c.-,,aam,coon.ace,meao-,,A.ulm,m tbam,a .ma,,.. ..,,,..- m,..0 -.mo.,m.0.-.,rnm,m.1
, 1
, .
percentile
.
. a. ul-.
a. ul. m
_.m.
mo' m-4
mm a.q
,0
,.
,.
.
IndependentFunctioning ..
ef
..)
as . _. ..J
e
u.
PhyaccalDevelopment ..
I
I
'
,
,
u a v, .,
-4
-
. -.°
EconomicActivity
..
...
Ilk
CA..,
_.004, ,u .,. ,. ,
o.,, ,m , u
_.u,
&
u.
,,,
os
LanguageDevelopment
...
c
kt.,.
-a an a ...., a .
r0 'A.. Number end
Time Concecta
o ann m m ..o_.0 ..
-A
VocationalActivity
a...
1
. u, ..
, m .0_.
u_.
._.
"'
_.
°`
..
''m
.
Sale-Direction
c...
..
. ex
. .
u. .
a . reeaponalbility...x
.
_.. ...
tn
,
. .,o.
...
-.1
4
_.en ;::
n.,-. ..Jn.,
n.,n n.,m
n.,o. Socialization
i
x
O
...
n.,m...
{Am
'
...
0.m
. 17.
.
...
0,e..,
_.
ONm
_.
....
e..,
_.
0_.
...
m.
a.
..a.
-.am
n.,0.
na°
.m
P...'Ae..,
Part I Total
I
a
Va
rC
'
3a
00
a
.WMO0%7070
W.0

020
.....0
CA
a ..7
1-
I0
..,1
" "
" "
. G 0
-. N
1./.
Ji.
I, C
h . 0
1C43
ii.
-. n
i EA
40
..
..
" "
" "
L° L
° L°
L°
L° 4
4 L°
L°
L° I.
I. I.
. I. .
. S.
I. .
.t t
o t''
to to
to to
I,tr
l to
mm
cn
as c
n cn
cr.
a. c
n cn
.. ..
. Oa
. 0 -
. ni E
A .
. en
-0 C
O 0
3 0
-. n
i CA
M .
ON
0 C
O .
0 -.
ni C
A .
... 0
4, 0
. 3
wo.
p, 0
. 0
4, p
. 3
-.3
-.3
01,..
. p, 0
-.3
n11.
.3 0
0 C
O C
O O
a C
O O
a C
O O
a 0>
... 0
,,, 0
-. N
j L.,,
, co
c, ,,
. ,.,.
. . 0
3.....
i... 3
03 .
03 .
., .
.g.
. (1,
.:...
,
1
123
. .toPe et, the Score
LA C7,
S. 0
.tr
11 0
01 -a
"4
02... .
4. co
CT ...
En tn
En
0.,
...1
En
.cp
-.1 o
-.1
10.
-.1
(...
-.1 lIndependent
Fun
ctio
ning
....
-. a
. .n3 .
n3 ..n3 ".3
an3 La
,.
N s....3 -.Physical
Development
....
.-.
-.,
.E..,
aLn
as01
.
to03
-..
.-.Economic
Activity
....
.....
....
.. 0.
....3
LA10 11
.LA
n Mni 01
N Co
N I.t., -.
to toto LA
LA . .to .
.C
o .1.
4 'Language
-
Development
.-. c
,...3
ato
mN
..0_. 0
Number and
Time Concepts
0...
En
010
11'
,
.°-
m.-
s
.. 0
Vocational
Activity
c ....
....
a-.1
Cla
.0g v
,
- ..
_- .
- ..
- ...
CO
,- .°Self-
Direction
c ....
....
..
...3
E..,
:.
a.
vecr
.mesponsibility
....
x
- 140
......
fllC
O
... N... .
... .., ...
t!,*
ts) N
.
0.1
(..1
ni .ni .
P.,1,Socialization
.
x
O-.
E.., I.
-.
E..,
03
-. a
.. (A
.0
...
U.,
..
01 10
.. . CA
.. 01 I.
...
cr, 0
.. cr, I.
... a, 01
.. 01 .
....
na...
,a
.. 01 m
.. 0 m
..
.. . .
.. 03 -.
.. 03 a
.. . m
".. 03 .4
.....3 . m
....3 . m
Per
tI
Total
_
(
atv
ti A O to C 3 3 3n to

ti
I
2-. M
e04
024.
.10.
..A.7
.4.1
,
.-
..4...
......
.

r
AN
-
40
o
..........
Percentile Score
zcn
'0
Independent
Functioning
NJ
physical
Development
Economic
Activity
NJ
CA
DLanguage
Development
0Number end
rift Concepts
C
OVocational
'Activity
UN
- a,Self-
Direction
Responsibility
C
NJ
0Socialization
-0
CO
CPil.rt
ITatell
O
171
o

1
e+eJeJe,,,,,,,uu.auuuouuu ..........
Percentile Score
Independent
OW functioning
C-
o " Physical
Development
rn
CO
NEconomic
Activity
1,3
1,3 N
>0
L,
u language
o' Development
O
'umber end
Vocational
00 Activity
-
1'
Self-
"A"e
Direction
in
Pesponsibility
co
L.
Socialization
Part I
Total
s.--
ti V 2
2 O
r O
el

a
-.. z
uk-s
t0 ..1\11.4......
'...
a
NNNNNNNNNNWEAULICAUWWW(.1..........NNUINNIAMOMM0MMMM0000M....'......01070,03.7.0000..........

tr
to 6
a.,
,
ir
IwYbi 1 1:eq co1,,' u _
. S
x uoTlpzit.i.os .g a.
N,. . , . , IN.
V AlT/Tcilstmclip,V M
4
1
-
I
: ...
00T:palTa-.nee
-.....
.2 ..... _w . 4. .
....
... AlT0T40Vleu011e00A
.
cv m.
1
.
.....
1
..sl7s0uo0 awn
pug locIdinN
1.
.....
-v..
....
i
.
.
. luawdatim010abenbuel
,
,
. ,',',
c..
,
.
c..
c..
.
.
.
lipi0 1
'
AliA720yOTWOU073
0, .0
v
1
t.
I
... luawdotonso100140(40 v.
.,... .
.......-
m...,
614E0110101jluspusdapui
. 2.'0 , .
.
MLI,
.
.."...
""S 9 I 1 4 ki a 3 I a d g Vc74. PP VT C7 g g mm ro eg tli 2 O r1; gi n. t9 iZ it.' IC g. IT Z. n: P.Vos; ro tg 02 to si;
.
ttg =a.:444;
....-
2 Z T.:7 Vs' Z .;2: .; :', g. :11 % keg A r4 g ev,-, 2 g T./ rc- sga '12 ;a P iv is F C'''''''' ",
'. "I
c'', ... '' ' r. ' """'"' '-^ C' . i., ---1
2