Embed Size (px)
Citation preview
Bowling all alone:
Governmental debt is associated with low social capital
Julia M. Puaschunder*
The New School, Department of Economics, Schwartz Center for Economic Policy Analysis,
6 East 16th Street, 11rd floor 1129F/99, New York, NY 10003, USA,
[email protected], T 001 212 229 5700 4905, M 001 917 929 7038, F
001 212 229 5724, http://juliampuaschunder.com/
* The author acknowledges most gratefully financial support of the Eugene Lang Liberal Arts College of The New School, the Fritz Thyssen Foundation, the New School for Social Research and the University of Vienna. The author declares no conflict of interest. The author thanks Professor Benjamin Lee for most helpful guidance and Eli Nadeau for collegial care. The author thanks the participants of the Fall 2015 class ʻCultures of Financeʼ at the New School for helpful comments on the presented ideas. All omissions, errors and misunderstandings remain solely the author’s.
Abstract
Globalization leveraged pressure on contemporary society. One of today's most pressing societal dilemmas between generations arise from overindebtedness. In the aftermath of the 2008/09 crisis, governmental budget crises around the world led to austerity plans triggering an economic climate of stagnation, federal spending constraints and prospected social welfare decline for decades to come. Outlining the causes of the current overindebtedness crisis in the Western world prepares for an analysis of the implicit social correlates of governmental budgetary constraints. The impact of governmental austerity plans on societal well-being is discussed. Analyzing data from 20 countries of the world, World Bank Social Capital estimates are negatively related to economic public deficit spending based on Central Intelligence Agency (CIA) data. A cross-section regression holds a one unit change of social capital per capita index being related to a -.048 unit change in economic governmental deficit spending. Therefore, the higher the level of social capital in a country, the lower the likelihood of is of the government to engage in deficit spending and austerity policymaking. Innovatively outlining the relation of social capital and governmental debt is targeted at alleviating frictions arising from the up-to-date unknown negative socio-economic correlates of running governmental deficits heralding an unprecedented intergenerational equity kink. Potential overindebtedness remedies are reflected upon with a focus on the US and Europe in order to help sustain a harmonious societal climate between generations.
Key words: 2008/09 World Financial Crisis, Austerity, Debt, Deficit Spending, Financial Social Responsibility, Globalization, Overindebtedness, Social Capital, Social Responsibility, Social Welfare
page 1 of 17
1. INTRODUCTION
We live in interesting times. From the sixteenth century age of enlightenment, science and
technology remarkably revolutionized the world. Followed by the eighteenth century
industrialization, technological advancements, technical inventions and capital accumulation
leveraged the standard of living for mankind. The post-WWII economic boom heralded
golden years of socio-economic advancement and economic capital growth outpacing every
measure previous ages had known.
Though looking back to an epoch of enormous economic progress in the 20th century;
the improvement of living conditions seemed to be slowed from the turn of the millennium
on. Emerging economic markets’ noise and variance unforeseeably imposed system fragility
onto society (Ayache, 2010, 2011; Black, 1986, 1989; Knight, 1999; Martin, 2002). The era
of globalization, featuring complex interconnections and transactions faster than ever before
in history, appeared to imply emergent systemic risks (Centeno & Tham, 2012; Derman,
2011). What happens in one part of the world today, impacts around the globe. The global
interconnectedness imposing dangers creates a need for framework conditions securing from
negative consequences emerging from the new web of social, ecological and fundamental
transfers on a grand scale (Centeno, Cinlar, Cloud, Creager, DiMaggio, Dixit, Elga, Felten,
James, Katz, Keohane, Leonard, Massey, Mian, Mian, Oppenheimer, Shafir & Shapiro, 2013;
Lee, 2004). The interconnectedness also led to a globalization of risk and performativity
crunches (Callon, 2006; LiPuma & Lee, 2004; Martin, 1998). Financial modeling and
technological advancements drove society to risk together (Lee, 2004, 2015a; Martin, 2010).
As a consequence of complex economic interconnections, market prosperity burst
with the 2008/09 monetary downturn having evolved from individual ethical failures
amalgamating into collective downfalls (Martin, 2007). We now not only suffer from the
painful readjustment between economic fluctuations and whimsical market movements in the
page 2 of 17
finance world (Derman, forthcoming). Market failures also having been compensated by the
public results in an unprecedented overindebtedness of the Western world. Budget crises
around the world led to austerity plans triggering an economic climate of stagnation, federal
spending constraints and prospected social welfare decline for decades to come.
In the aftermath of the 2008/09 World Financial Crisis, the finance sector is under
scrutiny as for having made fast capital at the expense of the real economy (Martin, 2010;
Reilly & Brown, 2012). Since 2009 financial institutions are publicly pressured to justify
their social impacts and responsibility. The destruction of assets and degrading of capital
values led to a devaluation of personal property. What followed was the unorganized societal
bottom-up uprising in the wake of an uncontrolled clash of realities. Distributive equity
claims and the call for equality of opportunities rose in economically-troubled areas. Direct
democracy protests culminated in the Occupy Wall Street movement.
People having lost trust in banking systems may have detrimental effects on the day-
to-day choice and behavior society. Economic pessimism grows in the belief that the current
equity imbalances will be long term and cause the next generation being worse off.
Tomorrow’s children may not enjoy the same standard of living as Western World economies
in the eye of overindebtedness and heightened austerity demands. The long-term prospect of
a declining economy and contracted social welfare state, may echo in the social cohesion
within the social compound. While the impacts of the 2008/09 World Financial Crisis on
economic market systems is currently under scrutiny and social responsibility claims for the
finance sector are blatant (Puaschunder, 2012, 2015), the implicit societal impacts of
overindebtedness in the contemporary age of austerity are unknown.
The following paper therefore describes overindebtedness and austerity (Chapter 2)
and innovatively proposes a potential relation to social cohesion measured by social capital
page 3 of 17
(Chapter 3). Data is presented comprising of 20 countries1 worldwide that shows in a cross-
sectional analysis (Chapter 4.1) a negative relation of overindebtedness and social capital
(Chapter 4.2). The findings are discussed and remedies proposed (Chapter 5) prior to
concluding on the importance of future research on socio-economic impacts of governmental
debt and austerity (Chapter 6).
2. THEORETICAL FOUNDATION
2.1 Overindebtedness
2.1.1 The offset
Economic and financial crises evolved as long as monetary systems exist. The current
overindebtedness, however, is an unprecedented phenomenon resulting from conservative
politics and the economic turmoil. In the last 30 years libertarian trends have led to debt
accumulation (Neftci, 2000). Globalizing financial hubs dismantled taxation to attract capital
from around the world (MacKenzie, 2006). Since the 1980’s the finance world became
detached from the real economy. Investors evaluated options based on value-at-risk
(LiPuma, forthcoming). Money became a speculative good in free market economies. As
bankers turned from service agents to risk hunters, risky banking overruled client services
(LiPuma, 2004). Market actors were pushed to think short term and live on credit
(Wosnitzer, forthcoming).
While a neo-liberal elite gained value at risk at the expense of the general populace,
also societal decision making neglected future perspectives. People spent first then paid.
Debt became dissociated from public shame. Borrowing overruled producing. In
combination with tax income lows, nation states began to live beyond their means. National
spending exhausted savings. Traditionally balanced budgets faded. Undermined financial
market fundamentals and disastrous mistakes made by the finance elite led to economic 1 Australia, Brazil, Canada, Denmark, Hungary, Israel, Italy, Japan, Mexico, Netherlands, New Zealand, Poland, Portugal, Russia, South Korea, Spain, Sweden, Switzerland, United Kingdom and the United States
page 4 of 17
imbalances and collapsing financial institutions from 2007 on (MacKenzie, Muniesa & Siu,
2007). Surreal financial assets, speculations leaping over the market and irrational goals of a
fast-paced financial community opened ethical gaps between the economy and society.
The 2008/09 World Financial Crisis caused a substantial deterioration in public
finance. In the aftermath of the 2008/09 World Financial Crisis, unfeasible lending business
models heralded liquidity crunches (Meister & Potts, 2013). While in the Western world
public debts had already started piling up around the end of the millennium, the enormous
bail-outs of previous financial market exaltation in the aftermath of the 2008/09 World
Financial Crisis left Western world governmental budgets highly constraint shrinking future
economic prospects and social welfare opportunities.
The financial crisis caused government expenditures – especially for financial sector
bail-outs – to rocket, while revenues plummeted. As sovereign debt of many nations has
been rising since the 2008/09 World Financial Crisis due to bailed out banks, monetary
easing and massive fiscal stimulus packages; the crisis cumulated in the willingness of
politicians to abandon fiscal rules in moments of emergency (Semmler, 2013). By 2011,
almost all Eurozone countries had fallen out of compliance with the Maastricht Treaty’s
deficit and debt restriction criteria. New regulations and treaty adjustments on governmental
debt were adopted in the subsequent years featuring automatic leeway when governments
deviate from budgetary targets. Rising debt levels have led many countries to fiscal
consolidation and stabilization of sovereign debt levels as percentage of GDP (Blanchard &
Leigh, 2013; Batini, Callegari & Melina, 2012; Baum, Poplawski-Ribeiro & Weber, 2012).
The rapid debt increase in Europe heightened risk and interest costs on sovereign bonds.
These high premiums caused rising borrowing costs, leading to a further rise in debt visible in
Greece, Ireland, Italy, Portugal, Spain and some periphery EU countries, where the sovereign
debt exploded during the recession (De Grauwe, 2011). The 2008/09 World Financial Crisis
page 5 of 17
also increased the default risk, making it harder to gain venture capital and putting pressure
on banks to convey more risky frameworks – as outlined by the case of the
EURIBOR/LIBOR scandal.
In the future North American banks refraining from European transatlantic
investments is prospected to make the refinancing of commercial banks more expensive. In a
self-fulfilling prophecy this will further shy liquidity. Combined with stricter policy
programs in the Western world, impacted economic cycles will reduce the likelihood of fast
and easy budget supply, potentially leading to an additional rating downgrading, making CVS
and refinancing more expensive and implying hard-to-controllable institutional hesitancy to
cooperate. Further triple-A rating downgrades will exacerbate austerity plans as for lowered
governmental savings and heightened capital procurement costs.
2.1.2 Age of austerity
The 2008/09 World Financial Crisis heralded the social logic of derivatives (Martin,
2015). In the aftermath of the 2008/09 World Financial Crisis, governmental debt burdens
led to austerity budgeting in the Western world (Shaikh, 2013). Regime dependent negative
austerity multipliers resulted in financial stress with subsequent and long-term societal
impacts. An austerity driven reduction in spending had negative effect on consumption,
output, employment, and investment, feeding a downward spiral (Semmler, 2013).
Austerity induces recession-like effects on economic growth destabilize nation states
(Lawson-Remer, 2013; Marglin & Spiegler, 2013; Proaño, 2013). In the aftermath of the
2008/09 World Financial Crisis, austerity measured bred inequality leading to welfare losses
and extreme decreases in workers’ wages throughout Europe and the US. The strong
downward effect caused high unemployment, more financial stress in the financial sector
with increased credit and bond spreads, banking risks and falling internal and external
demand. During this period of increasing financial stress and budget consolidation policy,
page 6 of 17
the EU monetary union using the same currency, led to weaker countries being unable to
devalue their own currency, which might have stimulated their economies by increasing
exports and debt repayment burden easing (Semmler, 2013). Nations having no national
central bank that can control the monetary policies of sovereign nations or a sufficient deposit
insurance that might calm people who fear a banking collapse in the Eurozone, led to
countries’ downward pressure on wages. Unprecedented credit expansion and active
monetary policy resulted in fixed-rate, full allotment of liquidity of banks on demand on its
leveraged investment positions. Longer term refinancing operations were targeted at
reducing uncertainty and to encourage banks to provide credit to the economy (Semmler,
2013). Austerity triggered a strong contractionary multiplier in Greece. Greek public
consumption fell by 9.1%, which caused investment to plummet by 20.7%, imports by 3.4%,
private consumption by 7.1%, and the aggregate demand by 7.1% (Semmler, 2013). Greek
real wages fell by more than 30% since 2009, inflicting damages on living standards and
social cohesion (Semmler, 2013).
Austerity cuts in the Eurozone have led to reductions in overall output in excess of the
total level of spending cuts (Stein, 2011). Austerity policies caused more recession,
increasing the negative output gap and the gap between potential and actual GDP while
reducing salaries of public employees. Austerity caused the actual deficit-to-GDP ratio to
stay high, which heightens unemployment. As the cost of sovereign debt increases, this adds
to budgetary deficits (Semmler, 2013). These reductions in consumption and spending were
not offset by higher private investment (Semmler, 2013). The recession grows worse as
public investment and consumption expenditures fell, bargaining agreements were changed,
and public sector wages, unemployment payments and pension benefits fell. Austerity
economics weaken political will and economic policy with a bias towards making inequality
worse due to austerity-driven social cuts essential to providing public service (Aja, Bustillo,
page 7 of 17
Darity & Hamilton, 2013; Howell, 2013; Pollin, 2013). Unbalanced income and wage
adjustments met varying resistance in different countries such as widespread street and
activist calls to default on public debt rather than suffer further social costs of austerity
(Semmler, 2013). The massive amount of expenses not only implies further economic
turmoil and monetary instability but also trades off from social equity and fair resource
distribution. As the problem appears as a long-term crisis, unemployment will rise,
individual prosperity decline and social welfare standards continue to degrade. Socio-
economic problems arise in the wake of governmental social welfare provision cuts.
2.1.3 The socio-economic impacts of debt and austerity
The social costs of the 2008/09 World Financial crises and subsequent austerity
correlates are widespread, immediately visible in social welfare cuts steering civic upheaval.
Yet financial market downturns also impact intergenerational balance by a long-term spiral of
overindebtedness that will have to be paid back by generations to come. The current account
and capital account twin deficit burdens on the upcoming youth. For instance, a US child
inherits 55,000 USD debt at birth and a US taxpayer owes more 150,000 USD share of
governmental debt with trends predicting a further exacerbation of the US debt. In the eye of
our children having to pay for our current economic recovery, we are now taking from future
generations. The debt burden gains weight in the Western world given the societal trend of a
shrinking Western world population. Putting the elders’ current pension consumption
paycheck into the child room is problematic as pensions are usually not allocated towards
future investments – such as infrastructure or education, which would build future societal
assets in the long run and make future generations richer (Puaschunder, 2015). The young
will experience equity downgrades in their investments – such as housing market drops – but
also heightened unemployment.
page 8 of 17
Not only do we live at their expenses, the youth also not quite has the same
opportunities as their parents enjoyed. Rising prices take away wealth accumulation
prospects and austerity plans diminish access to social welfare. Transferring debts into the
future will sustainably lower future generations’ access to education and social welfare.
Missing budgetary resources result in governmental education cuts, therefore European
students now have to pay for their tuition while generations before were granted free access
to knowledge and in the US the education bubble inflates as rising tuition costs skyrocket to
unprecedented momentum. ‘Born poor, die poor’ becomes reality in the Western world and
an intergenerational mobility constraint. The societal outcomes are crucial to the people who
experience hope for a better future through education opportunities vanishing. Restricted
access to education breeds social unrest. The contemporary debt burdens are thus likely
fueling political frictions and psychological crises due to unprecedented pressure on civilians.
While the economic impacts of austerity are well known, what the overall climate of
overindebtedness means for society long-term and the lasting social interactions and
intergenerational transfers remains unknown (Puaschunder, 2015). While the public debt
problem trades off from the international sovereignty of countries, the responses to the
2008/09 World Financial Crisis differ throughout the world – for instance, neo-liberal and
post-Keynesian European economies invested in social welfare to avert the negative impacts
of liquidity constraints on the populace nurture equality and long-term financing. Due to the
manifold post-2008/09 World Financial Crisis remedy strategies as well as different societal
dimensions austerity touches on, an overall pattern of socio-economic correlates related to
overindebtedness is missing.
With reference to the beginnings of economic activities in gift giving cultures;
financial market activities may still today echo in socio-economic societal trends (Appadurai,
2015; Bourdieu, 1997; Bourdieu & Nice, 1990; Emerson, 1844/2005; Hubert & Mauss, 1925;
page 9 of 17
Mauss, 1925; Mauss, 1925/1990). Given the very many different social welfare expenditure
opportunities that are curbed in the age of austerity including, for instance, national health,
education, pensions and infrastructure, an overall social mood and societal climate is
expected to be associated with overindebtedness and austerity. The performativity of capital
may be related to societal anthropology (Lee, 2015b). Austerity and overindebtedness may
directly impact our social habits, ethics and societal rituals (Simmel, 1971; Tambiah, 1981;
Weber, 1905/2002).
2.2 Social capital
Social capital refers to the collective value of social networks and the inclinations that
arise from these networks to cooperate and enable collective action (Putnam, 2001).
Economic and cultural assets of social networks form social capital, in which transactions are
marked by high degrees of reciprocity, trust and cooperation. Market agents contribute to a
common good in tangible and intangible ways. Social capital improves the social
performativity of groups, fosters growth of entrepreneurial firms, superior managerial
performance, enhanced supply chain relations, strategic alliances, and the evolution of
communities.
Social capital comprises of five dimensions: (1) Groups and networks as collections
of individuals that promote and protect personal relationships which improve welfare; (2)
Trust and solidarity as elements of interpersonal behavior; (3) Collective action and
cooperation as the ability of people to work together toward resolving communal issues; (4)
Social cohesion and inclusion to mitigate risk of conflict and promote equitable access to
benefits of development by enhancing participation of the marginalized as well as (5)
Information and communication to improve social discourse and grant access to social
knowledge.
page 10 of 17
Social capital encompasses institutions, relationships, and customs that shape the
quality and quantity of a society’s social interactions.2 As a critical prerequisite for societies
to prosper economically and sustainably, social capital improves effectiveness and longevity
of communities and their ability to work and function efficiently together. Social capital
allows addressing common needs in the social compound fostering greater inclusion and
cohesion as well as increased transparency and accountability.
Given the widespread societal reach of austerity implications in the wake of
overindebted governmental budgets, a relation of overindebteness and social capital is
hypothesized insofar as the more overindebted a country is, the lower social capital is
(Hypothesis).
3. EMPIRICAL STUDY
The following empirical study targets at delineating the relation of social capital and
overindebtedness. As dependent variables, social capital will be investigated in relation to
the level of overindebtedness. In a cross-sectional regression, the difference between
overindebtedness relation to variant levels of social capital will be investigated. Variance in
governmental debt among different countries are hypothesized to be associated with different
social capital degrees.
3.1 Hypothesis
The study explores the relation between nationally-differing debt levels and
corresponding social capital. It is hypothesized that the higher the nationally-differing debt
level, the less social capital a country is going to have.
3.2 Method
3.2.1 Operationalization
2http://web.worldbank.org/WBSITE/EXTERNAL/TOPICS/EXTSOCIALDEVELOPMENT/EXTTSOCIALCAPITAL/0,,contentMDK:20642703~menuPK:401023~pagePK:148956~piPK:216618~theSitePK:401015,00.html
page 11 of 17
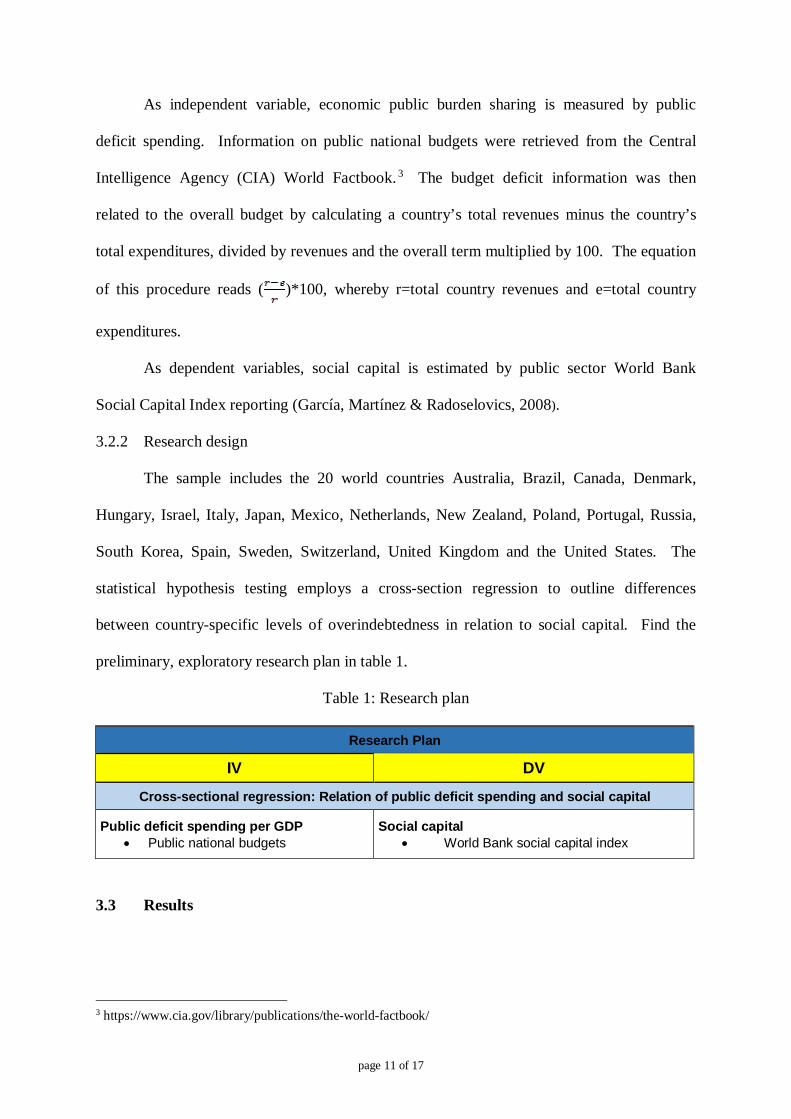
As independent variable, economic public burden sharing is measured by public
deficit spending. Information on public national budgets were retrieved from the Central
Intelligence Agency (CIA) World Factbook. 3 The budget deficit information was then
related to the overall budget by calculating a country’s total revenues minus the country’s
total expenditures, divided by revenues and the overall term multiplied by 100. The equation
of this procedure reads ( )*100, whereby r=total country revenues and e=total country
expenditures.
As dependent variables, social capital is estimated by public sector World Bank
Social Capital Index reporting (García, Martínez & Radoselovics, 2008).
3.2.2 Research design
The sample includes the 20 world countries Australia, Brazil, Canada, Denmark,
Hungary, Israel, Italy, Japan, Mexico, Netherlands, New Zealand, Poland, Portugal, Russia,
South Korea, Spain, Sweden, Switzerland, United Kingdom and the United States. The
statistical hypothesis testing employs a cross-section regression to outline differences
between country-specific levels of overindebtedness in relation to social capital. Find the
preliminary, exploratory research plan in table 1.
Table 1: Research plan
Research Plan
IV
DV
Cross-sectional regression: Relation of public deficit spending and social capital
Public deficit spending per GDP Public national budgets
Social capital World Bank social capital index
3.3 Results
3 https://www.cia.gov/library/publications/the-world-factbook/
page 12 of 17
The sample includes 20 countries (see data and variable description in the appendix). As a
conceptual variables check, a highly significant correlation of rPearson(78)=.981, p < .000
between social capital per capita index and social capital volume index was found.
The model employs a cross-sectional regression (see SPSS output in appendix). The
regression describes the relation of social capital and overindebtedness. The regression
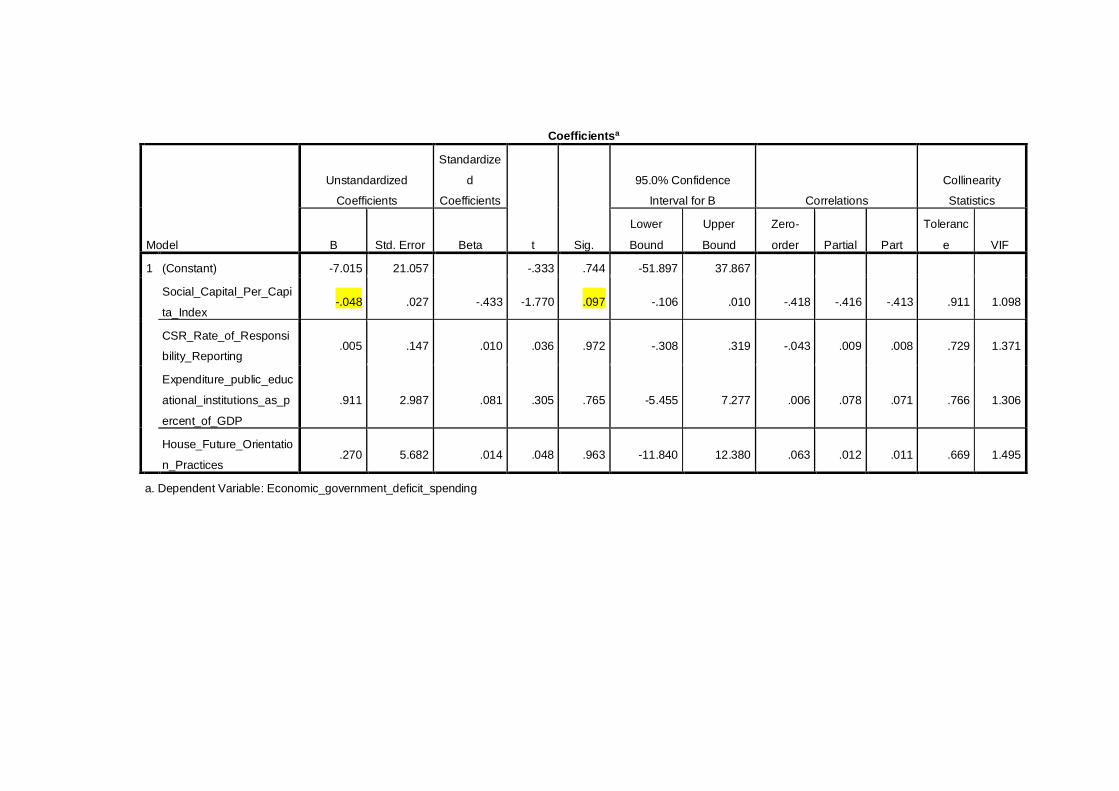
coefficient B value of -.048 for the social capital per capita index is significant at the 5
percent one-sided t-testing level, with a p value of 0.097/2=0.0485. A one unit change of
social capital per capita index is related to a -.048 unit change in economic governmental
deficit spending. The regression reveals a weak fit with an R square of .182 and adjusted R
square of -.036. The Durbin-Watson is 2.510, which indicates a slightly negative serial
correlation, with N=20, k=2, dL=1.100, dU=1.537. The calculated Durbin-Watson value of
2.510 is in the zone between the range dU=1.535 and 4-dU=2.900. We therefore do not reject
H0, indicating no serial correlation based on the Durbin-Watson Test table. Based on the
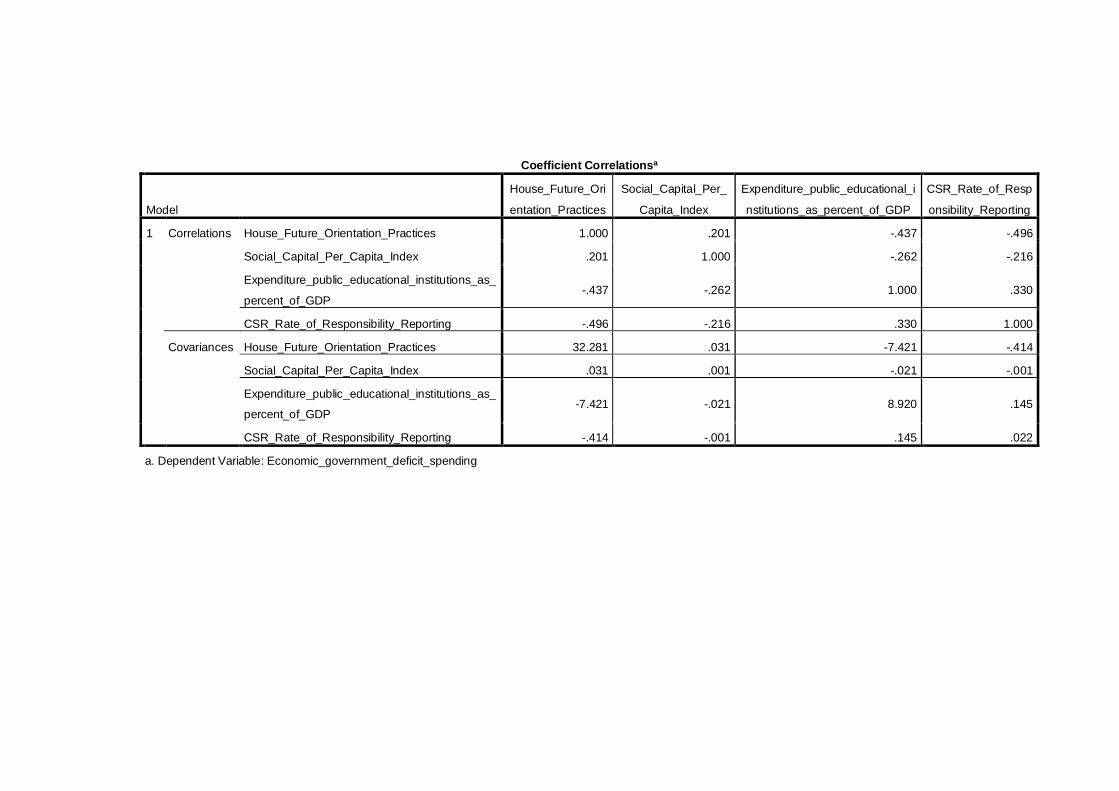
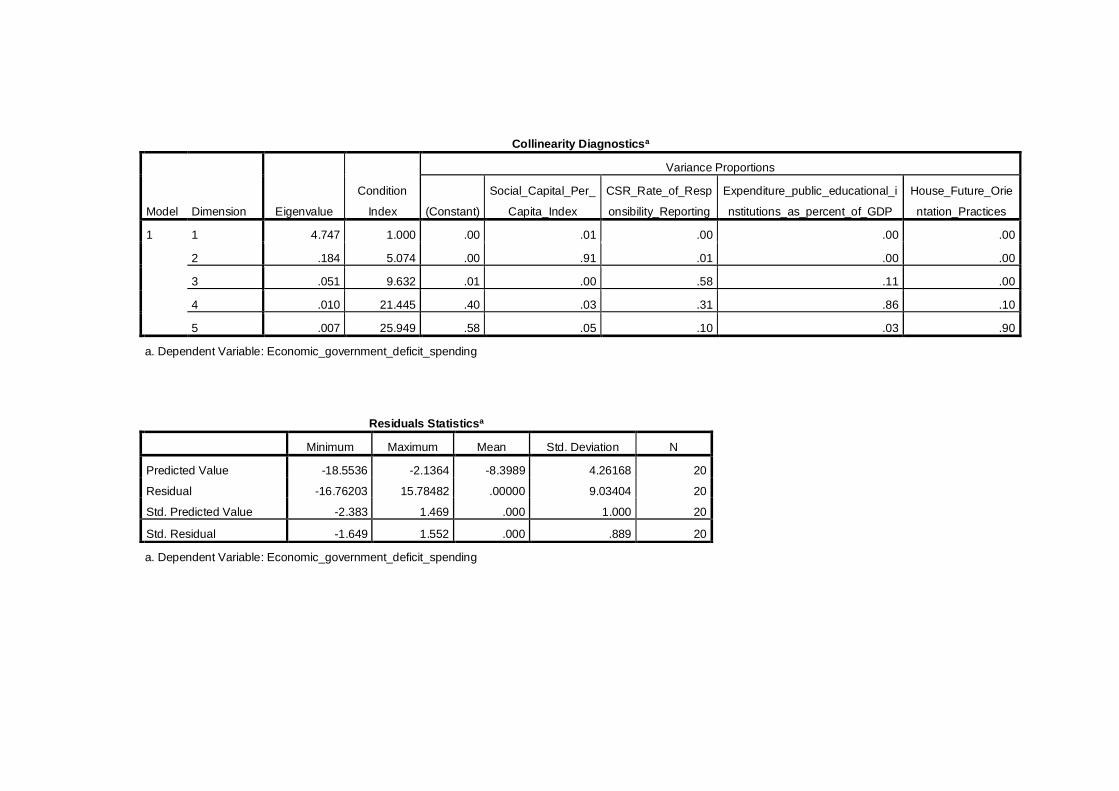
correlational analysis and the SPSS multicollinearity test, that detects multicollinearity if
tolerance is below .1 and VIF greater than 10 or on average much greater than 1, the problem
of multicollinearity does not exist. Heteroscedasticity will be tested in SPSS by the Levene
Test, which tests the null hypothesis that the variances of the comparison groups are the
same. The output probability is the probability that at least one of the samples in the test has
a significantly different variance. If this is greater than the 5% significance level, then it is
considered too great to be able to usefully apply parametric tests (Gujarati & Porter, 2009;
Hill, Griffiths & Lim, 2012).
4. DISCUSSION
Based on the results of regressions comprising data from 20 countries, deficit
spending countries are lower on social capital than those whose public leaders pursue a more
balanced budget approach. Overindebtedness is thus associated with social effects. Running
page 13 of 17
governmental debt and the subsequent austerity plans may wear down social cohesion or be
more likely if society has a lower social cohesion.
In a critical reflection of the current results, we may hold that while the study design
may have its merits with capturing 20 countries in the first investigation of international
differences in intergenerational macroeconomics, at the same time, the methodology is bound
by limitations of regressions, a fairly small sample size and low beta regression coefficient
(Gujarati & Porter, 2009; Hill et al., 2014).
Prospective future research may therefore add by employing stringent hypotheses
testing in order to outline the detected directionalities, but also shed light on drivers and
boundary conditions of the link between governmental debt and social capital. As a future
research perspective, analyzing present public and private sector social capital drivers could
help the implementation of intergenerational justice. In addition, future research could
capture if public sector contributions are associated with public social capital and private
sector contributions associated with private social capital transfer. Even further
investigations could then scrutinize if public and private sector social capital transfers are
inversely related (crowding out) or can lead to complementary benefits. Additional time
series research could target at differentiating between benefit and cost transfers from
generation to generations capturing variance between intergenerational benefit transfer and
intergenerational burden sharing in the triple bottom line domains.
5. CONCLUSION
Overall the presented research contributes to the emerging discourse on
overindebtedness by integrating social correlates into macroeconomic growth paradigms
(Solon, 1992). In response to the economic downturn, nations experimenting with austerity
restricting public spending has shown to have detrimental socio-economic correlates and
impacts on society. Curbing essential government spending on education, social welfare,
page 14 of 17
public safety, retirement, health, and infrastructure not only slows economic activities but
obviously has critical social correlates. The implications of the provided research are
manifold.
Theoretically the findings support socio-economic research on overindebtedness in
order to support the heterodox economics idea of social correlates of economic parameters.
Taking a heterodox perspective on debt provides a real-world relevant contemporary
snapshot of intergenerational imbalances around the globe. Empirically the results offer a
first introduction of a collective socio-economic shadow of overindebtedness by elucidating
intercultural and national intergenerational equity differences regarding overindebtedness and
the impact of debt crises on society. Practically the findings present an important descriptive
case of contemporary socio-economic intergenerational imbalances and real-life influence
factors on public and private sector social capital in the eye of overindebtedness. Capturing
social facets of overindebtedness allows to dynamically display societal trade-offs of debt in
order to provide avenues for harmoniously integrated intergenerational fairness solutions
(Harrod, 1948). The results enable recommendations for public and private economic
leadership on fiscal discipline. The novel insights gained offer ways how to avert social
frictions arising from austerity plans diminishing social welfare standards. Overall, the paper
may offer solutions how to harmoniously implement intergenerational equity in order to
create a socially-favorable climate over time following the greater goal of harmony between
generations (Auerbach, Gokhale & Kotlikoff, 1991, 1994; Foley, 2009).
As outlined by the results, overindebtedness causes inevitable socio-political conflicts
in the aftermath of bail-out plans. The cure for a rise in social capital lies in averting further
debt and austerity. While the detected impacts may thus be of socio-economic nature, the
remedies may comprise economic and political facets. Action on overindebtedness relief will
feature multi-layered decision making processes.
page 15 of 17
On the international level, debt stabilization depends on complex regimes and the
economic environment as described by financial stress, the vulnerability of the banking
system, monetary policy and the state of internal and external demand, and exchange rates
among various other factors. The level of aggregate expenditures and taxes are relevant as
well as the composition of spending and taxes – if government money spending is on health,
education, infrastructure, wages and salaries in the public sector, then the multiplier will
trigger positive long run effects (Semmler, Greiner, Diallo, Rajaram & Rezai, 2011; Stein,
2011).
Within the Eurozone, European leaders, who had agreed upon the Euro as a common
currency, now find themselves in a situation of asking who decides the fiscal policy in bail-
outs and why was there no codification of default strategies and burden sharing clause in the
inception of the Eurovision to lead in the Eurozone bail-out plans now? Banks are by now
more likely to invest in international entities – foremost the European Central Bank – than
inter-bank lending, especially after the 2012 EURIBOR/LIBOR scandal. The European
monetary union stabilization pushes a regulatory Eurozone harmonization in order to ensure
price and financial market stability. The Eurobonds solution as a major political leap forward
of the European Union could have grand but mostly unforeseeable implications for the entire
Eurozone that will leap over to other Western world market economies. An opening abyss of
national monetary rescues and central banks dictating the Euro-bail-out project currently
raises political tension coupled with nationalism and Eurozone fatigue.
Given the results’ evidence for overindebtedness having negative social correlates and
austerity deepening societal inequality and heightening the tensions and contradictions
inherent in capitalist economies (Dymski, 2013), austerity in the wake of debt as a cure
appears worse than the disease (Aja et al., 2013; Semmler, 2013). Austerity plans that have
been enacted too fast may plunge countries into worsening unemployment, poverty and
page 16 of 17
growing civil unrest, which may lead to ever lower levels of social capital. Therefore
uncontrolled distributional effects that can endanger the future of the welfare state should be
revised (Boyer, 2012). In particular, social spending on the elderly hurts young people if
retirement and elderly health care spending takes funding away from investments supporting
education and youth development (Ghilarducci, 2013). Support from spending on the elderly
and the young are thereby seen as complements.
Future prospects are hard to estimate as for being directly influenced by the overall
economic growth rate. Future generations may sustainably be burdened due to our current
short-term expenditures and debt repayments. Our current indebtedness overrules economic
growth and directly transfers debts into the future – estimated 60% debt of GDP will be 90%
of the GDP in ten years with long term implications for the real economy and society. Some
countries already face over 80% debts of the GDP that will have to be paid back by – at least
– the next two generations. When debt rises faster than economic output, higher taxation
levels are viciously coupled with a lower range of governmental degrees of freedom to
provide social services heralding challenging governmental-citizen relations and looming an
even larger social capital decline.
In the eye of these unprecedented intergenerational equity imbalances, it has become
economically efficient to think about long-term social capital drawbacks from a socio-
political angle. Nowadays, intergenerational equity has become a political question of how
far democracy goes and temporal justice an ethical obligation for the future. As a remedy,
economic stimulus is needed to restore growth and foster social cohesion. Policies should
focus on economic opportunity and strengthen the middle class to stabilize democracy and
social care (Lawson-Remer, 2013). Potential policy options include increasing tax revenues
for social and infrastructure spending – e.g., through taxing top-income earners (Piketty, Saez
& Stantcheva, 2011; Washington Post, 2013). Policies that reduce risk for borrowers and
page 17 of 17
lenders through governmental loan guarantee programs. Raising the costs for capital
hoarding can restore trust in the economy and stimulate economic activities. Government
expenditure may have a lasting positive impact on output, employment and real wages as
well as labor productivity. In addition, Financial Social Responsibility will ensure that the
current generation is not spending the money of tomorrow’s children or takes up debt to be
paid by future children (Puaschunder, 2012). Long-term debt reduction should be enacted
slowly with mild effects on society. Alongside, governments must breed hope through
forward looking strategies in the eye of austerity cuts and unemployment gaps to take away
people’s fear of the future. Policy makers are pressured to revise social services and raise the
retirement age in industrialized economies. The balance between the welfare of present and
future generations can also be established through spontaneous and individual saving
decision of the present generation as well as policy implementations to arrange tax collection
and governmental actions affecting the economy to elicit saving preferences in favor of future
generations (Bauer, 1957). Society can use intergenerational fiscal transfers to allocate the
burdens across generations without the need to trade off from generation’s well-being for
another’s (Sachs, 2014). Generations passing on to the future will feature age-attentively
redistributed wealth, investments for young and respect for future generations’ resource
consumption needs. With shedding light on the unknown link between governmental debt
and social capital, this article pursued to ensure constancy of a socially beneficial climate for
this generation and the following.
References
Aja, A., Bustillo, D., Darity, W., Hamilton, D. (2013). Jobs instead of austerity: A bold policy
proposal for economic justice. Social Research: An International Quarterly, 80, 3,
781-794.
Appadurai, A. (2015). Banking on words: The failure of language in the age of derivative
finance. Chicago: Chicago University Press.
Auerbach, A., Gokhale, J. & Kotlikoff, L. (1991). Generational accounts: A meaningful
alternative to deficit accounting. Tax Policy and the Economy. Cambridge, MA:
MIT Press.
Auerbach, A., Gokhale, J. & Kotlikoff, L. (1994). Generational accounting: A meaningful way to
evaluate fiscal policy. Journal of Economic Perspectives, 8, 1, 73-94.
Ayache, E. (2010). The blank swan: The end of probability. New York: Wiley.
Ayache, E. (2011). What is implied by implied volatility. In R. MacKay, R. Negarestani, E.
Ayache, M. Poole, M. Abreu, S. Lyall & S. Lewitt (Eds.), The Medium of Contingency,
New York: Sequence Press.
Batini, N., Callegari, G. & Melina, G. (2012). Successful austerity in the United States, Europe
and Japan, Working Papers 12/190, International Monetary Fund.
Bauer, P.T. (1957). Economic analysis and policy in underdeveloped countries. Chapel Hill:
Duke University Press.
Baum, A., Poplawski-Ribeiro, M. & Weber, A. (2012). Fiscal multipliers and the state of the
economy. Working Paper, 12/286, International Monetary Fund.
Black, F. (1986). Noise. Journal of Finance, 41, 3, 529-543.
Black, F. (1989). How we came up with the option formula, Journal of Portfolio Management,
15, 4-8.
Blanchard, O. & Leigh, D. (2013). Growth forecast errors and fiscal multipliers. Working Paper
13/1, International Monetary Fund.
Bourdieu, P. (1997). Marginalia: Some additional notes on the gift. In A.D. Schrift (Ed.), The
Logic of Gift: Toward an Ethic of Generosity, pp. 231-243. New York: Routledge.
Bourdieu, P. & Nice, R. (1990). The logic of practice. New York: Polity.
Boyer, R. (2012). The four fallacies of contemporary austerity policies: The lost Keynesian
legacy. The Cambridge Journal of Economics, 36, 1, 283-312.
Callon, M. (2006). What does it mean to say that economics is performative? Paris: Centre de
Sociologie de l’ Innovation, CSI Working Paper 5. Paris: Ecole des Mines de Paris.
Centeno, M.A., Cinlar, E., Cloud, D., Creager, A.N., DiMaggio, P.J., Dixit, A.K., Elga, A.N.,
Felten, E.W., James, H., Katz, St.N., Keohane, R.O., Leonard, Th.C., Massey, W.A.,
Mian, A.R., Mian, Z., Oppenheimer, M., Shafir, E. & Shapiro, J.N. (2013). Global
systemic risk. Unpublished manuscript for research community. Princeton Institute for
International and Regional Studies, Princeton University, April 2013.
Centeno, M. A. & Tham, A. (2012). The emergence of risk in the global system. Working paper,
Princeton University.
Central Intelligence Agency (CIA) World Factbook. Accessed at
https://www.cia.gov/library/publications/the-world-factbook/
De Grauwe, P. (2011). The governance of a fragile Eurozone. Working Document 346, Centre
for European Political Studies.
Derman, E. (2011). Models. Behaving. Badly: Why confusing illusion with reality can lead to
disaster on Wall Street and in life. New York: Free Press.
Derman, E. (forthcoming). Remarks on financial models. In B. Lee & R. Martin (Eds.),
Derivatives & The Wealth of Society. Chicago: University of Chicago Press.
Forthcoming.
Dymski, G. (2013). The logic and impossibility of austerity. Social Research: An International
Quarterly, 80, 3, 665-696.
Emerson, E.W. (1844/2005). The gift. New York: Munroe.
Foley, D.K. (2009). The economic fundamentals of global warming. In J.M. Harris & N.R.
Goodwin, Twenty-first Century Macroeconomics: Responding to the Climate
Challenge. Cheltenham: Edward Elgar.
García, P.F., Martínez, L.S. & Radoselovics, J.F.G. (2008). Estimation of social capital in the
world: Time series by country. Fundación BBVA: Documentos de Trabajo.
Ghilarducci, T. (2013). Austerity distorts the common economic interest between generations.
Social Research: An International Quarterly, 80, 3, 953-976.
Gujarati, D.N. & Porter, D.C. (2009). Basic econometrics. New York: McGraw-Hill.
Harrod, R.F. (1948). Towards a dynamic economics. London: Macmillan.
Hill, R.C., Griffiths, W.E. & Lim, G.C. (2012). Principles of econometrics. London: Wiley.
Howell, D.R. (2013). The austerity of low pay: US exceptionalism in the age of inequality.
Social Research: An International Quarterly, 80, 3, 795-816.
Hubert, & Mauss, M. (1925). Sur un texte de Posidonius. Le suicide, contre prestation suprême,
Revue celtique, 42, 324-329.
International Monetary Fund (2013). Concluding statement of the 2013 Article IV Mission to the
United States of America. June 14. http://www.imf.org/external/np/ms/2013/061413.htm.
Knight, F. (1999). What is truth in economics? Chicago: Chicago University Press.
Lawson-Remer, T. (2013). Austerity and democracy. Social Research: An International
Quarterly, 80, 3, 917-928.
Lee, B. (2004). From primitives to derivatives. In E. LiPuma & B. Lee (Eds.), Financial
Derivatives and the Globalization of Risk. Durham: Public Planet.
Lee, B. (2015a). Risking together I & II. Working paper, The New School.
Lee, B. (2015b). The performativity of capital. Working paper, The New School.
LiPuma, E. (2004). Temporality and the financial markets. In E. LiPuma & B. Lee (2004).
Financial Derivatives and the Globalization of Risk. Durham: Public Planet.
LiPuma, E. (forthcoming). Ritual in financial life. In B. Lee & R. Martin (Eds.), Derivatives &
The Wealth of Society. Chicago: University of Chicago Press.
LiPuma, E. & Lee, B. (2004). Financial derivatives and the globalization of risk. Durham:
Public Planet.
MacKenzie, D. (2006). An engine not a camera: How financial models shape markets.,
Cambridge: MIT Press.
MacKenzie, D., Muniesa, F. & Siu, L. (2008). Do economists make markets? On the
performativity of economics. Princeton: Princeton University Press.
Marglin, St.A. & Spiegler, P. (2013). Unpacking the multiplier: Making sense of recent
assessment of fiscal stimulus policy. Social Research: An International Quarterly, 80,
3, 819-854.
Martin, R. (1998). A precarious dance, a derivate society. Cambridge: MIT Press.
Martin, R. (2002). Financialization of daily life: How investment banking and playing the market
moved from Wall Street to Main Street. Philadelphia: Temple University Press.
Martin, R. (2007). An empire of indifference, American war and the financial logic of risk
management. Chapel Hill: Duke University Press.
Martin, R. (2010). Toward a decentered social kinesthetic. Dance Research Journal, 42, 77-80.
Martin, R. (2015). Knowledge LTD: Toward a social logic of the derivative. Philadelphia:
Temple University Press.
Mauss, M. (1921). Une forme archaique de contrat chez les Thraces, Revision des études
grecques.
Mauss, M. (1925/1990). Gifts, gifts. New York: Halls.
Meister, R. & Potts, S. (2013). Liquidity. Lecture script accessed at
http://townsendgroups.berkeley.edu/event/liquidity-lecture-robert-meister-respondent-
shaina-potts on November 3, 2015.
Neftci, S. (2000). Principles of financial engineering. New York: The New School for Social
Research.
Piketty, T., Saez, E. & Stantcheva, St. (2011). Optimal taxation of top labor incomes: A tale of
three elasticities. Discussion Paper 8675, Center for Economic Policy Research,
November.
Pollin, R. (2013). Austerity economics and the struggle for the soul of US capitalism. Social
Research: An International Quarterly, 80, 3, 749-780.
Proaño, Ch. (2013). On the potential pitfalls of the EU Fiscal Pact: A simulation study of the
international dimensions of fiscal austerity. Social Research: An International
Quarterly, 80, 3, 855-882.
Puaschunder, J.M. (2012). On the emergence, current state and future perspectives of socially
responsible investors. Harvard University Weatherhead Center for International
Affairs working paper accessed at http://wcfia.harvard.edu/publications/emergence-
current-state-and-future-perspectives-socially-responsible-investment
Puaschunder, J.M. (2015). On the social representations of intergenerational equity. Copyright
Office of the United States Congress. TXu001798159 / 2012-02-26.
Putnam, R.D. (2001). Bowling alone: The collapse and revival of American community. New
York: Simon & Schuster.
Reilly, F.K. & Brown, K.C. (2012). An introduction to Markowitz portfolio theory. Orlando:
Harcourt.
Sachs, J. D. (2014). Climate change and intergenerational well-being. In Bernard, L. & W.
Semmler (Eds.), The Oxford Handbook of the Macroeconomics of Global Warming.
Oxford: Oxford University Press.
Semmler, W. (2013). The macroeconomics of austerity in the European Union. Social Research:
An International Quarterly, 80, 3, 883-914.
Semmler, W., Greier, A., Diallo, B., Rajaram, A. & Rezai, A. (2011). Fiscal policy, public
expenditures composition and growth: Theory and empirics. The IEB International
Journal of Finance, 2, 1-42.
Shaikh, A. (2013). Crisis, austerity, and the role of economic theory in policy. Social Research:
An International Quarterly, 80, 3, 653-664.
Simmel, G. (1971). Mental life and the metropolis: On individuality and social forms. Chicago:
Chicago University Press.
Solon, G.R. (1992). Intergenerational income mobility in the United States. American Economic
Review, 82, 3, 393-408.
Stein, J. (2011). The diversity of debt crises in Europe. CESIFO Working Paper 3348, Category
6: Fiscal Policy, Macroeconomics and Growth, February.
Tambiah, S.J. (1981). A performative approach to ritual. London: Academy.
Washington Post (2013). We still need a grand bargain, June 9.
Weber, M. (1905/2002). The protestant ethic and the spirit of capitalism. London: Penguin.
Wosnitzer, R. (forthcoming). Mapping the trading desk: Derivative value through market
making. In B. Lee & R. Martin (Eds.), Derivatives & The Wealth of Society. Chicago:
University of Chicago Press.
Regression
Descriptive Statistics
Mean Std. Deviation N
Economic_government_deficit_spending -8.3989 9.98878 20
Social_Capital_Per_Capita_Index 163.0160 90.37128 20
CSR_Rate_of_Responsibility_Reporting 70.9000 18.58664 20
Expenditure_public_educational_institutions_as_percent_of_GDP 5.4750 .89259 20
House_Future_Orientation_Practices 3.9280 .50194 20
Correlations
Economic_gove
rnment_deficit_
spending
Social_Capital_
Per_Capita_Ind
ex
CSR_Rate_of_Res
ponsibility_Reporti
ng
Expenditure_public_
educational_instituti
ons_as_percent_of_
GDP
House_Future
_Orientation_
Practices
Pearson Correlation Economic_government_deficit_spending 1.000 -.418 -.043 .006 .063
Social_Capital_Per_Capita_Index -.418 1.000 .111 .182 -.045
CSR_Rate_of_Responsibility_Reporting -.043 .111 1.000 -.122 .406
Expenditure_public_educational_institution
s_as_percent_of_GDP .006 .182 -.122 1.000 .320
House_Future_Orientation_Practices .063 -.045 .406 .320 1.000
Sig. (1-tailed) Economic_government_deficit_spending . .033 .429 .490 .396
Social_Capital_Per_Capita_Index .033 . .320 .222 .425
CSR_Rate_of_Responsibility_Reporting .429 .320 . .305 .038
Expenditure_public_educational_institution
s_as_percent_of_GDP .490 .222 .305 . .085
House_Future_Orientation_Practices .396 .425 .038 .085 .
N Economic_government_deficit_spending 20 20 20 20 20
Social_Capital_Per_Capita_Index 20 20 20 20 20
CSR_Rate_of_Responsibility_Reporting 20 20 20 20 20
Expenditure_public_educational_institution
s_as_percent_of_GDP 20 20 20 20 20
House_Future_Orientation_Practices 20 20 20 20 20
Model Summaryb
Model R R Square
Adjusted R
Square
Std. Error of the
Estimate
Change Statistics
Durbin-Watson
R Square
Change F Change df1 df2 Sig. F Change
1 .427a .182 -.036 10.16747 .182 .835 4 15 .524 2.510
a. Predictors: (Constant), House_Future_Orientation_Practices, Social_Capital_Per_Capita_Index, Expenditure_public_educational_institutions_as_percent_of_GDP,
CSR_Rate_of_Responsibility_Reporting
b. Dependent Variable: Economic_government_deficit_spending
ANOVAa
Model Sum of Squares df Mean Square F Sig.
1 Regression 345.077 4 86.269 .835 .524b
Residual 1550.662 15 103.377
Total 1895.739 19
a. Dependent Variable: Economic_government_deficit_spending
b. Predictors: (Constant), House_Future_Orientation_Practices, Social_Capital_Per_Capita_Index,
Expenditure_public_educational_institutions_as_percent_of_GDP, CSR_Rate_of_Responsibility_Reporting
Coefficientsa
Model
Unstandardized
Coefficients
Standardize
d
Coefficients
t Sig.
95.0% Confidence
Interval for B Correlations
Collinearity
Statistics
B Std. Error Beta
Lower
Bound
Upper
Bound
Zero-
order Partial Part
Toleranc
e VIF
1 (Constant) -7.015 21.057 -.333 .744 -51.897 37.867
Social_Capital_Per_Capi
ta_Index -.048 .027 -.433 -1.770 .097 -.106 .010 -.418 -.416 -.413 .911 1.098
CSR_Rate_of_Responsi
bility_Reporting .005 .147 .010 .036 .972 -.308 .319 -.043 .009 .008 .729 1.371
Expenditure_public_educ
ational_institutions_as_p
ercent_of_GDP
.911 2.987 .081 .305 .765 -5.455 7.277 .006 .078 .071 .766 1.306
House_Future_Orientatio
n_Practices .270 5.682 .014 .048 .963 -11.840 12.380 .063 .012 .011 .669 1.495
a. Dependent Variable: Economic_government_deficit_spending
Coefficient Correlationsa
Model
House_Future_Ori
entation_Practices
Social_Capital_Per_
Capita_Index
Expenditure_public_educational_i
nstitutions_as_percent_of_GDP
CSR_Rate_of_Resp
onsibility_Reporting
1 Correlations House_Future_Orientation_Practices 1.000 .201 -.437 -.496
Social_Capital_Per_Capita_Index .201 1.000 -.262 -.216
Expenditure_public_educational_institutions_as_
percent_of_GDP -.437 -.262 1.000 .330
CSR_Rate_of_Responsibility_Reporting -.496 -.216 .330 1.000
Covariances House_Future_Orientation_Practices 32.281 .031 -7.421 -.414
Social_Capital_Per_Capita_Index .031 .001 -.021 -.001
Expenditure_public_educational_institutions_as_
percent_of_GDP -7.421 -.021 8.920 .145
CSR_Rate_of_Responsibility_Reporting -.414 -.001 .145 .022
a. Dependent Variable: Economic_government_deficit_spending
Collinearity Diagnosticsa
Model Dimension Eigenvalue
Condition
Index
Variance Proportions
(Constant)
Social_Capital_Per_
Capita_Index
CSR_Rate_of_Resp
onsibility_Reporting
Expenditure_public_educational_i
nstitutions_as_percent_of_GDP
House_Future_Orie
ntation_Practices
1 1 4.747 1.000 .00 .01 .00 .00 .00
2 .184 5.074 .00 .91 .01 .00 .00
3 .051 9.632 .01 .00 .58 .11 .00
4 .010 21.445 .40 .03 .31 .86 .10
5 .007 25.949 .58 .05 .10 .03 .90
a. Dependent Variable: Economic_government_deficit_spending
Residuals Statisticsa
Minimum Maximum Mean Std. Deviation N
Predicted Value -18.5536 -2.1364 -8.3989 4.26168 20
Residual -16.76203 15.78482 .00000 9.03404 20
Std. Predicted Value -2.383 1.469 .000 1.000 20
Std. Residual -1.649 1.552 .000 .889 20
a. Dependent Variable: Economic_government_deficit_spending