Embed Size (px)
Citation preview
Copyrighted Material
C H A P T E R 1
Educational Attainment Overall Trends Disparities and the Public Universities We Study
THE SUBJECT OF this bookmdasheducational attainment in the United States mdashcould hardly be more timely Academics framers of public policy and journalists are united in bemoaning the failure of the United States in reshycent years to continue building the human capital it needs to satisfy ecoshynomic social and political needs In their book The Race Between Educashytion and Technology Claudia Goldin and Lawrence Katz applaud Americarsquos astonishingly steady and substantial educational progress during the first three quarters of the 20th centurymdashand then are just as emphatic in callshying attention to the dramatic falling off in the rate of increase in educashytional attainment since the mid-1970s1 The chairman of the Federal Reserve Board Ben S Bernanke in remarks delivered at Harvard on Class Day 2008 told the assembled graduates that ldquothe best way to imshyprove economic opportunity and to reduce inequality is to increase the educational attainment and skills of American workersrdquo2 The New York Times columnist David Brooks has referred to ldquothe skills slowdownrdquo as ldquothe biggest issue facing the countryrdquo3 In writing about how to increase growth in America David Leonhardt also at the New York Times says simshyply ldquoEducationmdasheducating more people and educating them bettermdash appears to be the best single bet that a society can makerdquo4
Bernanke was wise to couch his argument in terms of educational atshytainment (which we generally equate with earning a degree) rather than just enrollment or years of school completed for the payoff to completshying onersquos studies is much higher than the payoff to having ldquojust been thererdquo another yearmdashthe so-called ldquosheepskinrdquo effect5 In our view too much discussion has focused on initial access to educational opportunishyties (ldquogetting startedrdquo) rather than on attainment (ldquofinishingrdquo) It is noteshyworthy that in his first speech to a joint session of Congress (and then in his budget message) President Barack Obama emphasized the imporshytance of graduating from college not just enrolling6
In any case as Bernanke and others have stressed the key linkage is beshytween the formation of human capital and productivity In his Class Day remarks Bernanke observed ldquoThe productivity surge in the decades afshyter World War II corresponded to a period in which educational attainshyment was increasing rapidlyrdquo Technological change and the breaking down of barriers to the exchange of information and ideas across boundshy
2
Copyrighted Material
C H A P T E R 1
aries of every kind have unquestionably increased the value of brainpower and training in every country As President Obama has said ldquoIn a global economy where the most valuable skill you can sell is your knowledge a good education is no longer just a pathway to opportunitymdashit is a preshyrequisiterdquo7 Leonhardt adds ldquoThere really is no mystery about why edushycation would be the lifeblood of economic growth [Education] helps a society leverage every other investment it makes be it in medicine transshyportation or alternative energyrdquo8 Nor are economic gains the only reashyson to assert the importance of educational attainment The ability of a democracy to function well depends on a high level of political engageshyment which is also tied to the educational level of the citizenry A high level of educational attainment fosters civic contributions of many kinds9
Even though our emphasis on ldquofinishingrdquo is meant to be a useful corshyrective to the sometime tendency to focus simply on ldquostartingrdquo we hasten to add that there are of course dimensions of college success beyond just graduating that must also be kept in mind The kind and quality of the undergraduate education obtained are plainly important It would be a serious mistake to treat all college degrees as the same or to put so much emphasis on earning a degree that other educational objectives are lost from sight This is why some are skeptical of the weight given by the Nashytional Collegiate Athletic Association to graduation rates (whatever the subject studied and whatever the rigor of the graduation requirements) in assessing the academic performance of scholarship athletes As in platshyform diving differences in the ldquodegree of difficultyrdquo of various courses of study deserve to be acknowledged and considerable weight should be given to academic achievement in assessing educational outcomes For these reasons we examine fields of study chosen by students and grades earned as well as graduation rates However much as there is to be said for such finer-grained analyses we believe it is valuable to place special emshyphasis on graduation rates as presumptively the single most important inshydicator of educational attainmentmdashwhich is what we do in this book
EDUCATIONAL ATTAINMENT IN THE UNITED STATES
These basic propositions explain why there is reason for serious concern about the slow-down in the rate of increase in the overall level of educashytional attainment in the United States The facts are sobering As Goldin and Katz report on the basis of an exhaustive study of historical records the achievements of America in the first three quarters of what they call ldquothe Human Capital Centuryrdquo are impressive indeed This countryrsquos then unprecedented mass secondary schooling and the concurrent establishshyment of an extensive and remarkably flexible system of higher education combined to produce gains in educational attainment that were both
3
Copyrighted Material
E D U C A T I O N A L A T T A I N M E N T
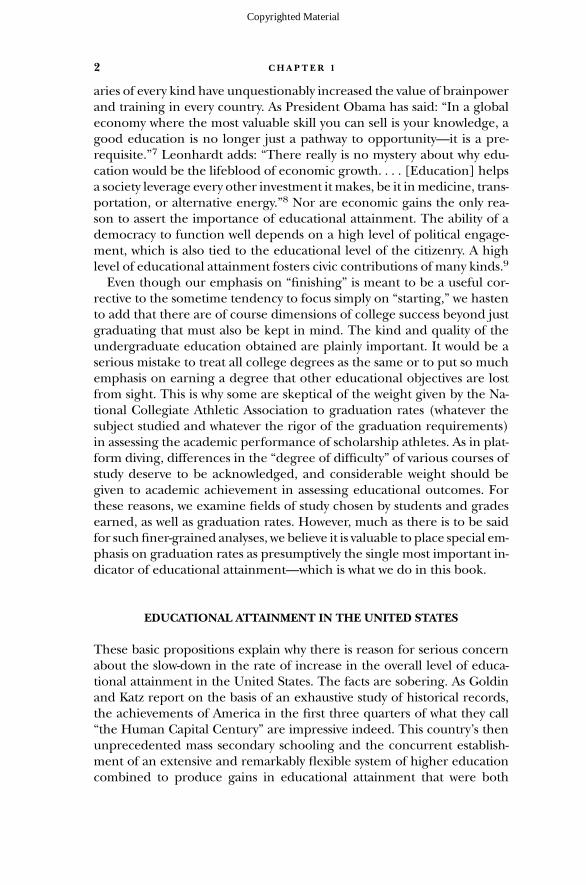
steady and spectacular (see Figure 11 which plots years of schooling by birth cohorts from 1876 to the present) Unfortunately this truly amazing record of progress came to a halt about the time when members of the 1951 birth cohort (who were 24 years old in 1975) were attending college10
We see this same ldquoflatteningrdquo when we use data from the Current Popushylation Survey to track the educational attainment of 25- to 29-year-olds from 1968 to 2007 (Figure 12) Although there was a modest increase in educational attainment in the 1990s the curve is flat for the years thereshyafter The failure of educational attainment to continue to increase steadily is the result of problems at all stages of education starting with pre-school and then moving through primary and secondary levels of edshyucation and on into college (see the discussion in Chapter 2 of ldquolossesldquo of students at each main stage of the educational process) Our focus on completion rates at the college level should certainly not be read as disshymissing the need to make progress at earlier stages In any case it is noteshyworthy that over this 40-year period the completion rate (the fraction of those who started college who eventually earned a bachelorrsquos degree) changed hardly at all while time-to-degree increased markedly11
This is not a pretty picture when looked at through the lens of Amershyicarsquos history of educational accomplishments during the first 75 years of the 20th century It is an equally disturbing picture when juxtaposed with
15
14
13
12
11
10
9
8
7
Year of Birth
Figure 11 Years of Schooling of US Native-Born Citizens by Birth Cohorts 1876ndash1975
Source Goldin and Katz figure 14
Year
s of
Sch
oolin
g at
Age
35
Year
s
1870 1880 1890 1900 1910 1920 1930 1940 1950 1960 1970 1980
4
Copyrighted Material
C H A P T E R 1
1968 1973 1978
Completion Rate Some College or More Bachelorrsquos Degree or More
1983 1988 1993 1998 2003
70
60
50
40
30
20
10
0
Shar
e Ba
chel
orrsquos
Lev
el S
hare
Som
e Co
llege
(Per
cent
)
Figure 12 Educational Attainment of 25- to 29-Year-Olds 1968ndash2007 Source Current Population Survey
the remarkable gains in educational attainment in other countries As is increasingly recognized the United States can no longer claim that it is ldquofirst-in-classrdquo in terms of continuing progress in building human capital The 2008 annual stock-taking document produced by the Organization for Economic Co-operation and Development (OECD) reported that the 2006 higher education attainment rate for 25- to 34-year-olds in the United States is nearly identical to that of 55- to 64-year-olds a group 30 years their senior In 2006 the United States ranked 10th among the members of the OECD in its tertiary attainment rate This is a large drop from preceding years the United States ranked 5th in 2001 and 3rd in 1998 Moreover in the United States only 56 percent of entering students finished college an outcome that placed this country second to the botshytom of the rank-ordering of countries by completion rate12 In recognishytion of this reality President Obama has set an ambitious goal for Amershyican higher education ldquoBy 2020 America will once again have the highshyest proportion of college graduates in the worldrdquo13 And the situation in the United States is even more worrying when the focus is on degrees in the natural sciences and engineering According to a report published by the National Science Board ldquoThe proportion of the college-age populashytion that earned degrees in NSampE fields was substantially larger in more than 16 countries in Asia and Europe than in the United States in 2000rdquo
5
Copyrighted Material
E D U C A T I O N A L A T T A I N M E N T
In that year the United States ranked just below Italy and above only four other countries Twenty-five years earlier in 1975 the United States was tied with Finland for second place (below only Japan)14
A central question is why educational attainment in the United States has been on a plateau in recent years In seeking to answer this question a key analytical tool is the wage premiums earned by college graduates and high school graduates Data painstakingly assembled by Goldin and Katz (presented in Figure 13) show that both of these premiums fell sharply between 1915 and 1950 moved somewhat erratically between 1950 and 1980 and then increased sharply from 1980 to 2005mdashwith the wage premium for college graduates increasing much faster than the preshymium for high school graduates By 2005 the wage premium for college graduates had returned to the high-water mark set in 191515
In looking inside these ratios Goldin and Katz found that the growth rate of demand for more educated workers (relative to less educated workers) was fairly constant over the entire period from 1915 to 2005 It was the pronounced slow-down in the rate of growth in the supply of edshyucated workers (especially native-born workers) that was primarily reshysponsible for the marked increase in the college graduate wage premium In recent years growth in the supply of college-educated workers has been sluggish and has not kept up with increases in demandmdashespecially inceases in the demand for individuals with strong problem-solving skills
065 045College Graduate Wage Premium High School Graduate Wage Premium
040
035
030
025
020
055
045
035
025 1910 1920 1930 1940 1950 1960 1970 1980 1990 2000 2010
Colle
ge G
radu
ate
Wag
e Pr
emiu
m
Hig
h Sc
hool
Gra
duat
e W
age
Prem
ium
Figure 13 Wage Premiums of College Graduates and High School Graduates 1915ndash2005
Source Goldin and Katz figure 81
6
Copyrighted Material
C H A P T E R 1
and degrees from the more selective undergraduate programs and leadshying professional schools16 The real puzzle is why educational attainment has failed to respond to the powerful economic incentives represented by the high college graduate wage premium We would have expected risshying returns on investments in a college education to have elicited a solid increase in the number of students earning bachelorrsquos degrees17 But this has not happened
To be sure some commentators have suggested that the perception that there are superior economic returns to investments in higher edushycation is mistaken however careful statistical work by several leading economists strongly suggests that these worries are misplaced Indeed reshysearch reported and reviewed by David Card (among others) suggests that returns for prospective college students who might be added ldquoat the marginrdquo are at least as high as the average for all students18 As Goldin and Katz put it there may be some ldquonatural limitrdquo to the share of high school graduates who can benefit from earning a college degreemdashthe opshytimal graduation rate is surely not 100 percentmdashbut there is no evidence that we are anywhere close to such a limit now19
Thus the sluggish response of educational attainment to economic inshycentives remains puzzling and we are driven back to the need to undershystand the forces responsible for what appears to be a ldquosupply-siderdquo block One possible explanation for the surprisingly stagnant state of overall educational attainment in the United States can be rejected out of hand the problem is not low aspirations Students of all family backgrounds have high (and rising) educational aspirations The Education Longitushydinal Study of 2002 shows that in 2002 80 percent of 10th-graders exshypected to earn a bachelorrsquos degree or highermdashwith 40 percent expecting to earn a graduate or professional degree In 1980 just half as many 10thshygraders had similarly high aspirations Especially noteworthy is the evishydence of rising aspirations among students of low socioeconomic status (SES) whereas in 1980 22 percent of these 10th-graders aspired to a bachelorrsquos degree or higher in 2002 three times as many (66 percent) had such aspirations In 2002 77 percent of black 10th-graders aspired to earn a bachelorrsquos degree or higher The conclusion is simple there are no longer pronounced aspiration gaps by race or SES20
The presence of high aspirations does not mean however that anyshything like all high-aspiring students know how to translate their aspirashytions into realities On the contrary there is much evidence of limited knowledge of how to prepare for college and how to enroll which we will present in due course More generally problems of ldquopreparednessrdquo have their roots in family circumstances and educational deficits that are evishydent both in early childhood years and in high school Subsequently fishynancial constraints combined with an aversion to borrowing on the part
7
Copyrighted Material
E D U C A T I O N A L A T T A I N M E N T
of some can inhibit students from finishing collegemdashor even from startshying Also at work are a combination of demographic trends and disparishyties in educational outcomes related to race and SES21
Before saying more about these disparities and why we consider them so important we need to fill in one more piece of the larger puzzle For much of our recent history the United States has relied heavily on ldquoimshyportsrdquo of well-educated students from other countries to compensate for its own difficulties in graduating enough native-born candidates for adshyvanced degrees and in particular for jobs in science and engineering Census data reveal that in 2000 foreign-born holders of doctorates conshystituted approximately half of all doctorate-holders among employed enshygineers scientists and mathematicians22 The percentage of science and engineering PhD graduates who were foreign born increased from 23 percent in 1966 to 39 percent in 200023
It would be a serious mistake to believe that the United States can conshytinue to rely so heavily on this inflow of talent from overseas Following 911 there was a marked fall-off in foreign enrollments due in part to visa issues Visa processing has now become more efficient and some of the perception problems that inhibited foreign enrollment have lessened Still it is unclear what will happen to foreign enrollments especially to foreign enrollments in graduate programs in science and engineering A survey released by the Council of Graduate Schools (CGS) in August 2008 indicates that while the number of foreign students admitted to US gradshyuate schools increased in 2008 the rate of increase over the previous year declined for the second consecutive year Data released by the CGS in Noshyvember 2008 show that first-time enrollment also grew by just 3 percent24
An important consideration to bear in mind is that universities in other parts of the world including both Europe and Asia are making increasshyingly aggressive efforts to compete for top students from all over the world India China and South Korea are examples of countries actively engaged in improving their own educational systems25 In the future promising students from these countries will have better and better educational opportunities at home China now takes in more students than it sends abroad in 2007 its foreign enrollment ranked fifth in the world26 The moral of the story is simple the United States is going to have to do a better job of ldquogrowing its own timberrdquomdasha phrase popular in South Africa where the same issues are being debated Of course inshycreasing educational attainment at the bachelorrsquos level is not the onlymdash and probably not the most efficientmdashway of increasing the number of Americans who earn advanced degrees in science and engineering Serishyous thought needs to be given to the incentives that influence choice of major among US undergraduates and to the incentives used to encourshyage students to undertakemdashand completemdashadvanced degrees
8
Copyrighted Material
C H A P T E R 1
EDUCATIONAL DISPARITIES AND WHY THEY MATTER
In seeking to understand patterns of educational attainment so that we can address recent shortfalls in the rate of growth of human capital a mashyjor complicationmdashand a major source of concernmdashis the existence of large disparities in educational outcomes related to (1) raceethnicity and gender and (2) SES which reflects both family income and parental education In budget materials related to higher education which were released by the White House and which presented an overview of Presishydent Obamarsquos 2010 fiscal budget these disparities were acknowledged by noting that there is an ldquoopportunity gaprdquo as well as a shortfall in the overshyall number of college graduates27 We document these disparities in deshytail in Chapters 3 and 4 of this study For present purposes it will suffice to compare the national educational attainment rates (defined here as the percentage of eighth-graders who went on to earn a bachelorrsquos deshygree by age 26) of students from the two groups just mentioned28
1 Thirty-six percent of white women earned a bachelorrsquos degree by age 26 compared with 22 percent of black women and 13 percent of Hispanic women just under 30 percent of white men earned a bachelorrsquos degree compared with 11ndash12 percent of black and Hisshypanic men
2 Sixty-eight percent of students from families in the top income quarshytile with at least one parent having received a college degree earned a bachelorrsquos degree by age 26 compared with just 9 percent of those from families in the bottom income quartile with neither parent having received a college degree
Why do these pronounced disparities (and others not highlighted here) matter so much First the deeply rooted differences in academic achieveshyment that are associated with race and ethnicity when considered alongshyside demographic trends have major adverse implications for the countryrsquos overall level of educational attainment in the future The most consequenshytial demographic trend relates to Hispanic students Between 2004ndash05 and 2014ndash15 the nationrsquos public schools are projected to produce nearly 197000 fewer white non-Hispanic high school graduates (a decline of 11 percent) over this same period the public high schools will produce almost 207000 more Hispanic graduates (an increase of 54 percent) If current differences in college graduation rates by raceethnicity persist this shift alone implies that there will be a decrease of roughly 5 percent in the nashytionrsquos overall educational attainment rate (and the drop would be greater were it not for the partially offsetting effect of a projected increase in Asian high school graduates who have an above-average completion rate)29
In August 2008 the US Census Bureau projected that by 2042 Amershyicans who identify themselves as Hispanic black Asian American Indian
9
Copyrighted Material
E D U C A T I O N A L A T T A I N M E N T
Native Hawaiian and Pacific Islander will together outnumber non-Hispanic whites Just four years earlier officials had projected that this shift would occur in 2050 The New York Times reports ldquoFor the first time both the number and the proportion of non-Hispanic whites who now account for 66 percent of the population will decline starting around 2030 By 2050 their share will dip to 46 percentrdquo30
The conclusion is simple a failure to reduce current disparities in rates of educational attainment by raceethnicity is bound to exacerbate the problem of a sluggish at best rate of increase in human capital formashytion It will not do to concentrate efforts on improving outcomes of college-bound upper-class white students who already have a much higher rate of educational attainment than do other studentsmdashif for no other reason than that there are not going to be enough of them
Second disparities in educational attainment lead to greater inequalshyities of all kinds which in turn have multiple long-term effects Consisshytent with the tenor of the findings of Goldin and Katz cited earlier the Department of Educationrsquos 2008 Condition of Education report tells us that young adults with bachelorrsquos degrees earned 28 percent more in 2006 than those with associatersquos degrees and 50 percent more than those with just high school diplomas31 In recent years there have been numerous articles in the popular press citing dramatic differences in rates of inshycrease in income between those at the top of the income distribution and everyone else According to a 2004 Congressional Budget Office study those in the top quintile were making 63 percent more than in 1979 afshyter adjusting for inflation comparable increases were 2 percent (bottom quintile) 11 percent (next quintile) 13 percent (middle quintile) and 23 percent (fourth quintile) In 1979 the top 1 percent received 9 pershycent of total income in 2004 they received 16 percent In commenting on these data Roger Lowenstein emphasizes the strong link with educashytional attainment and describes the failure of rates of educational attainshyment to rise in the face of high returns as a ldquoconundrumrdquo32
The consequences of failing to deal with these growing inequalities can be profound As one commentator put it ldquoThere is little question that it is bad for onersquos health to be poorrdquo More generally ldquoresearch indicates that high inequality reverberates through societies on multiple levels correlating with if not causing more crime less happiness poorer menshytal and physical health less racial harmony and less civic and political participationrdquo There is evidence ldquothat living in a society with wide disparitiesmdashin health in wealth in educationmdashis worse for all the socishyetyrsquos membersrdquo Apparently ldquorelative deprivationrdquo is an important pheshynomenon and there is evidence that levels of stress throughout a society tend to be a function of the degree of inequality33
Third as the arguments in the University of Michigan affirmative action case demonstrate34 there is educational value to the presence in classshy
10
Copyrighted Material
C H A P T E R 1
rooms and on campuses of a diverse student population with diversity meashysured along many dimensions (raceethnicity gender SES geography)
Fourth equity and fairness concerns are to our way of thinking comshypelling The long-term health of our country depends on the existence of social mobility and a widely shared confidence that students from racial minorities and poor families have a real opportunity to move ahead The increasing inequalities in income and wealth that are so much in the news these days highlight the importance of ensuring that educational opportunities close rather than widen disparities in access to the most powerful as well as the most highly remunerated positions in society In the Michigan affirmative action case Justice Sandra Day OrsquoConnor broke new ground when she moved beyond the diversity deshyfense of affirmative action to opine that ldquothe diffusion of knowledge and opportunity must be accessible to all individuals regardless of race or ethnicity Effective participation by members of all racial and ethnic groups in the civic life of our Nation is essential if the dream of one Nashytion indivisible is to be realizedrdquo35
THE PUBLIC UNIVERSITIES IN OUR STUDY THEIR SALIENT CHARACTERISTICS AND ldquoLOCATIONrdquo
WITHIN AMERICAN HIGHER EDUCATION
It is against this sobering backdropmdashin which present-day realities contrast so sharply with deeply held aspirationsmdashthat we now describe the main inshystitutional ldquoactorsrdquo in the story that we are about to tell As important as the private sector of higher education is in America36 the struggle to improve educational attainment across the board and to reduce the marked disshyparities in outcomes that are so troubling will take place mainly within the public universities In the vernacular that is ldquowhere the action isrdquo (or at least most of it) Approximately two-thirds of all full-time students pursuing bachelorrsquos degrees at four-year colleges and universities attend public unishyversities As a group public universities are of course subsidized by the states in which they are located charge lower tuition to in-state than to outshyof-state students and enroll undergraduate students who are residents of the states in which the universities are located (about 80 percent on avershyage) Most state systems are stratified and include a wide range of public institutionsmdashboth research-intensive public universities (with extensive PhD programs and professional schools in fields such as law business and medicine) and ldquocomprehensiverdquo colleges and universities that place more emphasis on undergraduate and masterrsquos-level programs
In pursuing our strategy of focusing on the public sector in general we first gathered data on the approximately 125000 members of the 1999 entering cohort at 21 prestigious research-intensive flagship universities
11
Copyrighted Material
E D U C A T I O N A L A T T A I N M E N T
(listed in Table 11)37 These universities are all members of the Association of American Universities and are widely regarded as leaders in American higher education They were chosen on the basis of a non-scientific but careshyfully considered effort to achieve both geographic diversity (the set of instishytutions being studied includes flagship universities from the West Coast the Midwest the South and the Northeast) and a mix of other characteristics including differences in racial composition and in degree of selectivity as approximated by the average SATACT score of enrolled students38
We then added data on the rsquo99 entering cohorts at essentially all pubshylic universities in the four state systems of Maryland North Carolina Ohio and Virginia (these 47 additional state system public universities are listed in Table 12 and described in more detail in Appendix Table 12)39 The two main differences between the flagships and the state sysshytem universitiesmdashapart from the much greater geographic dispersion of the flagships which reflects the different ways in which the two sets of universities were chosenmdashare in average entering enrollment and selecshytivity The average flagship in our study enrolled slightly more than 4100 first-time full-time freshmen in 1999 as compared with a median enrollshyment of just 1400 at the 47 state system universities The median average SATACT score of the entering freshmen in the flagships was 170 points higher than the median average in the 47 state system universities
As is evident from Tables 11 and 12 we divided the universities in our two databases into selectivity clusters based on the average SATACT scores of their entering classes we refer to these clusters as SEL I SEL II and SEL III in the case of the flagships and as SEL A and SEL B in the case of the state systems Use of a selectivity categorization is not meant to imply that we endorse ldquothe rankings gamerdquo which we regard as foolshyish and hurtful to students trying to find the best fit between their capashybilities and interests and the characteristics of institutions to which they choose to apply There is no denying however that there are proshynounced differences in outcomes such as graduation rates across selecshytivity clusters Failure to acknowledge these differences would muddy the analysis of many important questions such as the effects on outcomes of high school characteristics and differences in the predictive power of SATACT scores and high school GPA The use of selectivity clusters also allows us to study on something approaching an other-things-equal bashysis the strong relationship between institutional selectivity per se and outshycomes such as graduation rates and time-to-degree Near the end of this chapter we will present additional information on trends in selectivity among the flagships and will also comment more generally on the charshyacteristics of these important universities
As we now seek to ldquolocaterdquo our universities within the universe of four-year institutions the first point to note is that the 68 public universities in our study (21 flagships plus other state system universities including hisshy
12
Copyrighted Material
C H A P T E R 1
TABLE 11 Flagship Universities by Selectivity Cluster
SEL I University of CaliforniandashBerkeley University of CaliforniandashLos Angeles (UCLA) University of MarylandndashCollege Park University of Michigan University of North CarolinandashChapel Hill University of Virginia
SEL II Pennsylvania State University Rutgers The State University of New Jersey University of Florida University of Illinois at Urbana-Champaign University of TexasndashAustin University of Washington University of WisconsinndashMadison
SEL III Iowa State University Ohio State University Purdue University Stony Brook University University of Iowa University of MinnesotandashTwin Cities University of NebraskandashLincoln University of Oregon
torically black colleges and universities or HBCUs) educate a far from trivshyial share of all students at four-year colleges and universities in this counshytry Full-time freshmen at these universities make up almost a quarter of full-time freshmen at all four-year public universities (our estimate is 23 percent) and roughly 15 percent of full-time freshmen at all public and prishyvate four-year colleges and universities Of course these percentages drop appreciably if we choose as a reference point students attending all two-year or four-year colleges the 15 percent figure falls to about 10 percent
A next key question is how the characteristics of the public universities that we study compare with the characteristics of the entire set of public and private universities that make up the four-year sector of Amershyican higher education Table 13 provides a basis for answering this quesshytion In this table we show summary data for our 21 flagships and the 28 state system SEL Bs and comparable summary data for all four-year pubshylic universities and all four-year private colleges and universities40 We exshyclude the 8 state system SEL As shown in Table 12 because they are simishy
13
Copyrighted Material
E D U C A T I O N A L A T T A I N M E N T
TABLE 12 State System Universities by Selectivity Cluster or HBCU Status
Maryland SEL A University of MarylandndashBaltimore County
SEL B Frostburg State University Salisbury University Towson University
HBCU Bowie State University Coppin State University University of MarylandndashEastern Shore
North Carolina SEL A North Carolina State University University of North CarolinandashAsheville
SEL B Appalachian State University University of North CarolinandashCharlotte University of North CarolinandashGreensboro University of North CarolinandashPembroke University of North CarolinandashWilmington Western Carolina University
HBCU Elizabeth City State University Fayetteville State University North Carolina AampT University North Carolina Central University WinstonndashSalem State University
Ohio SEL A Miami University
SEL B Bowling Green State University Cleveland State University Kent State University Ohio University Shawnee State University University of Akron University of Cincinnati University of Toledo Wright State University Youngstown State University
HBCU Central State University
Virginia SEL A College of William and Mary James Madison University University of Mary Washington Virginia Tech
SEL B Christopher Newport University George Mason University Longwood University Old Dominion University Radford University University of Virginiarsquos College at Wise Virginia Commonwealth University Virginia Military Institute
HBCU Norfolk State University Virginia State University
lar in so many respects to the flagships and we also exclude the 11 state system HBCUs because they have few national counterparts (In the chapshyters that follow we describe the characteristics of these HBCUs within the context of their respective state systems)
These comparisons are revealing in many ways We see first of all that the flagships differ in almost all respects from both the state system SEL
14
Copyrighted Material
C H A P T E R 1
Bs and all public and private four-year institutions As we would have exshypected the flagships have much larger undergraduate enrollments higher SATACT scores lower admit rates and higher average graduashytion rates They also have more diverse student bodies (with white non-Hispanic students comprising only about three quarters of their student bodies) which we think results primarily from the fact that a number of the flagships are in heavily urban areas and in states such as California with large Asian and Hispanic populations (Appendix Tables 11 and 12 provide much more detailed data on the ethnic and racial compositions of the student bodies of the individual universities in our study)
The more interesting comparisons are between our state system SEL Bs and the rest of the four-year colleges and universities in America Usshying median first-year enrollment as one metric we find that the SEL Bs are on average roughly 80 percent larger than the typical public unishyversity and almost seven times larger than the typical private college or universitymdasha sector that includes many very small institutions (To proshyvide some indication of the dispersion around the medians in Table 13 we also report interquartile ranges the main lesson the ranges teach us is that there is considerably more variation among the private colleges and universities than among the public institutions and that as one would expect there is more variation among all four-year public institushytions than there is among our state system SEL Bs)
Much more striking than differences in median enrollment and perhaps more surprising is that the SEL Bs are very much like both all public and all private four-year colleges and universities in terms of selectivity The avshyerage SATACT scores and average admit rates (both measured as medishyans) are very very similar across these sets of institutionsmdashthe average SATACT scores differ by no more than 2 or 3 percent the SEL Bs admit 77 percent of their applicants whereas all publics admit 75 percent and all private institutions admit 78 percent In racial diversity too the differences between the SEL Bs and the larger sets of universities are minimal As one would expect the SEL Bs and all four-year publics enroll more in-state stushydents than do the private institutions Finally the average six-year graduashytion rate at the SEL Bs (51 percent) is reasonably close to the average for all publics (45 percent) and all private institutions (55 percent) The genshyeral conclusion we draw from these data is that in terms of selectivity dishyversity and graduation rates the state system SEL Bs in our study are tolershyably representative of American higher education
So although we do not want to claim too much for the ldquorepresentashytivenessrdquo of the results that we report in this book (which certainly do not reflect anything purporting to be a ldquoscientificrdquo sampling effort) we are reassured to find that our population is both consequential in size andmdash putting the flagships off to one sidemdashsurprisingly similar in key characshyteristics to the rest of American higher education The SEL B comparshy
15
Copyrighted Material
E D U C A T I O N A L A T T A I N M E N T
TABLE 13 ldquoLocationrdquo of the Public Universities in Our Study within
American Higher Education
All All Our State Four-Year Four-Year
Our System Public Private Flagships SEL Bs Universities Universities
Number of Institutions 21 28 540 1129 Total Full-Time 94316 51736 749273 392331
Freshman Enrollment Median Full-Time 4131 1922 1059 280
Freshman Enrollment (3619ndash5291) (897ndash2555) (539ndash2035) (145ndash486) Median SATACTa 1195 1030 1018 1065
(1125ndash1240) (975ndash1058) (970ndash1090) (990ndash1140) Median Admit Rate 64 77 75 78
(Percent) (54ndash74) (71ndash88) (64ndash85) (68ndash85) Median Percentage White 76 83 80 83
(64ndash81) (77ndash89) (62ndash89) (68ndash91) Median Percentage 79 90 90 63
In-State (70ndash90) (86ndash95) (86ndash96) (40ndash82) Median Six-Year 77 51 45 55
Graduation Rate (66ndash84) (45ndash61) (35ndash56) (41ndash68) (Percent)
Source IPEDS (Integrated Postsecondary Education Data System) and College Board Annual Survey of Colleges
Notes For full-time freshman enrollment average SATACT scores admit rates percentage of white students percentage of in-state students and six-year graduation rates we present interquartile ranges as well as medians (with the figures at the 25th and 75th percentiles shown below the medians)
aMedian of the average SATACT score for each institution
isons also reinforce our sense that we were wise to include the four state systems in our study as a complement to the flagships
THE FLAGSHIPS TRENDS IN SELECTIVITY AND OTHER CHARACTERISTICS
In contrast to the SEL Bs the flagships are far from ldquorepresentativerdquo the students at these prestigious universities are by any measure a special group They have had strong pre-collegiate preparation and they enjoy access to educational resources far beyond what can be offered by many other colleges and universities public and private For both of these reashysons it is hardly surprising that graduation rates at the flagships are apshypreciably higher than the rates among students attending all four-year colleges and universities
16
Copyrighted Material
C H A P T E R 1
As many commentators have noted (see the discussion in Appendix A) the flagship universities have become much more selective over time At three highly selective universities for which we have been able to assemshyble consistent data for the years 1974ndash2006mdashthe University of Californiandash Los Angeles (UCLA) the University of North Carolina (UNC)ndashChapel Hill and the University of Virginiamdashthe fraction of entering students with A or A+ high school grades has risen from roughly 55 percent to about 90 percent over this 35-year period (Figure 14) At three somewhat less selective universities (Iowa State and Ohio State Universities and Virshyginia Tech) the fraction of entering students with A or A+ grades has risen at least as rapidlymdashfrom just over 20 percent to roughly 60 percentmdash at the same time that the fraction with high school grades in the C+ or lower range has fallen from just over 10 percent to nearly zero (Figure 15)41 In Chapter 12 we comment on the policy implications of this proshynounced increase in selectivity
There have been accompanying changes in the SES of students atshytending these universities as reflected for example in the highest level of education obtained by mothers of entering freshmen In 1972 at the three less selective universities listed in the previous paragraph more
100
90
80
70
60
50
40
30
20
10
0 1974 1978 1982 1986 1990 1994 1998 2002 2006
A or A+ B or B+ C+ or Below
Perc
enta
ge o
f Stu
dent
s
Figure 14 Average High School Grade Distribution of Incoming Freshmen at Highly Selective Universities
Source Higher Education Research Institute (HERI) Freshman Survey Note The universities included are UCLA UNCndashChapel Hill and the University of Virshy
ginia These trends were obtained by taking an average of the grades at the three schools Blanks represent missing data for at least one of the constituent universities for the correshysponding year
17
Copyrighted Material
E D U C A T I O N A L A T T A I N M E N T
100
90
80
70
60
50
40
30
20
10
0 1976 1980 1984 1988 1992 1996 20001972
A or A+ B or B+ C+ or Below
Perc
enta
ge o
f Stu
dent
s
Figure 15 Average High School Grade Distribution of Incoming Freshmen at Less Selective Universities
Source HERI Freshman Survey Note The universities included are Iowa State and Ohio State Universities and Virginia
Tech These trends were obtained by taking an average of the grades at the three schools Blanks represent missing data for at least one of the constituent universities for the correshysponding year
than 40 percent of these mothers had only a high school degree by 2002 this percentage had fallen to 20 percent and by then almost an equal number had a graduate degree Of course educational attainment of women has risen dramatically across the board but not at this rate There is also evidence that average family income has gone up markedly much faster than the national average Today more than 40 percent of the undergraduates at these universities come from families in the top quarshytile of the income distribution42
These widely recognized trendsmdashboth in the degree of selectivity and in the share of students who come from privileged backgroundsmdashhave provoked much debate as to whether these institutions are becoming too ldquoprivatizedrdquo and are losing their traditional character what some think of as their role as ldquopeoplersquos universitiesrdquo It is not for us to pronounce on this issuemdashwhich is in fact much more complicated than it is sometimes thought to bemdashbut Eugene Tobinrsquos analysis of the evolution of the flagshyships in Appendix A reminds us of several salient points
bull The flagships are important to American higher education and to America for many reasons beyond the education they provide to talshy
18
Copyrighted Material
C H A P T E R 1
ented undergraduates They are major research universities that also have many of the countryrsquos leading graduate and professional proshygrams In addition they contribute in many ways to the states in which they are located There are naturalmdashinevitablemdashtensions beshytween the varied missions of these universities at the same time that they complement each other in many ways One reason these unishyversities are more selective than ever before is that many of the counshytryrsquos most promising undergraduates want to study in a university that has excellent faculty a commitment to scholarship and gradushyate education that is both important in its own right and necessary to recruit and hold outstanding faculty
bull As enrollment pressures have mounted along with pressures to exshycel in research and graduate education it is natural that many states have opted for greater specialization of function in their overall sysshytems of higher education The California Master Plan (discussed at length in Appendix A) is a good example of how it is possible to stratshyify systems of higher educationmdashbut the actual experience in Calishyfornia is a good warning that the results obtained (in terms for inshystance of the overall number of bachelorrsquos degrees conferred) do not always match idealized notions of how carefully structured sysshytems of higher education will in fact perform
bull The greater selectivity that we observe today is the result in large part of demographic trends not conscious policy decisions The number of prospective students with strong academic credentials has inshycreased faster than places at the flagships and the result is an entirely predictable increase in the competition for these places Because famshyily background correlates with academic preparation the increasing concentration at these universities of students from privileged backshygrounds is hardly surprising But we should also recognize that stushydent bodies at the flagships were never as ldquorepresentativerdquo of the popshyulations of their states as some would have us believe In earlier days large fractions of those eligible to attend leading public universities came as they do now from the professional and upper-income famshyilies that saw to it that their children had the pre-collegiate preparashytion necessary to succeed at these universities
bull Finally it is important to resist the temptation to imagine that there was a ldquogolden agerdquo in which students from every background were taught personally and brilliantly at major flagship universities as a matter of course One of the most telling vignettes in the account of the evolution of the flagships in Appendix A is the complaint by undergraduates attending universities roughly 100 years ago in the early part of the 20th century that they were taught in large lecture courses and ldquoleft adrift unaided in an extremely impersonal enshy
19
Copyrighted Material
E D U C A T I O N A L A T T A I N M E N T
vironmentrdquo The more things change the more they stay the same And today resource constraints at even the most prestigious flagshyships can prevent undergraduates from attending the courses they really want to attend never mind having direct access to tenured facshyulty members in these respects small highly selective liberal arts colshyleges have an advantage which is one reason that they have such high graduation rates
These observations are intended only to set the stage for the discussion of educational attainment that is to follow by suggesting that in analyzing outshycomes of todayrsquos undergraduates attending flagship universities it is necshyessary to have in mind the range of functions these universities are meant to perform and the sometimes conflicting pressures that beat upon them
We want to end this first chapter by reiterating that the purpose of the reshysearch reported in this book is not only to improve our understanding of patterns and relationships but alsomdashas a high prioritymdashto search for clues about ways to make Americarsquos colleges and universities more sucshycessful in moving entering students on to graduation Regrettably if not surprisingly our studies have not led to the discovery of any simple ldquoquick fixesrdquo or ldquomagic bulletsrdquo Many of the patterns we see are remarkably conshysistent across institutions and settings and many of them result we beshylieve from deep-seated features of American society that will not easily yield to efforts to bring about change Much patience will be required
Nevertheless our work has helped us to identify important steps that colleges and universities state governments and the federal government can take to improve college outcomes especially for disadvantaged stushydents We also believe that focusing sharply on levels of achievement and success in college may in and of itself encourage universities and policy makers to find new ways to make things better As recent work in the hosshypital industry shows simply directing attention to an entrenched probshylem like hospital-borne infections can stimulate remedial actions at the local level Lasting improvements will surely require patience (reashysonably long time horizons) determination and willingness to be guided by evidencemdashas well as the capacity to harvest the low-hanging fruit as promptly as possible But the goal of helping more Americans from all backgrounds complete college in a timely way is well worth the effort that will be required
2
Copyrighted Material
C H A P T E R 1
aries of every kind have unquestionably increased the value of brainpower and training in every country As President Obama has said ldquoIn a global economy where the most valuable skill you can sell is your knowledge a good education is no longer just a pathway to opportunitymdashit is a preshyrequisiterdquo7 Leonhardt adds ldquoThere really is no mystery about why edushycation would be the lifeblood of economic growth [Education] helps a society leverage every other investment it makes be it in medicine transshyportation or alternative energyrdquo8 Nor are economic gains the only reashyson to assert the importance of educational attainment The ability of a democracy to function well depends on a high level of political engageshyment which is also tied to the educational level of the citizenry A high level of educational attainment fosters civic contributions of many kinds9
Even though our emphasis on ldquofinishingrdquo is meant to be a useful corshyrective to the sometime tendency to focus simply on ldquostartingrdquo we hasten to add that there are of course dimensions of college success beyond just graduating that must also be kept in mind The kind and quality of the undergraduate education obtained are plainly important It would be a serious mistake to treat all college degrees as the same or to put so much emphasis on earning a degree that other educational objectives are lost from sight This is why some are skeptical of the weight given by the Nashytional Collegiate Athletic Association to graduation rates (whatever the subject studied and whatever the rigor of the graduation requirements) in assessing the academic performance of scholarship athletes As in platshyform diving differences in the ldquodegree of difficultyrdquo of various courses of study deserve to be acknowledged and considerable weight should be given to academic achievement in assessing educational outcomes For these reasons we examine fields of study chosen by students and grades earned as well as graduation rates However much as there is to be said for such finer-grained analyses we believe it is valuable to place special emshyphasis on graduation rates as presumptively the single most important inshydicator of educational attainmentmdashwhich is what we do in this book
EDUCATIONAL ATTAINMENT IN THE UNITED STATES
These basic propositions explain why there is reason for serious concern about the slow-down in the rate of increase in the overall level of educashytional attainment in the United States The facts are sobering As Goldin and Katz report on the basis of an exhaustive study of historical records the achievements of America in the first three quarters of what they call ldquothe Human Capital Centuryrdquo are impressive indeed This countryrsquos then unprecedented mass secondary schooling and the concurrent establishshyment of an extensive and remarkably flexible system of higher education combined to produce gains in educational attainment that were both
3
Copyrighted Material
E D U C A T I O N A L A T T A I N M E N T
steady and spectacular (see Figure 11 which plots years of schooling by birth cohorts from 1876 to the present) Unfortunately this truly amazing record of progress came to a halt about the time when members of the 1951 birth cohort (who were 24 years old in 1975) were attending college10
We see this same ldquoflatteningrdquo when we use data from the Current Popushylation Survey to track the educational attainment of 25- to 29-year-olds from 1968 to 2007 (Figure 12) Although there was a modest increase in educational attainment in the 1990s the curve is flat for the years thereshyafter The failure of educational attainment to continue to increase steadily is the result of problems at all stages of education starting with pre-school and then moving through primary and secondary levels of edshyucation and on into college (see the discussion in Chapter 2 of ldquolossesldquo of students at each main stage of the educational process) Our focus on completion rates at the college level should certainly not be read as disshymissing the need to make progress at earlier stages In any case it is noteshyworthy that over this 40-year period the completion rate (the fraction of those who started college who eventually earned a bachelorrsquos degree) changed hardly at all while time-to-degree increased markedly11
This is not a pretty picture when looked at through the lens of Amershyicarsquos history of educational accomplishments during the first 75 years of the 20th century It is an equally disturbing picture when juxtaposed with
15
14
13
12
11
10
9
8
7
Year of Birth
Figure 11 Years of Schooling of US Native-Born Citizens by Birth Cohorts 1876ndash1975
Source Goldin and Katz figure 14
Year
s of
Sch
oolin
g at
Age
35
Year
s
1870 1880 1890 1900 1910 1920 1930 1940 1950 1960 1970 1980
4
Copyrighted Material
C H A P T E R 1
1968 1973 1978
Completion Rate Some College or More Bachelorrsquos Degree or More
1983 1988 1993 1998 2003
70
60
50
40
30
20
10
0
Shar
e Ba
chel
orrsquos
Lev
el S
hare
Som
e Co
llege
(Per
cent
)
Figure 12 Educational Attainment of 25- to 29-Year-Olds 1968ndash2007 Source Current Population Survey
the remarkable gains in educational attainment in other countries As is increasingly recognized the United States can no longer claim that it is ldquofirst-in-classrdquo in terms of continuing progress in building human capital The 2008 annual stock-taking document produced by the Organization for Economic Co-operation and Development (OECD) reported that the 2006 higher education attainment rate for 25- to 34-year-olds in the United States is nearly identical to that of 55- to 64-year-olds a group 30 years their senior In 2006 the United States ranked 10th among the members of the OECD in its tertiary attainment rate This is a large drop from preceding years the United States ranked 5th in 2001 and 3rd in 1998 Moreover in the United States only 56 percent of entering students finished college an outcome that placed this country second to the botshytom of the rank-ordering of countries by completion rate12 In recognishytion of this reality President Obama has set an ambitious goal for Amershyican higher education ldquoBy 2020 America will once again have the highshyest proportion of college graduates in the worldrdquo13 And the situation in the United States is even more worrying when the focus is on degrees in the natural sciences and engineering According to a report published by the National Science Board ldquoThe proportion of the college-age populashytion that earned degrees in NSampE fields was substantially larger in more than 16 countries in Asia and Europe than in the United States in 2000rdquo
5
Copyrighted Material
E D U C A T I O N A L A T T A I N M E N T
In that year the United States ranked just below Italy and above only four other countries Twenty-five years earlier in 1975 the United States was tied with Finland for second place (below only Japan)14
A central question is why educational attainment in the United States has been on a plateau in recent years In seeking to answer this question a key analytical tool is the wage premiums earned by college graduates and high school graduates Data painstakingly assembled by Goldin and Katz (presented in Figure 13) show that both of these premiums fell sharply between 1915 and 1950 moved somewhat erratically between 1950 and 1980 and then increased sharply from 1980 to 2005mdashwith the wage premium for college graduates increasing much faster than the preshymium for high school graduates By 2005 the wage premium for college graduates had returned to the high-water mark set in 191515
In looking inside these ratios Goldin and Katz found that the growth rate of demand for more educated workers (relative to less educated workers) was fairly constant over the entire period from 1915 to 2005 It was the pronounced slow-down in the rate of growth in the supply of edshyucated workers (especially native-born workers) that was primarily reshysponsible for the marked increase in the college graduate wage premium In recent years growth in the supply of college-educated workers has been sluggish and has not kept up with increases in demandmdashespecially inceases in the demand for individuals with strong problem-solving skills
065 045College Graduate Wage Premium High School Graduate Wage Premium
040
035
030
025
020
055
045
035
025 1910 1920 1930 1940 1950 1960 1970 1980 1990 2000 2010
Colle
ge G
radu
ate
Wag
e Pr
emiu
m
Hig
h Sc
hool
Gra
duat
e W
age
Prem
ium
Figure 13 Wage Premiums of College Graduates and High School Graduates 1915ndash2005
Source Goldin and Katz figure 81
6
Copyrighted Material
C H A P T E R 1
and degrees from the more selective undergraduate programs and leadshying professional schools16 The real puzzle is why educational attainment has failed to respond to the powerful economic incentives represented by the high college graduate wage premium We would have expected risshying returns on investments in a college education to have elicited a solid increase in the number of students earning bachelorrsquos degrees17 But this has not happened
To be sure some commentators have suggested that the perception that there are superior economic returns to investments in higher edushycation is mistaken however careful statistical work by several leading economists strongly suggests that these worries are misplaced Indeed reshysearch reported and reviewed by David Card (among others) suggests that returns for prospective college students who might be added ldquoat the marginrdquo are at least as high as the average for all students18 As Goldin and Katz put it there may be some ldquonatural limitrdquo to the share of high school graduates who can benefit from earning a college degreemdashthe opshytimal graduation rate is surely not 100 percentmdashbut there is no evidence that we are anywhere close to such a limit now19
Thus the sluggish response of educational attainment to economic inshycentives remains puzzling and we are driven back to the need to undershystand the forces responsible for what appears to be a ldquosupply-siderdquo block One possible explanation for the surprisingly stagnant state of overall educational attainment in the United States can be rejected out of hand the problem is not low aspirations Students of all family backgrounds have high (and rising) educational aspirations The Education Longitushydinal Study of 2002 shows that in 2002 80 percent of 10th-graders exshypected to earn a bachelorrsquos degree or highermdashwith 40 percent expecting to earn a graduate or professional degree In 1980 just half as many 10thshygraders had similarly high aspirations Especially noteworthy is the evishydence of rising aspirations among students of low socioeconomic status (SES) whereas in 1980 22 percent of these 10th-graders aspired to a bachelorrsquos degree or higher in 2002 three times as many (66 percent) had such aspirations In 2002 77 percent of black 10th-graders aspired to earn a bachelorrsquos degree or higher The conclusion is simple there are no longer pronounced aspiration gaps by race or SES20
The presence of high aspirations does not mean however that anyshything like all high-aspiring students know how to translate their aspirashytions into realities On the contrary there is much evidence of limited knowledge of how to prepare for college and how to enroll which we will present in due course More generally problems of ldquopreparednessrdquo have their roots in family circumstances and educational deficits that are evishydent both in early childhood years and in high school Subsequently fishynancial constraints combined with an aversion to borrowing on the part
7
Copyrighted Material
E D U C A T I O N A L A T T A I N M E N T
of some can inhibit students from finishing collegemdashor even from startshying Also at work are a combination of demographic trends and disparishyties in educational outcomes related to race and SES21
Before saying more about these disparities and why we consider them so important we need to fill in one more piece of the larger puzzle For much of our recent history the United States has relied heavily on ldquoimshyportsrdquo of well-educated students from other countries to compensate for its own difficulties in graduating enough native-born candidates for adshyvanced degrees and in particular for jobs in science and engineering Census data reveal that in 2000 foreign-born holders of doctorates conshystituted approximately half of all doctorate-holders among employed enshygineers scientists and mathematicians22 The percentage of science and engineering PhD graduates who were foreign born increased from 23 percent in 1966 to 39 percent in 200023
It would be a serious mistake to believe that the United States can conshytinue to rely so heavily on this inflow of talent from overseas Following 911 there was a marked fall-off in foreign enrollments due in part to visa issues Visa processing has now become more efficient and some of the perception problems that inhibited foreign enrollment have lessened Still it is unclear what will happen to foreign enrollments especially to foreign enrollments in graduate programs in science and engineering A survey released by the Council of Graduate Schools (CGS) in August 2008 indicates that while the number of foreign students admitted to US gradshyuate schools increased in 2008 the rate of increase over the previous year declined for the second consecutive year Data released by the CGS in Noshyvember 2008 show that first-time enrollment also grew by just 3 percent24
An important consideration to bear in mind is that universities in other parts of the world including both Europe and Asia are making increasshyingly aggressive efforts to compete for top students from all over the world India China and South Korea are examples of countries actively engaged in improving their own educational systems25 In the future promising students from these countries will have better and better educational opportunities at home China now takes in more students than it sends abroad in 2007 its foreign enrollment ranked fifth in the world26 The moral of the story is simple the United States is going to have to do a better job of ldquogrowing its own timberrdquomdasha phrase popular in South Africa where the same issues are being debated Of course inshycreasing educational attainment at the bachelorrsquos level is not the onlymdash and probably not the most efficientmdashway of increasing the number of Americans who earn advanced degrees in science and engineering Serishyous thought needs to be given to the incentives that influence choice of major among US undergraduates and to the incentives used to encourshyage students to undertakemdashand completemdashadvanced degrees
8
Copyrighted Material
C H A P T E R 1
EDUCATIONAL DISPARITIES AND WHY THEY MATTER
In seeking to understand patterns of educational attainment so that we can address recent shortfalls in the rate of growth of human capital a mashyjor complicationmdashand a major source of concernmdashis the existence of large disparities in educational outcomes related to (1) raceethnicity and gender and (2) SES which reflects both family income and parental education In budget materials related to higher education which were released by the White House and which presented an overview of Presishydent Obamarsquos 2010 fiscal budget these disparities were acknowledged by noting that there is an ldquoopportunity gaprdquo as well as a shortfall in the overshyall number of college graduates27 We document these disparities in deshytail in Chapters 3 and 4 of this study For present purposes it will suffice to compare the national educational attainment rates (defined here as the percentage of eighth-graders who went on to earn a bachelorrsquos deshygree by age 26) of students from the two groups just mentioned28
1 Thirty-six percent of white women earned a bachelorrsquos degree by age 26 compared with 22 percent of black women and 13 percent of Hispanic women just under 30 percent of white men earned a bachelorrsquos degree compared with 11ndash12 percent of black and Hisshypanic men
2 Sixty-eight percent of students from families in the top income quarshytile with at least one parent having received a college degree earned a bachelorrsquos degree by age 26 compared with just 9 percent of those from families in the bottom income quartile with neither parent having received a college degree
Why do these pronounced disparities (and others not highlighted here) matter so much First the deeply rooted differences in academic achieveshyment that are associated with race and ethnicity when considered alongshyside demographic trends have major adverse implications for the countryrsquos overall level of educational attainment in the future The most consequenshytial demographic trend relates to Hispanic students Between 2004ndash05 and 2014ndash15 the nationrsquos public schools are projected to produce nearly 197000 fewer white non-Hispanic high school graduates (a decline of 11 percent) over this same period the public high schools will produce almost 207000 more Hispanic graduates (an increase of 54 percent) If current differences in college graduation rates by raceethnicity persist this shift alone implies that there will be a decrease of roughly 5 percent in the nashytionrsquos overall educational attainment rate (and the drop would be greater were it not for the partially offsetting effect of a projected increase in Asian high school graduates who have an above-average completion rate)29
In August 2008 the US Census Bureau projected that by 2042 Amershyicans who identify themselves as Hispanic black Asian American Indian
9
Copyrighted Material
E D U C A T I O N A L A T T A I N M E N T
Native Hawaiian and Pacific Islander will together outnumber non-Hispanic whites Just four years earlier officials had projected that this shift would occur in 2050 The New York Times reports ldquoFor the first time both the number and the proportion of non-Hispanic whites who now account for 66 percent of the population will decline starting around 2030 By 2050 their share will dip to 46 percentrdquo30
The conclusion is simple a failure to reduce current disparities in rates of educational attainment by raceethnicity is bound to exacerbate the problem of a sluggish at best rate of increase in human capital formashytion It will not do to concentrate efforts on improving outcomes of college-bound upper-class white students who already have a much higher rate of educational attainment than do other studentsmdashif for no other reason than that there are not going to be enough of them
Second disparities in educational attainment lead to greater inequalshyities of all kinds which in turn have multiple long-term effects Consisshytent with the tenor of the findings of Goldin and Katz cited earlier the Department of Educationrsquos 2008 Condition of Education report tells us that young adults with bachelorrsquos degrees earned 28 percent more in 2006 than those with associatersquos degrees and 50 percent more than those with just high school diplomas31 In recent years there have been numerous articles in the popular press citing dramatic differences in rates of inshycrease in income between those at the top of the income distribution and everyone else According to a 2004 Congressional Budget Office study those in the top quintile were making 63 percent more than in 1979 afshyter adjusting for inflation comparable increases were 2 percent (bottom quintile) 11 percent (next quintile) 13 percent (middle quintile) and 23 percent (fourth quintile) In 1979 the top 1 percent received 9 pershycent of total income in 2004 they received 16 percent In commenting on these data Roger Lowenstein emphasizes the strong link with educashytional attainment and describes the failure of rates of educational attainshyment to rise in the face of high returns as a ldquoconundrumrdquo32
The consequences of failing to deal with these growing inequalities can be profound As one commentator put it ldquoThere is little question that it is bad for onersquos health to be poorrdquo More generally ldquoresearch indicates that high inequality reverberates through societies on multiple levels correlating with if not causing more crime less happiness poorer menshytal and physical health less racial harmony and less civic and political participationrdquo There is evidence ldquothat living in a society with wide disparitiesmdashin health in wealth in educationmdashis worse for all the socishyetyrsquos membersrdquo Apparently ldquorelative deprivationrdquo is an important pheshynomenon and there is evidence that levels of stress throughout a society tend to be a function of the degree of inequality33
Third as the arguments in the University of Michigan affirmative action case demonstrate34 there is educational value to the presence in classshy
10
Copyrighted Material
C H A P T E R 1
rooms and on campuses of a diverse student population with diversity meashysured along many dimensions (raceethnicity gender SES geography)
Fourth equity and fairness concerns are to our way of thinking comshypelling The long-term health of our country depends on the existence of social mobility and a widely shared confidence that students from racial minorities and poor families have a real opportunity to move ahead The increasing inequalities in income and wealth that are so much in the news these days highlight the importance of ensuring that educational opportunities close rather than widen disparities in access to the most powerful as well as the most highly remunerated positions in society In the Michigan affirmative action case Justice Sandra Day OrsquoConnor broke new ground when she moved beyond the diversity deshyfense of affirmative action to opine that ldquothe diffusion of knowledge and opportunity must be accessible to all individuals regardless of race or ethnicity Effective participation by members of all racial and ethnic groups in the civic life of our Nation is essential if the dream of one Nashytion indivisible is to be realizedrdquo35
THE PUBLIC UNIVERSITIES IN OUR STUDY THEIR SALIENT CHARACTERISTICS AND ldquoLOCATIONrdquo
WITHIN AMERICAN HIGHER EDUCATION
It is against this sobering backdropmdashin which present-day realities contrast so sharply with deeply held aspirationsmdashthat we now describe the main inshystitutional ldquoactorsrdquo in the story that we are about to tell As important as the private sector of higher education is in America36 the struggle to improve educational attainment across the board and to reduce the marked disshyparities in outcomes that are so troubling will take place mainly within the public universities In the vernacular that is ldquowhere the action isrdquo (or at least most of it) Approximately two-thirds of all full-time students pursuing bachelorrsquos degrees at four-year colleges and universities attend public unishyversities As a group public universities are of course subsidized by the states in which they are located charge lower tuition to in-state than to outshyof-state students and enroll undergraduate students who are residents of the states in which the universities are located (about 80 percent on avershyage) Most state systems are stratified and include a wide range of public institutionsmdashboth research-intensive public universities (with extensive PhD programs and professional schools in fields such as law business and medicine) and ldquocomprehensiverdquo colleges and universities that place more emphasis on undergraduate and masterrsquos-level programs
In pursuing our strategy of focusing on the public sector in general we first gathered data on the approximately 125000 members of the 1999 entering cohort at 21 prestigious research-intensive flagship universities
11
Copyrighted Material
E D U C A T I O N A L A T T A I N M E N T
(listed in Table 11)37 These universities are all members of the Association of American Universities and are widely regarded as leaders in American higher education They were chosen on the basis of a non-scientific but careshyfully considered effort to achieve both geographic diversity (the set of instishytutions being studied includes flagship universities from the West Coast the Midwest the South and the Northeast) and a mix of other characteristics including differences in racial composition and in degree of selectivity as approximated by the average SATACT score of enrolled students38
We then added data on the rsquo99 entering cohorts at essentially all pubshylic universities in the four state systems of Maryland North Carolina Ohio and Virginia (these 47 additional state system public universities are listed in Table 12 and described in more detail in Appendix Table 12)39 The two main differences between the flagships and the state sysshytem universitiesmdashapart from the much greater geographic dispersion of the flagships which reflects the different ways in which the two sets of universities were chosenmdashare in average entering enrollment and selecshytivity The average flagship in our study enrolled slightly more than 4100 first-time full-time freshmen in 1999 as compared with a median enrollshyment of just 1400 at the 47 state system universities The median average SATACT score of the entering freshmen in the flagships was 170 points higher than the median average in the 47 state system universities
As is evident from Tables 11 and 12 we divided the universities in our two databases into selectivity clusters based on the average SATACT scores of their entering classes we refer to these clusters as SEL I SEL II and SEL III in the case of the flagships and as SEL A and SEL B in the case of the state systems Use of a selectivity categorization is not meant to imply that we endorse ldquothe rankings gamerdquo which we regard as foolshyish and hurtful to students trying to find the best fit between their capashybilities and interests and the characteristics of institutions to which they choose to apply There is no denying however that there are proshynounced differences in outcomes such as graduation rates across selecshytivity clusters Failure to acknowledge these differences would muddy the analysis of many important questions such as the effects on outcomes of high school characteristics and differences in the predictive power of SATACT scores and high school GPA The use of selectivity clusters also allows us to study on something approaching an other-things-equal bashysis the strong relationship between institutional selectivity per se and outshycomes such as graduation rates and time-to-degree Near the end of this chapter we will present additional information on trends in selectivity among the flagships and will also comment more generally on the charshyacteristics of these important universities
As we now seek to ldquolocaterdquo our universities within the universe of four-year institutions the first point to note is that the 68 public universities in our study (21 flagships plus other state system universities including hisshy
12
Copyrighted Material
C H A P T E R 1
TABLE 11 Flagship Universities by Selectivity Cluster
SEL I University of CaliforniandashBerkeley University of CaliforniandashLos Angeles (UCLA) University of MarylandndashCollege Park University of Michigan University of North CarolinandashChapel Hill University of Virginia
SEL II Pennsylvania State University Rutgers The State University of New Jersey University of Florida University of Illinois at Urbana-Champaign University of TexasndashAustin University of Washington University of WisconsinndashMadison
SEL III Iowa State University Ohio State University Purdue University Stony Brook University University of Iowa University of MinnesotandashTwin Cities University of NebraskandashLincoln University of Oregon
torically black colleges and universities or HBCUs) educate a far from trivshyial share of all students at four-year colleges and universities in this counshytry Full-time freshmen at these universities make up almost a quarter of full-time freshmen at all four-year public universities (our estimate is 23 percent) and roughly 15 percent of full-time freshmen at all public and prishyvate four-year colleges and universities Of course these percentages drop appreciably if we choose as a reference point students attending all two-year or four-year colleges the 15 percent figure falls to about 10 percent
A next key question is how the characteristics of the public universities that we study compare with the characteristics of the entire set of public and private universities that make up the four-year sector of Amershyican higher education Table 13 provides a basis for answering this quesshytion In this table we show summary data for our 21 flagships and the 28 state system SEL Bs and comparable summary data for all four-year pubshylic universities and all four-year private colleges and universities40 We exshyclude the 8 state system SEL As shown in Table 12 because they are simishy
13
Copyrighted Material
E D U C A T I O N A L A T T A I N M E N T
TABLE 12 State System Universities by Selectivity Cluster or HBCU Status
Maryland SEL A University of MarylandndashBaltimore County
SEL B Frostburg State University Salisbury University Towson University
HBCU Bowie State University Coppin State University University of MarylandndashEastern Shore
North Carolina SEL A North Carolina State University University of North CarolinandashAsheville
SEL B Appalachian State University University of North CarolinandashCharlotte University of North CarolinandashGreensboro University of North CarolinandashPembroke University of North CarolinandashWilmington Western Carolina University
HBCU Elizabeth City State University Fayetteville State University North Carolina AampT University North Carolina Central University WinstonndashSalem State University
Ohio SEL A Miami University
SEL B Bowling Green State University Cleveland State University Kent State University Ohio University Shawnee State University University of Akron University of Cincinnati University of Toledo Wright State University Youngstown State University
HBCU Central State University
Virginia SEL A College of William and Mary James Madison University University of Mary Washington Virginia Tech
SEL B Christopher Newport University George Mason University Longwood University Old Dominion University Radford University University of Virginiarsquos College at Wise Virginia Commonwealth University Virginia Military Institute
HBCU Norfolk State University Virginia State University
lar in so many respects to the flagships and we also exclude the 11 state system HBCUs because they have few national counterparts (In the chapshyters that follow we describe the characteristics of these HBCUs within the context of their respective state systems)
These comparisons are revealing in many ways We see first of all that the flagships differ in almost all respects from both the state system SEL
14
Copyrighted Material
C H A P T E R 1
Bs and all public and private four-year institutions As we would have exshypected the flagships have much larger undergraduate enrollments higher SATACT scores lower admit rates and higher average graduashytion rates They also have more diverse student bodies (with white non-Hispanic students comprising only about three quarters of their student bodies) which we think results primarily from the fact that a number of the flagships are in heavily urban areas and in states such as California with large Asian and Hispanic populations (Appendix Tables 11 and 12 provide much more detailed data on the ethnic and racial compositions of the student bodies of the individual universities in our study)
The more interesting comparisons are between our state system SEL Bs and the rest of the four-year colleges and universities in America Usshying median first-year enrollment as one metric we find that the SEL Bs are on average roughly 80 percent larger than the typical public unishyversity and almost seven times larger than the typical private college or universitymdasha sector that includes many very small institutions (To proshyvide some indication of the dispersion around the medians in Table 13 we also report interquartile ranges the main lesson the ranges teach us is that there is considerably more variation among the private colleges and universities than among the public institutions and that as one would expect there is more variation among all four-year public institushytions than there is among our state system SEL Bs)
Much more striking than differences in median enrollment and perhaps more surprising is that the SEL Bs are very much like both all public and all private four-year colleges and universities in terms of selectivity The avshyerage SATACT scores and average admit rates (both measured as medishyans) are very very similar across these sets of institutionsmdashthe average SATACT scores differ by no more than 2 or 3 percent the SEL Bs admit 77 percent of their applicants whereas all publics admit 75 percent and all private institutions admit 78 percent In racial diversity too the differences between the SEL Bs and the larger sets of universities are minimal As one would expect the SEL Bs and all four-year publics enroll more in-state stushydents than do the private institutions Finally the average six-year graduashytion rate at the SEL Bs (51 percent) is reasonably close to the average for all publics (45 percent) and all private institutions (55 percent) The genshyeral conclusion we draw from these data is that in terms of selectivity dishyversity and graduation rates the state system SEL Bs in our study are tolershyably representative of American higher education
So although we do not want to claim too much for the ldquorepresentashytivenessrdquo of the results that we report in this book (which certainly do not reflect anything purporting to be a ldquoscientificrdquo sampling effort) we are reassured to find that our population is both consequential in size andmdash putting the flagships off to one sidemdashsurprisingly similar in key characshyteristics to the rest of American higher education The SEL B comparshy
15
Copyrighted Material
E D U C A T I O N A L A T T A I N M E N T
TABLE 13 ldquoLocationrdquo of the Public Universities in Our Study within
American Higher Education
All All Our State Four-Year Four-Year
Our System Public Private Flagships SEL Bs Universities Universities
Number of Institutions 21 28 540 1129 Total Full-Time 94316 51736 749273 392331
Freshman Enrollment Median Full-Time 4131 1922 1059 280
Freshman Enrollment (3619ndash5291) (897ndash2555) (539ndash2035) (145ndash486) Median SATACTa 1195 1030 1018 1065
(1125ndash1240) (975ndash1058) (970ndash1090) (990ndash1140) Median Admit Rate 64 77 75 78
(Percent) (54ndash74) (71ndash88) (64ndash85) (68ndash85) Median Percentage White 76 83 80 83
(64ndash81) (77ndash89) (62ndash89) (68ndash91) Median Percentage 79 90 90 63
In-State (70ndash90) (86ndash95) (86ndash96) (40ndash82) Median Six-Year 77 51 45 55
Graduation Rate (66ndash84) (45ndash61) (35ndash56) (41ndash68) (Percent)
Source IPEDS (Integrated Postsecondary Education Data System) and College Board Annual Survey of Colleges
Notes For full-time freshman enrollment average SATACT scores admit rates percentage of white students percentage of in-state students and six-year graduation rates we present interquartile ranges as well as medians (with the figures at the 25th and 75th percentiles shown below the medians)
aMedian of the average SATACT score for each institution
isons also reinforce our sense that we were wise to include the four state systems in our study as a complement to the flagships
THE FLAGSHIPS TRENDS IN SELECTIVITY AND OTHER CHARACTERISTICS
In contrast to the SEL Bs the flagships are far from ldquorepresentativerdquo the students at these prestigious universities are by any measure a special group They have had strong pre-collegiate preparation and they enjoy access to educational resources far beyond what can be offered by many other colleges and universities public and private For both of these reashysons it is hardly surprising that graduation rates at the flagships are apshypreciably higher than the rates among students attending all four-year colleges and universities
16
Copyrighted Material
C H A P T E R 1
As many commentators have noted (see the discussion in Appendix A) the flagship universities have become much more selective over time At three highly selective universities for which we have been able to assemshyble consistent data for the years 1974ndash2006mdashthe University of Californiandash Los Angeles (UCLA) the University of North Carolina (UNC)ndashChapel Hill and the University of Virginiamdashthe fraction of entering students with A or A+ high school grades has risen from roughly 55 percent to about 90 percent over this 35-year period (Figure 14) At three somewhat less selective universities (Iowa State and Ohio State Universities and Virshyginia Tech) the fraction of entering students with A or A+ grades has risen at least as rapidlymdashfrom just over 20 percent to roughly 60 percentmdash at the same time that the fraction with high school grades in the C+ or lower range has fallen from just over 10 percent to nearly zero (Figure 15)41 In Chapter 12 we comment on the policy implications of this proshynounced increase in selectivity
There have been accompanying changes in the SES of students atshytending these universities as reflected for example in the highest level of education obtained by mothers of entering freshmen In 1972 at the three less selective universities listed in the previous paragraph more
100
90
80
70
60
50
40
30
20
10
0 1974 1978 1982 1986 1990 1994 1998 2002 2006
A or A+ B or B+ C+ or Below
Perc
enta
ge o
f Stu
dent
s
Figure 14 Average High School Grade Distribution of Incoming Freshmen at Highly Selective Universities
Source Higher Education Research Institute (HERI) Freshman Survey Note The universities included are UCLA UNCndashChapel Hill and the University of Virshy
ginia These trends were obtained by taking an average of the grades at the three schools Blanks represent missing data for at least one of the constituent universities for the correshysponding year
17
Copyrighted Material
E D U C A T I O N A L A T T A I N M E N T
100
90
80
70
60
50
40
30
20
10
0 1976 1980 1984 1988 1992 1996 20001972
A or A+ B or B+ C+ or Below
Perc
enta
ge o
f Stu
dent
s
Figure 15 Average High School Grade Distribution of Incoming Freshmen at Less Selective Universities
Source HERI Freshman Survey Note The universities included are Iowa State and Ohio State Universities and Virginia
Tech These trends were obtained by taking an average of the grades at the three schools Blanks represent missing data for at least one of the constituent universities for the correshysponding year
than 40 percent of these mothers had only a high school degree by 2002 this percentage had fallen to 20 percent and by then almost an equal number had a graduate degree Of course educational attainment of women has risen dramatically across the board but not at this rate There is also evidence that average family income has gone up markedly much faster than the national average Today more than 40 percent of the undergraduates at these universities come from families in the top quarshytile of the income distribution42
These widely recognized trendsmdashboth in the degree of selectivity and in the share of students who come from privileged backgroundsmdashhave provoked much debate as to whether these institutions are becoming too ldquoprivatizedrdquo and are losing their traditional character what some think of as their role as ldquopeoplersquos universitiesrdquo It is not for us to pronounce on this issuemdashwhich is in fact much more complicated than it is sometimes thought to bemdashbut Eugene Tobinrsquos analysis of the evolution of the flagshyships in Appendix A reminds us of several salient points
bull The flagships are important to American higher education and to America for many reasons beyond the education they provide to talshy
18
Copyrighted Material
C H A P T E R 1
ented undergraduates They are major research universities that also have many of the countryrsquos leading graduate and professional proshygrams In addition they contribute in many ways to the states in which they are located There are naturalmdashinevitablemdashtensions beshytween the varied missions of these universities at the same time that they complement each other in many ways One reason these unishyversities are more selective than ever before is that many of the counshytryrsquos most promising undergraduates want to study in a university that has excellent faculty a commitment to scholarship and gradushyate education that is both important in its own right and necessary to recruit and hold outstanding faculty
bull As enrollment pressures have mounted along with pressures to exshycel in research and graduate education it is natural that many states have opted for greater specialization of function in their overall sysshytems of higher education The California Master Plan (discussed at length in Appendix A) is a good example of how it is possible to stratshyify systems of higher educationmdashbut the actual experience in Calishyfornia is a good warning that the results obtained (in terms for inshystance of the overall number of bachelorrsquos degrees conferred) do not always match idealized notions of how carefully structured sysshytems of higher education will in fact perform
bull The greater selectivity that we observe today is the result in large part of demographic trends not conscious policy decisions The number of prospective students with strong academic credentials has inshycreased faster than places at the flagships and the result is an entirely predictable increase in the competition for these places Because famshyily background correlates with academic preparation the increasing concentration at these universities of students from privileged backshygrounds is hardly surprising But we should also recognize that stushydent bodies at the flagships were never as ldquorepresentativerdquo of the popshyulations of their states as some would have us believe In earlier days large fractions of those eligible to attend leading public universities came as they do now from the professional and upper-income famshyilies that saw to it that their children had the pre-collegiate preparashytion necessary to succeed at these universities
bull Finally it is important to resist the temptation to imagine that there was a ldquogolden agerdquo in which students from every background were taught personally and brilliantly at major flagship universities as a matter of course One of the most telling vignettes in the account of the evolution of the flagships in Appendix A is the complaint by undergraduates attending universities roughly 100 years ago in the early part of the 20th century that they were taught in large lecture courses and ldquoleft adrift unaided in an extremely impersonal enshy
19
Copyrighted Material
E D U C A T I O N A L A T T A I N M E N T
vironmentrdquo The more things change the more they stay the same And today resource constraints at even the most prestigious flagshyships can prevent undergraduates from attending the courses they really want to attend never mind having direct access to tenured facshyulty members in these respects small highly selective liberal arts colshyleges have an advantage which is one reason that they have such high graduation rates
These observations are intended only to set the stage for the discussion of educational attainment that is to follow by suggesting that in analyzing outshycomes of todayrsquos undergraduates attending flagship universities it is necshyessary to have in mind the range of functions these universities are meant to perform and the sometimes conflicting pressures that beat upon them
We want to end this first chapter by reiterating that the purpose of the reshysearch reported in this book is not only to improve our understanding of patterns and relationships but alsomdashas a high prioritymdashto search for clues about ways to make Americarsquos colleges and universities more sucshycessful in moving entering students on to graduation Regrettably if not surprisingly our studies have not led to the discovery of any simple ldquoquick fixesrdquo or ldquomagic bulletsrdquo Many of the patterns we see are remarkably conshysistent across institutions and settings and many of them result we beshylieve from deep-seated features of American society that will not easily yield to efforts to bring about change Much patience will be required
Nevertheless our work has helped us to identify important steps that colleges and universities state governments and the federal government can take to improve college outcomes especially for disadvantaged stushydents We also believe that focusing sharply on levels of achievement and success in college may in and of itself encourage universities and policy makers to find new ways to make things better As recent work in the hosshypital industry shows simply directing attention to an entrenched probshylem like hospital-borne infections can stimulate remedial actions at the local level Lasting improvements will surely require patience (reashysonably long time horizons) determination and willingness to be guided by evidencemdashas well as the capacity to harvest the low-hanging fruit as promptly as possible But the goal of helping more Americans from all backgrounds complete college in a timely way is well worth the effort that will be required
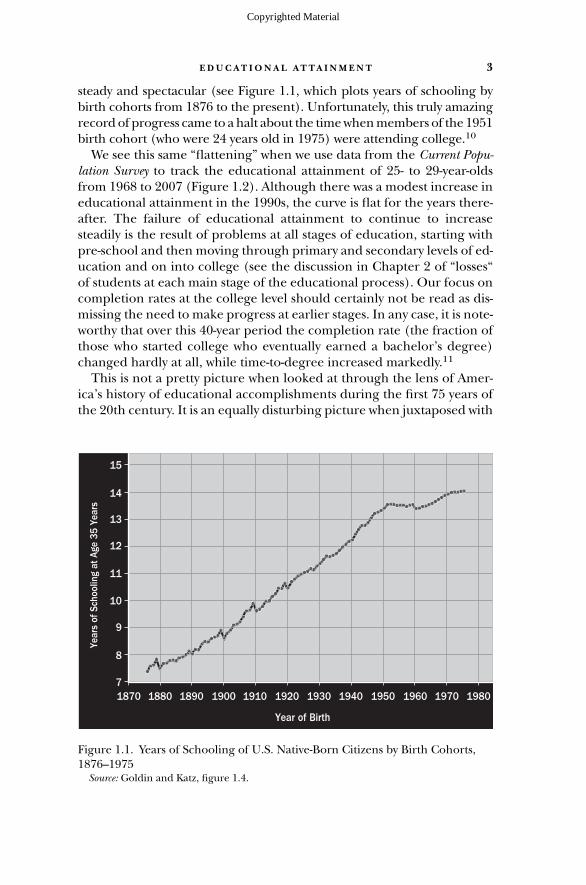
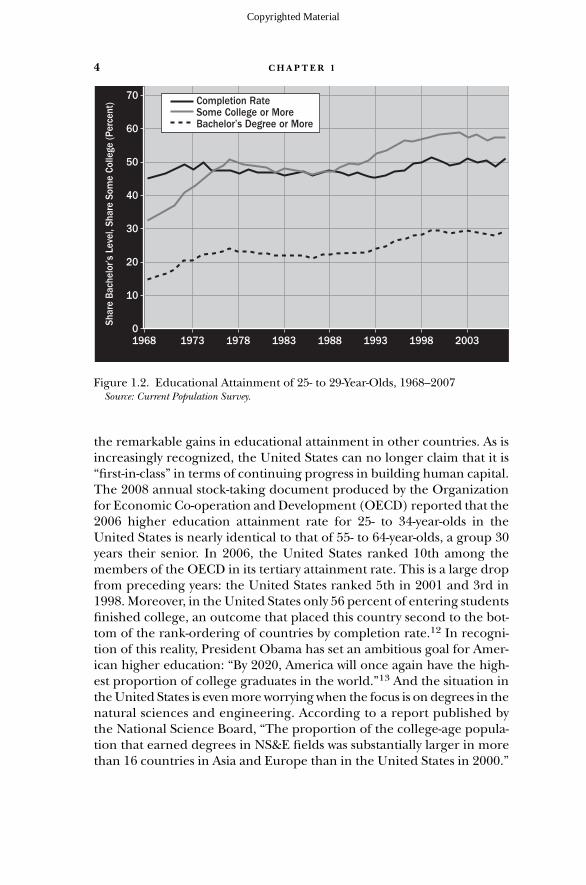
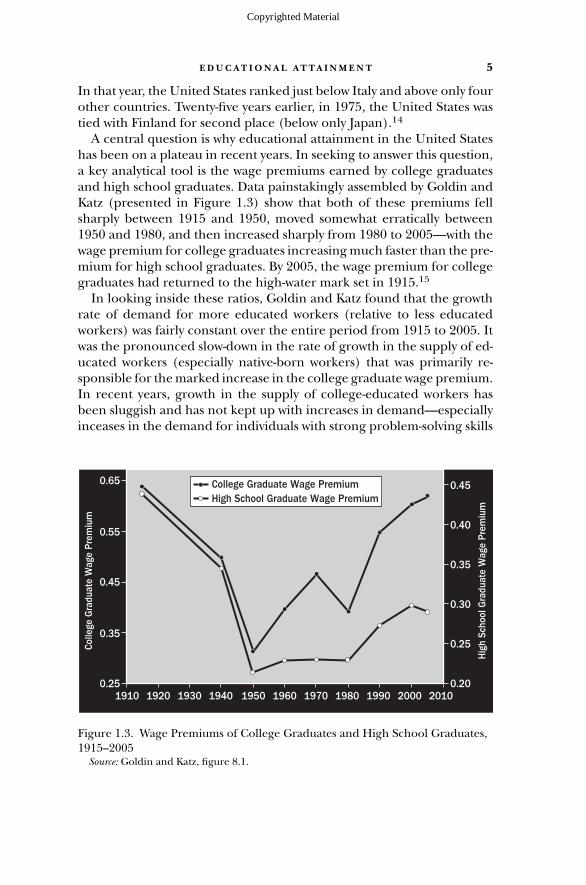
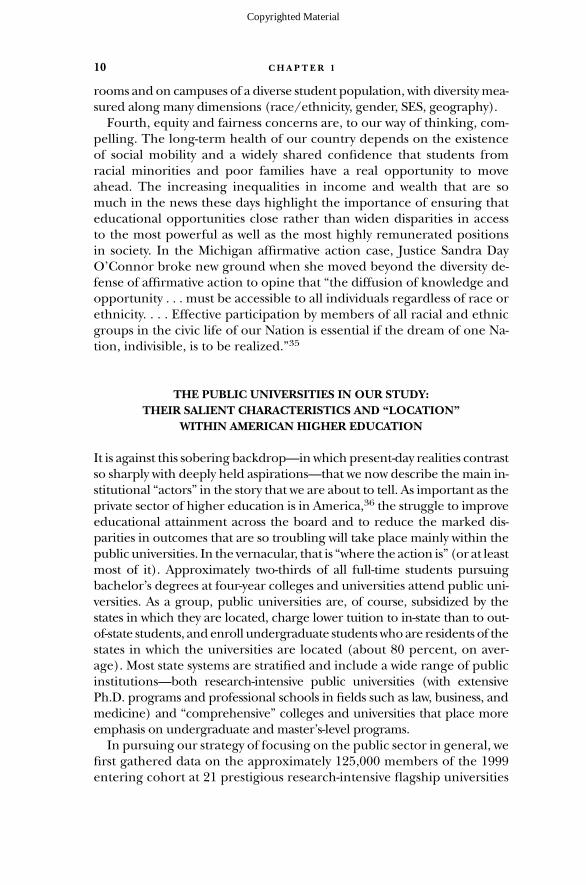
10
Copyrighted Material
C H A P T E R 1
rooms and on campuses of a diverse student population with diversity meashysured along many dimensions (raceethnicity gender SES geography)
Fourth equity and fairness concerns are to our way of thinking comshypelling The long-term health of our country depends on the existence of social mobility and a widely shared confidence that students from racial minorities and poor families have a real opportunity to move ahead The increasing inequalities in income and wealth that are so much in the news these days highlight the importance of ensuring that educational opportunities close rather than widen disparities in access to the most powerful as well as the most highly remunerated positions in society In the Michigan affirmative action case Justice Sandra Day OrsquoConnor broke new ground when she moved beyond the diversity deshyfense of affirmative action to opine that ldquothe diffusion of knowledge and opportunity must be accessible to all individuals regardless of race or ethnicity Effective participation by members of all racial and ethnic groups in the civic life of our Nation is essential if the dream of one Nashytion indivisible is to be realizedrdquo35
THE PUBLIC UNIVERSITIES IN OUR STUDY THEIR SALIENT CHARACTERISTICS AND ldquoLOCATIONrdquo
WITHIN AMERICAN HIGHER EDUCATION
It is against this sobering backdropmdashin which present-day realities contrast so sharply with deeply held aspirationsmdashthat we now describe the main inshystitutional ldquoactorsrdquo in the story that we are about to tell As important as the private sector of higher education is in America36 the struggle to improve educational attainment across the board and to reduce the marked disshyparities in outcomes that are so troubling will take place mainly within the public universities In the vernacular that is ldquowhere the action isrdquo (or at least most of it) Approximately two-thirds of all full-time students pursuing bachelorrsquos degrees at four-year colleges and universities attend public unishyversities As a group public universities are of course subsidized by the states in which they are located charge lower tuition to in-state than to outshyof-state students and enroll undergraduate students who are residents of the states in which the universities are located (about 80 percent on avershyage) Most state systems are stratified and include a wide range of public institutionsmdashboth research-intensive public universities (with extensive PhD programs and professional schools in fields such as law business and medicine) and ldquocomprehensiverdquo colleges and universities that place more emphasis on undergraduate and masterrsquos-level programs
In pursuing our strategy of focusing on the public sector in general we first gathered data on the approximately 125000 members of the 1999 entering cohort at 21 prestigious research-intensive flagship universities
11
Copyrighted Material
E D U C A T I O N A L A T T A I N M E N T
(listed in Table 11)37 These universities are all members of the Association of American Universities and are widely regarded as leaders in American higher education They were chosen on the basis of a non-scientific but careshyfully considered effort to achieve both geographic diversity (the set of instishytutions being studied includes flagship universities from the West Coast the Midwest the South and the Northeast) and a mix of other characteristics including differences in racial composition and in degree of selectivity as approximated by the average SATACT score of enrolled students38
We then added data on the rsquo99 entering cohorts at essentially all pubshylic universities in the four state systems of Maryland North Carolina Ohio and Virginia (these 47 additional state system public universities are listed in Table 12 and described in more detail in Appendix Table 12)39 The two main differences between the flagships and the state sysshytem universitiesmdashapart from the much greater geographic dispersion of the flagships which reflects the different ways in which the two sets of universities were chosenmdashare in average entering enrollment and selecshytivity The average flagship in our study enrolled slightly more than 4100 first-time full-time freshmen in 1999 as compared with a median enrollshyment of just 1400 at the 47 state system universities The median average SATACT score of the entering freshmen in the flagships was 170 points higher than the median average in the 47 state system universities
As is evident from Tables 11 and 12 we divided the universities in our two databases into selectivity clusters based on the average SATACT scores of their entering classes we refer to these clusters as SEL I SEL II and SEL III in the case of the flagships and as SEL A and SEL B in the case of the state systems Use of a selectivity categorization is not meant to imply that we endorse ldquothe rankings gamerdquo which we regard as foolshyish and hurtful to students trying to find the best fit between their capashybilities and interests and the characteristics of institutions to which they choose to apply There is no denying however that there are proshynounced differences in outcomes such as graduation rates across selecshytivity clusters Failure to acknowledge these differences would muddy the analysis of many important questions such as the effects on outcomes of high school characteristics and differences in the predictive power of SATACT scores and high school GPA The use of selectivity clusters also allows us to study on something approaching an other-things-equal bashysis the strong relationship between institutional selectivity per se and outshycomes such as graduation rates and time-to-degree Near the end of this chapter we will present additional information on trends in selectivity among the flagships and will also comment more generally on the charshyacteristics of these important universities
As we now seek to ldquolocaterdquo our universities within the universe of four-year institutions the first point to note is that the 68 public universities in our study (21 flagships plus other state system universities including hisshy
12
Copyrighted Material
C H A P T E R 1
TABLE 11 Flagship Universities by Selectivity Cluster
SEL I University of CaliforniandashBerkeley University of CaliforniandashLos Angeles (UCLA) University of MarylandndashCollege Park University of Michigan University of North CarolinandashChapel Hill University of Virginia
SEL II Pennsylvania State University Rutgers The State University of New Jersey University of Florida University of Illinois at Urbana-Champaign University of TexasndashAustin University of Washington University of WisconsinndashMadison
SEL III Iowa State University Ohio State University Purdue University Stony Brook University University of Iowa University of MinnesotandashTwin Cities University of NebraskandashLincoln University of Oregon
torically black colleges and universities or HBCUs) educate a far from trivshyial share of all students at four-year colleges and universities in this counshytry Full-time freshmen at these universities make up almost a quarter of full-time freshmen at all four-year public universities (our estimate is 23 percent) and roughly 15 percent of full-time freshmen at all public and prishyvate four-year colleges and universities Of course these percentages drop appreciably if we choose as a reference point students attending all two-year or four-year colleges the 15 percent figure falls to about 10 percent
A next key question is how the characteristics of the public universities that we study compare with the characteristics of the entire set of public and private universities that make up the four-year sector of Amershyican higher education Table 13 provides a basis for answering this quesshytion In this table we show summary data for our 21 flagships and the 28 state system SEL Bs and comparable summary data for all four-year pubshylic universities and all four-year private colleges and universities40 We exshyclude the 8 state system SEL As shown in Table 12 because they are simishy
13
Copyrighted Material
E D U C A T I O N A L A T T A I N M E N T
TABLE 12 State System Universities by Selectivity Cluster or HBCU Status
Maryland SEL A University of MarylandndashBaltimore County
SEL B Frostburg State University Salisbury University Towson University
HBCU Bowie State University Coppin State University University of MarylandndashEastern Shore
North Carolina SEL A North Carolina State University University of North CarolinandashAsheville
SEL B Appalachian State University University of North CarolinandashCharlotte University of North CarolinandashGreensboro University of North CarolinandashPembroke University of North CarolinandashWilmington Western Carolina University
HBCU Elizabeth City State University Fayetteville State University North Carolina AampT University North Carolina Central University WinstonndashSalem State University
Ohio SEL A Miami University
SEL B Bowling Green State University Cleveland State University Kent State University Ohio University Shawnee State University University of Akron University of Cincinnati University of Toledo Wright State University Youngstown State University
HBCU Central State University
Virginia SEL A College of William and Mary James Madison University University of Mary Washington Virginia Tech
SEL B Christopher Newport University George Mason University Longwood University Old Dominion University Radford University University of Virginiarsquos College at Wise Virginia Commonwealth University Virginia Military Institute
HBCU Norfolk State University Virginia State University
lar in so many respects to the flagships and we also exclude the 11 state system HBCUs because they have few national counterparts (In the chapshyters that follow we describe the characteristics of these HBCUs within the context of their respective state systems)
These comparisons are revealing in many ways We see first of all that the flagships differ in almost all respects from both the state system SEL
14
Copyrighted Material
C H A P T E R 1
Bs and all public and private four-year institutions As we would have exshypected the flagships have much larger undergraduate enrollments higher SATACT scores lower admit rates and higher average graduashytion rates They also have more diverse student bodies (with white non-Hispanic students comprising only about three quarters of their student bodies) which we think results primarily from the fact that a number of the flagships are in heavily urban areas and in states such as California with large Asian and Hispanic populations (Appendix Tables 11 and 12 provide much more detailed data on the ethnic and racial compositions of the student bodies of the individual universities in our study)
The more interesting comparisons are between our state system SEL Bs and the rest of the four-year colleges and universities in America Usshying median first-year enrollment as one metric we find that the SEL Bs are on average roughly 80 percent larger than the typical public unishyversity and almost seven times larger than the typical private college or universitymdasha sector that includes many very small institutions (To proshyvide some indication of the dispersion around the medians in Table 13 we also report interquartile ranges the main lesson the ranges teach us is that there is considerably more variation among the private colleges and universities than among the public institutions and that as one would expect there is more variation among all four-year public institushytions than there is among our state system SEL Bs)
Much more striking than differences in median enrollment and perhaps more surprising is that the SEL Bs are very much like both all public and all private four-year colleges and universities in terms of selectivity The avshyerage SATACT scores and average admit rates (both measured as medishyans) are very very similar across these sets of institutionsmdashthe average SATACT scores differ by no more than 2 or 3 percent the SEL Bs admit 77 percent of their applicants whereas all publics admit 75 percent and all private institutions admit 78 percent In racial diversity too the differences between the SEL Bs and the larger sets of universities are minimal As one would expect the SEL Bs and all four-year publics enroll more in-state stushydents than do the private institutions Finally the average six-year graduashytion rate at the SEL Bs (51 percent) is reasonably close to the average for all publics (45 percent) and all private institutions (55 percent) The genshyeral conclusion we draw from these data is that in terms of selectivity dishyversity and graduation rates the state system SEL Bs in our study are tolershyably representative of American higher education
So although we do not want to claim too much for the ldquorepresentashytivenessrdquo of the results that we report in this book (which certainly do not reflect anything purporting to be a ldquoscientificrdquo sampling effort) we are reassured to find that our population is both consequential in size andmdash putting the flagships off to one sidemdashsurprisingly similar in key characshyteristics to the rest of American higher education The SEL B comparshy
15
Copyrighted Material
E D U C A T I O N A L A T T A I N M E N T
TABLE 13 ldquoLocationrdquo of the Public Universities in Our Study within
American Higher Education
All All Our State Four-Year Four-Year
Our System Public Private Flagships SEL Bs Universities Universities
Number of Institutions 21 28 540 1129 Total Full-Time 94316 51736 749273 392331
Freshman Enrollment Median Full-Time 4131 1922 1059 280
Freshman Enrollment (3619ndash5291) (897ndash2555) (539ndash2035) (145ndash486) Median SATACTa 1195 1030 1018 1065
(1125ndash1240) (975ndash1058) (970ndash1090) (990ndash1140) Median Admit Rate 64 77 75 78
(Percent) (54ndash74) (71ndash88) (64ndash85) (68ndash85) Median Percentage White 76 83 80 83
(64ndash81) (77ndash89) (62ndash89) (68ndash91) Median Percentage 79 90 90 63
In-State (70ndash90) (86ndash95) (86ndash96) (40ndash82) Median Six-Year 77 51 45 55
Graduation Rate (66ndash84) (45ndash61) (35ndash56) (41ndash68) (Percent)
Source IPEDS (Integrated Postsecondary Education Data System) and College Board Annual Survey of Colleges
Notes For full-time freshman enrollment average SATACT scores admit rates percentage of white students percentage of in-state students and six-year graduation rates we present interquartile ranges as well as medians (with the figures at the 25th and 75th percentiles shown below the medians)
aMedian of the average SATACT score for each institution
isons also reinforce our sense that we were wise to include the four state systems in our study as a complement to the flagships
THE FLAGSHIPS TRENDS IN SELECTIVITY AND OTHER CHARACTERISTICS
In contrast to the SEL Bs the flagships are far from ldquorepresentativerdquo the students at these prestigious universities are by any measure a special group They have had strong pre-collegiate preparation and they enjoy access to educational resources far beyond what can be offered by many other colleges and universities public and private For both of these reashysons it is hardly surprising that graduation rates at the flagships are apshypreciably higher than the rates among students attending all four-year colleges and universities
16
Copyrighted Material
C H A P T E R 1
As many commentators have noted (see the discussion in Appendix A) the flagship universities have become much more selective over time At three highly selective universities for which we have been able to assemshyble consistent data for the years 1974ndash2006mdashthe University of Californiandash Los Angeles (UCLA) the University of North Carolina (UNC)ndashChapel Hill and the University of Virginiamdashthe fraction of entering students with A or A+ high school grades has risen from roughly 55 percent to about 90 percent over this 35-year period (Figure 14) At three somewhat less selective universities (Iowa State and Ohio State Universities and Virshyginia Tech) the fraction of entering students with A or A+ grades has risen at least as rapidlymdashfrom just over 20 percent to roughly 60 percentmdash at the same time that the fraction with high school grades in the C+ or lower range has fallen from just over 10 percent to nearly zero (Figure 15)41 In Chapter 12 we comment on the policy implications of this proshynounced increase in selectivity
There have been accompanying changes in the SES of students atshytending these universities as reflected for example in the highest level of education obtained by mothers of entering freshmen In 1972 at the three less selective universities listed in the previous paragraph more
100
90
80
70
60
50
40
30
20
10
0 1974 1978 1982 1986 1990 1994 1998 2002 2006
A or A+ B or B+ C+ or Below
Perc
enta
ge o
f Stu
dent
s
Figure 14 Average High School Grade Distribution of Incoming Freshmen at Highly Selective Universities
Source Higher Education Research Institute (HERI) Freshman Survey Note The universities included are UCLA UNCndashChapel Hill and the University of Virshy
ginia These trends were obtained by taking an average of the grades at the three schools Blanks represent missing data for at least one of the constituent universities for the correshysponding year
17
Copyrighted Material
E D U C A T I O N A L A T T A I N M E N T
100
90
80
70
60
50
40
30
20
10
0 1976 1980 1984 1988 1992 1996 20001972
A or A+ B or B+ C+ or Below
Perc
enta
ge o
f Stu
dent
s
Figure 15 Average High School Grade Distribution of Incoming Freshmen at Less Selective Universities
Source HERI Freshman Survey Note The universities included are Iowa State and Ohio State Universities and Virginia
Tech These trends were obtained by taking an average of the grades at the three schools Blanks represent missing data for at least one of the constituent universities for the correshysponding year
than 40 percent of these mothers had only a high school degree by 2002 this percentage had fallen to 20 percent and by then almost an equal number had a graduate degree Of course educational attainment of women has risen dramatically across the board but not at this rate There is also evidence that average family income has gone up markedly much faster than the national average Today more than 40 percent of the undergraduates at these universities come from families in the top quarshytile of the income distribution42
These widely recognized trendsmdashboth in the degree of selectivity and in the share of students who come from privileged backgroundsmdashhave provoked much debate as to whether these institutions are becoming too ldquoprivatizedrdquo and are losing their traditional character what some think of as their role as ldquopeoplersquos universitiesrdquo It is not for us to pronounce on this issuemdashwhich is in fact much more complicated than it is sometimes thought to bemdashbut Eugene Tobinrsquos analysis of the evolution of the flagshyships in Appendix A reminds us of several salient points
bull The flagships are important to American higher education and to America for many reasons beyond the education they provide to talshy
18
Copyrighted Material
C H A P T E R 1
ented undergraduates They are major research universities that also have many of the countryrsquos leading graduate and professional proshygrams In addition they contribute in many ways to the states in which they are located There are naturalmdashinevitablemdashtensions beshytween the varied missions of these universities at the same time that they complement each other in many ways One reason these unishyversities are more selective than ever before is that many of the counshytryrsquos most promising undergraduates want to study in a university that has excellent faculty a commitment to scholarship and gradushyate education that is both important in its own right and necessary to recruit and hold outstanding faculty
bull As enrollment pressures have mounted along with pressures to exshycel in research and graduate education it is natural that many states have opted for greater specialization of function in their overall sysshytems of higher education The California Master Plan (discussed at length in Appendix A) is a good example of how it is possible to stratshyify systems of higher educationmdashbut the actual experience in Calishyfornia is a good warning that the results obtained (in terms for inshystance of the overall number of bachelorrsquos degrees conferred) do not always match idealized notions of how carefully structured sysshytems of higher education will in fact perform
bull The greater selectivity that we observe today is the result in large part of demographic trends not conscious policy decisions The number of prospective students with strong academic credentials has inshycreased faster than places at the flagships and the result is an entirely predictable increase in the competition for these places Because famshyily background correlates with academic preparation the increasing concentration at these universities of students from privileged backshygrounds is hardly surprising But we should also recognize that stushydent bodies at the flagships were never as ldquorepresentativerdquo of the popshyulations of their states as some would have us believe In earlier days large fractions of those eligible to attend leading public universities came as they do now from the professional and upper-income famshyilies that saw to it that their children had the pre-collegiate preparashytion necessary to succeed at these universities
bull Finally it is important to resist the temptation to imagine that there was a ldquogolden agerdquo in which students from every background were taught personally and brilliantly at major flagship universities as a matter of course One of the most telling vignettes in the account of the evolution of the flagships in Appendix A is the complaint by undergraduates attending universities roughly 100 years ago in the early part of the 20th century that they were taught in large lecture courses and ldquoleft adrift unaided in an extremely impersonal enshy
19
Copyrighted Material
E D U C A T I O N A L A T T A I N M E N T
vironmentrdquo The more things change the more they stay the same And today resource constraints at even the most prestigious flagshyships can prevent undergraduates from attending the courses they really want to attend never mind having direct access to tenured facshyulty members in these respects small highly selective liberal arts colshyleges have an advantage which is one reason that they have such high graduation rates
These observations are intended only to set the stage for the discussion of educational attainment that is to follow by suggesting that in analyzing outshycomes of todayrsquos undergraduates attending flagship universities it is necshyessary to have in mind the range of functions these universities are meant to perform and the sometimes conflicting pressures that beat upon them
We want to end this first chapter by reiterating that the purpose of the reshysearch reported in this book is not only to improve our understanding of patterns and relationships but alsomdashas a high prioritymdashto search for clues about ways to make Americarsquos colleges and universities more sucshycessful in moving entering students on to graduation Regrettably if not surprisingly our studies have not led to the discovery of any simple ldquoquick fixesrdquo or ldquomagic bulletsrdquo Many of the patterns we see are remarkably conshysistent across institutions and settings and many of them result we beshylieve from deep-seated features of American society that will not easily yield to efforts to bring about change Much patience will be required
Nevertheless our work has helped us to identify important steps that colleges and universities state governments and the federal government can take to improve college outcomes especially for disadvantaged stushydents We also believe that focusing sharply on levels of achievement and success in college may in and of itself encourage universities and policy makers to find new ways to make things better As recent work in the hosshypital industry shows simply directing attention to an entrenched probshylem like hospital-borne infections can stimulate remedial actions at the local level Lasting improvements will surely require patience (reashysonably long time horizons) determination and willingness to be guided by evidencemdashas well as the capacity to harvest the low-hanging fruit as promptly as possible But the goal of helping more Americans from all backgrounds complete college in a timely way is well worth the effort that will be required
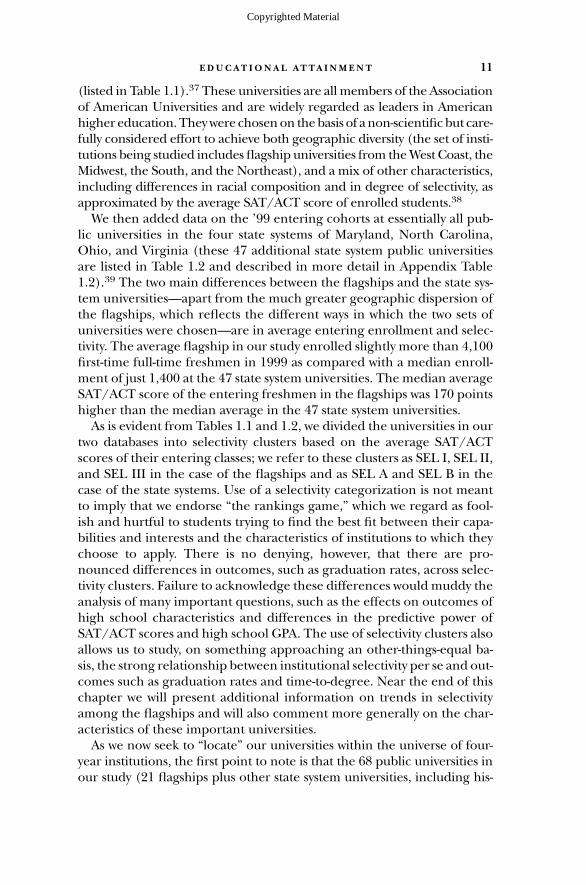
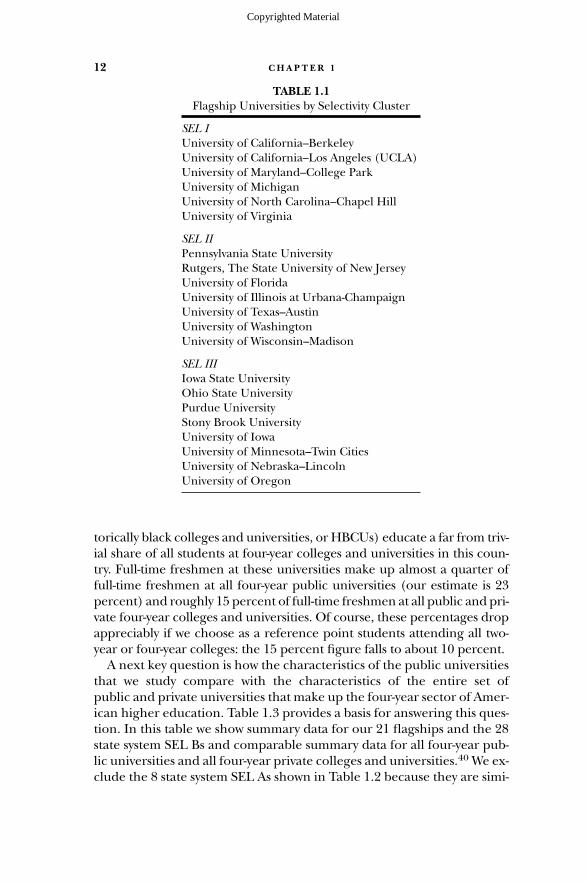
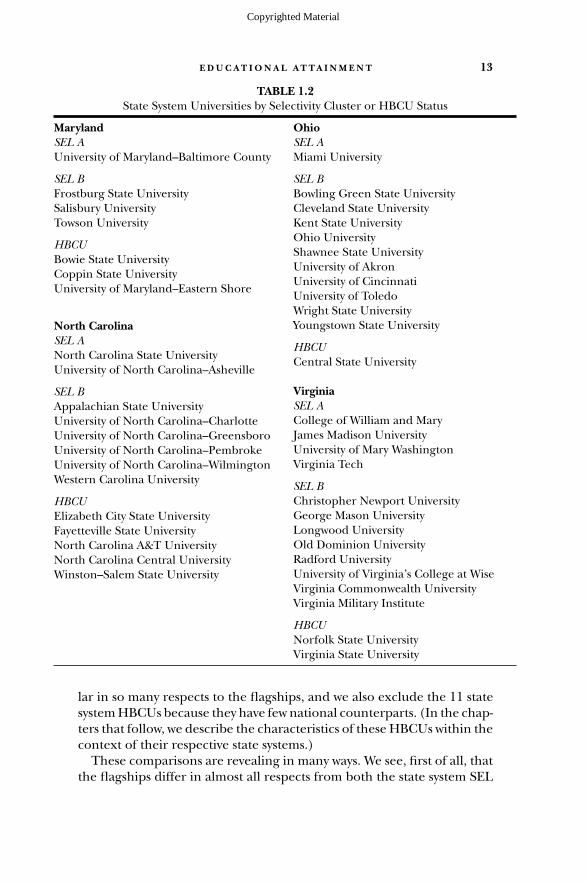
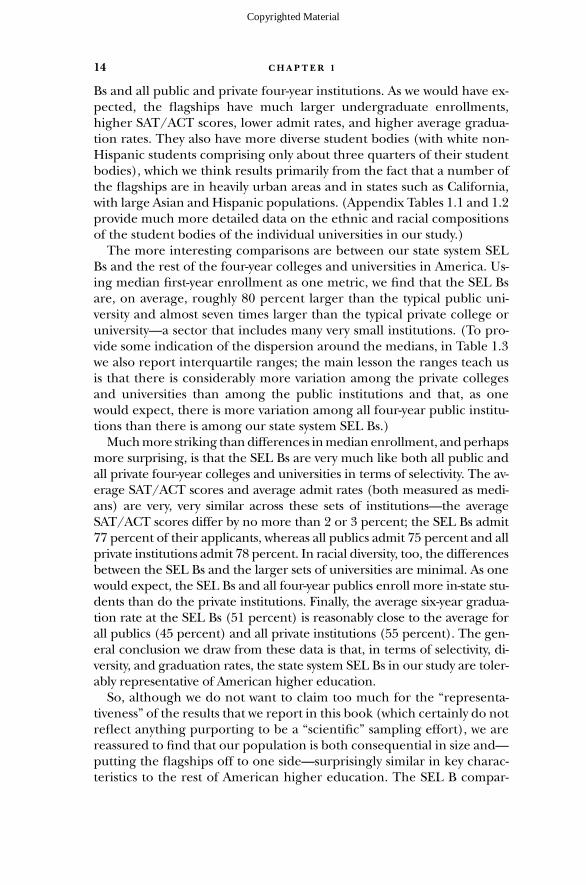
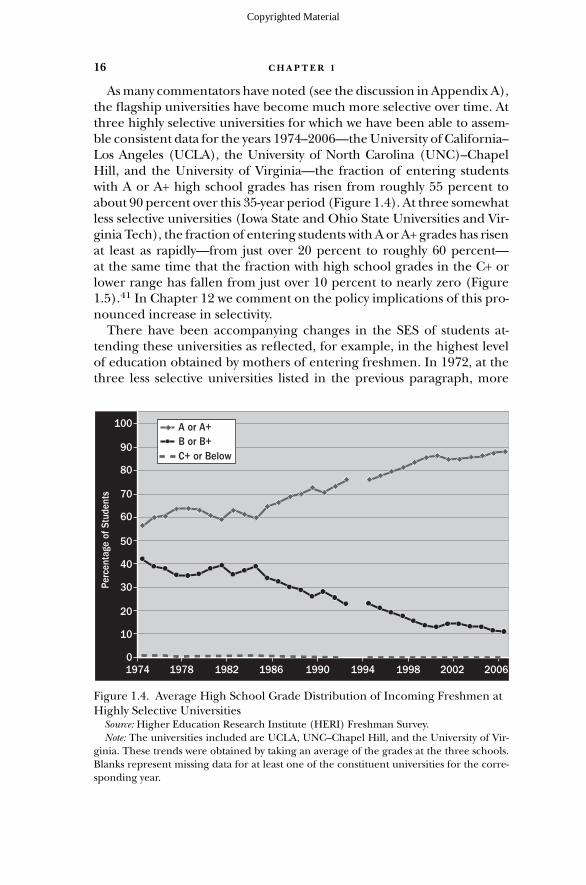
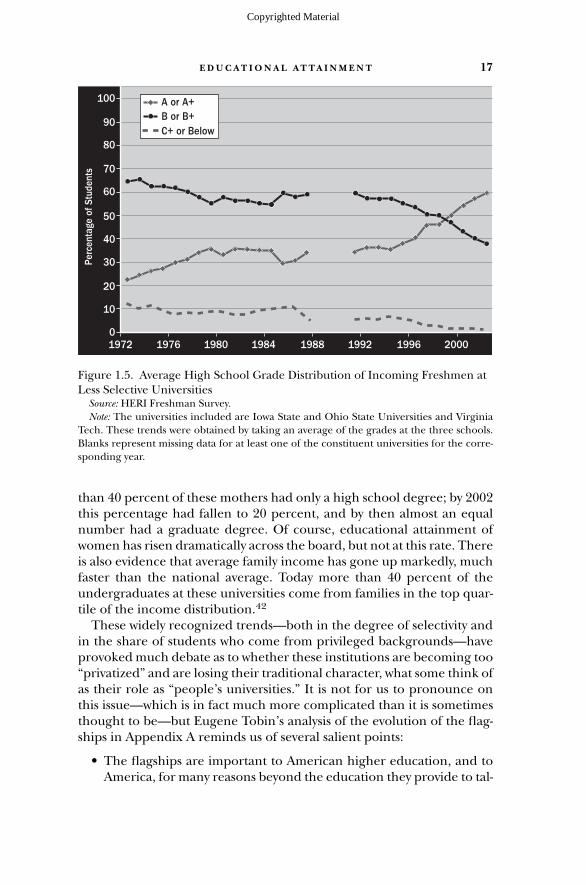