Embed Size (px)
Citation preview

NASA Earth Science Technology Forum
Silver Spring, MD
June 12, 2018
Boundary-Layer Humidity Sounding Using
a G-Band Differential Absorption Radar
Presenter: Richard Roy, JPL
Coauthors: Matt Lebsock (PI), Ken Cooper, Jose V. Siles, Luis Millán,
Raquel Rodriguez Monje, and Robert Dengler, JPL
Copyright 2018 California Institute of Technology. Government sponsorship acknowledged.
The Vapor In-Cloud Profiling Radar (VIPR, ESTO IIP-16)

Scientific motivation
• Existing remote sensing platforms have limited ability to retrieve high-
resolution, unbiased water vapor profiles in the presence of clouds
• Problem recognized by NWP community (WMO, 2018):
“Critical atmospheric variables that are not adequately measured by current or
planned systems are temperature and humidity profiles of adequate vertical
resolution in cloudy areas.”
Problem:
Proposed solution:
• Utilize range-resolved radar signal and frequency-dependent attenuation on
flank of 183 GHz water vapor absorption line, so-called differential absorption
radar (DAR)
• Microwave analog of differential absorption lidar (DIAL) – but can measure
inside clouds (complementary observations)
• Langley - prototype pressure sounder using O2 differential absorption, no
ranging [1]
[1] Lawrence et al. 2011, doi:10.1016/j.jqsrt.2010.06.001

Measurement basis
• Differential reflectivity between two closely spaced frequencies proportional to
absorbing gas density (integrated)
• Important assumption: Reflectivity and extinction from hydrometeors independent
of frequency
• Frequency dependence from hardware cancels out (common mode)
• Airborne platform ⇒ Surface echoes (total column water)
O2
H2O
H2O
H2O
O2
Frequency (GHz)
R
The vapor in-cloud profiling radar (VIPR)
• IIP-16 (PI: Matt Lebsock)
• Entry TRL = 3, exit TRL = 6
• Tunable across 167 to 174.8 GHz band
• Simultaneous cloud/vapor sounding
• Targets boundary layer clouds/precipitation
and total column water vapor
• Demonstration flights on Twin Otter in 2019
VIPR VIPR frequency band
• Sensitivity to upper-tropospheric water
vapor (ice clouds)
• Strong attenuation in planetary boundary
layer (PBL)
• Transmission prohibited (passive sensors)
• Lower absolute absorption ⇒ sensitivity to
PBL water vapor
• Profiling (PBL clouds/precipitation) and
total column water measurement
capabilities
• Fewer transmission restrictions
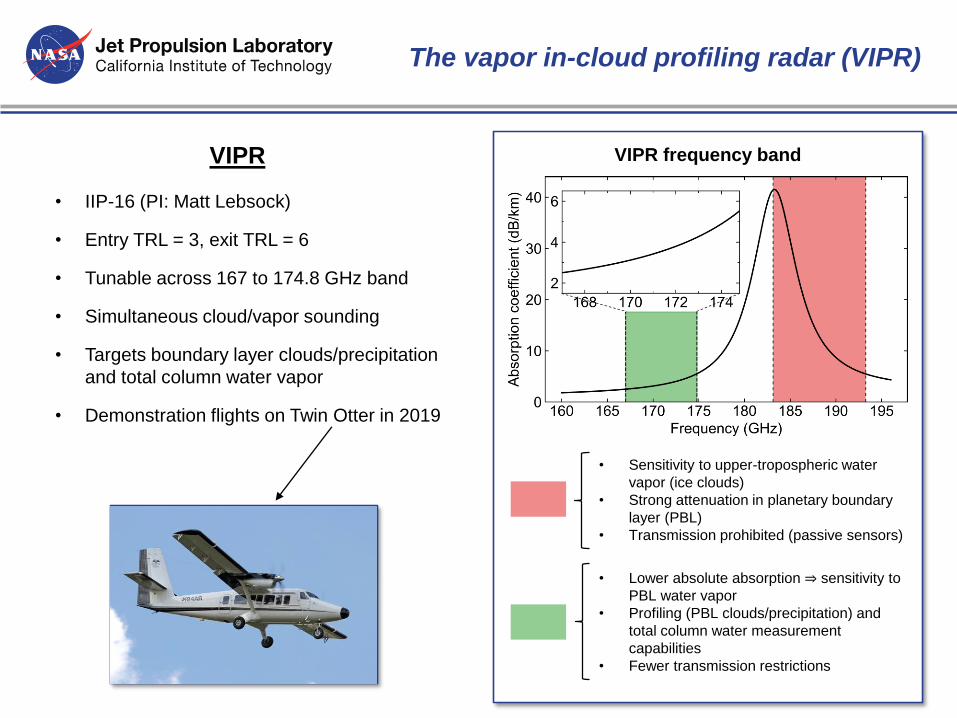
Connection to the Decadal Survey
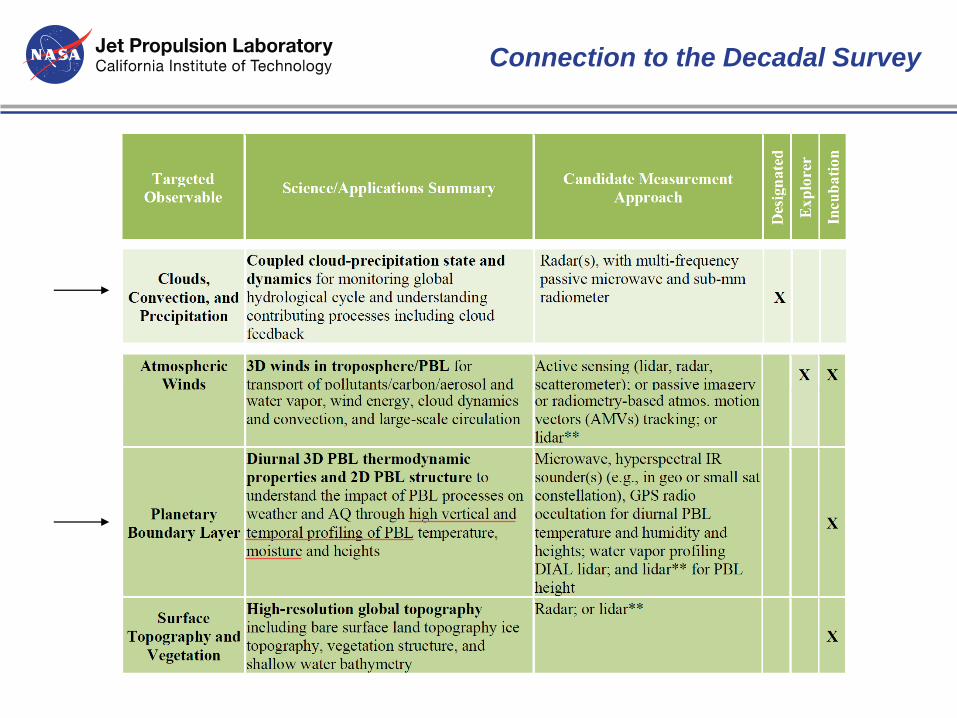
Instrument heritage at JPL
90 GHz in
180 GHz out
Record output power G-band sources
Frequency-modulated continuous-wave (FMCW) radar for security imaging
680 GHz imaging radar
through-clothes detection
• Extensive THz FMCW radar
R&D for security imaging
applications
• ESTO funded effort for high-
power solid-state sources near
183 GHz (ESTO ACT-13)
• State-of-the-art InP low-noise
amplifiers developed for
millimeter-wave radiometry and
heterodyne spectroscopy

VIPR architecture
VIPR high-level block diagram
• Transmitter tunable
from 167 to 174.8
GHz
• Nominal range
resolution 2.5 m
• Very high quasi-optical
isolation permits
simultaneous
operation of Tx/Rx
• Oscillator phase-noise
cancellation
techniques pioneered
at JPL ⇒ thermal-
noise-limited detection

Ground testing setup
2 Watt W-
band PA
Transceiver
Radar front end Transceiver
Tx chain
LO
chain
Parabolic mirror
Wire grid
Tx horn & G-
band doubler
Rx horn &
integrated
LNA/mixer
Grating
• 100 mW Tx power
• 40 dB antenna gain
Values for
initial testing

Rain/cloud field tests @ JPL
Power spectra normalized to values at 100 m
≈ 2 dB/km
(one-way atten.)
Frequency (GHz)
Precipitating clouds
For range
of 900 m
Tw
o-w
ay a
tte
n. (d
B)
174.8 GHz
167 GHz
Reflectivity
Receiv
ed p
ow
er
(arb
. dB
)

• Note:
‒ Ripple in the radar IF
spectrum
‒ Changing scene brightness
temperature
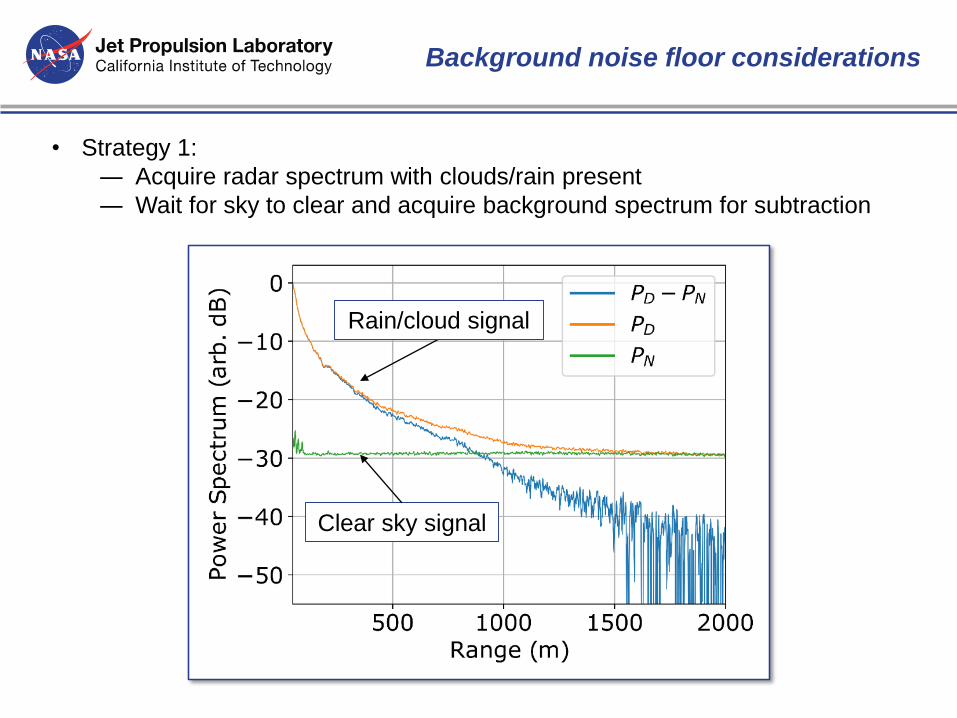
Background noise floor considerations
• Differential measurement derived from ratio of radar echo power at two different
ranges:
• But the power we detect is the sum of the echo power plus the background noise
power:
One-way optical depth
⇒ have to acquire and subtract true
background noise floor – otherwise clear
low-humidity bias for low-SNR
Background noise floor considerations
• Strategy 1:
― Acquire radar spectrum with clouds/rain present
― Wait for sky to clear and acquire background spectrum for subtraction
Clear sky signal
Rain/cloud signal
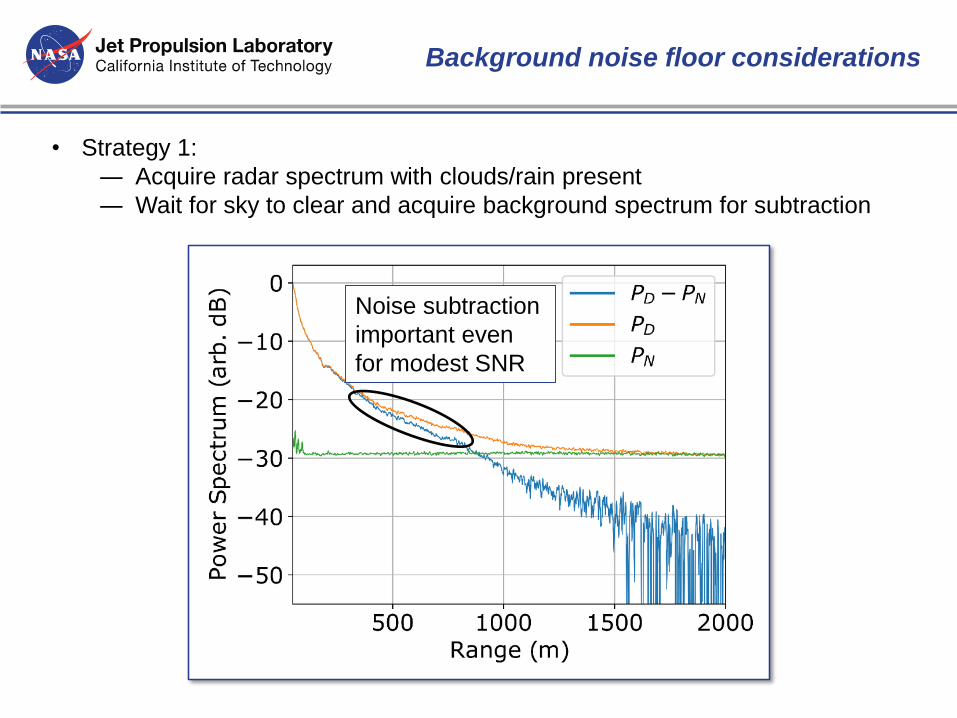
Background noise floor considerations
• Strategy 1:
― Acquire radar spectrum with clouds/rain present
― Wait for sky to clear and acquire background spectrum for subtraction
Noise subtraction
important even
for modest SNR

Real-time noise floor subtraction
• Strategy 2:
― Acquire cloud/rain signal spectrum and background noise floor
simultaneously by using bidirectional chirp (triangle wave)
Ch
irp
er
Fre
qu
en
cy
time
Transmitted chirp
Received chirp

DAR signal processing
2.5 m range resolution
27.5 m range resolution
Bin (i.e. downsample) radar spectra by
factor of 10 to reduce statistical uncertainty
• Measurement error agrees very well with
statistical model based on radar speckle noise
Relative error vs. SNR

Humidity retrieval
Retrieval step size:
Avg. humidity
between bins
• Fit millimeter-wave propagation
model to measured absorption
coefficient βv(f) to extract
humidity
Ab
so
rptio
n c
oe
ff. (d
B/k
m) MLS MPM R = 200 m
Typical uncertainty ≈ 0.6 g/m3

Measurement reproducibility
Light drizzle at
surface, cloud
base at 1 km
Strong precipitation
at surface

Conclusions and outlook
• G-Band differential absorption radar proof-of-concept instrument assembled
and preliminary field testing successful
• Real-time background noise floor cancellation using bidirectional chirp
• Capable of measuring both precipitating (large hydrometeors/cross section)
and non-precipitating (smaller hydrometeors/cross section) clouds
• Humidity profile retrieval algorithm implemented
The present:
The future:
• Installation of 61 cm primary aperture and corresponding 20 dB increase in
gain
• Field testing with coincident radiosonde measurements for instrument
validation
• Testing from an airborne platform – investigate surface returns for total
column water retrieval
Thank you to ESTO for funding the project.

The end
Thank you for your
attention
Questions?