Embed Size (px)
Citation preview
JLMN-Journal of Laser Micro/Nanoengineering Vol. 8, No. 1, 2013
102
Boundary Element Analysis of Crack Propagation in Laser Scribing of Glass
Keisuke Yahata *, Etsuji Ohmura *, Seiji Shimizu **and Masanao Murakami**
*Management of Industry and Technology, Osaka University, 2-1 Yamadaoka, Suita, Osaka 565-0871, Japan
E-mail: [email protected] ** Mitsuboshi Diamond Industrial Co., LTD., 32-12 Koroen, Settu, Osaka 566-0034, Japan
Laser scribing generates a shallow median crack on a glass surface as a pre-processing for divi-sion without physical contact. It utilizes thermal stress caused by heating with the laser beam and by cooling with the water jet. In laser scribing, different crack propagation phenomena are observed between the areas near and far from the glass edge. In this research, we examined experimentally how the crack propagates from the glass edge to the glass center. The crack propagation mechanism was considered through a crack propagation analysis where FEM and BEM are combined. The obtained conclusions are as follows: The initial crack propagates to become a through crack due to the tensile stress generated inside the glass during the period when the glass edge is heated. In the subsequent cooling period, large tensile stress is generated in the vicinity of the glass surface. The crack propagates quasi-steadily only in this region to become a surface crack of constant depth. The depth of the shallow crack can be estimated by the crack propagation analysis by setting a suitable threshold of the stress intensity factor.
Keywords: glass, CO2 laser, thermal stress, scribing, FEM, BEM, three-dimensional analysis
1. Introduction In recent years, the use of flat panel displays, laptop
computers, and cell phones has grown, and the demands of liquid crystal displays (LCD) and plasma display panels (PDP) used in these products have grown as well. In the manufacturing of LCD or PDP, the glass cutting process is an indispensable step.
Glass is mainly divided by the scribe and break method. A mechanical process with a cutter wheel is widely applied in the scribing. However, due to the generation of mi-crocracks on the scribed edge, the edge strength is de-creased [1]. Due to the demands of high bending strength, especially in portable products, fewer microcracks should be generated.
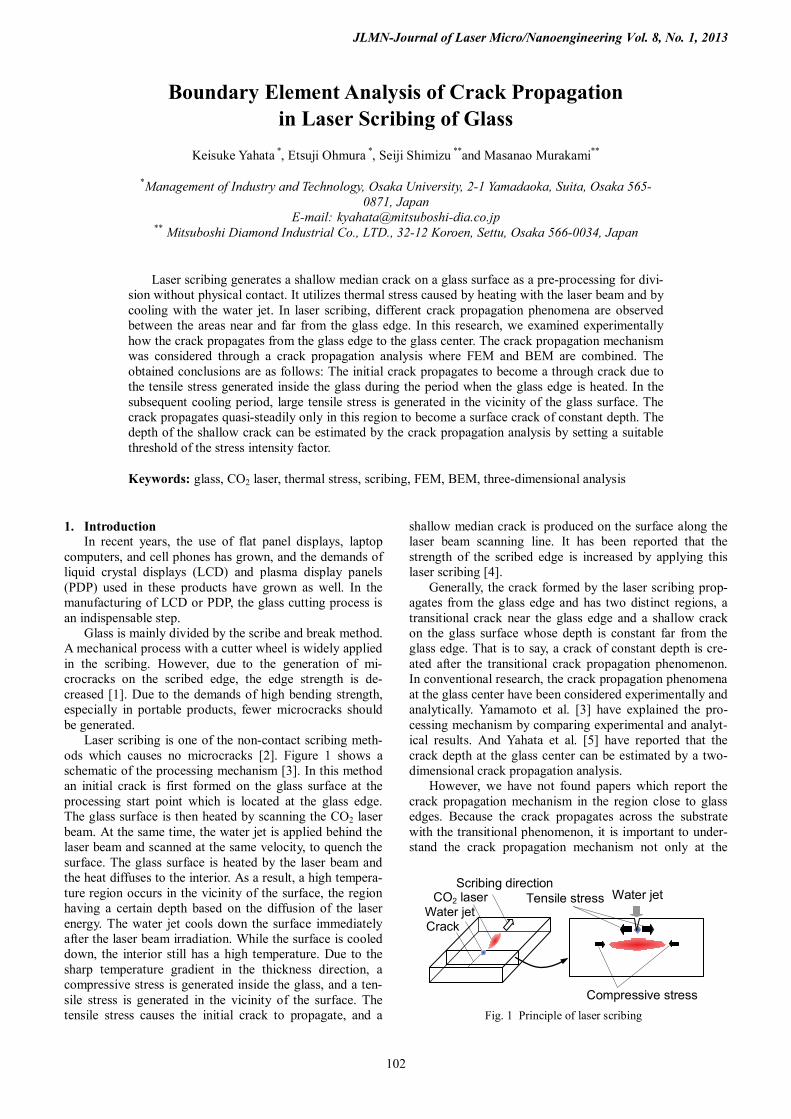
Laser scribing is one of the non-contact scribing meth-ods which causes no microcracks [2]. Figure 1 shows a schematic of the processing mechanism [3]. In this method an initial crack is first formed on the glass surface at the processing start point which is located at the glass edge. The glass surface is then heated by scanning the CO2 laser beam. At the same time, the water jet is applied behind the laser beam and scanned at the same velocity, to quench the surface. The glass surface is heated by the laser beam and the heat diffuses to the interior. As a result, a high tempera-ture region occurs in the vicinity of the surface, the region having a certain depth based on the diffusion of the laser energy. The water jet cools down the surface immediately after the laser beam irradiation. While the surface is cooled down, the interior still has a high temperature. Due to the sharp temperature gradient in the thickness direction, a compressive stress is generated inside the glass, and a ten-sile stress is generated in the vicinity of the surface. The tensile stress causes the initial crack to propagate, and a
shallow median crack is produced on the surface along the laser beam scanning line. It has been reported that the strength of the scribed edge is increased by applying this laser scribing [4].
Generally, the crack formed by the laser scribing prop-agates from the glass edge and has two distinct regions, a transitional crack near the glass edge and a shallow crack on the glass surface whose depth is constant far from the glass edge. That is to say, a crack of constant depth is cre-ated after the transitional crack propagation phenomenon. In conventional research, the crack propagation phenomena at the glass center have been considered experimentally and analytically. Yamamoto et al. [3] have explained the pro-cessing mechanism by comparing experimental and analyt-ical results. And Yahata et al. [5] have reported that the crack depth at the glass center can be estimated by a two-dimensional crack propagation analysis.
However, we have not found papers which report the crack propagation mechanism in the region close to glass edges. Because the crack propagates across the substrate with the transitional phenomenon, it is important to under-stand the crack propagation mechanism not only at the
Fig. 1 Principle of laser scribing
CO2 laser Scribing direction
Water jet Tensile stress
Water jet
Compressive stress
Crack
JLMN-Journal of Laser Micro/Nanoengineering Vol. 8, No. 1, 2013
103
glass center but also near glass edges. In this research, we investigated experimentally the crack propagation from the glass edge to the glass center. Then in order to clarify the mechanism of the crack propagation phenomena observed in the experiment, a three-dimensional crack propagation analysis was conducted.
In propagating the crack in the analysis, the stress in-tensity factor was calculated with a cracked model based on the thermal stress field obtained with an uncracked model. Regarding the thermal stress analysis with an uncracked model, the finite element method (FEM) was used as the conventional research [6]. On the other hand, to model the crack shape precisely in a three-dimensional analysis, many elements are generally necessary. Therefore, in the practical use, methods which reduce the analysis time are desired. In stress concentration problems, it has been reported that precise solutions can be obtained with fewer elements by the boundary element method (BEM) compared with FEM [7]. Therefore, in this research, we used BEM for the calculation of the stress intensity factor.
2. Laser scribing experiment 2.1 Experimental methodology
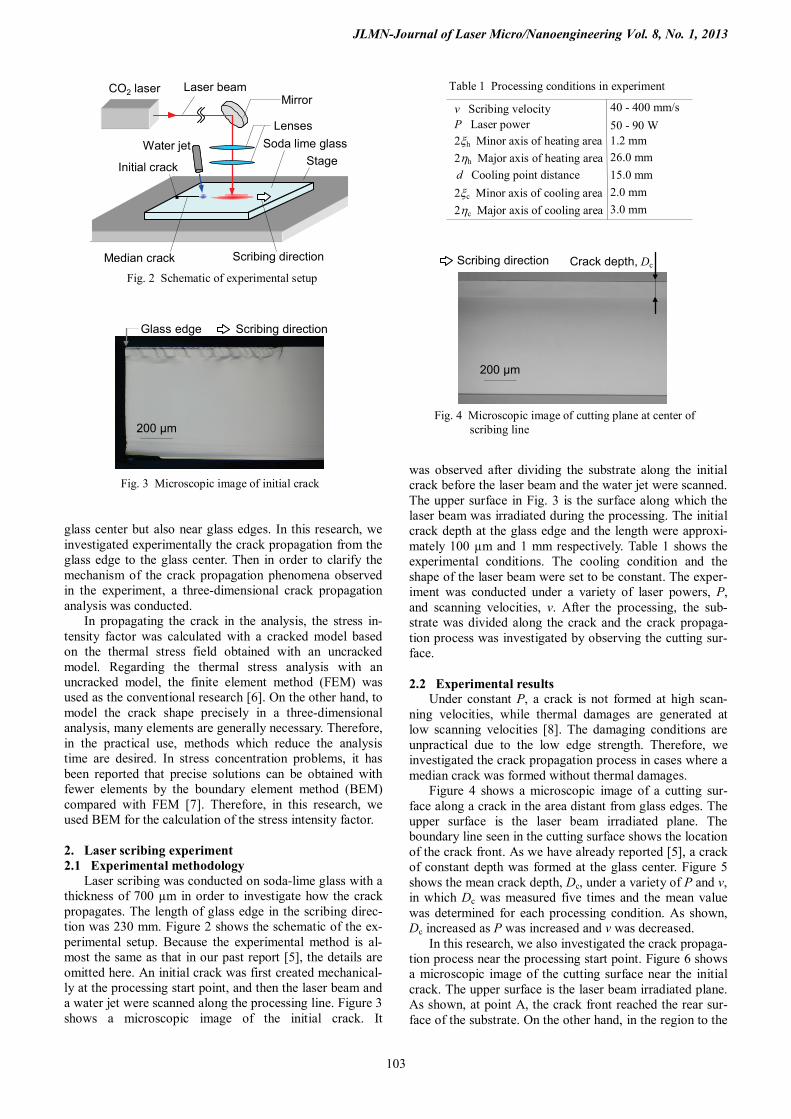
Laser scribing was conducted on soda-lime glass with a thickness of 700 µm in order to investigate how the crack propagates. The length of glass edge in the scribing direc-tion was 230 mm. Figure 2 shows the schematic of the ex-perimental setup. Because the experimental method is al-most the same as that in our past report [5], the details are omitted here. An initial crack was first created mechanical-ly at the processing start point, and then the laser beam and a water jet were scanned along the processing line. Figure 3 shows a microscopic image of the initial crack. It
was observed after dividing the substrate along the initial crack before the laser beam and the water jet were scanned. The upper surface in Fig. 3 is the surface along which the laser beam was irradiated during the processing. The initial crack depth at the glass edge and the length were approxi-mately 100 µm and 1 mm respectively. Table 1 shows the experimental conditions. The cooling condition and the shape of the laser beam were set to be constant. The exper-iment was conducted under a variety of laser powers, P, and scanning velocities, v. After the processing, the sub-strate was divided along the crack and the crack propaga-tion process was investigated by observing the cutting sur-face. 2.2 Experimental results
Under constant P, a crack is not formed at high scan-ning velocities, while thermal damages are generated at low scanning velocities [8]. The damaging conditions are unpractical due to the low edge strength. Therefore, we investigated the crack propagation process in cases where a median crack was formed without thermal damages.
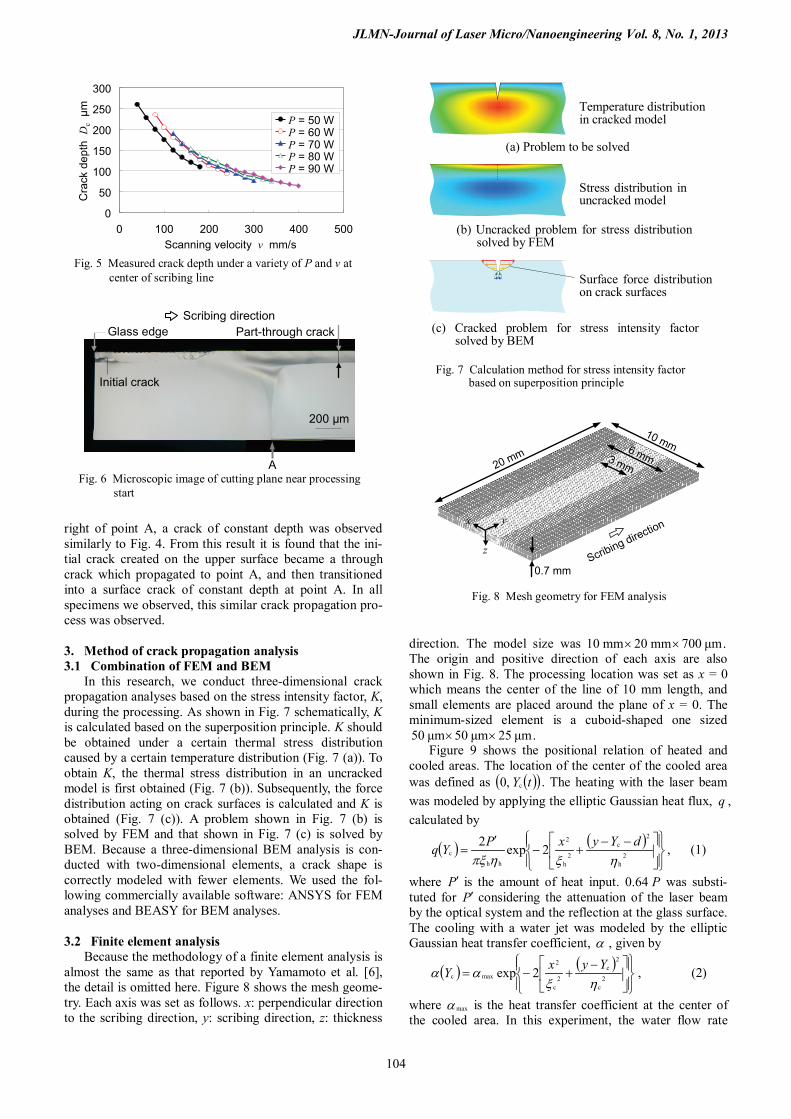
Figure 4 shows a microscopic image of a cutting sur-face along a crack in the area distant from glass edges. The upper surface is the laser beam irradiated plane. The boundary line seen in the cutting surface shows the location of the crack front. As we have already reported [5], a crack of constant depth was formed at the glass center. Figure 5 shows the mean crack depth, Dc, under a variety of P and v, in which Dc was measured five times and the mean value was determined for each processing condition. As shown, Dc increased as P was increased and v was decreased.
In this research, we also investigated the crack propaga-tion process near the processing start point. Figure 6 shows a microscopic image of the cutting surface near the initial crack. The upper surface is the laser beam irradiated plane. As shown, at point A, the crack front reached the rear sur-face of the substrate. On the other hand, in the region to the
Fig. 3 Microscopic image of initial crack
Scribing direction
200 µm
Glass edge
Lenses
MirrorCO2 laser Laser beam
Water jet Soda lime glassStage
Scribing direction
Initial crack
Median crack
Fig. 2 Schematic of experimental setup Crack depth, Dc Scribing direction
200 µm
Fig. 4 Microscopic image of cutting plane at center of scribing line
v Scribing velocity P Laser power 2xh Minor axis of heating area 2hh Major axis of heating area d Cooling point distance 2xc Minor axis of cooling area 2hc Major axis of cooling area
40 - 400 mm/s 50 - 90 W 1.2 mm 26.0 mm
3.0 mm
15.0 mm 2.0 mm
Table 1 Processing conditions in experiment
JLMN-Journal of Laser Micro/Nanoengineering Vol. 8, No. 1, 2013
104
right of point A, a crack of constant depth was observed similarly to Fig. 4. From this result it is found that the ini-tial crack created on the upper surface became a through crack which propagated to point A, and then transitioned into a surface crack of constant depth at point A. In all specimens we observed, this similar crack propagation pro-cess was observed. 3. Method of crack propagation analysis 3.1 Combination of FEM and BEM
In this research, we conduct three-dimensional crack propagation analyses based on the stress intensity factor, K, during the processing. As shown in Fig. 7 schematically, K is calculated based on the superposition principle. K should be obtained under a certain thermal stress distribution caused by a certain temperature distribution (Fig. 7 (a)). To obtain K, the thermal stress distribution in an uncracked model is first obtained (Fig. 7 (b)). Subsequently, the force distribution acting on crack surfaces is calculated and K is obtained (Fig. 7 (c)). A problem shown in Fig. 7 (b) is solved by FEM and that shown in Fig. 7 (c) is solved by BEM. Because a three-dimensional BEM analysis is con-ducted with two-dimensional elements, a crack shape is correctly modeled with fewer elements. We used the fol-lowing commercially available software: ANSYS for FEM analyses and BEASY for BEM analyses.
3.2 Finite element analysis
Because the methodology of a finite element analysis is almost the same as that reported by Yamamoto et al. [6], the detail is omitted here. Figure 8 shows the mesh geome-try. Each axis was set as follows. x: perpendicular direction to the scribing direction, y: scribing direction, z: thickness
direction. The model size was .μm700mm20mm10 ×× The origin and positive direction of each axis are also shown in Fig. 8. The processing location was set as x = 0 which means the center of the line of 10 mm length, and small elements are placed around the plane of x = 0. The minimum-sized element is a cuboid-shaped one sized
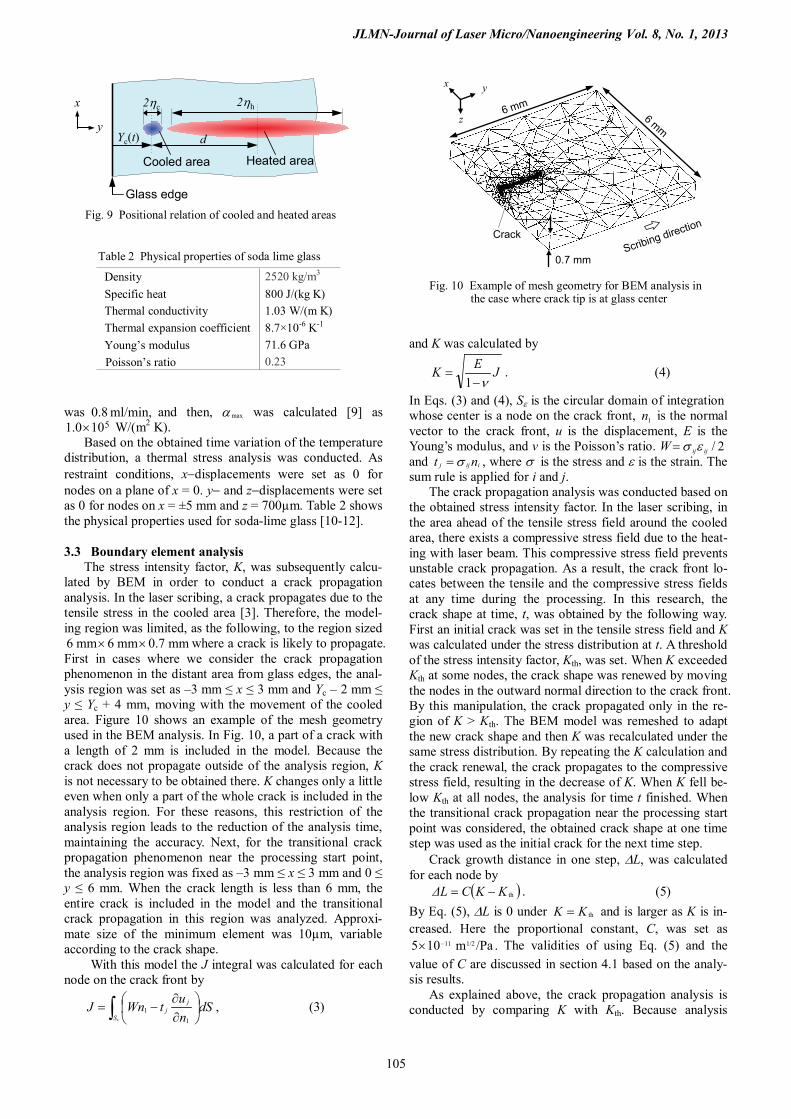
.μm25μm50μm50 ×× Figure 9 shows the positional relation of heated and
cooled areas. The location of the center of the cooled area was defined as ( )( )tYc,0 . The heating with the laser beam was modeled by applying the elliptic Gaussian heat flux, q , calculated by
( ) ( )
−−+−
′= 2
h
2c
2h
2
hhc 2exp2
hxhpxdYyxPYq , (1)
where P′ is the amount of heat input. P64.0 was substi-tuted for P′ considering the attenuation of the laser beam by the optical system and the reflection at the glass surface. The cooling with a water jet was modeled by the elliptic Gaussian heat transfer coefficient, α , given by
( ) ( )
−+−= 2
c
2c
2c
2
maxc 2exphx
αα YyxY , (2)
where maxα is the heat transfer coefficient at the center of the cooled area. In this experiment, the water flow rate
Glass edge
200 µm
Initial crack
Part-through crackScribing direction
A Fig. 6 Microscopic image of cutting plane near processing
start
0
50
100
150
200
250
300
0 100 200 300 400 500
P = 50 WP = 60 WP = 70 WP = 80 WP = 90 W
Scanning velocity v mm/s
Cra
ck d
epth
Dc
µm
Fig. 5 Measured crack depth under a variety of P and v at center of scribing line
Fig. 7 Calculation method for stress intensity factor based on superposition principle
Temperature distribution in cracked model
Stress distribution in uncracked model
(a) Problem to be solved
(b) Uncracked problem for stress distribution solved by FEM
(c) Cracked problem for stress intensity factor solved by BEM
Surface force distribution on crack surfaces
20 mm
10 mm
0.7 mm
x y
zScribing direction
6 mm3 mm
Fig. 8 Mesh geometry for FEM analysis
JLMN-Journal of Laser Micro/Nanoengineering Vol. 8, No. 1, 2013
105
was ml/min, 0.8 and then, maxα was calculated [9] as 5100.1 × W/(m2 K).
Based on the obtained time variation of the temperature distribution, a thermal stress analysis was conducted. As restraint conditions, x−displacements were set as 0 for nodes on a plane of x = 0. y− and z−displacements were set as 0 for nodes on x = ±5 mm and z = 700µm. Table 2 shows the physical properties used for soda-lime glass [10-12].
3.3 Boundary element analysis
The stress intensity factor, K, was subsequently calcu-lated by BEM in order to conduct a crack propagation analysis. In the laser scribing, a crack propagates due to the tensile stress in the cooled area [3]. Therefore, the model-ing region was limited, as the following, to the region sized
mm7.0mm6mm6 ×× where a crack is likely to propagate. First in cases where we consider the crack propagation phenomenon in the distant area from glass edges, the anal-ysis region was set as –3 mm ≤ x ≤ 3 mm and Yc – 2 mm ≤ y ≤ Yc + 4 mm, moving with the movement of the cooled area. Figure 10 shows an example of the mesh geometry used in the BEM analysis. In Fig. 10, a part of a crack with a length of 2 mm is included in the model. Because the crack does not propagate outside of the analysis region, K is not necessary to be obtained there. K changes only a little even when only a part of the whole crack is included in the analysis region. For these reasons, this restriction of the analysis region leads to the reduction of the analysis time, maintaining the accuracy. Next, for the transitional crack propagation phenomenon near the processing start point, the analysis region was fixed as –3 mm ≤ x ≤ 3 mm and 0 ≤ y ≤ 6 mm. When the crack length is less than 6 mm, the entire crack is included in the model and the transitional crack propagation in this region was analyzed. Approxi-mate size of the minimum element was 10µm, variable according to the crack shape.
With this model the J integral was calculated for each node on the crack front by
∫
∂∂
−=εS
jj dS
nutWnJ
11 , (3)
and K was calculated by
JEKν−
=1
. (4)
In Eqs. (3) and (4), Sε is the circular domain of integration whose center is a node on the crack front, 1n is the normal vector to the crack front, u is the displacement, E is the Young’s modulus, and v is the Poisson’s ratio. W 2/ijijεσ= and iijj nt σ= , where σ is the stress and ε is the strain. The sum rule is applied for i and j.
The crack propagation analysis was conducted based on the obtained stress intensity factor. In the laser scribing, in the area ahead of the tensile stress field around the cooled area, there exists a compressive stress field due to the heat-ing with laser beam. This compressive stress field prevents unstable crack propagation. As a result, the crack front lo-cates between the tensile and the compressive stress fields at any time during the processing. In this research, the crack shape at time, t, was obtained by the following way. First an initial crack was set in the tensile stress field and K was calculated under the stress distribution at t. A threshold of the stress intensity factor, Kth, was set. When K exceeded Kth at some nodes, the crack shape was renewed by moving the nodes in the outward normal direction to the crack front. By this manipulation, the crack propagated only in the re-gion of K > Kth. The BEM model was remeshed to adapt the new crack shape and then K was recalculated under the same stress distribution. By repeating the K calculation and the crack renewal, the crack propagates to the compressive stress field, resulting in the decrease of K. When K fell be-low Kth at all nodes, the analysis for time t finished. When the transitional crack propagation near the processing start point was considered, the obtained crack shape at one time step was used as the initial crack for the next time step.
Crack growth distance in one step, ∆L, was calculated for each node by
( )thKKCΔL −= . (5) By Eq. (5), ∆L is 0 under thKK = and is larger as K is in-creased. Here the proportional constant, C, was set as
./Pam105 1/211−× The validities of using Eq. (5) and the value of C are discussed in section 4.1 based on the analy-sis results.
As explained above, the crack propagation analysis is conducted by comparing K with Kth. Because analysis
Fig. 10 Example of mesh geometry for BEM analysis in the case where crack tip is at glass center
6 mm6 mm
y
z
Crack
6 mm
0.7 mmScribing direction
Crack
6 mm
x
z
y
Fig. 9 Positional relation of cooled and heated areas
Yc(t) d
2hc 2hh
Glass edge
x
y
Cooled area Heated area
Density Specific heat Thermal conductivity Thermal expansion coefficient Young’s modulus Poisson’s ratio
2520 kg/m3 800 J/(kg K) 1.03 W/(m K) 8.7×10⁻⁶ K-1 71.6 GPa 0.23
Table 2 Physical properties of soda lime glass
JLMN-Journal of Laser Micro/Nanoengineering Vol. 8, No. 1, 2013
106
results depend on Kth, suitable value of Kth should be de-termined. First in this research, suitable Kth was determined focusing on the crack depth at the glass center. Then we considered crack propagation phenomena from the glass edge to the center by applying the obtained Kth.
4. Analysis results and consideration 4.1 Determination of suitable value of Kth
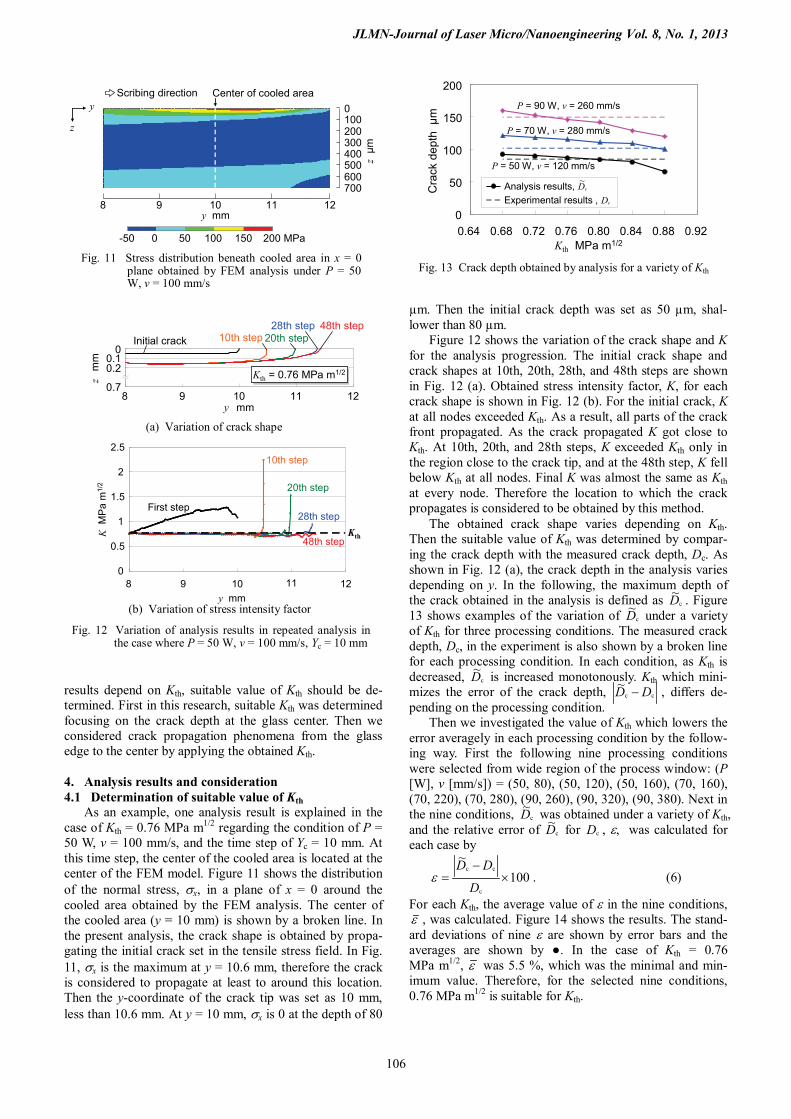
As an example, one analysis result is explained in the case of Kth = 0.76 MPa m1/2 regarding the condition of P = 50 W, v = 100 mm/s, and the time step of Yc = 10 mm. At this time step, the center of the cooled area is located at the center of the FEM model. Figure 11 shows the distribution of the normal stress, σx, in a plane of x = 0 around the cooled area obtained by the FEM analysis. The center of the cooled area (y = 10 mm) is shown by a broken line. In the present analysis, the crack shape is obtained by propa-gating the initial crack set in the tensile stress field. In Fig. 11, σx is the maximum at y = 10.6 mm, therefore the crack is considered to propagate at least to around this location. Then the y-coordinate of the crack tip was set as 10 mm, less than 10.6 mm. At y = 10 mm, σx is 0 at the depth of 80
µm. Then the initial crack depth was set as 50 µm, shal-lower than 80 µm.
Figure 12 shows the variation of the crack shape and K for the analysis progression. The initial crack shape and crack shapes at 10th, 20th, 28th, and 48th steps are shown in Fig. 12 (a). Obtained stress intensity factor, K, for each crack shape is shown in Fig. 12 (b). For the initial crack, K at all nodes exceeded Kth. As a result, all parts of the crack front propagated. As the crack propagated K got close to Kth. At 10th, 20th, and 28th steps, K exceeded Kth only in the region close to the crack tip, and at the 48th step, K fell below Kth at all nodes. Final K was almost the same as Kth at every node. Therefore the location to which the crack propagates is considered to be obtained by this method.
The obtained crack shape varies depending on Kth. Then the suitable value of Kth was determined by compar-ing the crack depth with the measured crack depth, Dc. As shown in Fig. 12 (a), the crack depth in the analysis varies depending on y. In the following, the maximum depth of the crack obtained in the analysis is defined as c
~D . Figure 13 shows examples of the variation of c
~D under a variety of Kth for three processing conditions. The measured crack depth, Dc, in the experiment is also shown by a broken line for each processing condition. In each condition, as Kth is decreased, c
~D is increased monotonously. Kth which mini-mizes the error of the crack depth, cc
~ DD − , differs de-pending on the processing condition.
Then we investigated the value of Kth which lowers the error averagely in each processing condition by the follow-ing way. First the following nine processing conditions were selected from wide region of the process window: (P [W], v [mm/s]) = (50, 80), (50, 120), (50, 160), (70, 160), (70, 220), (70, 280), (90, 260), (90, 320), (90, 380). Next in the nine conditions, c
~D was obtained under a variety of Kth, and the relative error of c
~D for cD , ε, was calculated for each case by
100~
c
cc×
−=
D
DDε . (6)
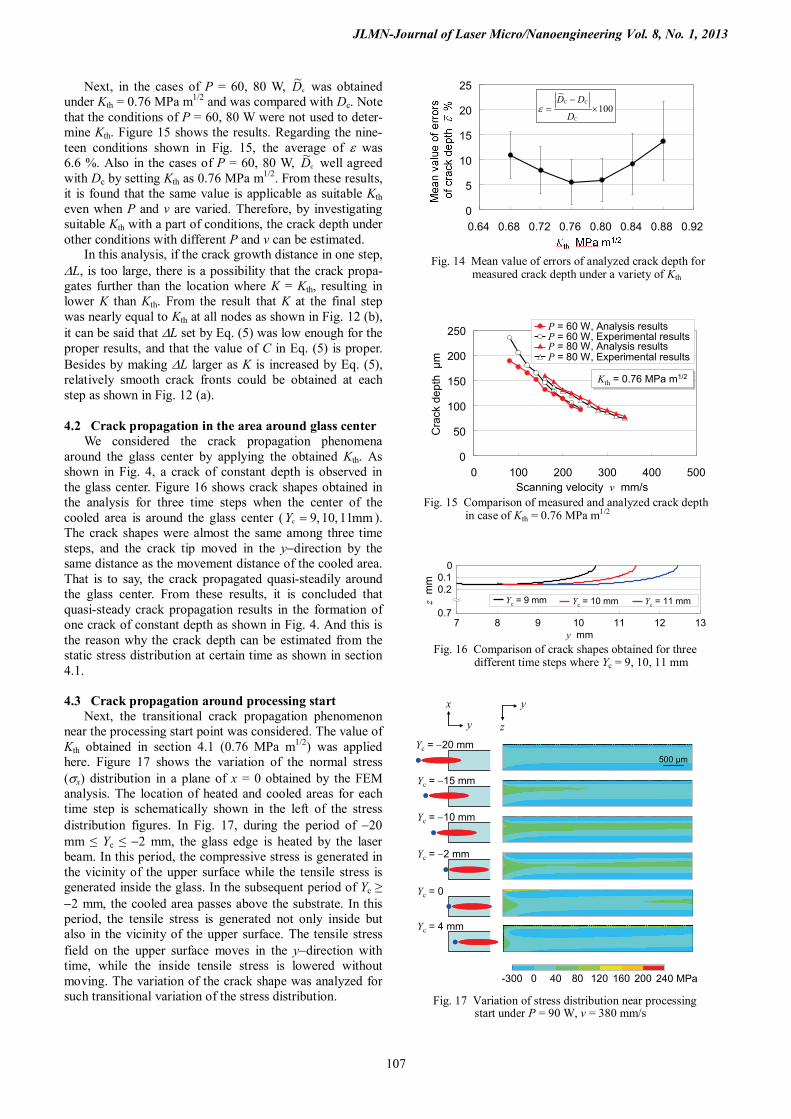
For each Kth, the average value of ε in the nine conditions, ε , was calculated. Figure 14 shows the results. The stand-ard deviations of nine ε are shown by error bars and the averages are shown by ●. In the case of Kth = 0.76 MPa m1/2, ε was 5.5 %, which was the minimal and min-imum value. Therefore, for the selected nine conditions, 0.76 MPa m1/2 is suitable for Kth.
0
100
200
0.64 0.68 0.72 0.76 0.80 0.84 0.88 0.92
P = 90 W, v = 260 mm/s
P = 70 W, v = 280 mm/s
P = 50 W, v = 120 mm/s
Experimental results , Analysis results, 50
150
Cra
ck d
epth
µm
Kth MPa m1/2
c~D
cD
Fig. 13 Crack depth obtained by analysis for a variety of Kth
0.7
0.20.1
0
8 9 10 11 12y mm
zm
m
20th step10th stepInitial crack28th step
Kth = 0.76 MPa m1/2
48th step
0
0.5
1
1.5
2
2.5
20th step
48th step
10th step
y mm
KM
Pa
m1/
2
8 9 10 1211
28th step Kth
First step
Fig. 12 Variation of analysis results in repeated analysis in the case where P = 50 W, v = 100 mm/s, Yc = 10 mm
(a) Variation of crack shape
(b) Variation of stress intensity factor
Fig. 11 Stress distribution beneath cooled area in x = 0 plane obtained by FEM analysis under P = 50 W, v = 100 mm/s
Center of cooled area
-50 0 200 MPa50 100 150
10 11 1298y mm
0100200300400500600700
zµm
Scribing directiony
z
JLMN-Journal of Laser Micro/Nanoengineering Vol. 8, No. 1, 2013
107
Next, in the cases of P = 60, 80 W, c~D was obtained
under Kth = 0.76 MPa m1/2 and was compared with Dc. Note that the conditions of P = 60, 80 W were not used to deter-mine Kth. Figure 15 shows the results. Regarding the nine-teen conditions shown in Fig. 15, the average of ε was 6.6 %. Also in the cases of P = 60, 80 W, c
~D well agreed with Dc by setting Kth as 0.76 MPa m1/2. From these results, it is found that the same value is applicable as suitable Kth even when P and v are varied. Therefore, by investigating suitable Kth with a part of conditions, the crack depth under other conditions with different P and v can be estimated.
In this analysis, if the crack growth distance in one step, ∆L, is too large, there is a possibility that the crack propa-gates further than the location where K = Kth, resulting in lower K than Kth. From the result that K at the final step was nearly equal to Kth at all nodes as shown in Fig. 12 (b), it can be said that ∆L set by Eq. (5) was low enough for the proper results, and that the value of C in Eq. (5) is proper. Besides by making ∆L larger as K is increased by Eq. (5), relatively smooth crack fronts could be obtained at each step as shown in Fig. 12 (a).
4.2 Crack propagation in the area around glass center
We considered the crack propagation phenomena around the glass center by applying the obtained Kth. As shown in Fig. 4, a crack of constant depth is observed in the glass center. Figure 16 shows crack shapes obtained in the analysis for three time steps when the center of the cooled area is around the glass center ( mm11,10,9c =Y ). The crack shapes were almost the same among three time steps, and the crack tip moved in the y−direction by the same distance as the movement distance of the cooled area. That is to say, the crack propagated quasi-steadily around the glass center. From these results, it is concluded that quasi-steady crack propagation results in the formation of one crack of constant depth as shown in Fig. 4. And this is the reason why the crack depth can be estimated from the static stress distribution at certain time as shown in section 4.1.
4.3 Crack propagation around processing start
Next, the transitional crack propagation phenomenon near the processing start point was considered. The value of Kth obtained in section 4.1 (0.76 MPa m1/2) was applied here. Figure 17 shows the variation of the normal stress (σx) distribution in a plane of x = 0 obtained by the FEM analysis. The location of heated and cooled areas for each time step is schematically shown in the left of the stress distribution figures. In Fig. 17, during the period of −20 mm ≤ Yc ≤ −2 mm, the glass edge is heated by the laser beam. In this period, the compressive stress is generated in the vicinity of the upper surface while the tensile stress is generated inside the glass. In the subsequent period of Yc ≥ −2 mm, the cooled area passes above the substrate. In this period, the tensile stress is generated not only inside but also in the vicinity of the upper surface. The tensile stress field on the upper surface moves in the y−direction with time, while the inside tensile stress is lowered without moving. The variation of the crack shape was analyzed for such transitional variation of the stress distribution.
500 µm
y
zy
x
Yc = −20 mm
Yc = −15 mm
Yc = −10 mm
Yc = −2 mm
Yc = 0
Yc = 4 mm
-300 0 40 80 120 160 200 240 MPa
Fig. 17 Variation of stress distribution near processing start under P = 90 W, v = 380 mm/s
7 8 9 10 11 12 13y mm
Yc = 9 mm Yc = 10 mm Yc = 11 mm0.7
0.20.1
0
zm
m
Fig. 16 Comparison of crack shapes obtained for three different time steps where Yc = 9, 10, 11 mm
0
50
100
150
200
250
0 100 200 300 400 500
P = 60 W, Analysis resultsP = 60 W, Experimental resultsP = 80 W, Analysis resultsP = 80 W, Experimental results
Kth = 0.76 MPa m1/2Kth = 0.76 MPa m1/2
Scanning velocity v mm/s
Cra
ck d
epth
µm
Fig. 15 Comparison of measured and analyzed crack depth in case of Kth = 0.76 MPa m1/2
0
5
10
15
20
25
0.64 0.68 0.72 0.76 0.80 0.84 0.88 0.92
100~
C
CC
×−
=D
DDε
Fig. 14 Mean value of errors of analyzed crack depth for measured crack depth under a variety of Kth
JLMN-Journal of Laser Micro/Nanoengineering Vol. 8, No. 1, 2013
108
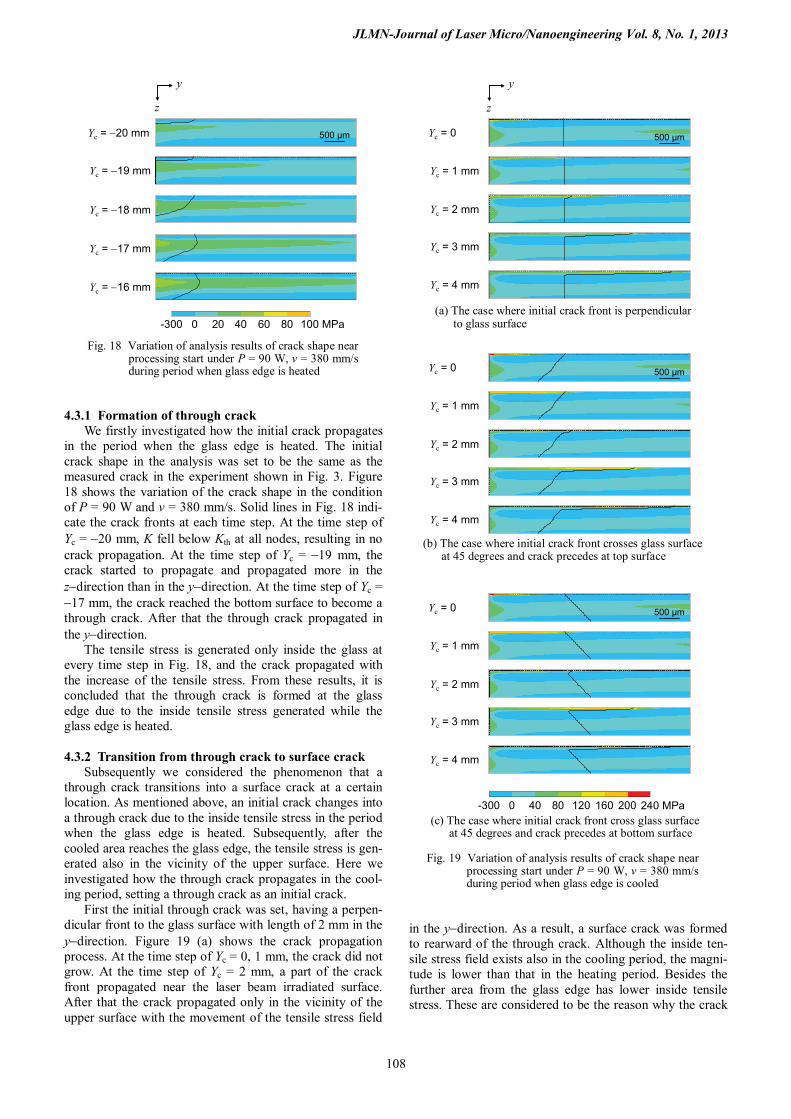
4.3.1 Formation of through crack
We firstly investigated how the initial crack propagates in the period when the glass edge is heated. The initial crack shape in the analysis was set to be the same as the measured crack in the experiment shown in Fig. 3. Figure 18 shows the variation of the crack shape in the condition of P = 90 W and v = 380 mm/s. Solid lines in Fig. 18 indi-cate the crack fronts at each time step. At the time step of Yc = −20 mm, K fell below Kth at all nodes, resulting in no crack propagation. At the time step of Yc = −19 mm, the crack started to propagate and propagated more in the z−direction than in the y−direction. At the time step of Yc = −17 mm, the crack reached the bottom surface to become a through crack. After that the through crack propagated in the y−direction.
The tensile stress is generated only inside the glass at every time step in Fig. 18, and the crack propagated with the increase of the tensile stress. From these results, it is concluded that the through crack is formed at the glass edge due to the inside tensile stress generated while the glass edge is heated.
4.3.2 Transition from through crack to surface crack
Subsequently we considered the phenomenon that a through crack transitions into a surface crack at a certain location. As mentioned above, an initial crack changes into a through crack due to the inside tensile stress in the period when the glass edge is heated. Subsequently, after the cooled area reaches the glass edge, the tensile stress is gen-erated also in the vicinity of the upper surface. Here we investigated how the through crack propagates in the cool-ing period, setting a through crack as an initial crack.
First the initial through crack was set, having a perpen-dicular front to the glass surface with length of 2 mm in the y−direction. Figure 19 (a) shows the crack propagation process. At the time step of Yc = 0, 1 mm, the crack did not grow. At the time step of Yc = 2 mm, a part of the crack front propagated near the laser beam irradiated surface. After that the crack propagated only in the vicinity of the upper surface with the movement of the tensile stress field
in the y−direction. As a result, a surface crack was formed to rearward of the through crack. Although the inside ten-sile stress field exists also in the cooling period, the magni-tude is lower than that in the heating period. Besides the further area from the glass edge has lower inside tensile stress. These are considered to be the reason why the crack
Yc = 0
Yc = 1 mm
Yc = 2 mm
Yc = 3 mm
Yc = 4 mm
500 µm
Fig. 19 Variation of analysis results of crack shape near processing start under P = 90 W, v = 380 mm/s during period when glass edge is cooled
Yc = 0
Yc = 1 mm
Yc = 2 mm
Yc = 3 mm
Yc = 4 mm
500 µm
-300 0 40 80 120 160 200 240 MPa
Yc = 0
Yc = 1 mm
Yc = 2 mm
Yc = 3 mm
Yc = 4 mm
500 µm
y
z
(a) The case where initial crack front is perpendicular to glass surface
(b) The case where initial crack front crosses glass surface at 45 degrees and crack precedes at top surface
(c) The case where initial crack front cross glass surface at 45 degrees and crack precedes at bottom surface
Yc = −20 mm
Yc = −19 mm
Yc = −18 mm
Yc = −17 mm
Yc = −16 mm
-300 0 20 40 60 80 100 MPa
500 µm
Fig. 18 Variation of analysis results of crack shape near processing start under P = 90 W, v = 380 mm/s during period when glass edge is heated
y
z
JLMN-Journal of Laser Micro/Nanoengineering Vol. 8, No. 1, 2013
109
propagates only in the vicinity of the upper surface during the cooling period.
As a through crack formed in the heating period, other cases can be considered where the crack front does not cross the glass surface at right angles. Then we also ana-lyzed the additional two cases where the through crack front crosses the glass surface at 45 degrees. Figure 19 (b) and (c) show contrastive cases where the crack precedes in the upper and bottom side respectively. In both cases, after the time step of Yc = 1 mm, the crack propagated only in the vicinity of the upper surface with the movement of the cooled area. As a result, a surface crack was formed. One difference is that, in (b), the inside part of the through crack propagated at the time step of Yc = 0. The reason is consid-ered to be because the crack front was close to the glass edge and was located where the tensile stress was high enough to grow the crack.
In either case, a surface crack was formed from a through crack during the cooling period regardless of the through crack shape. Besides the propagation of the surface crack under the cooled area was not influenced by the through crack shape. From these results, it is concluded that a surface crack is formed to rearward of the through crack due to the tensile stress in the vicinity of the laser beam irradiated surface which is generated in the cooling period.
5. Conclusions
First in this research, we experimentally investigated how the crack propagates from the processing start to the glass center. It was found that a through crack was formed in the area within some millimeters from the processing start and a surface crack of constant depth was formed in the following region. In order to clarify the mechanism of such transitional crack propagation, we conducted a three-dimensional crack propagation analysis by combining FEM and BEM. The obtained conclusions are as follows:
1. In the period when the glass edge is heated, the tensile stress is generated inside the glass near the glass edge. An initial crack propagates in the thickness direction due to this tensile stress, to become a through crack.
2. In the subsequent period when the glass edge is cooled down, the tensile stress is generated also in the vicinity of the laser beam irradiated surface. The through crack propagates only in the vicinity of the glass surface due to this tensile stress. In this period the crack propa-gates quasi-steadily, to form a surface crack of con-stant depth.
3. Regarding the quasi-steady crack propagation, the crack depth obtained by the analysis agrees well with the measurement result by applying a suitable thresh-old of the stress intensity factor, Kth. Even when the la-ser power, P, and the scanning velocity, v, are varied, the same value can be applied for suitable Kth.
4. Therefore, by investigating suitable Kth with a part of processing conditions, the crack depth under other conditions with different P and v can be estimated.
References [1] S.C. Wang, L.Y. Yeh, C.C. Lin, M.S. Chen, and F.Y.
Gan: Proc. of the 14th Int. Display Workshops, Sapporo, (2007), p.513.
[2] V.S. Kondratenko: PTC WO 93/20015 (1993) [3] K. Yamamoto, N. Hasaka, H. Morita, and E. Ohmura: J.
Laser Appl., 20, (2008), 193. [4] Y. Miyake: J. Jpn. Soc. Abra. Tech., 45, (2001), 342. [5] K. Yahata, K. Yamamoto, and E. Ohmura: J. Laser Mi-
cro/Nanoengineering, 5, (2010), 109. [6] K. Yamamoto, N. Hasaka, H. Morita, and E. Ohmura:
Prec. Eng., 32, (2008), 301. [7] A. Portela: “Dual boundary element analysis of crack
growth”, (Computational Mechanics Publications, 1993) [8] K. Yahata, E. Ohmura, S. Shimizu, M. Murakami:
Proc. of 6th Int. Conf. on LEM21, Saitama, (2011), p.3374.
[9] A. Yamamoto: J. Jpn Soc. Prec. Eng., 26, (1960), 461. [10] The Japan Society of Mechanical Engineers ed.: “JSME
Data Handbook: Heat Transfer, 4th Ed.”, (The Japan Soci-ety of Mechanical Engineers, 1986)
[11] E.B. Shand: “Glass Engineering Handbook, 2nd ed.”, (McGraw-Hill, 1958)
[12] M. Yamame, I. Yasui, M. Wada, Y. Kokubu, R. Terai, K. Kondo, and S. Ogawa: “Glass Engineering Hand-book”, (Asakura Shoten, 1999)
(Received: October 23, 2012, Accepted: January 30, 2013)