Embed Size (px)
Citation preview
Bottlenecks and Oil Price Spikes: Impact on U.S. Ethanol and Agriculture
Chad HartCenter for Agricultural and Rural Development
Iowa State [email protected]
515-294-9911
Kansas State UniversityManhattan, Kansas
October 5, 2007

Outline
Based on an update of our earlier study “Emerging Biofuels: Outlook of Effects on U.S. Grain, Oilseed, and Livestock Markets”
http://www.card.iastate.edu/publications/synopsis.aspx?id=1050
Updated with available 2006 and 2007 data The objective is to estimate:
how large the biofuels sector in the U.S. could become the impact of the biofuels sector on crops markets, trade, and on
livestock markets the response of world agricultural markets
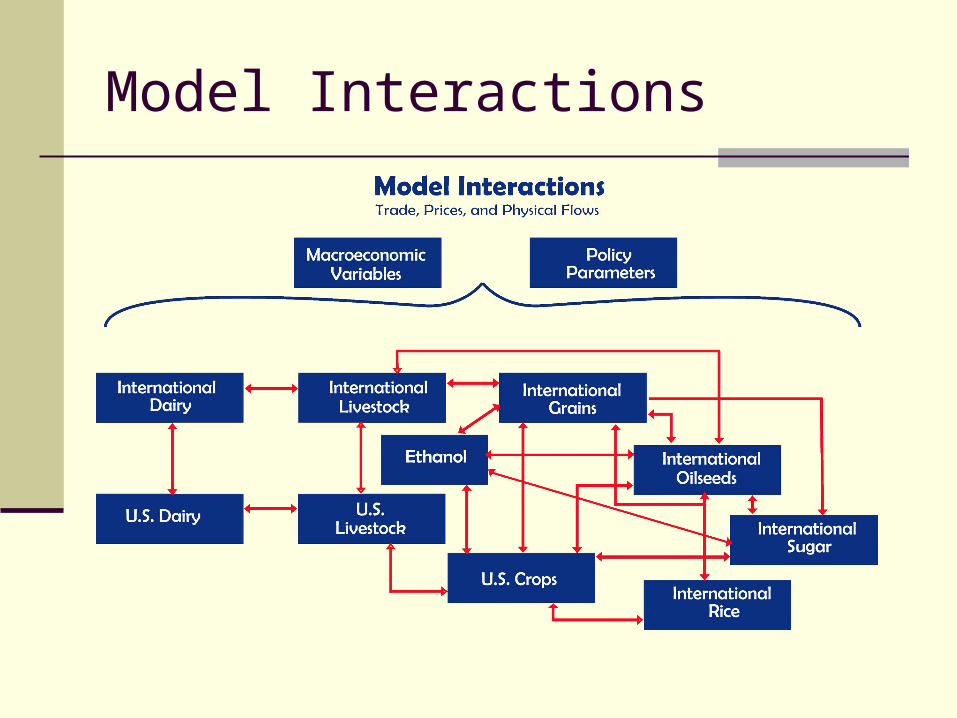
Model Interactions

•Current ethanol capacity: 129 plants, 6.88 billion gallons/year
•Total capacity under construction and expansion: 6.77 billion gallons/year
•76 new ethanol plants and 10 expansion projects underway
•2.2 billion bushels of corn were used in producing fuel ethanol in 2006/2007 marketing year.
•3.2-3.5 billion bushels of corn are expected to be used in producing fuel ethanol for 2007/2008 marketing year.
U.S. Ethanol Industry

Key Determinants of Impacts
Crude oil prices Used NYMEX futures prices as a guide
Policy incentives in the U.S. $0.51/gallon ethanol blenders credit $0.54/gallon import duty and 2.5% import tariff
The “E-85 bottleneck”: the location and quantity of flex-fuel vehicles and E-85 pumps

Three Cases
Baseline Current policies, “normal” weather
Higher oil prices throughout projection period Adding $10/barrel to the crude oil price
Drought in the 2012 crop year Placing a 1988-style drought in the middle of the
projection period

Projected U.S. Ethanol Production
0
2
4
6
8
10
12
14
16
2006 2008 2010 2012 2014 2016
billion gallons

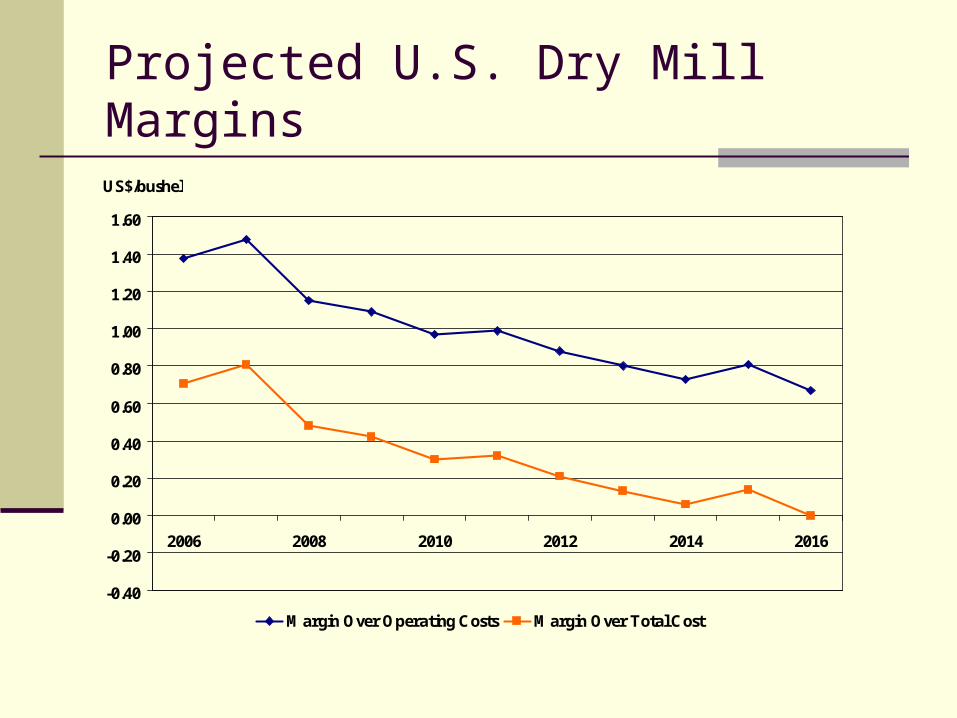
Projected U.S. Dry Mill Margins
-0.40
-0.20
0.00
0.20
0.40
0.60
0.80
1.00
1.20
1.40
1.60
2006 2008 2010 2012 2014 2016
US$/bushel
Margin Over Operating Costs Margin Over Total Cost

Margins at Various Corn and Gasoline PricesDry Mill Ethanol Plant Operating Margins at Different Corn and Gasoline Prices
-1.50
-1.00
-0.50
0.00
0.50
1.00
1.50
0.00 1.00 2.00 3.00 4.00 5.00 6.00 7.00
Dollars per Bushel
$ pe
r ga
llon 1.00
1.50
2.00
2.50
Wholesale Price of Gasoline

Wholesale Gasoline and Ethanol Prices
1.00
1.25
1.50
1.75
2.00
2.25
2.50
2.75
3.00
2006 2008 2010 2012 2014 2016
US$/gallon
Unleaded Gasoline Ethanol

Projected U.S. Corn Planted Area
70
75
80
85
90
95
2006 2008 2010 2012 2014 2016
million acres

Projected Utilization of U.S. Corn
0
1000
2000
3000
4000
5000
6000
7000
2006 2007 2008 2009 2010 2011 2012 2013 2014 2015 2016
million bushels
Feed Fuel HFCS Seed Food, Other Exports

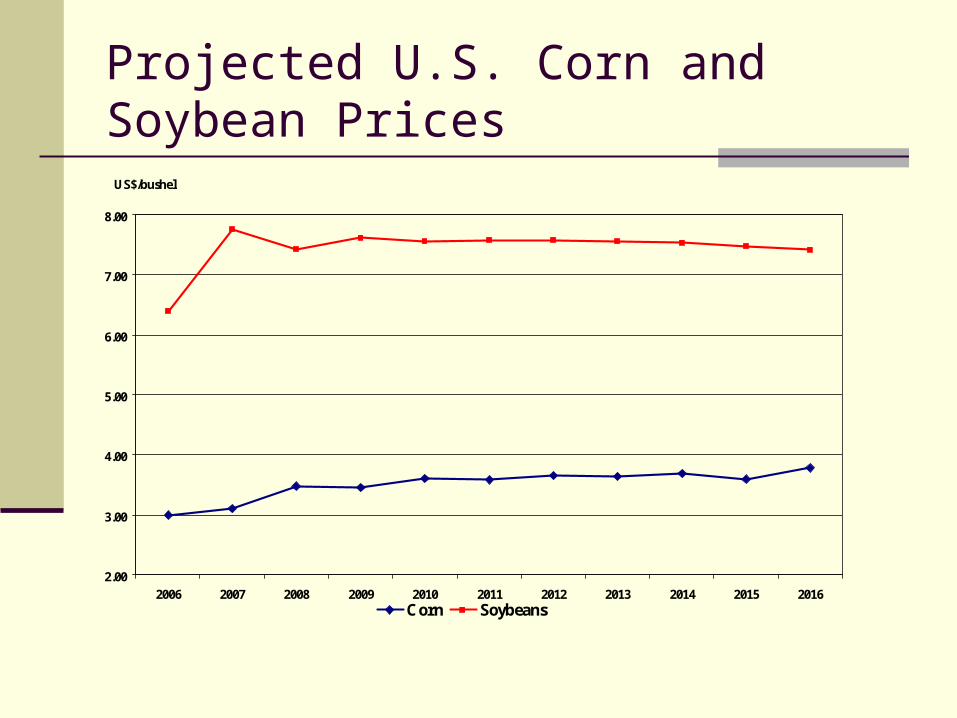
Projected U.S. Corn and Soybean Prices
3.00
4.00
5.00
6.00
7.00
8.00
2006 2007 2008 2009 2010 2011 2012 2013 2014 2015 2016
US$/bushel
Corn Soybeans

Projected U.S. Soybean Planted Area
60
65
70
75
80
2006 2008 2010 2012 2014 2016
million acres

Projected U.S. Biodiesel Production
300
350
400
450
500
550
600
2006 2008 2010 2012 2014 2016
million gallons

Projected U.S. Meat Production
20
25
30
35
40
45
2006 2007 2008 2009 2010 2011 2012 2013 2014 2015 2016
billion pounds
Beef Pork Broiler
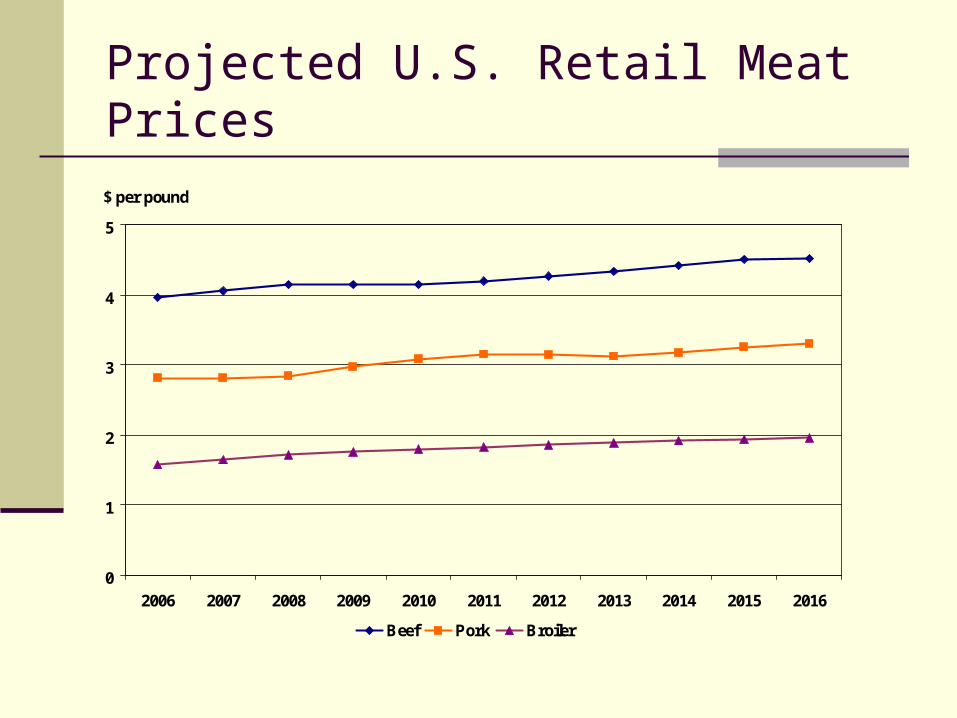
Projected U.S. Retail Meat Prices
0
1
2
3
4
5
2006 2007 2008 2009 2010 2011 2012 2013 2014 2015 2016
$ per pound
Beef Pork Broiler

Projected Brazilian Ethanol Production
4000
5000
6000
7000
8000
2006 2007 2008 2009 2010 2011 2012 2013 2014 2015 2016
million gallons
Brazil

Projected Ethanol Production
0
500
1000
1500
2006 2007 2008 2009 2010 2011 2012 2013 2014 2015 2016
million gallons
China EU India

Projected Argentine Area Harvested
0
2000
4000
6000
8000
10000
12000
14000
16000
18000
20000
2006 2007 2008 2009 2010 2011 2012 2013 2014 2015 2016
thousand hectares
Corn Wheat Soybeans
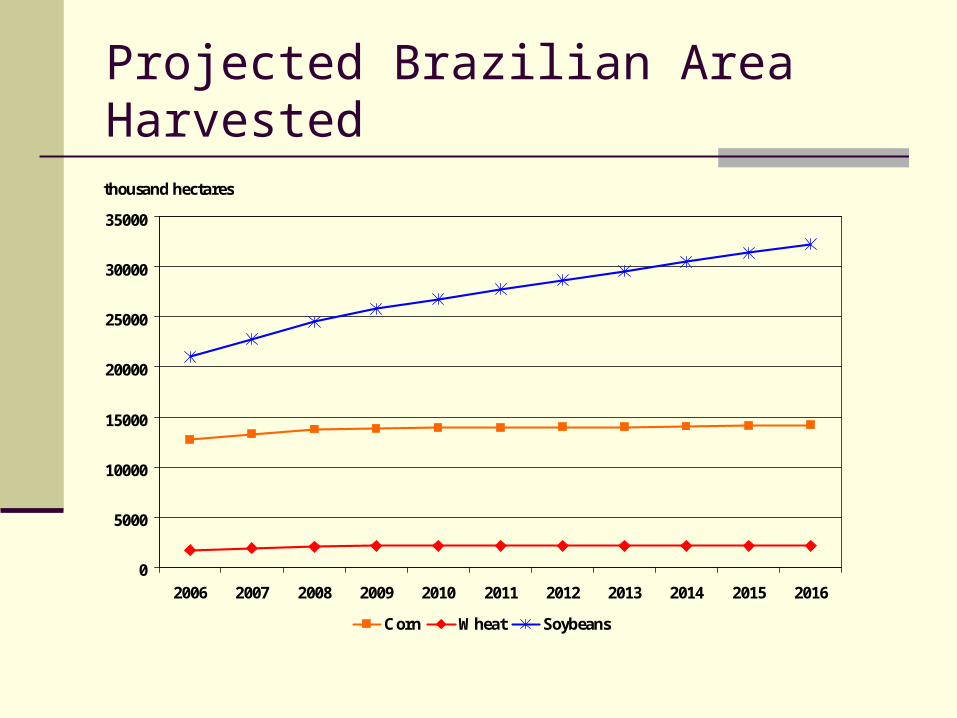
Projected Brazilian Area Harvested
0
5000
10000
15000
20000
25000
30000
35000
2006 2007 2008 2009 2010 2011 2012 2013 2014 2015 2016
thousand hectares
Corn Wheat Soybeans

Impact of Higher Crude Oil Price
Increased crude oil price by $10/barrel over the projection Margins on ethanol plants increase New incentive to invest in added capacity for ethanol
production Eventually, a new equilibrium reached where there is no
incentive to invest in or exit the ethanol industry Will demand for ethanol be enough?
E-10 market will saturate around 15 billion gallons Drop in ethanol price will eventually encourage increase in
demand for the flex-fuel cars

Projected U.S. Ethanol Production
0
5
10
15
20
25
2006 2007 2008 2009 2010 2011 2012 2013 2014 2015 2016
billion gallons
Scenario Baseline
Projected U.S. Dry Mill Margins
-0.40
-0.20
0.00
0.20
0.40
0.60
0.80
1.00
1.20
1.40
1.60
2006 2008 2010 2012 2014 2016
US$/bushel
Margin Over Operating Costs Margin Over Total Cost

Wholesale Gasoline and Ethanol Prices
1.00
1.25
1.50
1.75
2.00
2.25
2.50
2.75
3.00
2006 2008 2010 2012 2014 2016
US$/gallon
Unleaded Gasoline Ethanol

Projected U.S. Corn Planted Area
70
80
90
100
110
2006 2007 2008 2009 2010 2011 2012 2013 2014 2015 2016
million acres
Scenario Baseline

Projected Utilization of U.S. Corn
0
1000
2000
3000
4000
5000
6000
7000
8000
9000
2006 2007 2008 2009 2010 2011 2012 2013 2014 2015 2016
million bushels
Feed Fuel HFCS Seed Food, Other Exports
Projected U.S. Corn and Soybean Prices
2.00
3.00
4.00
5.00
6.00
7.00
8.00
2006 2007 2008 2009 2010 2011 2012 2013 2014 2015 2016
US$/bushel
Corn Soybeans

Projected U.S. Soybean Planted Area
55
60
65
70
75
80
2006 2007 2008 2009 2010 2011 2012 2013 2014 2015 2016
million acres
Scenario Baseline
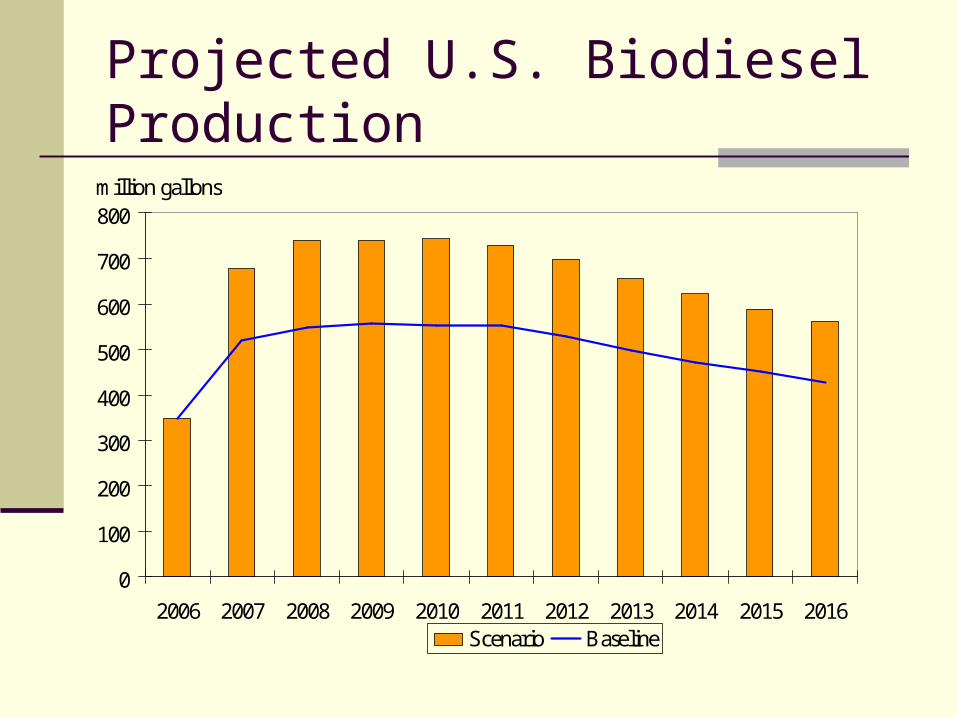
Projected U.S. Biodiesel Production
0
100
200
300
400
500
600
700
800
2006 2007 2008 2009 2010 2011 2012 2013 2014 2015 2016
million gallons
Scenario Baseline

Projected U.S. Meat Production
20
25
30
35
40
45
2006 2007 2008 2009 2010 2011 2012 2013 2014 2015 2016
billion pounds
Beef Pork Broiler

Projected U.S. Retail Meat Prices
0
1
2
3
4
5
2006 2007 2008 2009 2010 2011 2012 2013 2014 2015 2016
$ per pound
Beef Pork Broiler
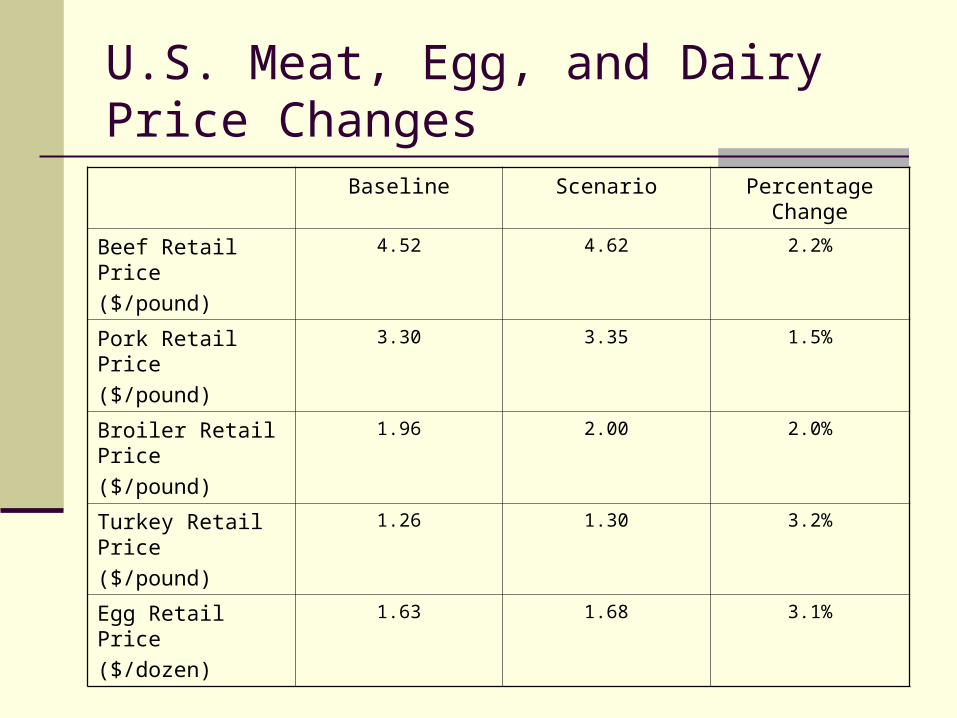
U.S. Meat, Egg, and Dairy Price Changes
Baseline Scenario Percentage Change
Beef Retail Price
($/pound)
4.52 4.62 2.2%
Pork Retail Price
($/pound)
3.30 3.35 1.5%
Broiler Retail Price
($/pound)
1.96 2.00 2.0%
Turkey Retail Price
($/pound)
1.26 1.30 3.2%
Egg Retail Price
($/dozen)
1.63 1.68 3.1%
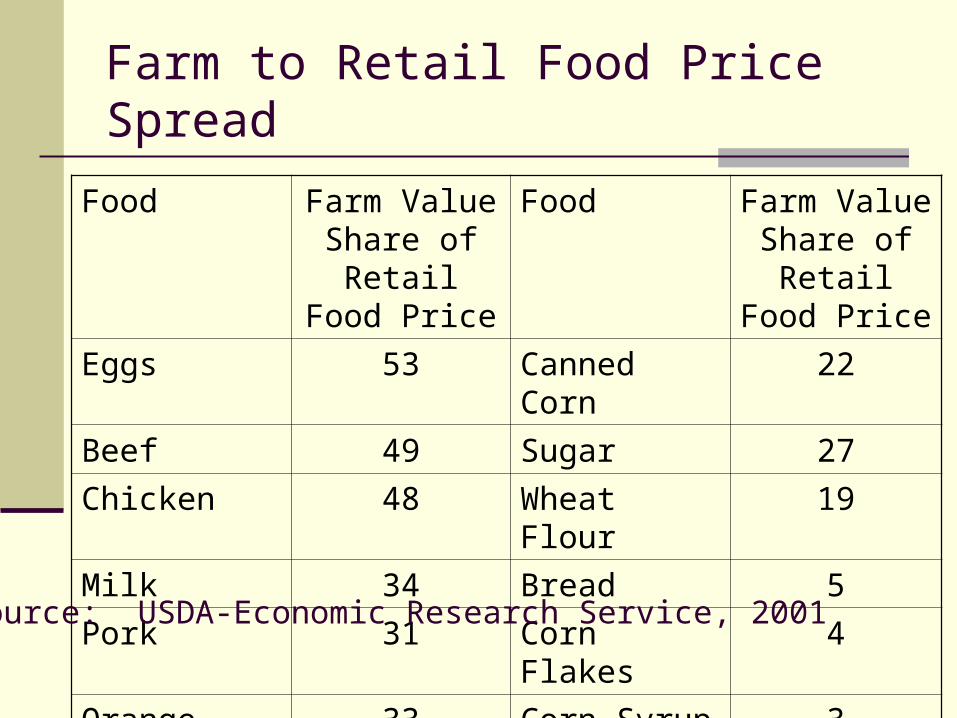
Farm to Retail Food Price Spread
Food Farm Value Share of Retail
Food Price
Food Farm Value Share of Retail
Food Price
Eggs 53 Canned Corn 22
Beef 49 Sugar 27
Chicken 48 Wheat Flour 19
Milk 34 Bread 5
Pork 31 Corn Flakes 4
Orange Juice 33 Corn Syrup 3
Source: USDA-Economic Research Service, 2001

Impact on Rest of the World
World grain and oilseed prices increase Result in higher feed and food prices Higher food prices Higher livestock production cost Countries in South America and Asia fill the gap

Impact of Short Crop Scenario
Drought in 2012 similar to 1988 Regional yields of corn, soybeans and wheat
changed from trend levels Yields were off by 25% for corn, 18% for
soybeans, and 11% for wheat in 1988 Ethanol mandate for 2012 assumed to be 14.7
billion gallons

Historical Corn Production Deviations
-35%
-30%
-25%
-20%
-15%
-10%
-5%
0%
5%
10%
15%
20%

Corn, Soybean and Ethanol Markets
Corn price increases by 44% above baseline levels Soybean price rises by 22% Corn exports and stock levels decline by more
than 60% Corn exports from South America, China, etc. fill
part of the gap from decline in U.S. corn exports Corn feed use declines by 16% (switch to other
feeds) Ethanol trade increases moderately

Livestock Market
Higher feed costs affect the livestock sector but to a lesser extent as shock is perceived as temporary Production declines
Broiler production declines the most (over 2.5%) Milk production declines the least (0.5%)
Retail prices increase Egg prices increase the most (about 5.5%) Prices of other products increase by a range between
2% and 4%

Thank You


![Visual Analytics of Cascaded Bottlenecks in Planar Flow ...hamann/PostGillmannWis...works is the identification and elimination of bottlenecks [18]. The analysis of bottlenecks in](https://img.pdfslide.us/doc/110x75/6066a715e1fcfc51770dd091/visual-analytics-of-cascaded-bottlenecks-in-planar-flow-hamannpostgillmannwis.jpg)