Embed Size (px)
Citation preview
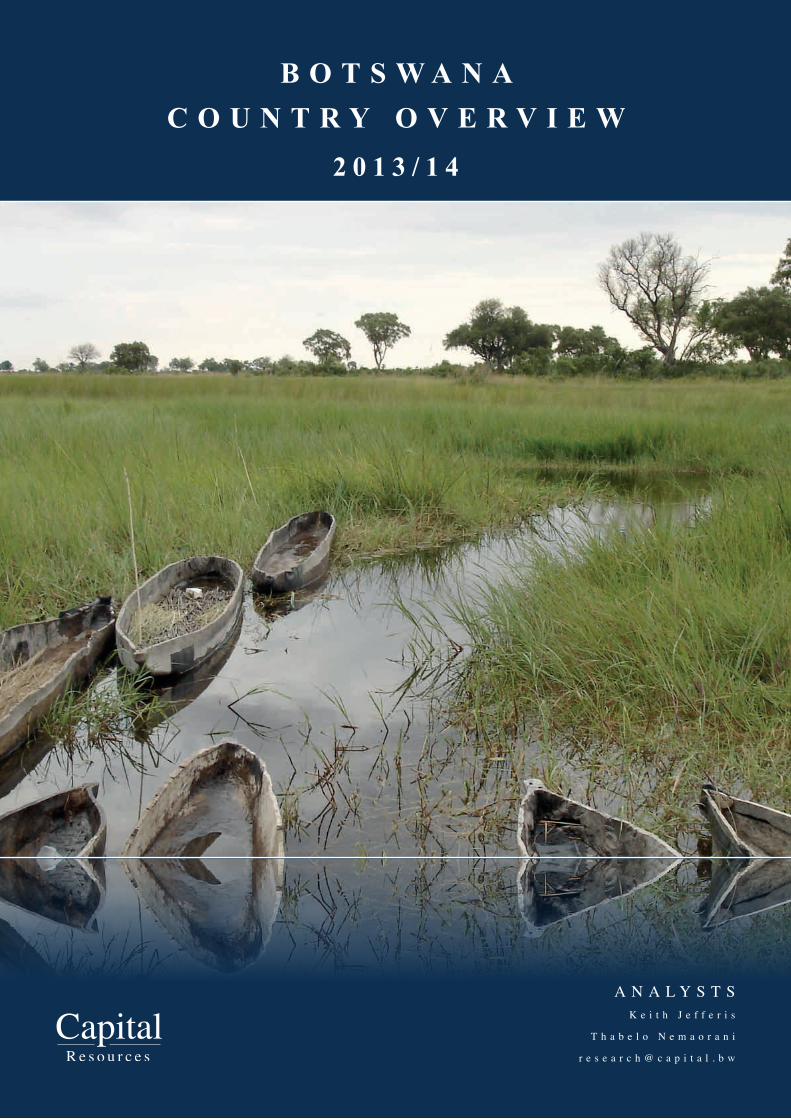
B O T S W A N AC O U N T R Y O V E R V I E W
2 0 1 3 / 1 4
A n A l y s T sK e i t h J e f f e r i s
T h a b e l o n e m a o r a n i
r e s e a r c h @ c a p i t a l . b w
1
BOTSWANA COUNTRY OVERVIEW
BO
TSW
AN
A C
OU
NTR
Y O
VER
VIE
W
The informaTion conTained on This page is subjecT To The disclaimer, warning and disclosure sTaTemenTs aT The end of This documenT.
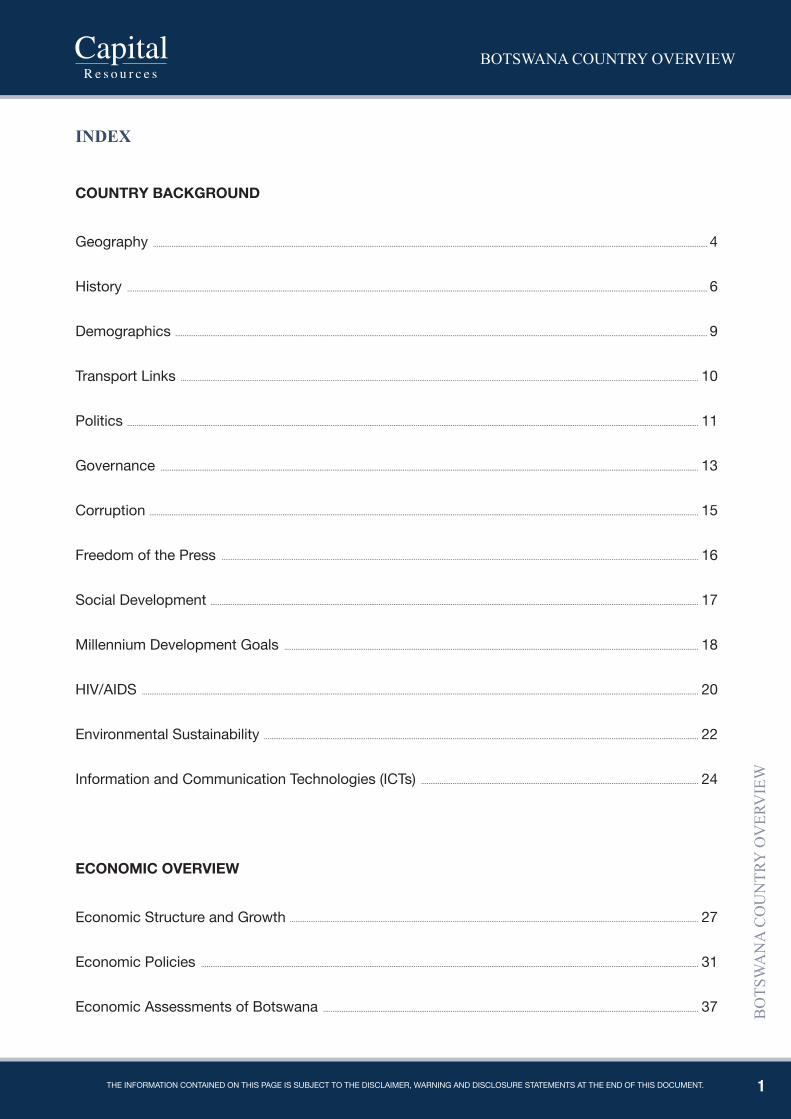
INdEx
COUNTRY BACKGROUND
Geography ............................................................................................................................................................................................................................................................................................................ 4
History .......................................................................................................................................................................................................................................................................................................................... 6
Demographics ................................................................................................................................................................................................................................................................................................ 9
Transport Links ........................................................................................................................................................................................................................................................................................ 10
Politics ..................................................................................................................................................................................................................................................................................................................... 11
Governance ................................................................................................................................................................................................................................................................................................... 13
Corruption ......................................................................................................................................................................................................................................................................................................... 15
Freedom of the Press .................................................................................................................................................................................................................................................................. 16
Social Development ........................................................................................................................................................................................................................................................................ 17
Millennium Development Goals ................................................................................................................................................................................................................................ 18
HIV/AIDS ............................................................................................................................................................................................................................................................................................................. 20
Environmental Sustainability ........................................................................................................................................................................................................................................... 22
Information and Communication Technologies (ICTs) ...................................................................................................................................................... 24
ECONOMIC OVERVIEW
Economic Structure and Growth ............................................................................................................................................................................................................................. 27
Economic Policies ............................................................................................................................................................................................................................................................................. 31
Economic Assessments of Botswana ........................................................................................................................................................................................................... 37
2
BOTSWANA COUNTRY OVERVIEW
BO
TSW
AN
A C
OU
NTR
Y O
VER
VIE
W
The informaTion conTained on This page is subjecT To The disclaimer, warning and disclosure sTaTemenTs aT The end of This documenT.
COUNTRY BACKGROUNd
3
BOTSWANA COUNTRY OVERVIEW
BO
TSW
AN
A C
OU
NTR
Y O
VER
VIE
W
The informaTion conTained on This page is subjecT To The disclaimer, warning and disclosure sTaTemenTs aT The end of This documenT.
4
BOTSWANA COUNTRY OVERVIEW
BO
TSW
AN
A C
OU
NTR
Y O
VER
VIE
W
The informaTion conTained on This page is subjecT To The disclaimer, warning and disclosure sTaTemenTs aT The end of This documenT.
GEOGRAphY
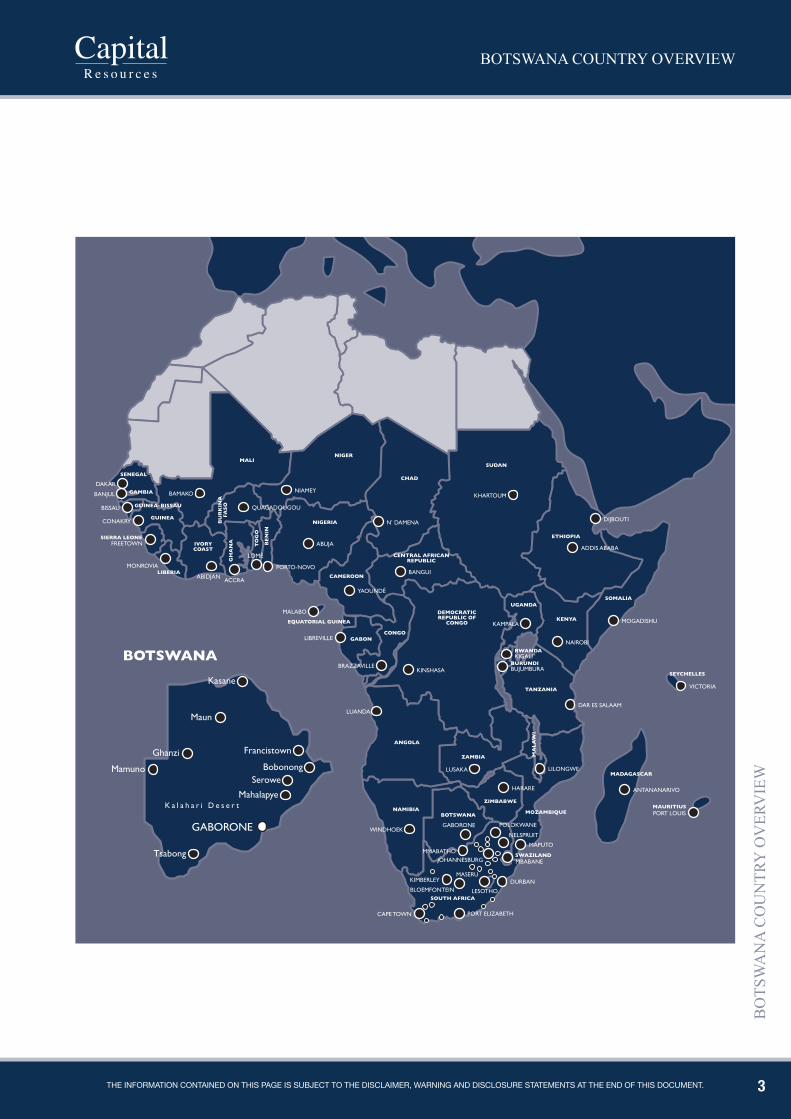
Botswana is a landlocked country in Southern Africa. The country has a maximum length from north to south of about 1000 km and a maximum width from east to west of about the same. It is bordered on the southeast and south by South Africa, on the west and northwest by Namibia, on the north by Zambia, and on the northeast and east by Zimbabwe. With a total area of around 580,000 square kilometres, it is larger than France and about the same size as Texas.
Botswana’s terrain is mostly flat desert, savannah and grassland. As most of the country is sparsely populated by humans, it is a haven for wildlife and, for example, hosts the largest population of elephant in the world.
In the northwest of Botswana lies the Okavango River which empties into the flat Kalahari Desert to form one of the largest inland deltas in the world. This is the only area of Botswana that holds significant amounts of perma-nent water. There are no permanent rivers elsewhere inside Botswana, although part of the northern border of Botswana is formed by the Chobe River and, for a short distance, the Zambezi. Apart from a moderately fertile strip along the eastern side of the country, the Kalahari (Kgalagadi) Desert blankets almost the entire remaining portion of Botswana.
ClIMATEBotswana’s climate is semi-arid. Rainfall is low, unreliable, unevenly distributed and highly variable from year to year. Mean annual rainfall varies from maximum of 650 mm in Kasane to a minimum of less than 250 mm is the Kgalagadi (Tsabong). Drought is a recurrent phenomenon, with one of the worst droughts taking place between the years 1981 and 1987. Most rivers are seasonal and water is a scarce resource.
Botswana experiences two seasons, summer and winter. The summer season lasts from October to March and is characterized by high temperatures, generally over 30°C during the day, rising to the low 40°Cs. Almost all the rainfall for the year happens during this period. The winter season lasts from April to September; nights are cool with occasional frosts, while daytime temperatures are in the mid 20°Cs. There is almost no rainfall during this period.
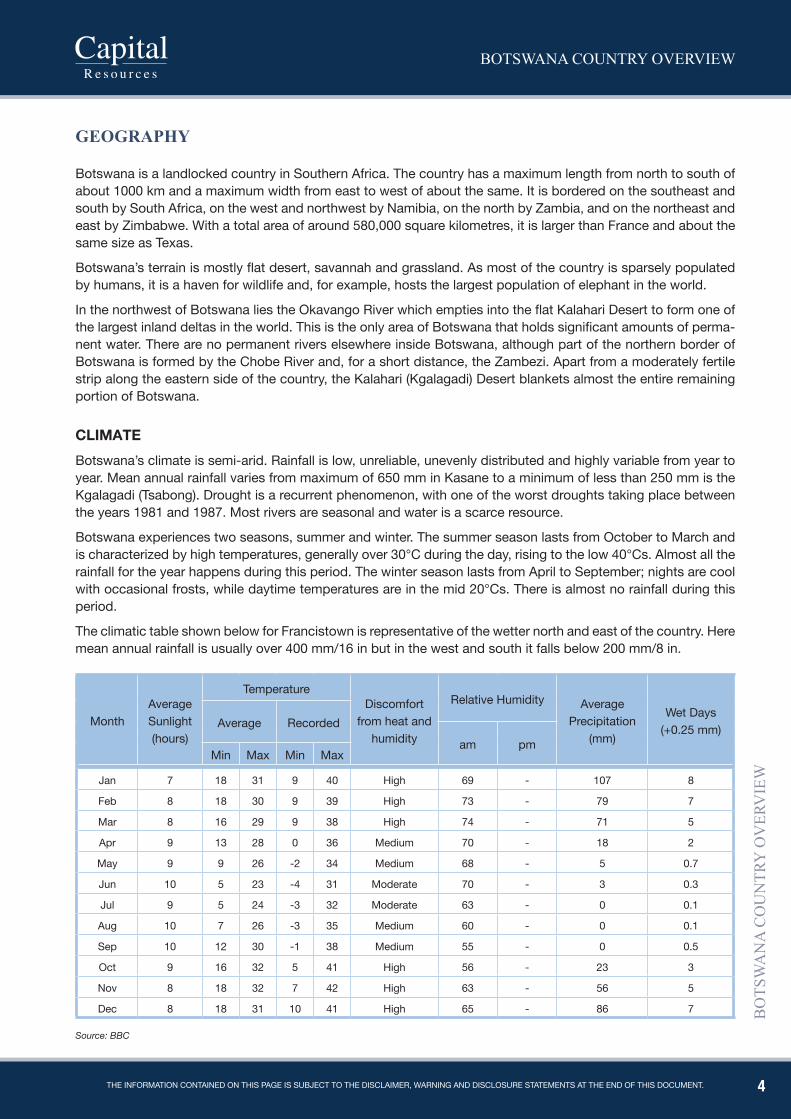
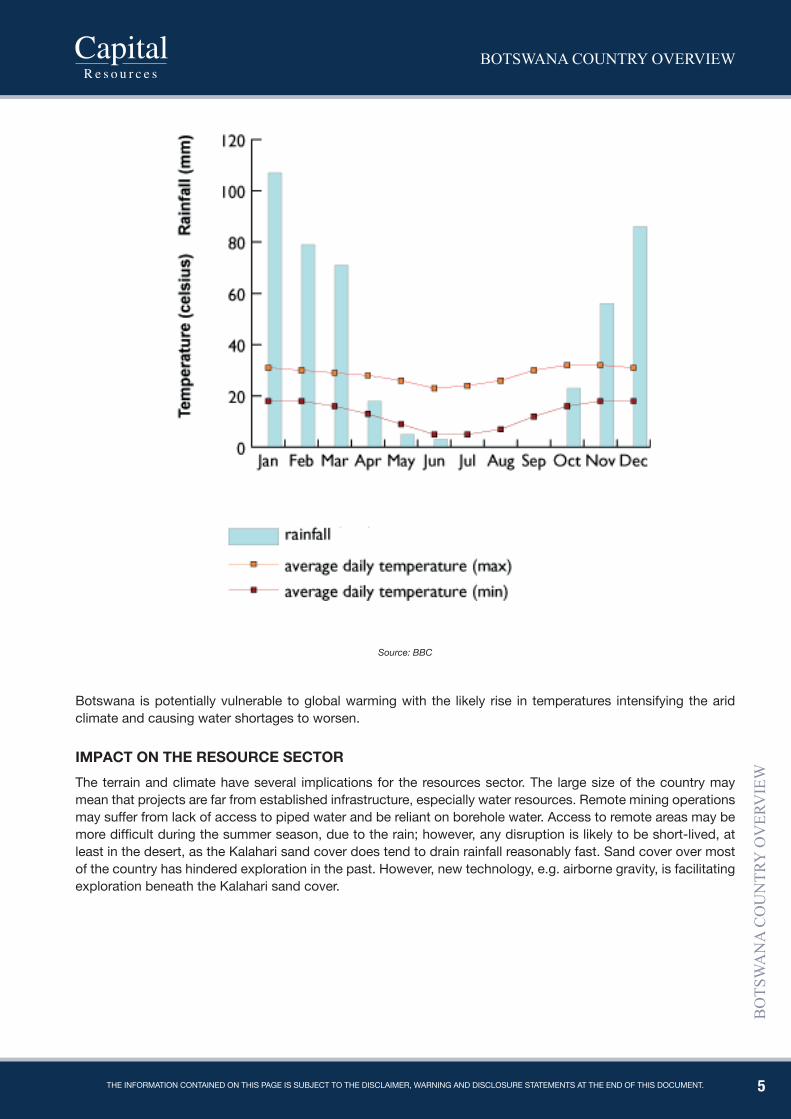
The climatic table shown below for Francistown is representative of the wetter north and east of the country. Here mean annual rainfall is usually over 400 mm/16 in but in the west and south it falls below 200 mm/8 in.
MonthAverage Sunlight (hours)
TemperatureDiscomfort
from heat and humidity
Relative Humidity Average Precipitation
(mm)
Wet Days (+0.25 mm)Average Recorded
am pmMin Max Min Max
Jan 7 18 31 9 40 High 69 - 107 8
Feb 8 18 30 9 39 High 73 - 79 7
Mar 8 16 29 9 38 High 74 - 71 5
Apr 9 13 28 0 36 Medium 70 - 18 2
May 9 9 26 -2 34 Medium 68 - 5 0.7
Jun 10 5 23 -4 31 Moderate 70 - 3 0.3
Jul 9 5 24 -3 32 Moderate 63 - 0 0.1
Aug 10 7 26 -3 35 Medium 60 - 0 0.1
Sep 10 12 30 -1 38 Medium 55 - 0 0.5
Oct 9 16 32 5 41 High 56 - 23 3
Nov 8 18 32 7 42 High 63 - 56 5
Dec 8 18 31 10 41 High 65 - 86 7
Source: BBC
5
BOTSWANA COUNTRY OVERVIEW
BO
TSW
AN
A C
OU
NTR
Y O
VER
VIE
W
The informaTion conTained on This page is subjecT To The disclaimer, warning and disclosure sTaTemenTs aT The end of This documenT.
Source: BBC
Botswana is potentially vulnerable to global warming with the likely rise in temperatures intensifying the arid climate and causing water shortages to worsen.
IMpACT ON ThE REsOURCE sECTORThe terrain and climate have several implications for the resources sector. The large size of the country may mean that projects are far from established infrastructure, especially water resources. Remote mining operations may suffer from lack of access to piped water and be reliant on borehole water. Access to remote areas may be more difficult during the summer season, due to the rain; however, any disruption is likely to be short-lived, at least in the desert, as the Kalahari sand cover does tend to drain rainfall reasonably fast. Sand cover over most of the country has hindered exploration in the past. However, new technology, e.g. airborne gravity, is facilitating exploration beneath the Kalahari sand cover.
6
BOTSWANA COUNTRY OVERVIEW
BO
TSW
AN
A C
OU
NTR
Y O
VER
VIE
W
The informaTion conTained on This page is subjecT To The disclaimer, warning and disclosure sTaTemenTs aT The end of This documenT.
hISTORY
The nation was originally inhabited by the San people (also known as the Bushmen), but they constitute only a small portion of the population today. The BaTswana supplanted the San, who remained as subjects.
Beginning in the 1820s, the region was disrupted by the expansion of the Zulu and their offshoot, the Ndebele. However, Khama II, chief of the Ngwato (the largest Tswana nation), curbed the depredations of the Ndebele and established a fairly unified state.
A new threat arose in the late 19th century with the incursion of Boers (Afrikaners) from neighbouring Transvaal. After gold was discovered in the region in 1867, the Transvaal government sought to annex parts of Botswana. Although the British forbade annexation, the Boers continued to encroach on native lands during the 1870s and 1880s.
German colonial expansion in South West Africa (Namibia) caused the British to re-examine their policies, and, urged on by Khama III, they established (1884–85) a protectorate called Bechuanaland. The southern part of the area was incorporated into Cape Colony in 1895.
Until 1961, Bechuanaland was administered by a resident commissioner at Mafikeng, in South Africa, who was responsible to the British High Commissioner for South Africa. Relatively little development took place under during the Protectorate period, and it was intended that Bechuanaland would eventually be incorporated into the Union of South Africa. The rise of the National party in South Africa in 1948 and its pursuit of apartheid turned British opinion against the incorporation of Bechuanaland into South Africa, and South Africa’s attempts at annexation were countered by British insistence that Bechuanaland’s inhabitants first be consulted. Eventually it was acknowledged that Bechuanaland would become independent, and there was some belated investment in social and economic infrastructure from the mid-1950s onwards. Britain granted Bechuanaland internal self-government in 1965 and full independence as Botswana on Sept. 30, 1966.
In the period after independence, the country generally maintained cordial relationships with its white-ruled neighbours, although it refused to establish diplomatic relations with them. Botswana refused to allow the libera-tion movements of Zimbabwe and South Africa to use the country as base for guerrilla operations, although there were instances of armed attacks being launched from Botswana. The country suffered from reprisal raids by both the Rhodesian and South African armed forces prior to political settlements being reached in both countries.
The country has remained politically stable since independence, with regular multi-party democratic elections, which have all been won by the Botswana Democratic Party (BDP). Sir Seretse Khama, who led the country to independence, died in 1980 and was succeeded by his Vice President, Quett (later Sir Ketumile) Masire. Presi-dent Masire resigned in 1998 and was succeeded by the then Vice President, Festus Mogae.
Under a constitutional amendment passed in 1997, the term of the President is limited to a maximum of ten years. The same constitutional amendment provided that the Vice President shall automatically assume office when the President steps down. Lt. General Ian Khama, who was the Vice President from 1998 to 2008, took over presidency from Festus Mogae when he stepped down at the end of his ten year term on 1 April 2008.
7
BOTSWANA COUNTRY OVERVIEW
BO
TSW
AN
A C
OU
NTR
Y O
VER
VIE
W
The informaTion conTained on This page is subjecT To The disclaimer, warning and disclosure sTaTemenTs aT The end of This documenT.
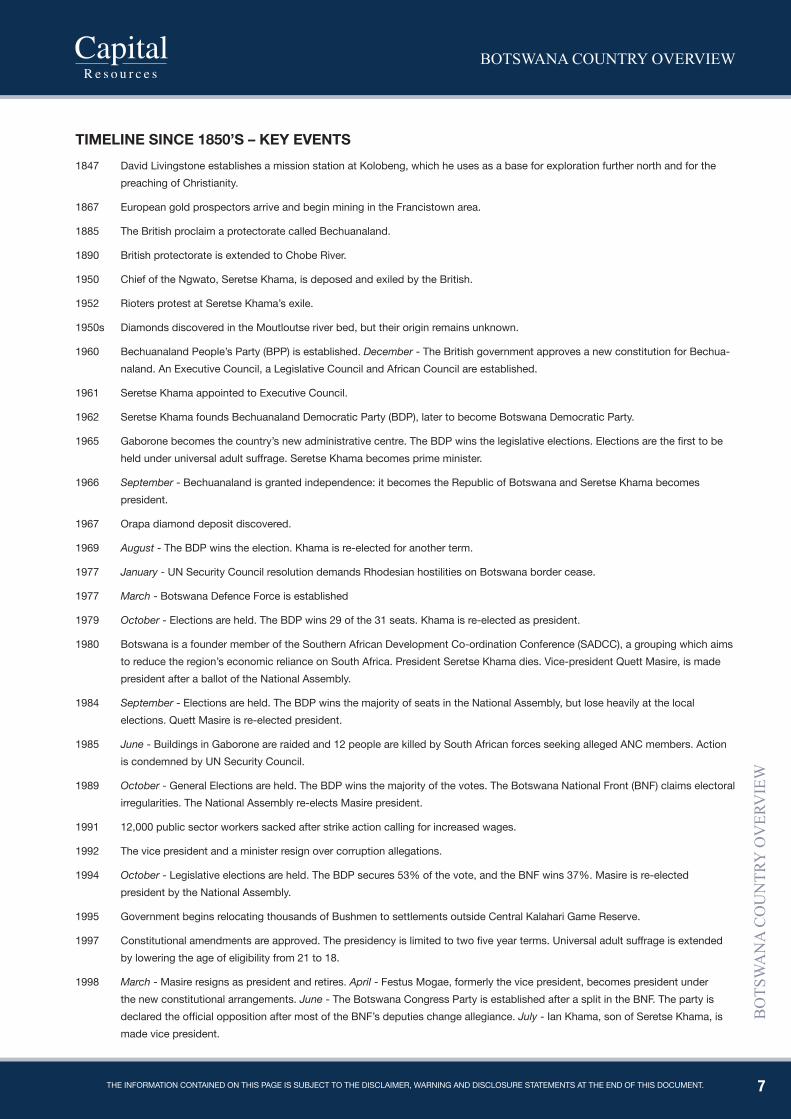
TIMElINE sINCE 1850’s – KEY EVENTs1847 David Livingstone establishes a mission station at Kolobeng, which he uses as a base for exploration further north and for the
preaching of Christianity.
1867 European gold prospectors arrive and begin mining in the Francistown area.
1885 The British proclaim a protectorate called Bechuanaland.
1890 British protectorate is extended to Chobe River.
1950 Chief of the Ngwato, Seretse Khama, is deposed and exiled by the British.
1952 Rioters protest at Seretse Khama’s exile.
1950s Diamonds discovered in the Moutloutse river bed, but their origin remains unknown.
1960 Bechuanaland People’s Party (BPP) is established. December - The British government approves a new constitution for Bechua-naland. An Executive Council, a Legislative Council and African Council are established.
1961 Seretse Khama appointed to Executive Council.
1962 Seretse Khama founds Bechuanaland Democratic Party (BDP), later to become Botswana Democratic Party.
1965 Gaborone becomes the country’s new administrative centre. The BDP wins the legislative elections. Elections are the first to be held under universal adult suffrage. Seretse Khama becomes prime minister.
1966 September - Bechuanaland is granted independence: it becomes the Republic of Botswana and Seretse Khama becomes president.
1967 Orapa diamond deposit discovered.
1969 August - The BDP wins the election. Khama is re-elected for another term.
1977 January - UN Security Council resolution demands Rhodesian hostilities on Botswana border cease.
1977 March - Botswana Defence Force is established
1979 October - Elections are held. The BDP wins 29 of the 31 seats. Khama is re-elected as president.
1980 Botswana is a founder member of the Southern African Development Co-ordination Conference (SADCC), a grouping which aims to reduce the region’s economic reliance on South Africa. President Seretse Khama dies. Vice-president Quett Masire, is made president after a ballot of the National Assembly.
1984 September - Elections are held. The BDP wins the majority of seats in the National Assembly, but lose heavily at the local elections. Quett Masire is re-elected president.
1985 June - Buildings in Gaborone are raided and 12 people are killed by South African forces seeking alleged ANC members. Action is condemned by UN Security Council.
1989 October - General Elections are held. The BDP wins the majority of the votes. The Botswana National Front (BNF) claims electoral irregularities. The National Assembly re-elects Masire president.
1991 12,000 public sector workers sacked after strike action calling for increased wages.
1992 The vice president and a minister resign over corruption allegations.
1994 October - Legislative elections are held. The BDP secures 53% of the vote, and the BNF wins 37%. Masire is re-elected president by the National Assembly.
1995 Government begins relocating thousands of Bushmen to settlements outside Central Kalahari Game Reserve.
1997 Constitutional amendments are approved. The presidency is limited to two five year terms. Universal adult suffrage is extended by lowering the age of eligibility from 21 to 18.
1998 March - Masire resigns as president and retires. April - Festus Mogae, formerly the vice president, becomes president under the new constitutional arrangements. June - The Botswana Congress Party is established after a split in the BNF. The party is declared the official opposition after most of the BNF’s deputies change allegiance. July - Ian Khama, son of Seretse Khama, is made vice president.
8
BOTSWANA COUNTRY OVERVIEW
BO
TSW
AN
A C
OU
NTR
Y O
VER
VIE
W
The informaTion conTained on This page is subjecT To The disclaimer, warning and disclosure sTaTemenTs aT The end of This documenT.
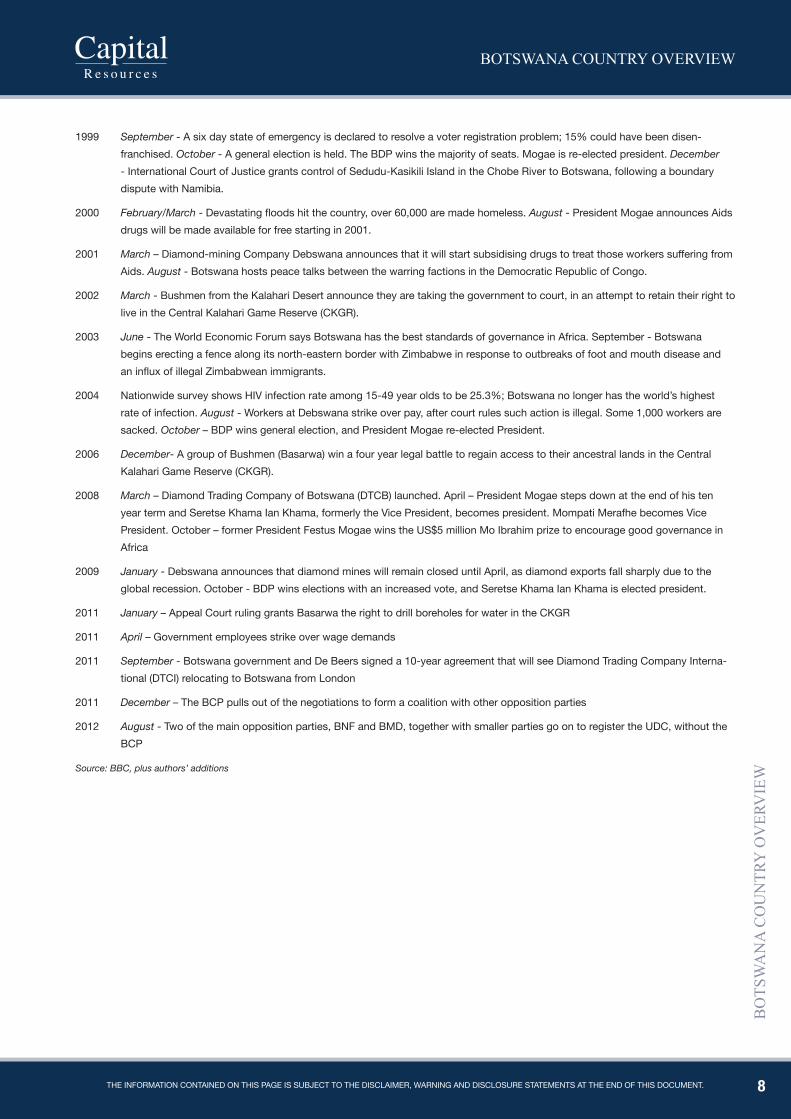
1999 September - A six day state of emergency is declared to resolve a voter registration problem; 15% could have been disen-franchised. October - A general election is held. The BDP wins the majority of seats. Mogae is re-elected president. December - International Court of Justice grants control of Sedudu-Kasikili Island in the Chobe River to Botswana, following a boundary dispute with Namibia.
2000 February/March - Devastating floods hit the country, over 60,000 are made homeless. August - President Mogae announces Aids drugs will be made available for free starting in 2001.
2001 March – Diamond-mining Company Debswana announces that it will start subsidising drugs to treat those workers suffering from Aids. August - Botswana hosts peace talks between the warring factions in the Democratic Republic of Congo.
2002 March - Bushmen from the Kalahari Desert announce they are taking the government to court, in an attempt to retain their right to live in the Central Kalahari Game Reserve (CKGR).
2003 June - The World Economic Forum says Botswana has the best standards of governance in Africa. September - Botswana begins erecting a fence along its north-eastern border with Zimbabwe in response to outbreaks of foot and mouth disease and an influx of illegal Zimbabwean immigrants.
2004 Nationwide survey shows HIV infection rate among 15-49 year olds to be 25.3%; Botswana no longer has the world’s highest rate of infection. August - Workers at Debswana strike over pay, after court rules such action is illegal. Some 1,000 workers are sacked. October – BDP wins general election, and President Mogae re-elected President.
2006 December- A group of Bushmen (Basarwa) win a four year legal battle to regain access to their ancestral lands in the Central Kalahari Game Reserve (CKGR).
2008 March – Diamond Trading Company of Botswana (DTCB) launched. April – President Mogae steps down at the end of his ten year term and Seretse Khama Ian Khama, formerly the Vice President, becomes president. Mompati Merafhe becomes Vice President. October – former President Festus Mogae wins the US$5 million Mo Ibrahim prize to encourage good governance in Africa
2009 January - Debswana announces that diamond mines will remain closed until April, as diamond exports fall sharply due to the global recession. October - BDP wins elections with an increased vote, and Seretse Khama Ian Khama is elected president.
2011 January – Appeal Court ruling grants Basarwa the right to drill boreholes for water in the CKGR
2011 April – Government employees strike over wage demands
2011 September - Botswana government and De Beers signed a 10-year agreement that will see Diamond Trading Company Interna-tional (DTCI) relocating to Botswana from London
2011 December – The BCP pulls out of the negotiations to form a coalition with other opposition parties
2012 August - Two of the main opposition parties, BNF and BMD, together with smaller parties go on to register the UDC, without the BCP
Source: BBC, plus authors’ additions
9
BOTSWANA COUNTRY OVERVIEW
BO
TSW
AN
A C
OU
NTR
Y O
VER
VIE
W
The informaTion conTained on This page is subjecT To The disclaimer, warning and disclosure sTaTemenTs aT The end of This documenT.
dEmOGRAphICS
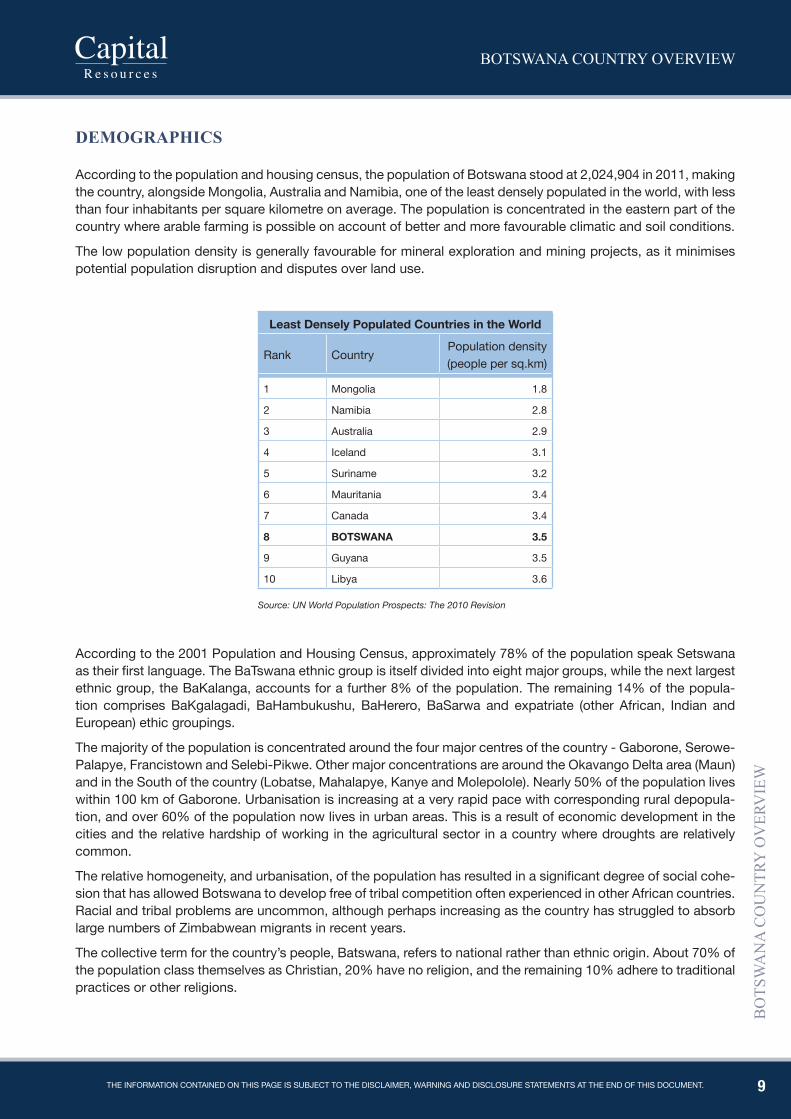
According to the population and housing census, the population of Botswana stood at 2,024,904 in 2011, making the country, alongside Mongolia, Australia and Namibia, one of the least densely populated in the world, with less than four inhabitants per square kilometre on average. The population is concentrated in the eastern part of the country where arable farming is possible on account of better and more favourable climatic and soil conditions.
The low population density is generally favourable for mineral exploration and mining projects, as it minimises potential population disruption and disputes over land use.
least Densely populated Countries in the World
Rank CountryPopulation density (people per sq.km)
1 Mongolia 1.8
2 Namibia 2.8
3 Australia 2.9
4 Iceland 3.1
5 Suriname 3.2
6 Mauritania 3.4
7 Canada 3.4
8 BOTsWANA 3.5
9 Guyana 3.5
10 Libya 3.6
Source: UN World Population Prospects: The 2010 Revision
According to the 2001 Population and Housing Census, approximately 78% of the population speak Setswana as their first language. The BaTswana ethnic group is itself divided into eight major groups, while the next largest ethnic group, the BaKalanga, accounts for a further 8% of the population. The remaining 14% of the popula-tion comprises BaKgalagadi, BaHambukushu, BaHerero, BaSarwa and expatriate (other African, Indian and European) ethic groupings.
The majority of the population is concentrated around the four major centres of the country - Gaborone, Serowe-Palapye, Francistown and Selebi-Pikwe. Other major concentrations are around the Okavango Delta area (Maun) and in the South of the country (Lobatse, Mahalapye, Kanye and Molepolole). Nearly 50% of the population lives within 100 km of Gaborone. Urbanisation is increasing at a very rapid pace with corresponding rural depopula-tion, and over 60% of the population now lives in urban areas. This is a result of economic development in the cities and the relative hardship of working in the agricultural sector in a country where droughts are relatively common.
The relative homogeneity, and urbanisation, of the population has resulted in a significant degree of social cohe-sion that has allowed Botswana to develop free of tribal competition often experienced in other African countries. Racial and tribal problems are uncommon, although perhaps increasing as the country has struggled to absorb large numbers of Zimbabwean migrants in recent years.
The collective term for the country’s people, Batswana, refers to national rather than ethnic origin. About 70% of the population class themselves as Christian, 20% have no religion, and the remaining 10% adhere to traditional practices or other religions.
10
BOTSWANA COUNTRY OVERVIEW
BO
TSW
AN
A C
OU
NTR
Y O
VER
VIE
W
The informaTion conTained on This page is subjecT To The disclaimer, warning and disclosure sTaTemenTs aT The end of This documenT.
TRANSpORT LINKS
Botswana is a large, sparsely populated landlocked country and needs good transportation networks internally and with surrounding countries. Transport costs are an issue for lower value, higher volume exports, e.g. coal, as Botswana is land locked and distant from major ports. Within the country Botswana has good road system connecting the major urban areas (Gaborone, Francistown, Lobatse, Maun and Kasane, and the Trans Kgalagadi Highway connecting Gaborone and Lobatse with Kanye, Jwaneng and Ghanzi). The main cross-border road linkages are from Selebi-Phikwe, Gaborone and Lobatse to South Africa in the south-east; the Trans Kgalagadi Highway to Namibia in the west; from Francistown to Zimbabwe in the north-east; and from Kasane to Zambia and countries to the north. The major roads are generally in good condition and are regularly maintained and upgraded. Traffic volumes are not considered to be sufficient to justify tolling.
Several transport developments are in progress or under consideration. Amongst the most important of these are the Kazungula Bridge across the Zambezi, linking Botswana with Zambia and replacing the existing ferry; upgrading of the roads linking Francistown and Gaborone with Zimbabwe and South Africa respectively; and a trans-Kgalagadi railway line to Namibia. The latter would provide Botswana with a rail link to ports on the west coast, and would be primarily oriented towards coal exports. Other regional rail links under consideration include an eastward link to South Africa through the Mmamabula coalfieds, a link to Mozambique via Zimbabwe, and a northern link to Zambia via Kazangula.
Botswana’s international air transport links are limited. There are direct flights from Gaborone to Johannesburg, Harare, Lusaka, Windhoek and Nairobi, and from Francistown, Maun and Kasane to Johannesburg, but no direct intercontinental flights. New international airport terminals have been constructed in Gaborone and Francistown, and airport facilities are also being upgraded in Kasane and Maun.
11
BOTSWANA COUNTRY OVERVIEW
BO
TSW
AN
A C
OU
NTR
Y O
VER
VIE
W
The informaTion conTained on This page is subjecT To The disclaimer, warning and disclosure sTaTemenTs aT The end of This documenT.
pOLITICS
Botswana has a flourishing multiparty constitutional democracy, which has operated continuously since inde-pendence in 1966. Elections for a unicameral National Assembly occur every five years. Each of the elections since independence has been freely and fairly contested and has been held on schedule. The National Assembly has 57 elected members (increased from 40 members prior to the 2004 elections), and additional four “Specially Elected” members (effectively appointed by the largest party). The President is the leader of the party that wins a majority in the National Assembly. The Cabinet is selected by the President from the members of the National As-sembly. An Independent Electoral Commission (IEC) was established in 1996, and this has helped to consolidate Botswana’s reputation for fairness in voting.
The upper house of Parliament, Ntlo ya Dikgosi (originally called House of Chiefs), acts as a purely advisory body and has no legislative power. Its role is mainly to provide advice on tribal or customary law issues, and parliament is not obliged to implement the advice they give. Recently, the role and structure of this institution has been reviewed, and major recommendations adopted have been the name change and the numerical expansion of the house. Its membership has been expanded to allow a wider demographic and social representation, and in particular to accommodate representatives of smaller tribal groupings that have frequently complained of marginalisation.
The constitution may be amended in minor ways by a simple majority vote in Parliament. More substantial amendments require a two-thirds majority, and major revisions have to be submitted to a referendum. Important constitutional changes in recent years have included limiting the term of the President to ten years, reducing the voting age from 21 to 18 years, and specifying that should the position of President become vacant, other than at the time of a general election, the Vice President shall automatically become President.
The ruling Botswana Democratic Party has won all elections since independence, and although its share of the popular vote has always been above 50 percent, this has been in long-term decline as the opposition parties have been increasing in influence and importance. In the 2009 election, however, the BDP’s share of the vote increased for the first time in many years, reflecting the popularity of President Ian Khama. Fragmentation of the opposition has hindered their ability to secure parliamentary seats in a Westminster-style “first past the post” system. In the 2009 elections, the BDP won approximately 53 percent of the popular vote, but secured nearly 80 percent of the 57 elected seats in the National Assembly. The opposition parties tend to be stronger in urban areas, and have benefited from long-term demographic changes as urbanisation proceeds. Despite its election victory in 2009, the BDP has experienced its own internal divisions, and in early 2010 a faction of MPs left the BDP and established a new political party, Botswana Movement for Democracy.
Since independence, the government has pursued policies generally regarded as sound and fiscally conserva-tive. The state provides successfully for the basic health and education needs of almost all its people, despite adverse climatic conditions and vast distances.
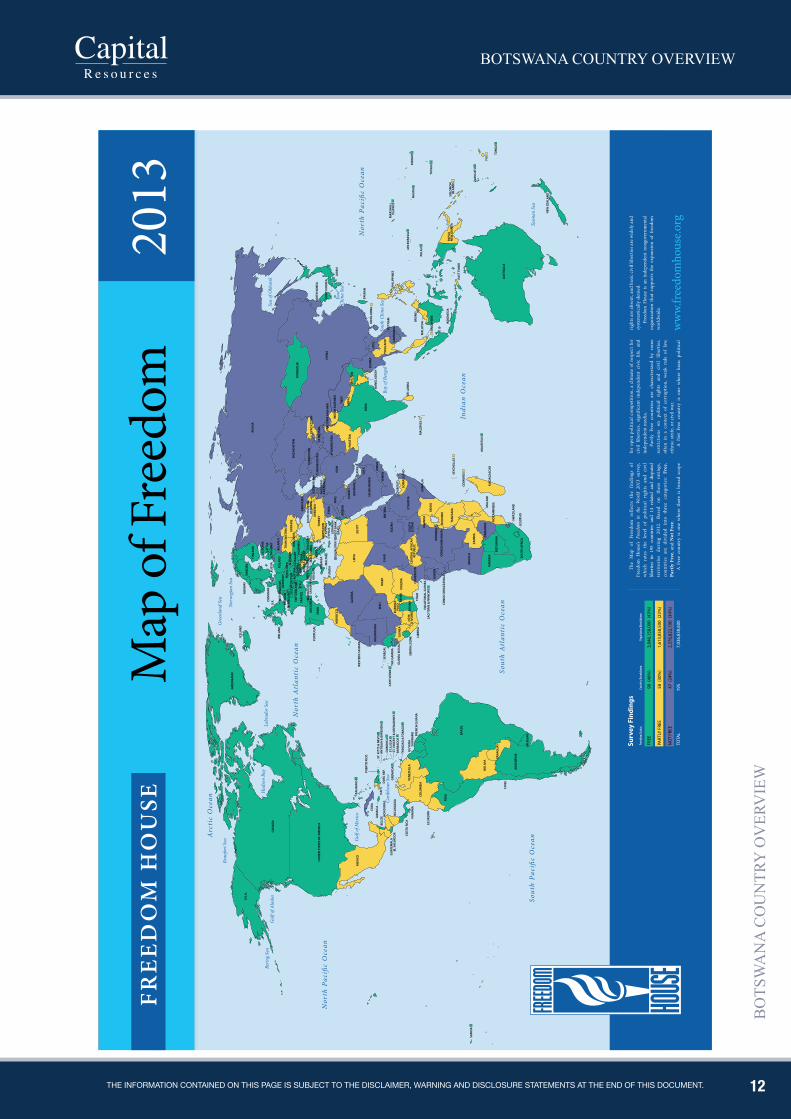
Freedom House, a US-based NGO, publishes an annual comprehensive assessment of the state of political rights and civil liberties in 195 countries and territories. Of these countries it highlights 90 as being “Free” – one of which is Botswana – 58 as “Partly Free” and 47 as “Not Free”. Botswana is one of only 11 “free” countries among the 48 states of sub-Saharan Africa, with high scores for both political and civil rights.
The Economist Intelligence Unit (EIU) publishes an Index of Democracy, most recently in 2012. This covered 167 countries and divided them into “full democracies”, “flawed democracies”, “hybrid regimes” and “authori-tarian regimes” according to five criteria: electoral process and pluralism; functioning of government; political participation; political culture; and civil liberties. Botswana’s score improved from 7.3 in 2010 to 7.85 in 2012. Consequently, its ranking also improved from 35 in 2010 to 30 in 2012, now behind Mauritius and Seychelles. Botswana falls in the “flawed democracy” grouping; the ranking was dragged down by relatively low scores on political participation and culture, but the country scored well in terms of the electoral process and civil liberties.
12
BOTSWANA COUNTRY OVERVIEW
BO
TSW
AN
A C
OU
NTR
Y O
VER
VIE
W
The informaTion conTained on This page is subjecT To The disclaimer, warning and disclosure sTaTemenTs aT The end of This documenT.
Nor
th P
aci�
c O
cean
Nor
th P
aci�
c O
cean
Sout
h Pa
ci�c
Oce
an
Nor
th A
tlan
tic
Oce
an
Sout
h A
tlan
tic
Oce
an
Gul
f of M
exico
Gul
f of A
lask
aBe
ring S
ea
Beau
fort
Sea
Arc
tic
Oce
an
Hud
son
Bay
Labr
ador
Sea
Carib
bean
Sea
Indi
an O
cean
Sout
h Ch
ina
SeaEa
stCh
ina
Sea
Sea
of O
khot
sk
Tasm
an S
ea
Bay
of B
enga
l
Nor
weg
ian
Sea
Gre
enla
nd S
ea
BAH
AM
AS
UN
ITED
STA
TES
OF
AM
ERIC
A
CAN
AD
A
U.S
.A.
GRE
ENLA
ND
ST. K
ITTS
& N
EVIS
AN
TIG
UA
& B
ARB
UD
A
DO
MIN
ICA
ST. L
UCI
AST
. VIN
CEN
T &
GRE
NA
DIN
ESBA
RBA
DO
S
TRIN
IDA
D &
TO
BAG
O
GU
YAN
ASU
RIN
AM
EFR
ENCH
GU
IAN
A
GRE
NA
DA
DO
M. R
EP.
HA
ITI
CUBA
JAM
AIC
ABE
LIZE
HO
ND
URA
S
NIC
ARA
GU
A
COST
A R
ICA
PAN
AM
A
EL S
ALV
AD
OR
GU
ATEM
ALA
MEX
ICO
SAM
OA
ECU
AD
OR
PERU
VEN
EZU
ELA
COLO
MBI
A
BRA
ZIL
BOLI
VIA
CAPE
VER
DE
GU
INEA
BIS
SAU
THE
GA
MBI
A
SEN
EGA
L
MAU
RITA
NIA
GU
INEA
SIER
RA L
EON
E LIBE
RIA
NIG
ERIA
NIG
ERCH
AD
SUD
AN
ERIT
REA
DJI
BOU
TIYEM
EN
SAU
DI A
RABI
A
OM
AN
SOM
ALI
LAN
D
ETH
IOPI
A
UG
AN
DA
KEN
YA
SOM
ALI
A
COM
ORO
S
MA
LAW
IZI
MBA
BWE
AN
GO
LA
NA
MIB
IA
BOTS
WA
NA
MO
ZAM
BIQ
UE
SWA
ZILA
ND
MA
DAG
ASC
AR
MAU
RITI
US
SEYC
HEL
LES
MA
LDIV
ES
SRI L
AN
KA
BAN
GLA
DES
H
IND
IA
QAT
AR
BAH
RAIN
EGYP
TLI
BYA
ALG
ERIA
MO
ROCC
O
WES
TERN
SA
HA
RA
JORD
AN
ISRA
EL
PAKI
STA
NN
EPA
LBH
UTA
N
BURM
ALA
OS
SOU
TH K
ORE
A
NO
RTH
KO
REA
MO
NG
OLI
A
RUSS
IA
KAZA
KHST
AN
UZB
EKIS
TAN
TURK
MEN
ISTA
NN
AGO
RNO
KARA
BAKH
KYRG
YZST
AN
TAJI
KIST
AN
CAM
BOD
IAVIET
NA
M
HO
NG
KO
NG
TAIW
AN
JAPA
N
CHIN
A
PHIL
IPPI
NES
BRU
NEI
MA
LAYS
IA
SIN
GA
PORE
IND
ON
ESIA
EAST
TIM
OR
PAPU
AN
EW G
UIN
EASO
LOM
ON
ISLA
ND
S
TUVA
LU
FIJI
TON
GA
NAU
RUKI
RIBA
TI
MA
RSH
ALL
ISLA
ND
S
MIC
RON
ESIA
PALA
U
VAN
UAT
U
AUST
RALI
A
NEW
ZEA
LAN
D
THA
ILA
ND
TIBE
T
IND
IAN
KA
SHM
IR
PAKI
STA
NI K
ASH
MIR
A
FGH
AN
ISTA
N
IRA
N
SYRI
A
TURK
EYA
RMEN
IAG
EORG
IASO
UTH
OSS
ETIA
ABK
HA
ZIA
MO
LDO
VAU
KRA
INE
TRA
NSN
ISTR
IA
BELA
RUS
POLA
ND
RUSS
IA
SWED
ENN
ORW
AYIC
ELA
ND
FIN
LAN
D
ESTO
NIA
LATV
IALI
THU
AN
IA
ROM
AN
IA
BULG
ARI
AM
ACED
ON
IA
GRE
ECE
ALB
AN
IA
AZE
RBA
IJA
N
GER
MA
NY CZ
ECH
REP
.SL
OVA
KIA
AUST
RIA
LIEC
HTE
NST
EIN
LUXE
MBO
URG
BELG
IUM
NET
HER
LAN
DS
U.K
.DEN
MA
RK
IREL
AN
D
PORT
UG
AL
AN
DO
RRA
SPA
IN
FRA
NCE
ITA
LYSW
ITZE
RLA
ND
MO
NAC
OSA
N M
ARI
NO KO
SOVO
MO
NTE
NEG
ROBO
SNIA
& H
ERZ.
SERB
IACR
OAT
IASL
OVE
NIAH
UN
GA
RY
NO
RTH
ERN
CYPR
US
CYPR
US
MA
LTA
TUN
ISIA
KUW
AIT
U.A
.E.
IRAQ
LEBA
NO
N
ZAM
BIA
LESO
THO
SOU
TH A
FRIC
A
CON
GO
(KIN
SHA
SA)
RWA
ND
AG
ABO
N
BURU
ND
I
TAN
ZAN
IA
CAM
ERO
ON
CEN
TRA
L A
FRIC
AN
RE
PUBL
ICSO
UTH
SUD
AN
CÔTE
D’IV
OIR
E
SAO
TO
ME
& P
RIN
CIPE
EQU
ATO
RIA
L G
UIN
EA
GH
AN
A TOG
O
CON
GO
(BRA
ZZAV
ILLE
)
BURK
INA
FASO
MA
LI
BEN
IN
CHIL
E
PARA
GU
AY
ARG
ENTI
NA
URU
GU
AY
PUER
TO R
ICO
GA
ZA S
TRIP
/
WES
T BA
NK
Map
of F
reed
om
Freed
om St
atus
Coun
try Br
eakd
own
Popu
lation
Brea
kdow
n
FREE
90(4
6%)
3,04
6,15
8,00
0 (4
3%)
PART
LY F
REE
58(3
0%)
1,61
3,85
8,50
0 (2
3%)
NO
T FR
EE47
(24%
)2,
376,
822,
100
(34%
)
TOTA
L19
57,
036,
838,
600
Surv
ey F
indi
ngs
2013
Fre
ed
om
Ho
use
ww
w.fre
edom
hous
e.org
The
Map
of
Free
dom
ref
lect
s th
e fin
ding
s of
Fr
eedo
m H
ouse
’s Fr
eedo
m i
n th
e W
orld
201
3 su
rvey
, w
hich
rat
es t
he l
evel
of
polit
ical
rig
hts
and
civi
l lib
ertie
s in
195
cou
ntrie
s an
d 14
rela
ted
and
disp
uted
te
rrito
ries
du
ring
20
12.
Base
d on
th
ese
ratin
gs,
coun
trie
s ar
e di
vide
d in
to t
hree
cat
egor
ies:
Fre
e,
Part
ly F
ree,
and
Not
Fre
e.A
Fre
e co
untr
y is
one
whe
re t
here
is
broa
d sc
ope
for
open
pol
itica
l com
petit
ion,
a c
limat
e of
res
pect
for
civi
l lib
ertie
s, si
gnifi
cant
ind
epen
dent
civ
ic l
ife,
and
inde
pend
ent m
edia
.Pa
rtly
Fre
e co
untr
ies
are
char
acte
rize
d by
som
e re
stri
ctio
ns
on
polit
ical
ri
ghts
an
d ci
vil
liber
ties,
ofte
n in
a c
onte
xt o
f co
rrup
tion,
wea
k ru
le o
f la
w,
ethn
ic st
rife
, or c
ivil
war
.A
Not
Fre
e co
untr
y is
one
whe
re b
asic
pol
itica
l
righ
ts a
re a
bsen
t, an
d ba
sic
civi
l lib
ertie
s are
wid
ely
and
syst
emat
ical
ly d
enie
d.Fr
eedo
m H
ouse
is
an i
ndep
ende
nt n
ongo
vern
men
tal
orga
niza
tion
that
sup
port
s th
e ex
pans
ion
of f
reed
om
wor
ldw
ide.
13
BOTSWANA COUNTRY OVERVIEW
BO
TSW
AN
A C
OU
NTR
Y O
VER
VIE
W
The informaTion conTained on This page is subjecT To The disclaimer, warning and disclosure sTaTemenTs aT The end of This documenT.
GOVERNANCE
Botswana is widely considered to be one of the leading countries in Africa in respect of governance. This reflects the generally high quality of public institutions, an independent legal system, and a low level of corruption, all of which have been sustained over a long period of time. This achievement has been reflected in a number of international surveys and assessments (like the World Economic Forum (WEF), the Ibrahim Index of African Governance and the Bertelsmann Transformation Index). The WEF assesses the quality of institutions as the first pillar of its Global Competitiveness Index. Of the 21 indicators measured under the Institutions pillar, Botswana scores in the top 50 countries globally on 20 of them. Botswana does particularly well in rankings for (lack of) wastefulness in government spending, public trust in politicians, diversion of public funds, favouritism in deci-sions of government officials, and efficiency of legal framework in challenging regulations.
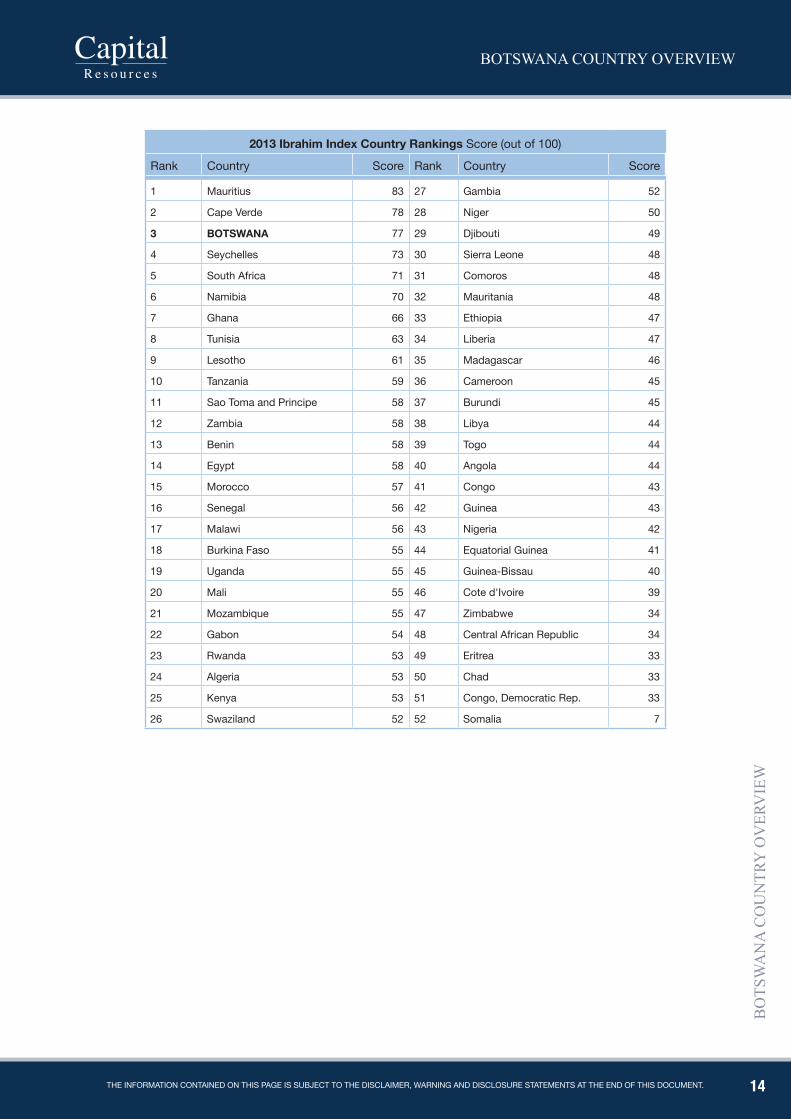
In 2012, the Ibrahim Index of African Governance, which measures the quality of governance in sub-Saharan Africa’s 52 states - on the basis of safety and security, rule of law, transparency and corruption, participation and human rights, sustainable economic opportunity, and human development - ranked Botswana as the third best, same as in 2010 and 2011. Botswana’s overall score was 77, after Mauritius and Cape Verde and ahead of Seychelles and South Africa. To this extent, Botswana is amongst the top performers on the African continent. The Ibrahim Index of African Governance is regarded as the world’s most comprehensive ranking of African governance.
The Bertelsmann Transformation Index is an international ranking of 128 developing and transition countries. It sheds light upon the political and economic status of each country as well as upon the political management performance by the relevant actors. It is divided into two indices; the status index and the management index both of which are based on in-depth assessments of 128 countries around the world. The status index ranks the countries according to their state of democracy and market economy and the management index ranks them according to their leadership’s management performance. The management index reviews and evaluates the reform activities of political decision makers, thus providing valuable information on the key factors of success and failure for states on their way to democracy and a market economy. In terms of the Status index, in 2012, Botswana was at position 19, the same as in 2010, just below Mauritius in the “advanced” category. As for the management index, in 2012 Botswana was at position 8, which was 1 place down from the previous index, below Chile and Estonia in the “successful” category above Mauritius at position 10.
14
BOTSWANA COUNTRY OVERVIEW
BO
TSW
AN
A C
OU
NTR
Y O
VER
VIE
W
The informaTion conTained on This page is subjecT To The disclaimer, warning and disclosure sTaTemenTs aT The end of This documenT.
2013 Ibrahim Index Country Rankings Score (out of 100)
Rank Country Score Rank Country Score
1 Mauritius 83 27 Gambia 52
2 Cape Verde 78 28 Niger 50
3 BOTsWANA 77 29 Djibouti 49
4 Seychelles 73 30 Sierra Leone 48
5 South Africa 71 31 Comoros 48
6 Namibia 70 32 Mauritania 48
7 Ghana 66 33 Ethiopia 47
8 Tunisia 63 34 Liberia 47
9 Lesotho 61 35 Madagascar 46
10 Tanzania 59 36 Cameroon 45
11 Sao Toma and Principe 58 37 Burundi 45
12 Zambia 58 38 Libya 44
13 Benin 58 39 Togo 44
14 Egypt 58 40 Angola 44
15 Morocco 57 41 Congo 43
16 Senegal 56 42 Guinea 43
17 Malawi 56 43 Nigeria 42
18 Burkina Faso 55 44 Equatorial Guinea 41
19 Uganda 55 45 Guinea-Bissau 40
20 Mali 55 46 Cote d'Ivoire 39
21 Mozambique 55 47 Zimbabwe 34
22 Gabon 54 48 Central African Republic 34
23 Rwanda 53 49 Eritrea 33
24 Algeria 53 50 Chad 33
25 Kenya 53 51 Congo, Democratic Rep. 33
26 Swaziland 52 52 Somalia 7
15
BOTSWANA COUNTRY OVERVIEW
BO
TSW
AN
A C
OU
NTR
Y O
VER
VIE
W
The informaTion conTained on This page is subjecT To The disclaimer, warning and disclosure sTaTemenTs aT The end of This documenT.
CORRUpTION
Corruption is not a significant concern for most companies operating in Botswana, particularly those in the re-sources sector. This partly reflects pre-emptive action taken by the government, which in the 1990s had become seriously concerned about the detrimental effects of corruption and economic crime should it take hold in the country.
In developing new legislation and anti-corruption structures, the government reviewed the approaches taken elsewhere in the world, particularly Hong Kong, and saw that significant results had been achieved by imple-menting a ‘three pronged attack’ of detailed investigation, corruption prevention and public education. It was also clear that the greatest success had been enjoyed in those countries which had established separate bodies specifically set up and designed to deal with corruption problems rather than imposing additional burdens on existing law enforcement agencies. As a result a Corruption and Economic Crime Act was enacted, leading to the establishment of the Directorate on Corruption and Economic Crime (DCEC) in 1994.
The impartiality of the DCEC is achieved by having it operate largely independently of government structures, with the Director reporting directly to the President and prosecution decisions being taken by the Attorney General. It has its own powers of investigation, arrest, and search and seizure, and is widely recognized as being an effective anti-corruption agency.
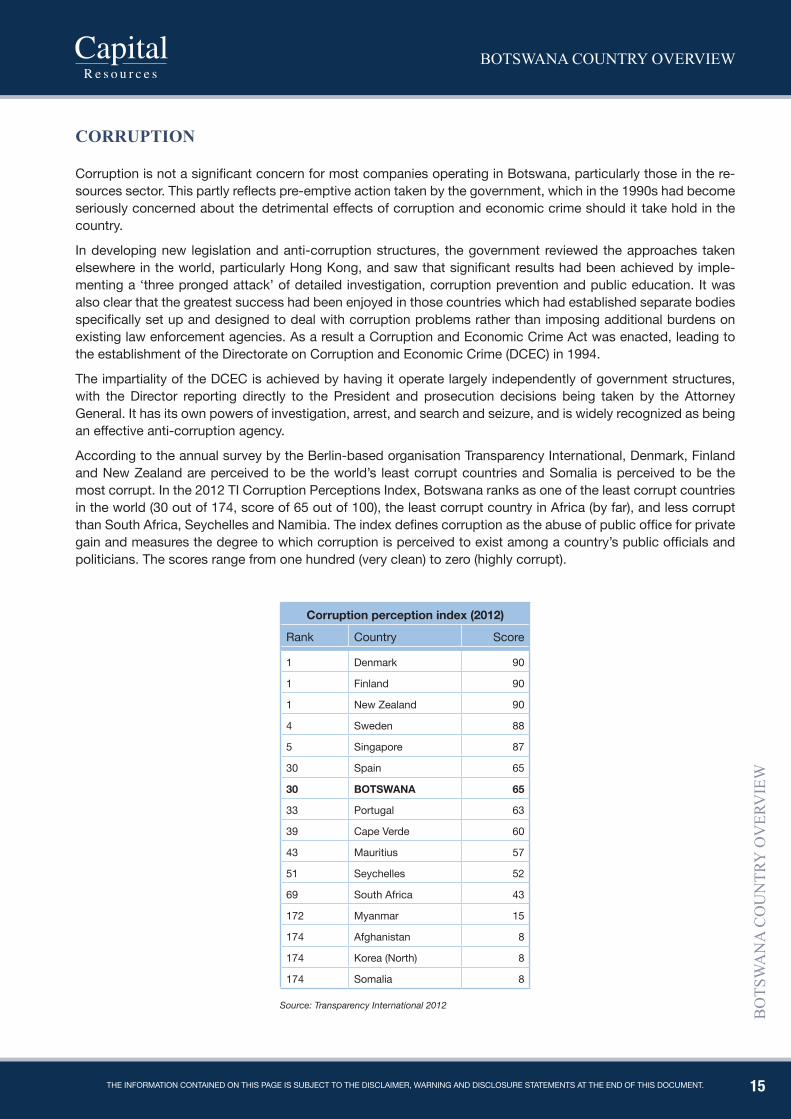
According to the annual survey by the Berlin-based organisation Transparency International, Denmark, Finland and New Zealand are perceived to be the world’s least corrupt countries and Somalia is perceived to be the most corrupt. In the 2012 TI Corruption Perceptions Index, Botswana ranks as one of the least corrupt countries in the world (30 out of 174, score of 65 out of 100), the least corrupt country in Africa (by far), and less corrupt than South Africa, Seychelles and Namibia. The index defines corruption as the abuse of public office for private gain and measures the degree to which corruption is perceived to exist among a country’s public officials and politicians. The scores range from one hundred (very clean) to zero (highly corrupt).
Corruption perception index (2012)
Rank Country Score
1 Denmark 90
1 Finland 90
1 New Zealand 90
4 Sweden 88
5 Singapore 87
30 Spain 65
30 BOTsWANA 65
33 Portugal 63
39 Cape Verde 60
43 Mauritius 57
51 Seychelles 52
69 South Africa 43
172 Myanmar 15
174 Afghanistan 8
174 Korea (North) 8
174 Somalia 8
Source: Transparency International 2012
16
BOTSWANA COUNTRY OVERVIEW
BO
TSW
AN
A C
OU
NTR
Y O
VER
VIE
W
The informaTion conTained on This page is subjecT To The disclaimer, warning and disclosure sTaTemenTs aT The end of This documenT.
FREEdOm OF ThE pRESS
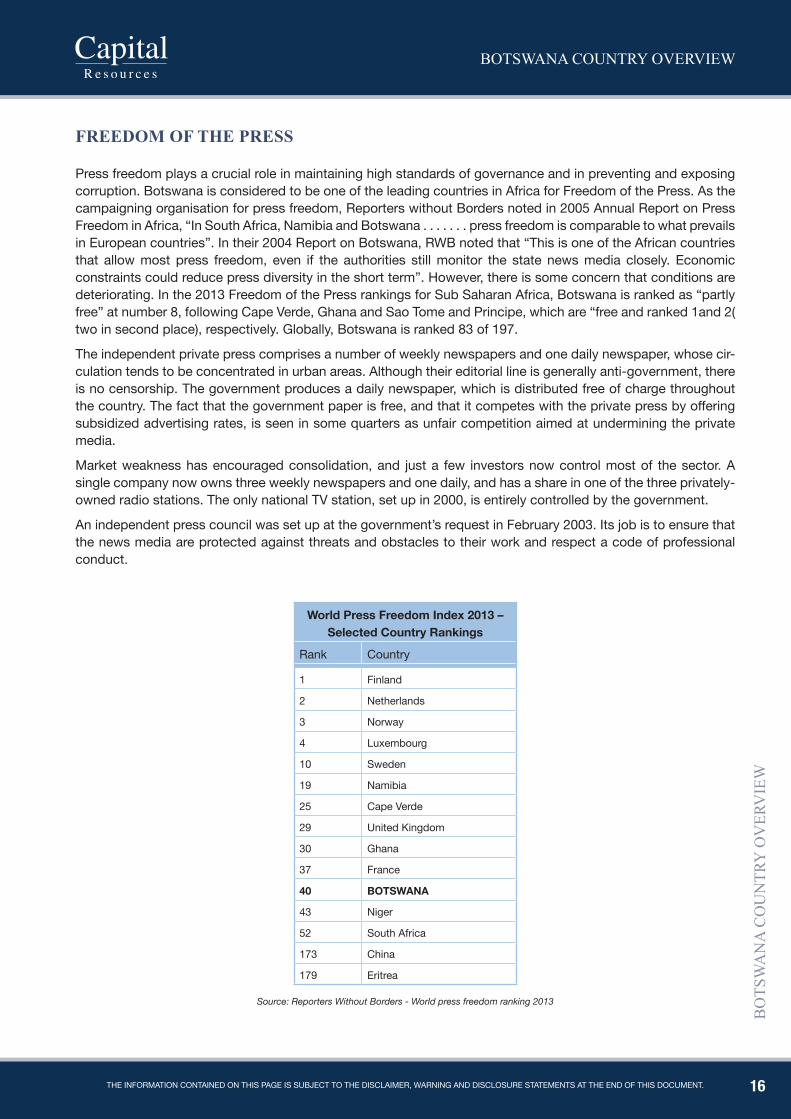
Press freedom plays a crucial role in maintaining high standards of governance and in preventing and exposing corruption. Botswana is considered to be one of the leading countries in Africa for Freedom of the Press. As the campaigning organisation for press freedom, Reporters without Borders noted in 2005 Annual Report on Press Freedom in Africa, “In South Africa, Namibia and Botswana . . . . . . . press freedom is comparable to what prevails in European countries”. In their 2004 Report on Botswana, RWB noted that “This is one of the African countries that allow most press freedom, even if the authorities still monitor the state news media closely. Economic constraints could reduce press diversity in the short term”. However, there is some concern that conditions are deteriorating. In the 2013 Freedom of the Press rankings for Sub Saharan Africa, Botswana is ranked as “partly free” at number 8, following Cape Verde, Ghana and Sao Tome and Principe, which are “free and ranked 1and 2( two in second place), respectively. Globally, Botswana is ranked 83 of 197.
The independent private press comprises a number of weekly newspapers and one daily newspaper, whose cir-culation tends to be concentrated in urban areas. Although their editorial line is generally anti-government, there is no censorship. The government produces a daily newspaper, which is distributed free of charge throughout the country. The fact that the government paper is free, and that it competes with the private press by offering subsidized advertising rates, is seen in some quarters as unfair competition aimed at undermining the private media.
Market weakness has encouraged consolidation, and just a few investors now control most of the sector. A single company now owns three weekly newspapers and one daily, and has a share in one of the three privately-owned radio stations. The only national TV station, set up in 2000, is entirely controlled by the government.
An independent press council was set up at the government’s request in February 2003. Its job is to ensure that the news media are protected against threats and obstacles to their work and respect a code of professional conduct.
World press Freedom Index 2013 – selected Country Rankings
Rank Country
1 Finland
2 Netherlands
3 Norway
4 Luxembourg
10 Sweden
19 Namibia
25 Cape Verde
29 United Kingdom
30 Ghana
37 France
40 BOTsWANA
43 Niger
52 South Africa
173 China
179 Eritrea
Source: Reporters Without Borders - World press freedom ranking 2013
17
BOTSWANA COUNTRY OVERVIEW
BO
TSW
AN
A C
OU
NTR
Y O
VER
VIE
W
The informaTion conTained on This page is subjecT To The disclaimer, warning and disclosure sTaTemenTs aT The end of This documenT.
SOCIAL dEVELOpmENT
Botswana’s impressive economic performance (discussed in Economic Overview, below) over the post inde-pendence period has been the basis for widespread social development. Government revenues, primarily de-rived from the mining sector, have been used to fund extensive social provision, particularly in the form of public education, health provision, water supplies, roads and other infrastructure. Given that the level of social and physical development was extremely low at the time of independence, considerable achievements have been made in achieving virtually universal primary and junior secondary education, health care (88% of the population live within 8km of a health facility, and trained health personnel attend to 99% of births) and access to clean water supplies (97% of the population have access to safe drinking water). It is only the most remote areas that state provision of these basic services may not be available.
High levels of social provision have resulted in impressive levels of literacy, numeracy and, until recently, life expectancy. They have also contributed to the steady reduction of poverty rates which, although still high, have been on a long-term downward trend. The main setbacks have come as a result of the spread of HIV/AIDS (discussed in more detail below).
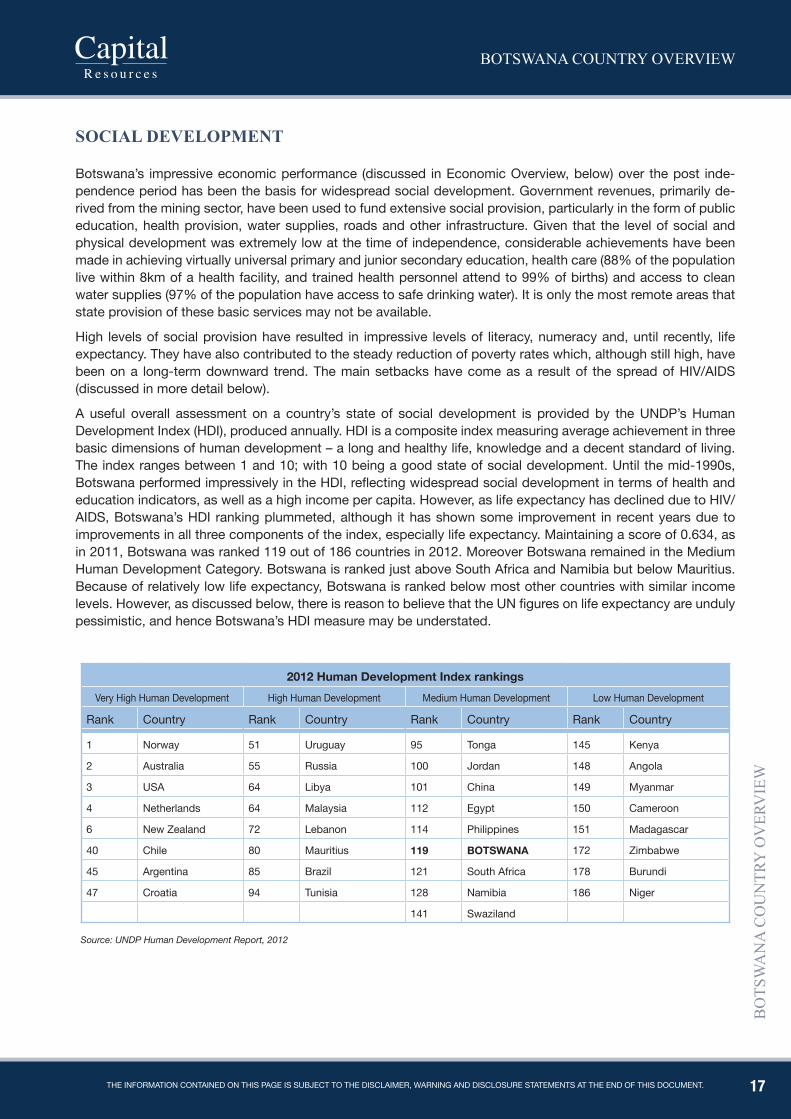
A useful overall assessment on a country’s state of social development is provided by the UNDP’s Human Development Index (HDI), produced annually. HDI is a composite index measuring average achievement in three basic dimensions of human development – a long and healthy life, knowledge and a decent standard of living. The index ranges between 1 and 10; with 10 being a good state of social development. Until the mid-1990s, Botswana performed impressively in the HDI, reflecting widespread social development in terms of health and education indicators, as well as a high income per capita. However, as life expectancy has declined due to HIV/AIDS, Botswana’s HDI ranking plummeted, although it has shown some improvement in recent years due to improvements in all three components of the index, especially life expectancy. Maintaining a score of 0.634, as in 2011, Botswana was ranked 119 out of 186 countries in 2012. Moreover Botswana remained in the Medium Human Development Category. Botswana is ranked just above South Africa and Namibia but below Mauritius. Because of relatively low life expectancy, Botswana is ranked below most other countries with similar income levels. However, as discussed below, there is reason to believe that the UN figures on life expectancy are unduly pessimistic, and hence Botswana’s HDI measure may be understated.
2012 human Development Index rankingsVery High Human Development High Human Development Medium Human Development Low Human Development
Rank Country Rank Country Rank Country Rank Country
1 Norway 51 Uruguay 95 Tonga 145 Kenya
2 Australia 55 Russia 100 Jordan 148 Angola
3 USA 64 Libya 101 China 149 Myanmar
4 Netherlands 64 Malaysia 112 Egypt 150 Cameroon
6 New Zealand 72 Lebanon 114 Philippines 151 Madagascar
40 Chile 80 Mauritius 119 BOTsWANA 172 Zimbabwe
45 Argentina 85 Brazil 121 South Africa 178 Burundi
47 Croatia 94 Tunisia 128 Namibia 186 Niger
141 Swaziland
Source: UNDP Human Development Report, 2012
18
BOTSWANA COUNTRY OVERVIEW
BO
TSW
AN
A C
OU
NTR
Y O
VER
VIE
W
The informaTion conTained on This page is subjecT To The disclaimer, warning and disclosure sTaTemenTs aT The end of This documenT.
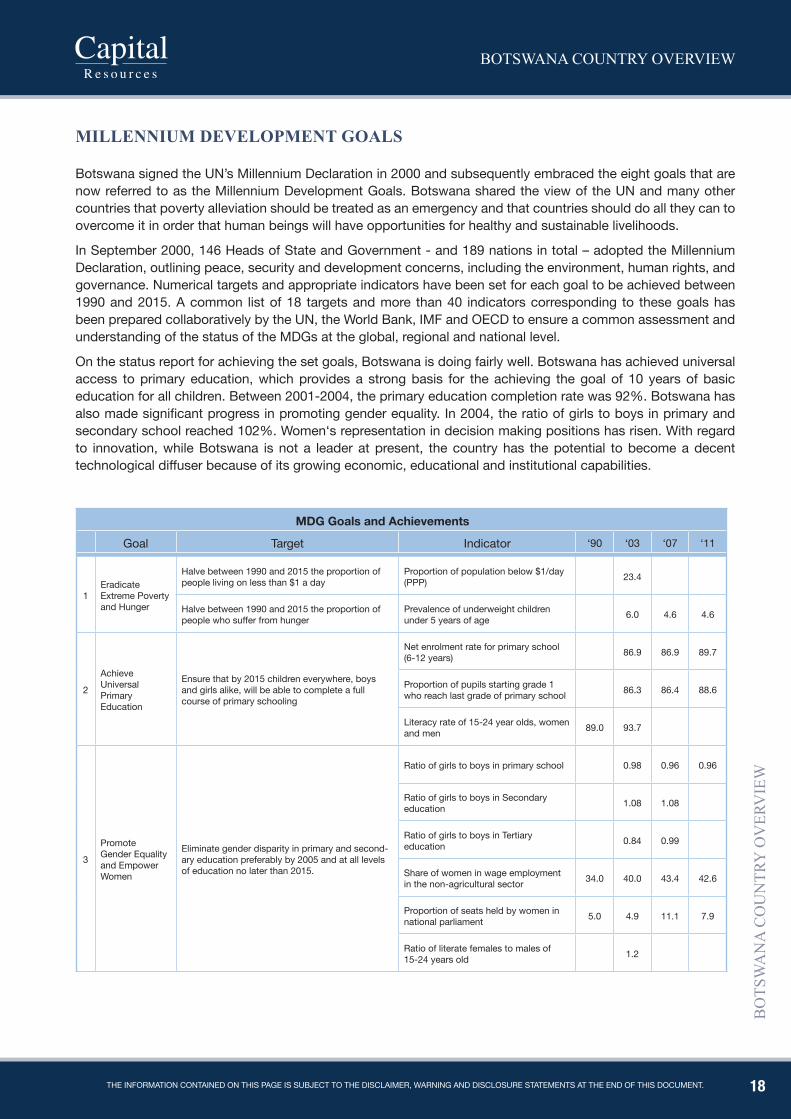
mILLENNIUm dEVELOpmENT GOALS
Botswana signed the UN’s Millennium Declaration in 2000 and subsequently embraced the eight goals that are now referred to as the Millennium Development Goals. Botswana shared the view of the UN and many other countries that poverty alleviation should be treated as an emergency and that countries should do all they can to overcome it in order that human beings will have opportunities for healthy and sustainable livelihoods.
In September 2000, 146 Heads of State and Government - and 189 nations in total – adopted the Millennium Declaration, outlining peace, security and development concerns, including the environment, human rights, and governance. Numerical targets and appropriate indicators have been set for each goal to be achieved between 1990 and 2015. A common list of 18 targets and more than 40 indicators corresponding to these goals has been prepared collaboratively by the UN, the World Bank, IMF and OECD to ensure a common assessment and understanding of the status of the MDGs at the global, regional and national level.
On the status report for achieving the set goals, Botswana is doing fairly well. Botswana has achieved universal access to primary education, which provides a strong basis for the achieving the goal of 10 years of basic education for all children. Between 2001-2004, the primary education completion rate was 92%. Botswana has also made significant progress in promoting gender equality. In 2004, the ratio of girls to boys in primary and secondary school reached 102%. Women‘s representation in decision making positions has risen. With regard to innovation, while Botswana is not a leader at present, the country has the potential to become a decent technological diffuser because of its growing economic, educational and institutional capabilities.
MDG Goals and Achievements
Goal Target Indicator ‘90 ‘03 ‘07 ‘11
1Eradicate Extreme Poverty and Hunger
Halve between 1990 and 2015 the proportion of people living on less than $1 a day
Proportion of population below $1/day (PPP) 23.4
Halve between 1990 and 2015 the proportion of people who suffer from hunger
Prevalence of underweight children under 5 years of age 6.0 4.6 4.6
2
Achieve Universal Primary Education
Ensure that by 2015 children everywhere, boys and girls alike, will be able to complete a full course of primary schooling
Net enrolment rate for primary school (6-12 years) 86.9 86.9 89.7
Proportion of pupils starting grade 1 who reach last grade of primary school 86.3 86.4 88.6
Literacy rate of 15-24 year olds, women and men 89.0 93.7
3
Promote Gender Equality and Empower Women
Eliminate gender disparity in primary and second-ary education preferably by 2005 and at all levels of education no later than 2015.
Ratio of girls to boys in primary school 0.98 0.96 0.96
Ratio of girls to boys in Secondary education 1.08 1.08
Ratio of girls to boys in Tertiary education 0.84 0.99
Share of women in wage employment in the non-agricultural sector 34.0 40.0 43.4 42.6
Proportion of seats held by women in national parliament 5.0 4.9 11.1 7.9
Ratio of literate females to males of 15-24 years old 1.2
19
BOTSWANA COUNTRY OVERVIEW
BO
TSW
AN
A C
OU
NTR
Y O
VER
VIE
W
The informaTion conTained on This page is subjecT To The disclaimer, warning and disclosure sTaTemenTs aT The end of This documenT.
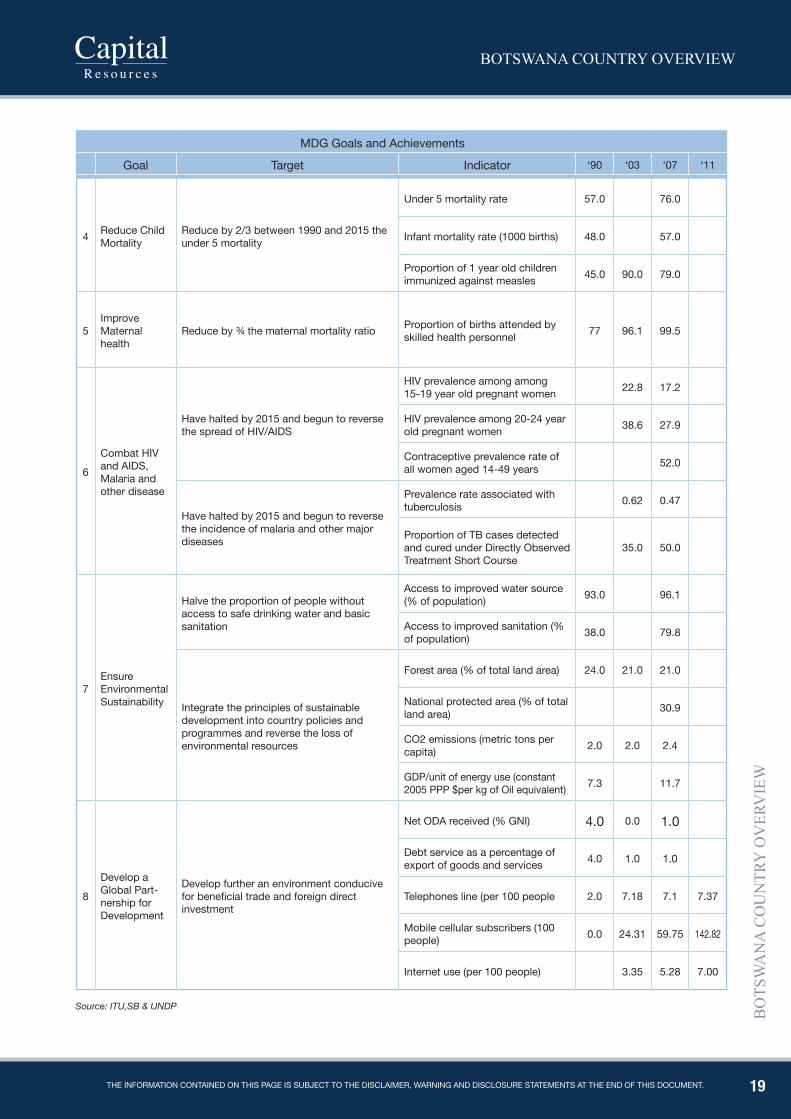
MDG Goals and Achievements
Goal Target Indicator ‘90 ‘03 ‘07 ‘11
4 Reduce Child Mortality
Reduce by 2/3 between 1990 and 2015 the under 5 mortality
Under 5 mortality rate 57.0 76.0
Infant mortality rate (1000 births) 48.0 57.0
Proportion of 1 year old children immunized against measles 45.0 90.0 79.0
5Improve Maternal health
Reduce by ¾ the maternal mortality ratio Proportion of births attended by skilled health personnel 77 96.1 99.5
6
Combat HIV and AIDS, Malaria and other disease
Have halted by 2015 and begun to reverse the spread of HIV/AIDS
HIV prevalence among among 15-19 year old pregnant women 22.8 17.2
HIV prevalence among 20-24 year old pregnant women 38.6 27.9
Contraceptive prevalence rate of all women aged 14-49 years 52.0
Have halted by 2015 and begun to reverse the incidence of malaria and other major diseases
Prevalence rate associated with tuberculosis 0.62 0.47
Proportion of TB cases detected and cured under Directly Observed Treatment Short Course
35.0 50.0
7Ensure Environmental Sustainability
Halve the proportion of people without access to safe drinking water and basic sanitation
Access to improved water source (% of population) 93.0 96.1
Access to improved sanitation (% of population) 38.0 79.8
Integrate the principles of sustainable development into country policies and programmes and reverse the loss of environmental resources
Forest area (% of total land area) 24.0 21.0 21.0
National protected area (% of total land area) 30.9
CO2 emissions (metric tons per capita) 2.0 2.0 2.4
GDP/unit of energy use (constant 2005 PPP $per kg of Oil equivalent) 7.3 11.7
8
Develop a Global Part-nership for Development
Develop further an environment conducive for beneficial trade and foreign direct investment
Net ODA received (% GNI) 4.0 0.0 1.0
Debt service as a percentage of export of goods and services 4.0 1.0 1.0
Telephones line (per 100 people 2.0 7.18 7.1 7.37
Mobile cellular subscribers (100 people) 0.0 24.31 59.75 142.82
Internet use (per 100 people) 3.35 5.28 7.00
Source: ITU,SB & UNDP
20
BOTSWANA COUNTRY OVERVIEW
BO
TSW
AN
A C
OU
NTR
Y O
VER
VIE
W
The informaTion conTained on This page is subjecT To The disclaimer, warning and disclosure sTaTemenTs aT The end of This documenT.
hIV/AIdS
In recent years, much of this social progress has been threatened as a result of HIV/AIDS, which is very wide-spread in Botswana. For many years Botswana had the highest rate of HIV prevalence in the world, with more than 35% of pregnant women testing HIV positive, which equates to an estimated adult HIV prevalence rate of around 28% and a population prevalence rate of around 17% (although figures are often mis-reported, even by supposedly reputable sources, as a 35% population prevalence rate). The total number of HIV positive adults is estimated at around 260 000. Comparative international data indicates that Botswana has the second highest HIV prevalence rate in the world, after Swaziland.
The spread of HIV/AIDS has had a dramatic effect on life expectancy. Following the widespread social invest-ment that took place after independence, life expectancy had risen to around 67 years at the time of the 1991 national census. By 2001, life expectancy had fallen sharply, although with a very wide range of estimates of what it had fallen to. The United Nations, for instance, quoted life expectancy of 36 years as at 2003 in its 2004 Human Development Report, while Botswana’s Central Statistics Office quoted life expectancy of 57 years on the basis of the 2001 census. More recent demographic estimates suggest that life expectancy fell to a low of 46 years in 2001, and has since risen to 52 years. These data indicate that the recorded fall in Botswana’s HDI measure calculated by the UN may have been overstated.
The threats to the fabric of the society and the economy posed by HIV/AIDS are enormous. High rates of mor-bidity and mortality will pose a burden on family structures and livelihoods, as breadwinners die, medical and funeral expenses mount, and children are orphaned. They will also impact on firms, due to additional expenses related to sickness, absenteeism, reduced productivity, higher staff turnover and hence additional recruitment and training costs. There is also a major impact on the government budget, as well as the long-term prospects for economic growth.
In response to the threat posed by HIV/AIDS, the government of Botswana has mounted an extremely vigorous and extensive campaign on many fronts, focused on awareness raising, prevention and treatment. The high-profile ABC (Abstain, Be Faithful and Condomise) has run for many years, and has contributed to widespread awareness of how HIV is transmitted and how infection can be prevented. Nevertheless, despite this awareness, high-risk behaviour persists and has been very slow to change. The government has also established a nation-wide network of voluntary HIV testing centres, which have a steadily growing influx of people wishing to “know their status”. The government has also recently decided that all patients presenting themselves at public health facilities will be automatically tested for HIV, unless they superficially decide otherwise.
The government of Botswana has not been acting alone to address the HIV/AIDS pandemic. During NDP 9, government efforts were complemented by the work of individual non-governmental and community-based organisations including Emang Basadi, YWCA, LifeLine, Childline, the Botswana Family Welfare Association (BOFWA), the Botswana Girl Guides Association, Ditshwanelo, Kagisano Women’s Shelter Project, Botswana Media Women’s Association and the Young Women’s Christian Association (YWCA). In addition there are several NGO networks such as the Botswana Council of Non-Governmental Organisations (BOCONGO), the Botswana Network of AIDS Service Organisations (BONASO), the Botswana Network of People Living With AIDS (BONE-PWA) and the Botswana Network on Law, Ethics and AIDS (BONELA) which aim at providing support, advocacy as well as promoting and protecting the human rights of all those infected and affected by HIV/AIDS (United Nations in Botswana, 2004). It must be noted that women and girls do provide the bulk of home-based care in Botswana. The provision of home care for terminally-ill patients serves to mitigate against the participation of women in income-generating activities – further exacerbating the depth of poverty among income-poor large households many of which are headed by women.
In addition, Botswana became the first country in Africa to provide antiretroviral therapy (ART) to all its citizens on a nationwide basis. Most of the recipients are treated free of charge in the public health care system while a few are treated under private medical insurance or corporate schemes. It is estimated that over 90% of those who are clinically eligible are receiving ART. The government has built new health facilities, recruited medical staff and bought drugs, and established an extensive testing and monitoring programme. While a substantial proportion of the costs are being met by donor funds, the burden on the government budget is enormous and has required the curtailment of expenditure in other areas.
21
BOTSWANA COUNTRY OVERVIEW
BO
TSW
AN
A C
OU
NTR
Y O
VER
VIE
W
The informaTion conTained on This page is subjecT To The disclaimer, warning and disclosure sTaTemenTs aT The end of This documenT.
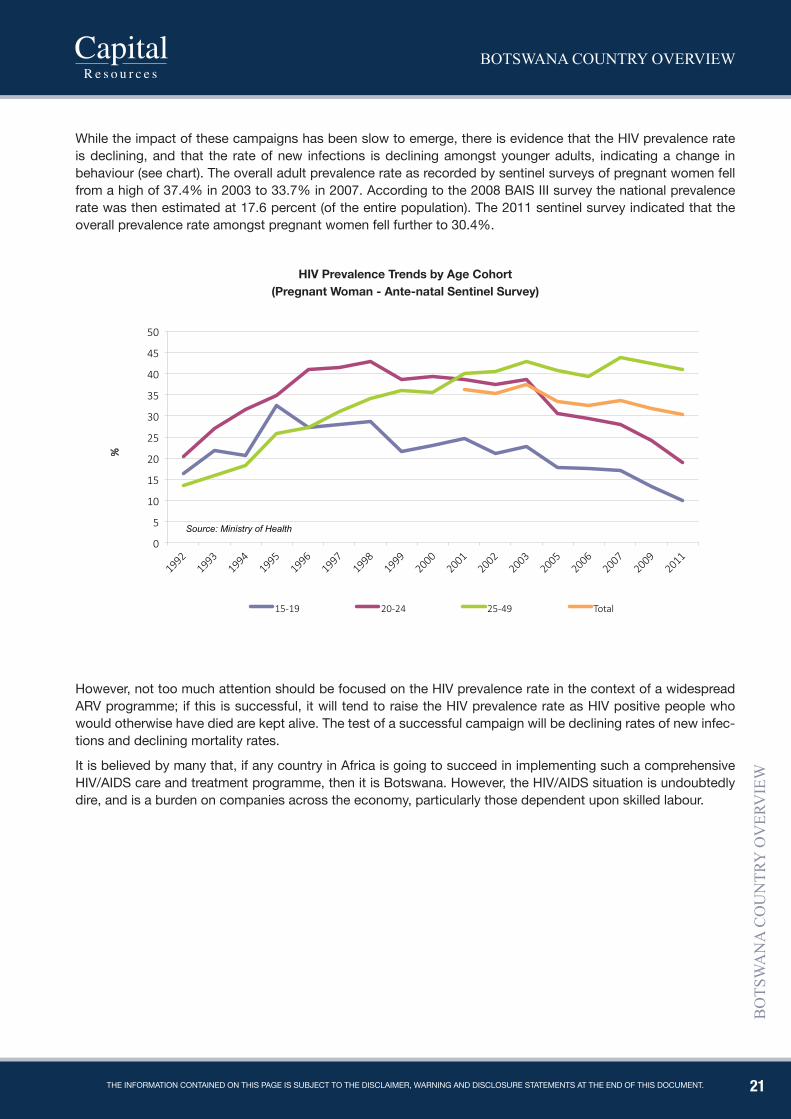
While the impact of these campaigns has been slow to emerge, there is evidence that the HIV prevalence rate is declining, and that the rate of new infections is declining amongst younger adults, indicating a change in behaviour (see chart). The overall adult prevalence rate as recorded by sentinel surveys of pregnant women fell from a high of 37.4% in 2003 to 33.7% in 2007. According to the 2008 BAIS III survey the national prevalence rate was then estimated at 17.6 percent (of the entire population). The 2011 sentinel survey indicated that the overall prevalence rate amongst pregnant women fell further to 30.4%.
However, not too much attention should be focused on the HIV prevalence rate in the context of a widespread ARV programme; if this is successful, it will tend to raise the HIV prevalence rate as HIV positive people who would otherwise have died are kept alive. The test of a successful campaign will be declining rates of new infec-tions and declining mortality rates.
It is believed by many that, if any country in Africa is going to succeed in implementing such a comprehensive HIV/AIDS care and treatment programme, then it is Botswana. However, the HIV/AIDS situation is undoubtedly dire, and is a burden on companies across the economy, particularly those dependent upon skilled labour.
hIV prevalence Trends by Age Cohort(pregnant Woman - Ante-natal sentinel survey)
22
BOTSWANA COUNTRY OVERVIEW
BO
TSW
AN
A C
OU
NTR
Y O
VER
VIE
W
The informaTion conTained on This page is subjecT To The disclaimer, warning and disclosure sTaTemenTs aT The end of This documenT.
ENVIRONmENTAL SUSTAINABILITY
Environmental sustainability is increasingly an important issue in all countries but has historically been a dif-ficult concept to measure. The Environmental Performance Measurement Project aims to shift environmental decision-making to firmer analytic foundations using environmental indicators and statistics. In collaboration with the Centre for International Earth Science Information Network (CIESIN) at Columbia University, Yale Uni-versity, and the World Economic Forum, the project produces a periodically updated Environmental Performance Index (EPI previously the Environmental Sustainability Index ESI). The EPI is a composite index tracking a diverse set of socioeconomic, environmental, and institutional indicators that characterize and influence environmental sustainability at the national scale. The EPI ranks countries on 22 performance indicators spanning ten policy categories. These are:
• Environmental Health Water (effects on human health)• Air Pollution (effects on human health)• Air Pollution (ecosystem effects)• Water Resources (ecosystem effects)• Biodiversity and Habitat• Forests• Fisheries• Agriculture• Climate Change
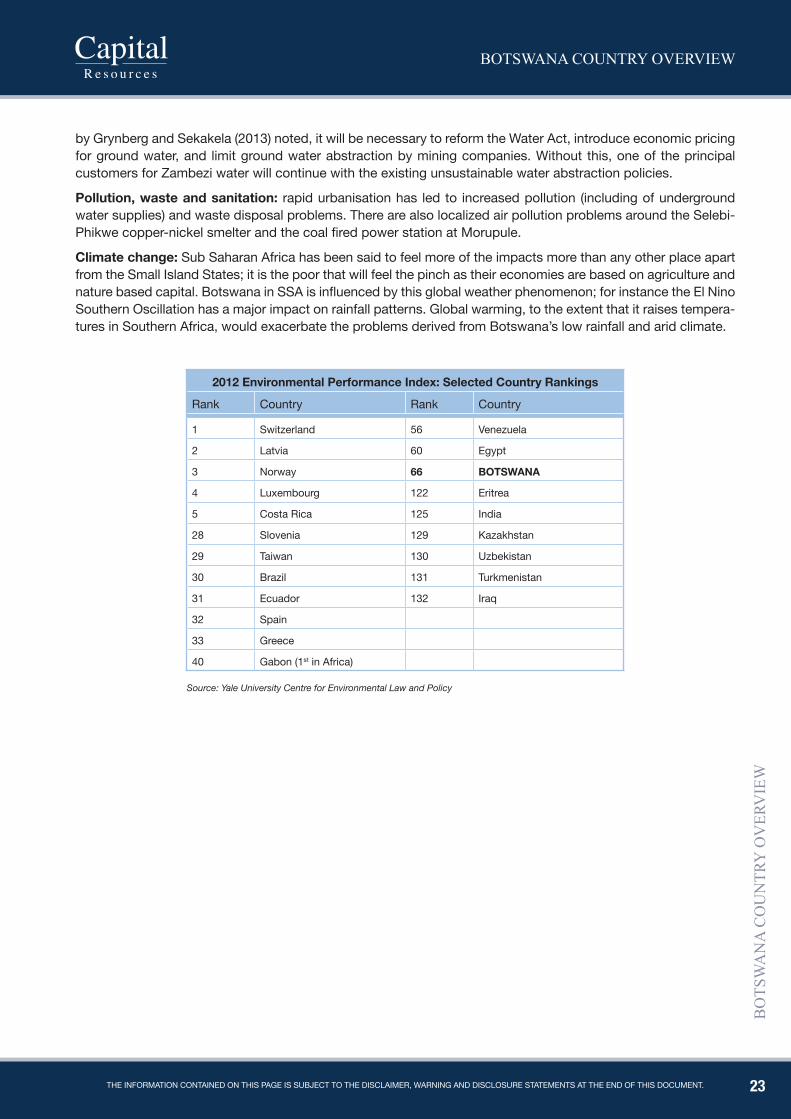
Botswana is deemed a “modest performer”, ranking 66 of 132 in the 2012 EPI, with a score of 53.74. Scores and rankings for the 2012 EPI cannot be compared with scores and rankings from earlier releases of the EPI owing to changes in data and methodology. This refinement of methodology allowed for the development of the Pilot Trend EPI; which ranks countries on the change in their environmental performance over the last decade. Botswana is scored 10.91 on the Trend EPI, at a ranking of 21 of 132.
The main environmental sustainability issues in Botswana are currently:
land degradation: rangeland used by cattle and small stock (sheep and goats) and wildlife makes up around 60 percent of Botswana’s land area. Overstocking leading to extensive overgrazing and rangeland degradation is of major concern, especially in the communal land areas that account for the bulk of rangeland, resulting in soil erosion, bush encroachment, and declining carrying capacity.
Depletion of water resources: Owing to Botswana’s aridity and flat topography water is a scarce resource. This is perpetuated by the fact that the country only has two perennial, but international rivers - Okavango and Chobe. Although almost all of the population have access to safe drinking water – a considerable achievement given that water is a very scarce resource in Botswana – national water resources are under stress and are being depleted. In 2009, the biggest users of water in Botswana were the agriculture, household and mining sectors accounting for 37%, 33% and 16% of total consumption, respectively. Use of recycled water is extremely limited. Around two-thirds of water supplies are derived from boreholes tapping underground aquifers, and there is concern that the water in these well fields is being “mined”, with extraction rates higher than replenishment rates. This renders abstraction of ground water ultimately unsustainable. Almost all of the water used by the mines, estimated at 51.1 million m3 in 2012, was groundwater. With several new mining projects likely to go ahead, the demand for water by the mining sector could double over the next decade.
Part of the problem is that the pricing of groundwater in Botswana does not reflect the total social and economic cost of extraction. The fees levied on large scale groundwater abstractors are considerably less than the fees paid for pipeline water supplied by WUC, which encourages unsustainable use.
In a bid to provide more sustainable sources of water, Government is exploring the options of either abstracting water from the Zambezi River, (from which Botswana can take up to 495 million m3 per annum) or sourcing it from the Lesotho Highlands. However, these projects require very substantial investments and would inevitably lead to much higher tariffs. Nevertheless, this alone would not be sufficient to make water use sustainable. As a report
23
BOTSWANA COUNTRY OVERVIEW
BO
TSW
AN
A C
OU
NTR
Y O
VER
VIE
W
The informaTion conTained on This page is subjecT To The disclaimer, warning and disclosure sTaTemenTs aT The end of This documenT.
by Grynberg and Sekakela (2013) noted, it will be necessary to reform the Water Act, introduce economic pricing for ground water, and limit ground water abstraction by mining companies. Without this, one of the principal customers for Zambezi water will continue with the existing unsustainable water abstraction policies.
pollution, waste and sanitation: rapid urbanisation has led to increased pollution (including of underground water supplies) and waste disposal problems. There are also localized air pollution problems around the Selebi-Phikwe copper-nickel smelter and the coal fired power station at Morupule.
Climate change: Sub Saharan Africa has been said to feel more of the impacts more than any other place apart from the Small Island States; it is the poor that will feel the pinch as their economies are based on agriculture and nature based capital. Botswana in SSA is influenced by this global weather phenomenon; for instance the El Nino Southern Oscillation has a major impact on rainfall patterns. Global warming, to the extent that it raises tempera-tures in Southern Africa, would exacerbate the problems derived from Botswana’s low rainfall and arid climate.
2012 Environmental performance Index: selected Country Rankings
Rank Country Rank Country
1 Switzerland 56 Venezuela
2 Latvia 60 Egypt
3 Norway 66 BOTsWANA
4 Luxembourg 122 Eritrea
5 Costa Rica 125 India
28 Slovenia 129 Kazakhstan
29 Taiwan 130 Uzbekistan
30 Brazil 131 Turkmenistan
31 Ecuador 132 Iraq
32 Spain
33 Greece
40 Gabon (1st in Africa)
Source: Yale University Centre for Environmental Law and Policy
24
BOTSWANA COUNTRY OVERVIEW
BO
TSW
AN
A C
OU
NTR
Y O
VER
VIE
W
The informaTion conTained on This page is subjecT To The disclaimer, warning and disclosure sTaTemenTs aT The end of This documenT.
INFORmATION ANd COmmUNICATION TEChNOLOGIES (ICTS)
The use of ICTs is an essential component of modern economic activity, especially if a nation wishes to partici-pate in trade services, the most dynamic element of the global trading system. ICTs also have an important role to play in offering innovative solutions to traditional development challenges, and in recent years the government of Botswana has paid a great deal of attention to developing an ICT-supportive environment. The telecommuni-cations regulator, Botswana Telecommunications Authority (BTA), is often seen as a model for other developing countries to follow, and has generally followed a progressive, liberalising agenda.
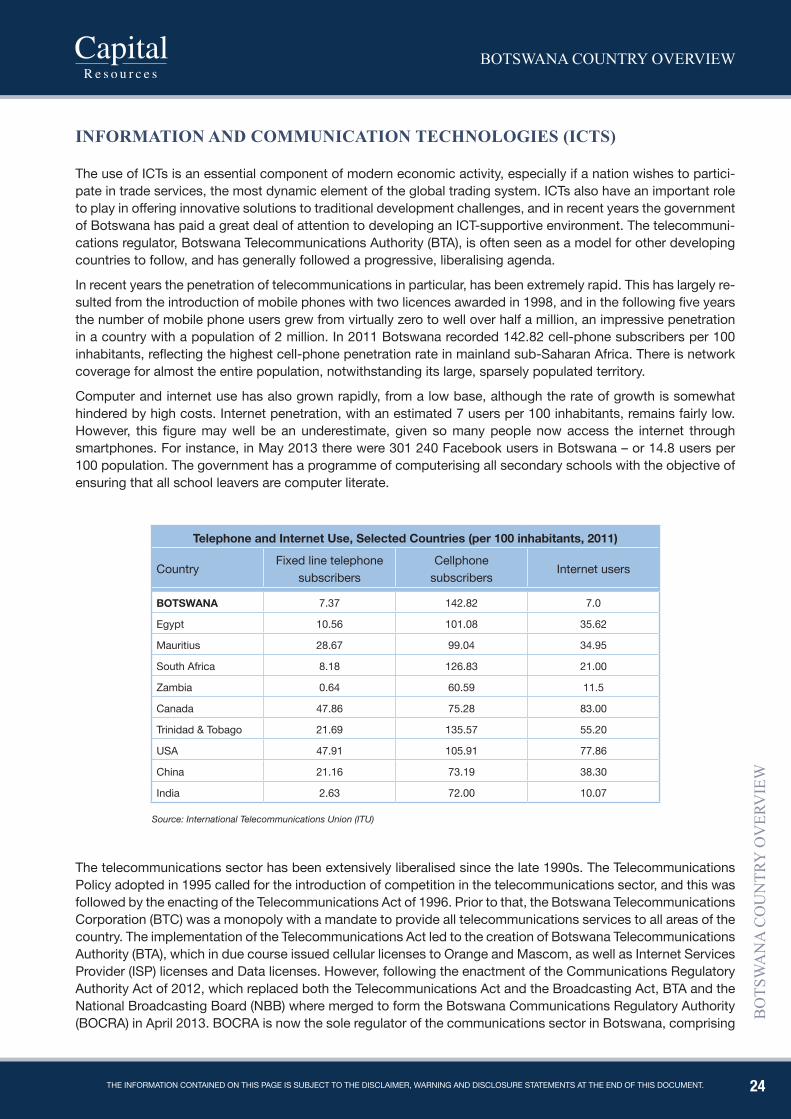
In recent years the penetration of telecommunications in particular, has been extremely rapid. This has largely re-sulted from the introduction of mobile phones with two licences awarded in 1998, and in the following five years the number of mobile phone users grew from virtually zero to well over half a million, an impressive penetration in a country with a population of 2 million. In 2011 Botswana recorded 142.82 cell-phone subscribers per 100 inhabitants, reflecting the highest cell-phone penetration rate in mainland sub-Saharan Africa. There is network coverage for almost the entire population, notwithstanding its large, sparsely populated territory.
Computer and internet use has also grown rapidly, from a low base, although the rate of growth is somewhat hindered by high costs. Internet penetration, with an estimated 7 users per 100 inhabitants, remains fairly low. However, this figure may well be an underestimate, given so many people now access the internet through smartphones. For instance, in May 2013 there were 301 240 Facebook users in Botswana – or 14.8 users per 100 population. The government has a programme of computerising all secondary schools with the objective of ensuring that all school leavers are computer literate.
Telephone and Internet Use, selected Countries (per 100 inhabitants, 2011)
CountryFixed line telephone
subscribers Cellphone
subscribersInternet users
BOTsWANA 7.37 142.82 7.0
Egypt 10.56 101.08 35.62
Mauritius 28.67 99.04 34.95
South Africa 8.18 126.83 21.00
Zambia 0.64 60.59 11.5
Canada 47.86 75.28 83.00
Trinidad & Tobago 21.69 135.57 55.20
USA 47.91 105.91 77.86
China 21.16 73.19 38.30
India 2.63 72.00 10.07
Source: International Telecommunications Union (ITU)
The telecommunications sector has been extensively liberalised since the late 1990s. The Telecommunications Policy adopted in 1995 called for the introduction of competition in the telecommunications sector, and this was followed by the enacting of the Telecommunications Act of 1996. Prior to that, the Botswana Telecommunications Corporation (BTC) was a monopoly with a mandate to provide all telecommunications services to all areas of the country. The implementation of the Telecommunications Act led to the creation of Botswana Telecommunications Authority (BTA), which in due course issued cellular licenses to Orange and Mascom, as well as Internet Services Provider (ISP) licenses and Data licenses. However, following the enactment of the Communications Regulatory Authority Act of 2012, which replaced both the Telecommunications Act and the Broadcasting Act, BTA and the National Broadcasting Board (NBB) where merged to form the Botswana Communications Regulatory Authority (BOCRA) in April 2013. BOCRA is now the sole regulator of the communications sector in Botswana, comprising
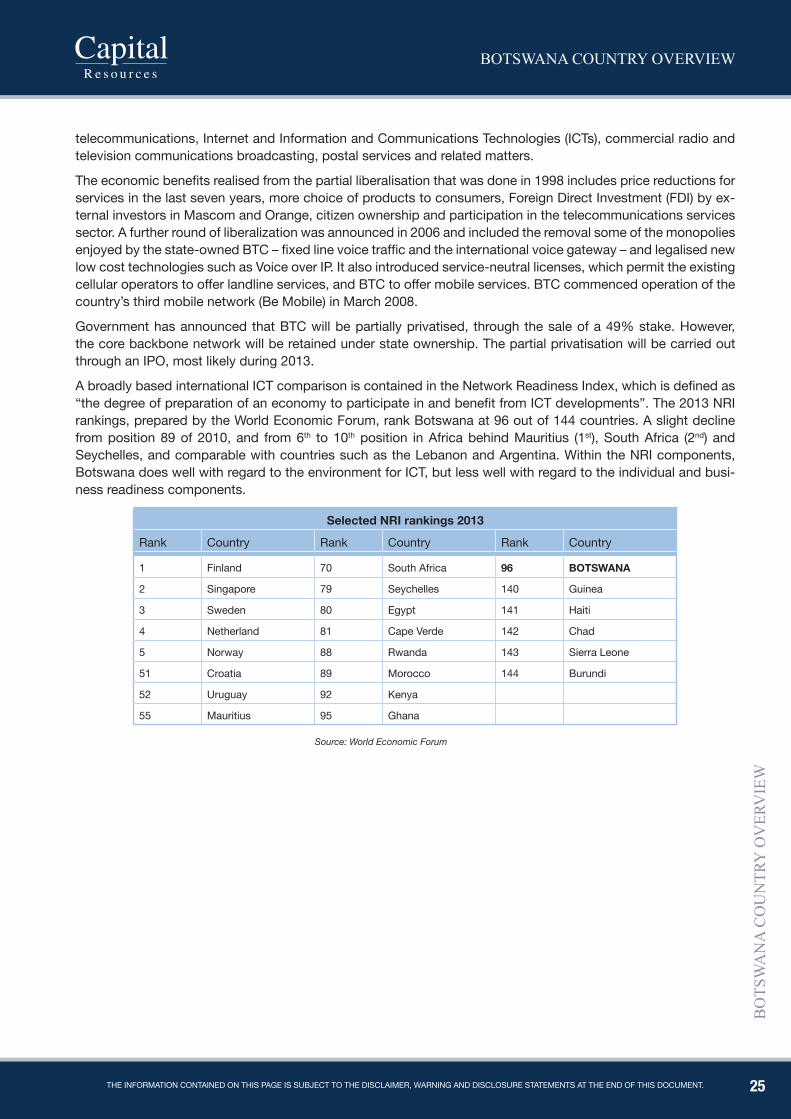
25
BOTSWANA COUNTRY OVERVIEW
BO
TSW
AN
A C
OU
NTR
Y O
VER
VIE
W
The informaTion conTained on This page is subjecT To The disclaimer, warning and disclosure sTaTemenTs aT The end of This documenT.
telecommunications, Internet and Information and Communications Technologies (ICTs), commercial radio and television communications broadcasting, postal services and related matters.
The economic benefits realised from the partial liberalisation that was done in 1998 includes price reductions for services in the last seven years, more choice of products to consumers, Foreign Direct Investment (FDI) by ex-ternal investors in Mascom and Orange, citizen ownership and participation in the telecommunications services sector. A further round of liberalization was announced in 2006 and included the removal some of the monopolies enjoyed by the state-owned BTC – fixed line voice traffic and the international voice gateway – and legalised new low cost technologies such as Voice over IP. It also introduced service-neutral licenses, which permit the existing cellular operators to offer landline services, and BTC to offer mobile services. BTC commenced operation of the country’s third mobile network (Be Mobile) in March 2008.
Government has announced that BTC will be partially privatised, through the sale of a 49% stake. However, the core backbone network will be retained under state ownership. The partial privatisation will be carried out through an IPO, most likely during 2013.
A broadly based international ICT comparison is contained in the Network Readiness Index, which is defined as “the degree of preparation of an economy to participate in and benefit from ICT developments”. The 2013 NRI rankings, prepared by the World Economic Forum, rank Botswana at 96 out of 144 countries. A slight decline from position 89 of 2010, and from 6th to 10th position in Africa behind Mauritius (1st), South Africa (2nd) and Seychelles, and comparable with countries such as the Lebanon and Argentina. Within the NRI components, Botswana does well with regard to the environment for ICT, but less well with regard to the individual and busi-ness readiness components.
selected NRI rankings 2013
Rank Country Rank Country Rank Country
1 Finland 70 South Africa 96 BOTsWANA
2 Singapore 79 Seychelles 140 Guinea
3 Sweden 80 Egypt 141 Haiti
4 Netherland 81 Cape Verde 142 Chad
5 Norway 88 Rwanda 143 Sierra Leone
51 Croatia 89 Morocco 144 Burundi
52 Uruguay 92 Kenya
55 Mauritius 95 Ghana
Source: World Economic Forum
26
BOTSWANA COUNTRY OVERVIEW
BO
TSW
AN
A C
OU
NTR
Y O
VER
VIE
W
The informaTion conTained on This page is subjecT To The disclaimer, warning and disclosure sTaTemenTs aT The end of This documenT.
ECONOmIC OVERVIEW
27
BOTSWANA COUNTRY OVERVIEW
BO
TSW
AN
A C
OU
NTR
Y O
VER
VIE
W
The informaTion conTained on This page is subjecT To The disclaimer, warning and disclosure sTaTemenTs aT The end of This documenT.
ECONOmIC STRUCTURE ANd GROWTh
Botswana has a well-deserved reputation as the best-performing economy in Africa over the past few decades, and indeed one of the better performing economies in the world. Over the thirty years between independence in 1966 and the mid-1990s, Botswana was the fastest-growing economy in the world, with average annual GDP growth rates of over 10%, faster than the better-known “tiger” economies of South East Asia. This prolonged growth took Botswana from being one of the poorest countries in the world in 1966 to middle-income status by the 1990s. Per capita income was estimated at US$9,400 in 2012, the fourth highest in sub-Saharan Africa (after the Equatorial Guinea, Gabon and the Seychelles).
This rapid growth has been built upon the foundation of the diamond mining industry, which since its com-mencement in the early 1970s, took Botswana to being the largest producer of diamonds, by value, in the world. Botswana’s four diamond mines are operated by Debswana, a 50-50 joint venture between the Botswana Gov-ernment and De Beers. Fortunately for both parties, diamond mining has been highly profitable, and revenues have provided the basis for rapidly growing exports, balance of payments surpluses, and government revenues that have been used to finance broad-based development expenditure. The allocation of revenues and profits between the Government and De Beers is determined on the basis of long-term agreements that run in parallel with the 25-year mining leases for the Debswana mines. Following the most recent negotiations for the renewal of the Jwaneng mining licence, the Government secured a significant increase in its share of the profits from Debswana’s diamond mines.
It is now generally accepted that the period of rapid diamond-led growth is over, and since the mid-1990s economic growth rates have been lower, although still respectable by international standards, with trend growth around 5% p.a. However, since the global financial crisis of 2008-9 and weak global market conditions, diamond production has been cut back, leading to negative real growth rates. As a result, by 2012, mining had been relegated to the fourth largest contributor to GDP (measured in constant (2006) prices), behind trade, finance and business services, and government. This clearly shows that the economy has become somewhat more diversified, with the non-mining private sector accounting for 69.6% of total value added in 2012, compared with only 48% a decade earlier.
The global financial and economic crisis of 2008-9 hit Botswana hard, as global diamond sales fell sharply. The temporary closure of the diamond mines in the first half of 2009 caused the economy to fall into recession, with GDP growth of minus 7.8% in 2009 as a whole, as well as budget and balance of payments deficits. On the bright side; the non-mining sector of the economy continued to grow steadily even as the mining sector stum-bled, growing at 9.7% and 7.5%in 2011 and 2012, respectively. The economy recovered strongly in 2010, as a recovery in diamond production helped to lift overall GDP growth to 8.6% for the year, although as the recovery slowed, GDP growth fell to 6.1% in 2011. However, in 2012 the economy’s growth slowed further, to 3.7%, due to an 8.1% contraction in mining output.
Government is the third largest sector of the economy (in constant prices), and is the largest single employer. Government spending is, however, largely dependent upon mineral revenues. In 2012, the fastest growing sec-tors of the economy were construction, social and personal services and finance and business services. There was also rapid construction growth, largely driven by the expansion of power generation capacity and the con-struction of new mines. The water and electricity sector was the biggest loser in 2012, contracting by 41%, due mainly to negative value added created in the electricity sub-sector.
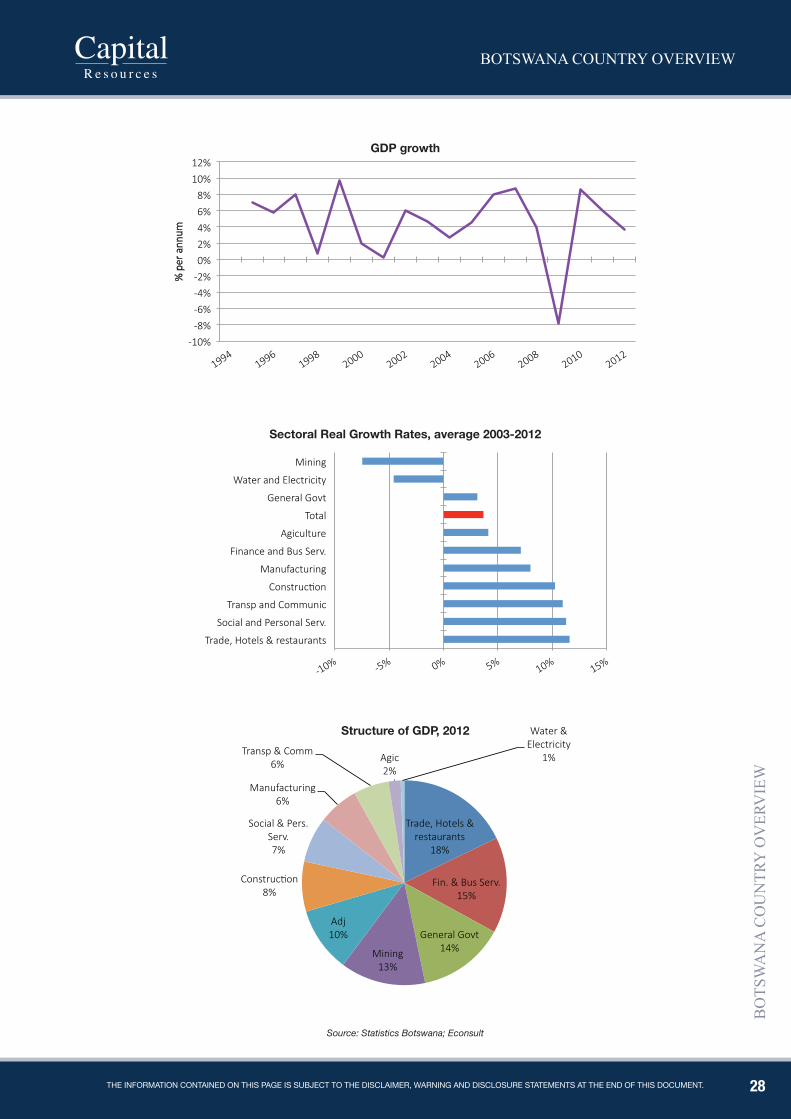
28
BOTSWANA COUNTRY OVERVIEW
BO
TSW
AN
A C
OU
NTR
Y O
VER
VIE
W
The informaTion conTained on This page is subjecT To The disclaimer, warning and disclosure sTaTemenTs aT The end of This documenT.
Source: Statistics Botswana; Econsult
GDp growth
sectoral Real Growth Rates, average 2003-2012
structure of GDp, 2012
29
BOTSWANA COUNTRY OVERVIEW
BO
TSW
AN
A C
OU
NTR
Y O
VER
VIE
W
The informaTion conTained on This page is subjecT To The disclaimer, warning and disclosure sTaTemenTs aT The end of This documenT.
ECONOMIC DIVERsIFICATION AND ThE pOlICY FRAMEWORKOver the past two decades there has been much emphasis on diversifying the economy “beyond and away from dependence upon diamonds”, through stimulating new sources of economic activity and growth that can take the economy forward in the coming decades. There are several reasons for the emphasis on diversification:
• diamond production from Debswana’s main mines has peaked, and as a result is unlikely to contribute significantly to economic growth going forward;
• current levels of diamond production can be maintained for another 10-15 years on the basis of known deposits, but thereafter production will begin to decline;
• although new diamond deposits have been discovered and new mines are likely to open, they are relatively small compared to the existing mines;
• a high level of dependence upon a single commodity increases vulnerability to volatile commodity prices, the fickle fashion and luxury goods market, and the potential risk of a consumer boycott of diamonds. The risks of dependence were sharply illustrated by the global financial and economic crisis, which caused diamond sales to go drop sharply, thereby reducing exports and fiscal revenues;
• the diamond mining industry is capital intensive, and hence its contribution to employment is much less than its contribution to output; unemployment is a serious problem, and is one of the main contributors to a poverty rate of around 20% of the population; hence job creation is a major priority;
• the government budget is highly dependent upon mineral revenues, and with the slowing down of mineral revenue growth, has come under pressure in recent years; this is also the result of the expenditure commitments needed to deal with HIV/AIDS, as well as other ongoing development needs with regard to education, infrastructure etc.;
• Similarly for the balance of payments, new sources of export revenue are required as diamond production peaks and eventually declines.
The policy framework has therefore focused on economic diversification in recent years. It was initially anticipated that export-led manufacturing would be the main driver of diversification, and the sector was supported with special incentives in the form of tax concessions and subsidies. However, this has not proven to be particularly successful, and although manufacturing has enjoyed periods of steady growth, there have also been reversals and its share of GDP has remained below 5%. Many of the enterprises set up as a result of targeted incentives have not proved to be sustainable.
The broad idea of export-led diversification remains important; indeed Botswana has no choice but to diversify if income and employment growth are to be sustained in the face of slowing growth of diamond revenues. And diversification has to be export-led; while it is the case that any dynamic and growing economy has to be increasingly integrated with the global economy, it is particularly important for those, like Botswana, with small domestic markets.
Diversification is now seen as resulting from the growth of a range of economic activities that can take the econ-omy beyond diamond dependency, rather than from one single sector that can alone take over from diamonds as the engine of growth. Activities that are now seen as potential candidates for such growth include financial and business services, tourism, as well as some manufacturing and agricultural activities. It is also recognised that diversification within the mining sector is an important part of the broader diversification process, as new and expanded mining activities help to supplement diamond mining. Recent attention has been focused on Botswana’s large coal resources, which could be exploited to help the gap that will be left by reduced diamond output .
Diversification also involves building on the base established by the diamond mining industry by promoting downstream activities in the diamond industry. This includes the establishment of diamond cutting and polishing activities; the relocation of De Beers’ Diamond Trading Company International (DTCI) from London to Gaborone; and the establishment of various diamond marketing channels outside of the DTC by both new diamond mining companies and the Government.
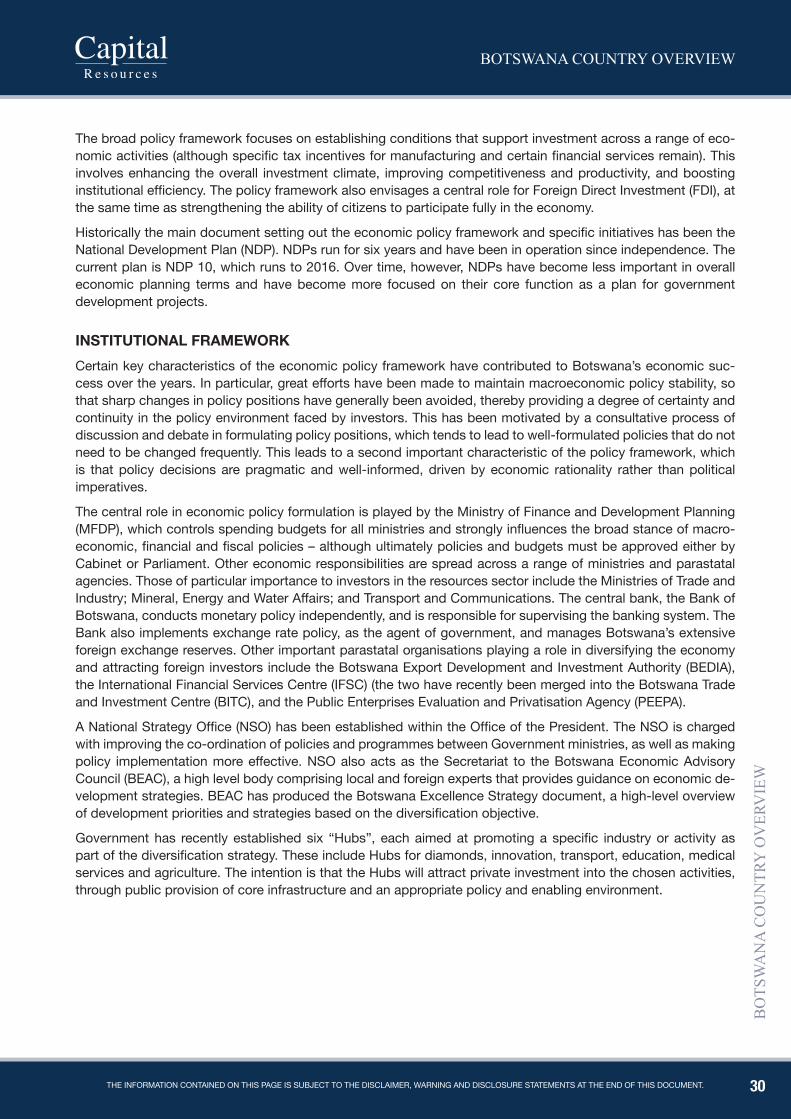
30
BOTSWANA COUNTRY OVERVIEW
BO
TSW
AN
A C
OU
NTR
Y O
VER
VIE
W
The informaTion conTained on This page is subjecT To The disclaimer, warning and disclosure sTaTemenTs aT The end of This documenT.
The broad policy framework focuses on establishing conditions that support investment across a range of eco-nomic activities (although specific tax incentives for manufacturing and certain financial services remain). This involves enhancing the overall investment climate, improving competitiveness and productivity, and boosting institutional efficiency. The policy framework also envisages a central role for Foreign Direct Investment (FDI), at the same time as strengthening the ability of citizens to participate fully in the economy.
Historically the main document setting out the economic policy framework and specific initiatives has been the National Development Plan (NDP). NDPs run for six years and have been in operation since independence. The current plan is NDP 10, which runs to 2016. Over time, however, NDPs have become less important in overall economic planning terms and have become more focused on their core function as a plan for government development projects.
INsTITUTIONAl FRAMEWORK Certain key characteristics of the economic policy framework have contributed to Botswana’s economic suc-cess over the years. In particular, great efforts have been made to maintain macroeconomic policy stability, so that sharp changes in policy positions have generally been avoided, thereby providing a degree of certainty and continuity in the policy environment faced by investors. This has been motivated by a consultative process of discussion and debate in formulating policy positions, which tends to lead to well-formulated policies that do not need to be changed frequently. This leads to a second important characteristic of the policy framework, which is that policy decisions are pragmatic and well-informed, driven by economic rationality rather than political imperatives.
The central role in economic policy formulation is played by the Ministry of Finance and Development Planning (MFDP), which controls spending budgets for all ministries and strongly influences the broad stance of macro-economic, financial and fiscal policies – although ultimately policies and budgets must be approved either by Cabinet or Parliament. Other economic responsibilities are spread across a range of ministries and parastatal agencies. Those of particular importance to investors in the resources sector include the Ministries of Trade and Industry; Mineral, Energy and Water Affairs; and Transport and Communications. The central bank, the Bank of Botswana, conducts monetary policy independently, and is responsible for supervising the banking system. The Bank also implements exchange rate policy, as the agent of government, and manages Botswana’s extensive foreign exchange reserves. Other important parastatal organisations playing a role in diversifying the economy and attracting foreign investors include the Botswana Export Development and Investment Authority (BEDIA), the International Financial Services Centre (IFSC) (the two have recently been merged into the Botswana Trade and Investment Centre (BITC), and the Public Enterprises Evaluation and Privatisation Agency (PEEPA).
A National Strategy Office (NSO) has been established within the Office of the President. The NSO is charged with improving the co-ordination of policies and programmes between Government ministries, as well as making policy implementation more effective. NSO also acts as the Secretariat to the Botswana Economic Advisory Council (BEAC), a high level body comprising local and foreign experts that provides guidance on economic de-velopment strategies. BEAC has produced the Botswana Excellence Strategy document, a high-level overview of development priorities and strategies based on the diversification objective.
Government has recently established six “Hubs”, each aimed at promoting a specific industry or activity as part of the diversification strategy. These include Hubs for diamonds, innovation, transport, education, medical services and agriculture. The intention is that the Hubs will attract private investment into the chosen activities, through public provision of core infrastructure and an appropriate policy and enabling environment.
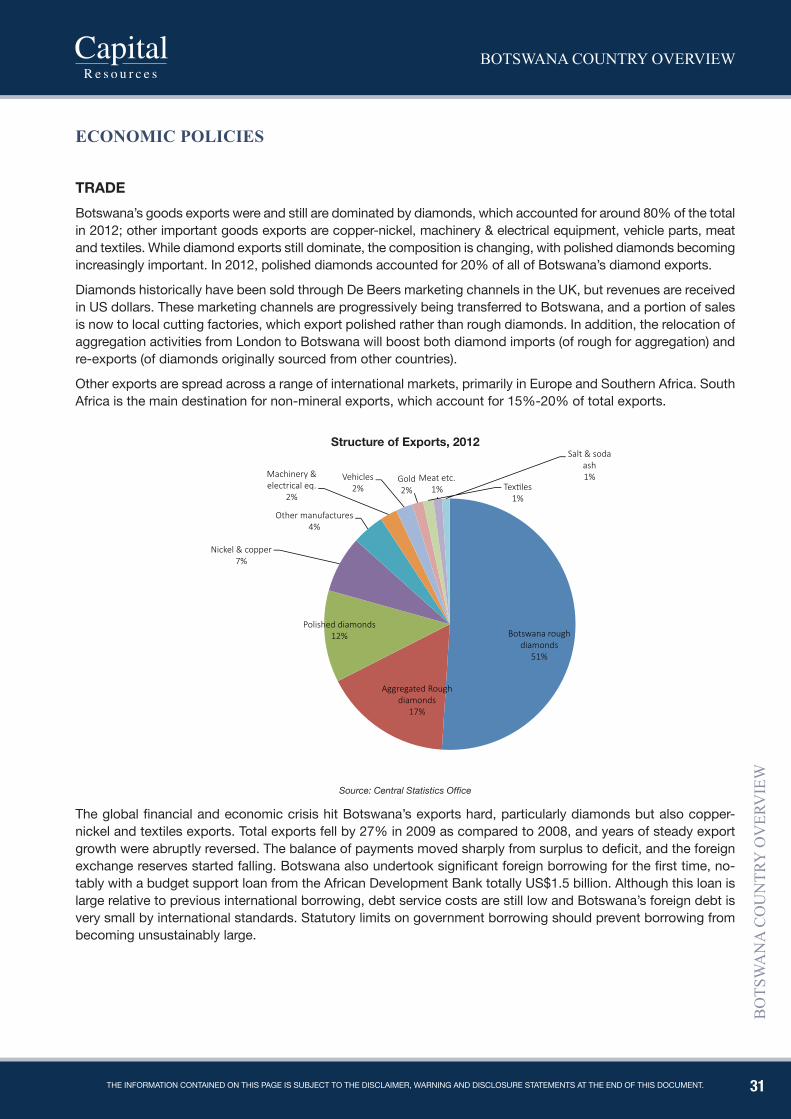
31
BOTSWANA COUNTRY OVERVIEW
BO
TSW
AN
A C
OU
NTR
Y O
VER
VIE
W
The informaTion conTained on This page is subjecT To The disclaimer, warning and disclosure sTaTemenTs aT The end of This documenT.
ECONOmIC pOLICIES
TRADEBotswana’s goods exports were and still are dominated by diamonds, which accounted for around 80% of the total in 2012; other important goods exports are copper-nickel, machinery & electrical equipment, vehicle parts, meat and textiles. While diamond exports still dominate, the composition is changing, with polished diamonds becoming increasingly important. In 2012, polished diamonds accounted for 20% of all of Botswana’s diamond exports.
Diamonds historically have been sold through De Beers marketing channels in the UK, but revenues are received in US dollars. These marketing channels are progressively being transferred to Botswana, and a portion of sales is now to local cutting factories, which export polished rather than rough diamonds. In addition, the relocation of aggregation activities from London to Botswana will boost both diamond imports (of rough for aggregation) and re-exports (of diamonds originally sourced from other countries).
Other exports are spread across a range of international markets, primarily in Europe and Southern Africa. South Africa is the main destination for non-mineral exports, which account for 15%-20% of total exports.
Source: Central Statistics Office
The global financial and economic crisis hit Botswana’s exports hard, particularly diamonds but also copper-nickel and textiles exports. Total exports fell by 27% in 2009 as compared to 2008, and years of steady export growth were abruptly reversed. The balance of payments moved sharply from surplus to deficit, and the foreign exchange reserves started falling. Botswana also undertook significant foreign borrowing for the first time, no-tably with a budget support loan from the African Development Bank totally US$1.5 billion. Although this loan is large relative to previous international borrowing, debt service costs are still low and Botswana’s foreign debt is very small by international standards. Statutory limits on government borrowing should prevent borrowing from becoming unsustainably large.
structure of Exports, 2012
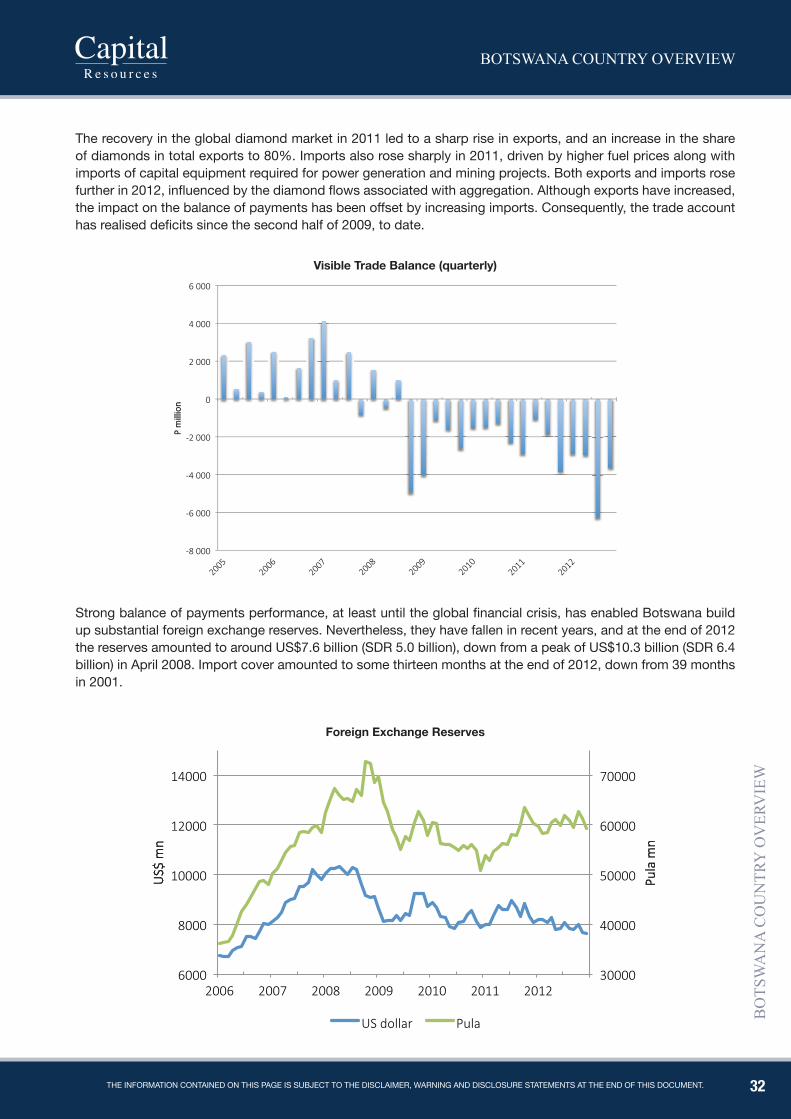
32
BOTSWANA COUNTRY OVERVIEW
BO
TSW
AN
A C
OU
NTR
Y O
VER
VIE
W
The informaTion conTained on This page is subjecT To The disclaimer, warning and disclosure sTaTemenTs aT The end of This documenT.
The recovery in the global diamond market in 2011 led to a sharp rise in exports, and an increase in the share of diamonds in total exports to 80%. Imports also rose sharply in 2011, driven by higher fuel prices along with imports of capital equipment required for power generation and mining projects. Both exports and imports rose further in 2012, influenced by the diamond flows associated with aggregation. Although exports have increased, the impact on the balance of payments has been offset by increasing imports. Consequently, the trade account has realised deficits since the second half of 2009, to date.
Strong balance of payments performance, at least until the global financial crisis, has enabled Botswana build up substantial foreign exchange reserves. Nevertheless, they have fallen in recent years, and at the end of 2012 the reserves amounted to around US$7.6 billion (SDR 5.0 billion), down from a peak of US$10.3 billion (SDR 6.4 billion) in April 2008. Import cover amounted to some thirteen months at the end of 2012, down from 39 months in 2001.
Visible Trade Balance (quarterly)
Foreign Exchange Reserves
33
BOTSWANA COUNTRY OVERVIEW
BO
TSW
AN
A C
OU
NTR
Y O
VER
VIE
W
The informaTion conTained on This page is subjecT To The disclaimer, warning and disclosure sTaTemenTs aT The end of This documenT.
Botswana is a signatory to numerous regional and international trade agreements. Perhaps the most important of these is the Southern African Customs Union (SACU), under which Botswana enjoys free trade with South Africa, giving access to this large and important regional market. South African products can also be imported duty free into Botswana, although VAT is payable at the border. As a result, the majority of Botswana’s imports come from South Africa. Botswana is also a member of the SADC Free Trade Area (FTA) which was launched in August 2008. Under the SADC FTA most goods produced in the region can enter member countries free of customs duties. Botswana is a member of the World Trade Organisation (WTO), and in 2008 entered into an interim Economic Partnership Agreement (EPA) with the European Union.
The favourable balance of payments position over many years has encouraged the pursuit of a liberal trade policy, with minimal controls on imports and exports. Although there are no tariffs on trade with South Africa, SACU tariffs apply to imports from the rest of the world; however, these have been reduced steadily in recent years as the region becomes more integrated into the world economy and in line with WTO commitments.
CURRENCY AND ExChANGE RATEsThere are no exchange controls in Botswana. Profits can be freely remitted and capital moved in and out of the country without restriction.
The currency of Botswana is the pula (the Setswana word for rain), which is divided into 100 thebe.
The pula has a crawling peg exchange rate and is tied to a basket of currencies comprising the South African rand and the Special Drawing Right (SDR, itself a currency basket, comprising the US dollar, euro, British pound and Japanese yen). In a bid to promote transparency, in the 2013 Budget the Government disclosed the Pula’s rate of crawl and the weights of the currencies that make up the Pula basket. The rate of crawl is -0.16% per an-num, while the Rand makes 55% of the Pula basket and the SDR 45%. As a result of the composition of the pula basket, the exchange rate is heavily influenced by movements of the SA rand against the US dollar. This in turn can have a major impact on resource companies, which tend to export in dollars but have costs denominated in pula or rand. Also because of the operation of the basket, movements of the pula against the rand and the US dollar tend to be in opposite directions and hence on an economy-wide basis, the fluctuations in the exchange rates of the pula against the rand and other currencies tend to balance each other out.
The exchange rate is managed by the government and the Bank of Botswana with the objective of ensuring the overall international competitiveness of the economy. As diamond exports grew in the 1980s and 1990s this objective was pursued by preventing the undue appreciation of the pula, which would have resulted from rising foreign currency earnings if the exchange rate had been market-determined. The aim was to minimise the potential adverse impact of the “Dutch Disease”, which is where currency appreciation as a result of growing mineral exports tends to undermine the competitiveness of non-mineral economic activities, thus deepening dependence on minerals. Instead of allowing currency appreciation, the Botswana authorities chose to run bal-ance of payment surpluses and accumulate foreign exchange reserves.
Notwithstanding this policy objective, there has been concern about appreciation of the real exchange rate of the pula (where the exchange rate is adjusted to take account of relative inflation rates in Botswana and its trading partners), which indicates a deterioration of Botswana’s overall international competitiveness. Such concerns led to a 7.5% devaluation of the pula in February 2004 and a further 12% devaluation in May 2005. The second devaluation was accompanied by a switch from a fixed peg to a crawling peg exchange rate regime. The idea of the crawling peg is that the exchange rate will be adjusted on a gradual basis in order to prevent further competi-tiveness problems from emerging. This should remove the need for any substantial devaluations in future, and provide greater certainty in investment planning. The crawling peg involves a gradual depreciation of the pula against the basket, with the rate of crawl related to the difference between Botswana inflation and the average inflation rate of trading partners. The introduction of the crawling peg regime has been successful in keeping the real exchange rate relatively stable.
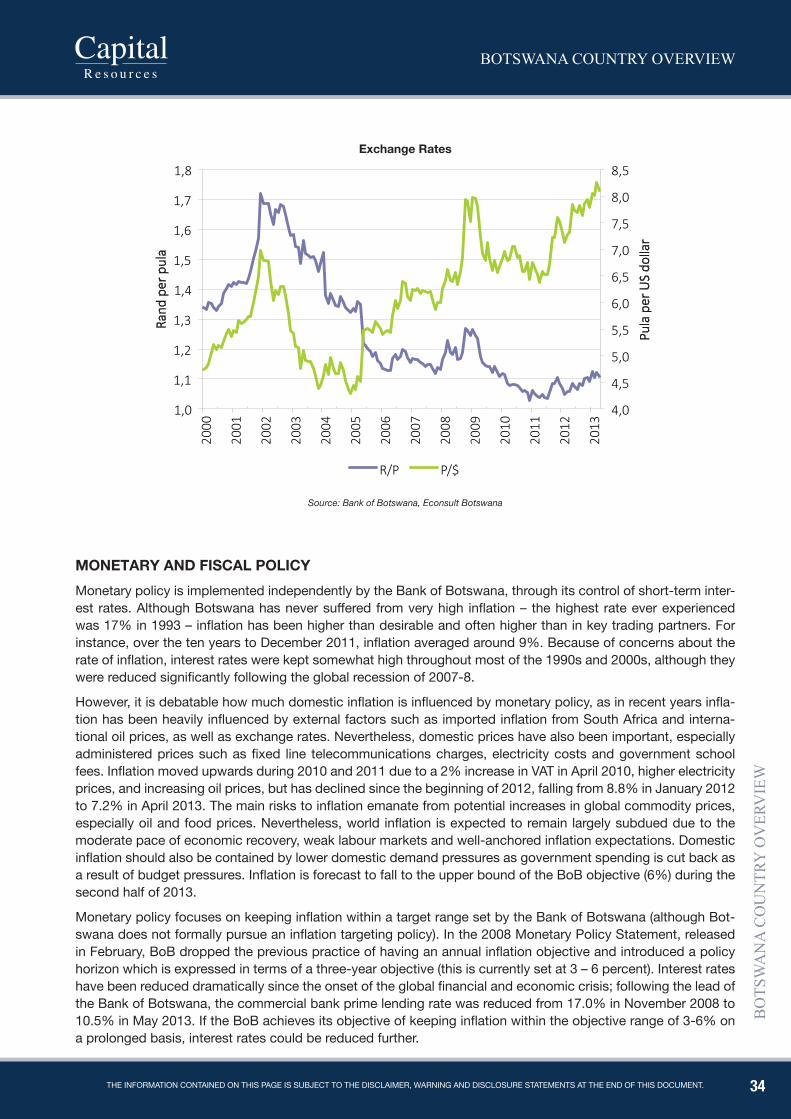
34
BOTSWANA COUNTRY OVERVIEW
BO
TSW
AN
A C
OU
NTR
Y O
VER
VIE
W
The informaTion conTained on This page is subjecT To The disclaimer, warning and disclosure sTaTemenTs aT The end of This documenT.
Source: Bank of Botswana, Econsult Botswana
MONETARY AND FIsCAl pOlICYMonetary policy is implemented independently by the Bank of Botswana, through its control of short-term inter-est rates. Although Botswana has never suffered from very high inflation – the highest rate ever experienced was 17% in 1993 – inflation has been higher than desirable and often higher than in key trading partners. For instance, over the ten years to December 2011, inflation averaged around 9%. Because of concerns about the rate of inflation, interest rates were kept somewhat high throughout most of the 1990s and 2000s, although they were reduced significantly following the global recession of 2007-8.
However, it is debatable how much domestic inflation is influenced by monetary policy, as in recent years infla-tion has been heavily influenced by external factors such as imported inflation from South Africa and interna-tional oil prices, as well as exchange rates. Nevertheless, domestic prices have also been important, especially administered prices such as fixed line telecommunications charges, electricity costs and government school fees. Inflation moved upwards during 2010 and 2011 due to a 2% increase in VAT in April 2010, higher electricity prices, and increasing oil prices, but has declined since the beginning of 2012, falling from 8.8% in January 2012 to 7.2% in April 2013. The main risks to inflation emanate from potential increases in global commodity prices, especially oil and food prices. Nevertheless, world inflation is expected to remain largely subdued due to the moderate pace of economic recovery, weak labour markets and well-anchored inflation expectations. Domestic inflation should also be contained by lower domestic demand pressures as government spending is cut back as a result of budget pressures. Inflation is forecast to fall to the upper bound of the BoB objective (6%) during the second half of 2013.
Monetary policy focuses on keeping inflation within a target range set by the Bank of Botswana (although Bot-swana does not formally pursue an inflation targeting policy). In the 2008 Monetary Policy Statement, released in February, BoB dropped the previous practice of having an annual inflation objective and introduced a policy horizon which is expressed in terms of a three-year objective (this is currently set at 3 – 6 percent). Interest rates have been reduced dramatically since the onset of the global financial and economic crisis; following the lead of the Bank of Botswana, the commercial bank prime lending rate was reduced from 17.0% in November 2008 to 10.5% in May 2013. If the BoB achieves its objective of keeping inflation within the objective range of 3-6% on a prolonged basis, interest rates could be reduced further.
Exchange Rates
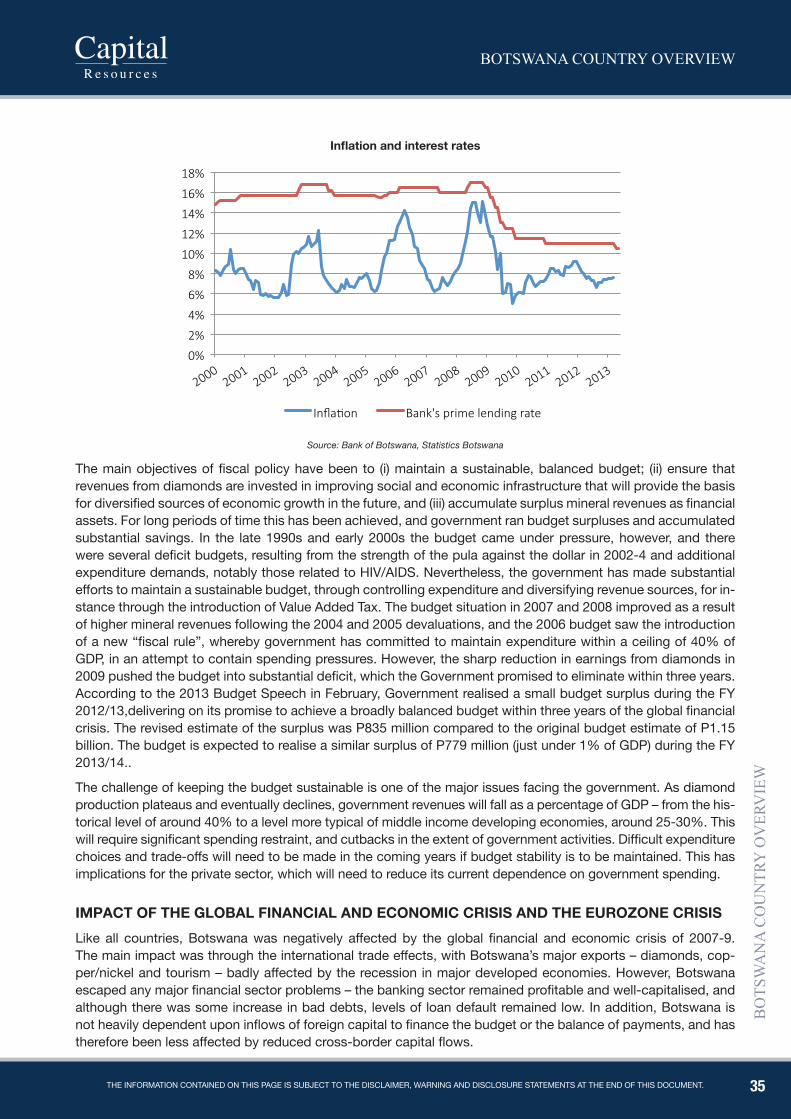
35
BOTSWANA COUNTRY OVERVIEW
BO
TSW
AN
A C
OU
NTR
Y O
VER
VIE
W
The informaTion conTained on This page is subjecT To The disclaimer, warning and disclosure sTaTemenTs aT The end of This documenT.
Source: Bank of Botswana, Statistics Botswana
The main objectives of fiscal policy have been to (i) maintain a sustainable, balanced budget; (ii) ensure that revenues from diamonds are invested in improving social and economic infrastructure that will provide the basis for diversified sources of economic growth in the future, and (iii) accumulate surplus mineral revenues as financial assets. For long periods of time this has been achieved, and government ran budget surpluses and accumulated substantial savings. In the late 1990s and early 2000s the budget came under pressure, however, and there were several deficit budgets, resulting from the strength of the pula against the dollar in 2002-4 and additional expenditure demands, notably those related to HIV/AIDS. Nevertheless, the government has made substantial efforts to maintain a sustainable budget, through controlling expenditure and diversifying revenue sources, for in-stance through the introduction of Value Added Tax. The budget situation in 2007 and 2008 improved as a result of higher mineral revenues following the 2004 and 2005 devaluations, and the 2006 budget saw the introduction of a new “fiscal rule”, whereby government has committed to maintain expenditure within a ceiling of 40% of GDP, in an attempt to contain spending pressures. However, the sharp reduction in earnings from diamonds in 2009 pushed the budget into substantial deficit, which the Government promised to eliminate within three years. According to the 2013 Budget Speech in February, Government realised a small budget surplus during the FY 2012/13,delivering on its promise to achieve a broadly balanced budget within three years of the global financial crisis. The revised estimate of the surplus was P835 million compared to the original budget estimate of P1.15 billion. The budget is expected to realise a similar surplus of P779 million (just under 1% of GDP) during the FY 2013/14..
The challenge of keeping the budget sustainable is one of the major issues facing the government. As diamond production plateaus and eventually declines, government revenues will fall as a percentage of GDP – from the his-torical level of around 40% to a level more typical of middle income developing economies, around 25-30%. This will require significant spending restraint, and cutbacks in the extent of government activities. Difficult expenditure choices and trade-offs will need to be made in the coming years if budget stability is to be maintained. This has implications for the private sector, which will need to reduce its current dependence on government spending.
IMpACT OF ThE GlOBAl FINANCIAl AND ECONOMIC CRIsIs AND ThE EUROzONE CRIsIsLike all countries, Botswana was negatively affected by the global financial and economic crisis of 2007-9. The main impact was through the international trade effects, with Botswana’s major exports – diamonds, cop-per/nickel and tourism – badly affected by the recession in major developed economies. However, Botswana escaped any major financial sector problems – the banking sector remained profitable and well-capitalised, and although there was some increase in bad debts, levels of loan default remained low. In addition, Botswana is not heavily dependent upon inflows of foreign capital to finance the budget or the balance of payments, and has therefore been less affected by reduced cross-border capital flows.
Inflation and interest rates
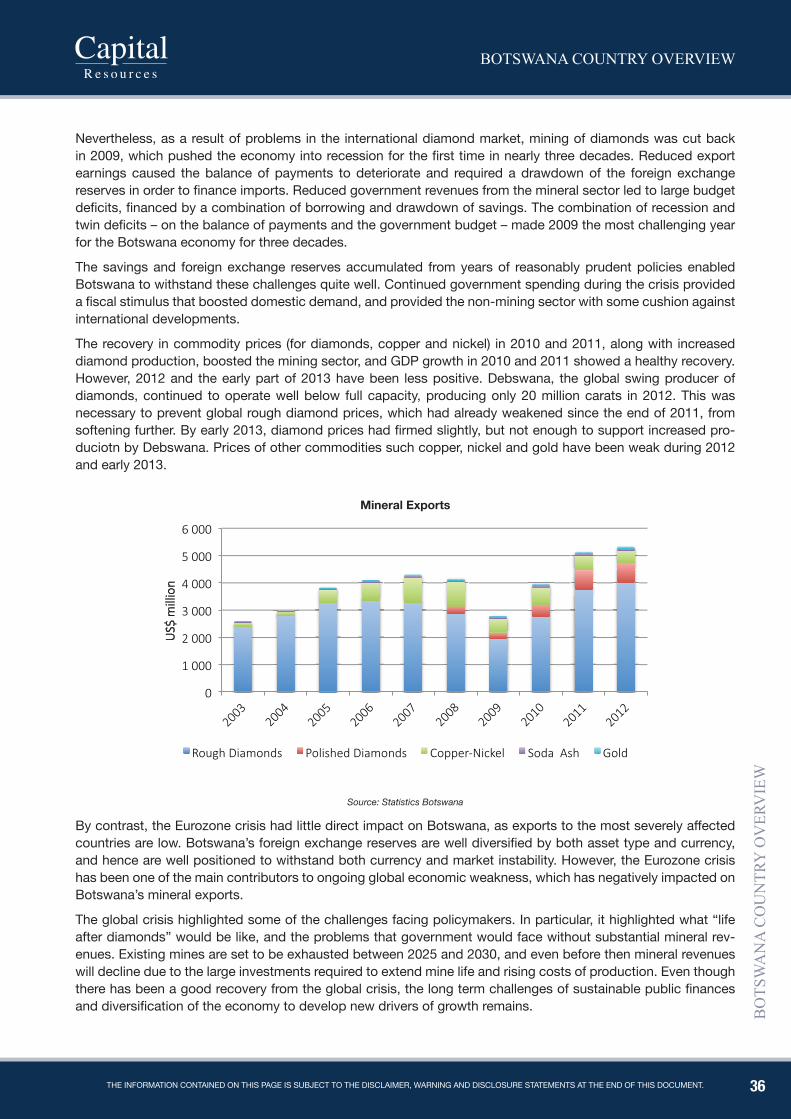
36
BOTSWANA COUNTRY OVERVIEW
BO
TSW
AN
A C
OU
NTR
Y O
VER
VIE
W
The informaTion conTained on This page is subjecT To The disclaimer, warning and disclosure sTaTemenTs aT The end of This documenT.
Nevertheless, as a result of problems in the international diamond market, mining of diamonds was cut back in 2009, which pushed the economy into recession for the first time in nearly three decades. Reduced export earnings caused the balance of payments to deteriorate and required a drawdown of the foreign exchange reserves in order to finance imports. Reduced government revenues from the mineral sector led to large budget deficits, financed by a combination of borrowing and drawdown of savings. The combination of recession and twin deficits – on the balance of payments and the government budget – made 2009 the most challenging year for the Botswana economy for three decades.
The savings and foreign exchange reserves accumulated from years of reasonably prudent policies enabled Botswana to withstand these challenges quite well. Continued government spending during the crisis provided a fiscal stimulus that boosted domestic demand, and provided the non-mining sector with some cushion against international developments.
The recovery in commodity prices (for diamonds, copper and nickel) in 2010 and 2011, along with increased diamond production, boosted the mining sector, and GDP growth in 2010 and 2011 showed a healthy recovery. However, 2012 and the early part of 2013 have been less positive. Debswana, the global swing producer of diamonds, continued to operate well below full capacity, producing only 20 million carats in 2012. This was necessary to prevent global rough diamond prices, which had already weakened since the end of 2011, from softening further. By early 2013, diamond prices had firmed slightly, but not enough to support increased pro-duciotn by Debswana. Prices of other commodities such copper, nickel and gold have been weak during 2012 and early 2013.
Source: Statistics Botswana
By contrast, the Eurozone crisis had little direct impact on Botswana, as exports to the most severely affected countries are low. Botswana’s foreign exchange reserves are well diversified by both asset type and currency, and hence are well positioned to withstand both currency and market instability. However, the Eurozone crisis has been one of the main contributors to ongoing global economic weakness, which has negatively impacted on Botswana’s mineral exports.
The global crisis highlighted some of the challenges facing policymakers. In particular, it highlighted what “life after diamonds” would be like, and the problems that government would face without substantial mineral rev-enues. Existing mines are set to be exhausted between 2025 and 2030, and even before then mineral revenues will decline due to the large investments required to extend mine life and rising costs of production. Even though there has been a good recovery from the global crisis, the long term challenges of sustainable public finances and diversification of the economy to develop new drivers of growth remains.
Mineral Exports
37
BOTSWANA COUNTRY OVERVIEW
BO
TSW
AN
A C
OU
NTR
Y O
VER
VIE
W
The informaTion conTained on This page is subjecT To The disclaimer, warning and disclosure sTaTemenTs aT The end of This documenT.
ECONOmIC ASSESSmENTS OF BOTSWANA
CREDIT RATINGsBotswana’s economic successes over many years have been reflected by various international assessments of the economy. Perhaps the most important of these have been the annual assessments carried out by the credit rating agencies, Moody’s and Standard and Poors (S&P), since 2001. Both agencies have given Botswana investment grade ratings, and Botswana has enjoyed the highest credit ratings in Africa for several years. The relatively high ratings reflect Botswana’s strong financial position, a well managed growing economy and political stability. The agencies have been positive about the progress made in implementing economic reforms necessary to diversify the economy. However, the ratings have been constrained by several factors including, in particular, the narrow economic base that is still heavily reliant on mining as a source of additional growth and government revenue, as well as the fiscal pressures associated with the costs of tackling the HIV/AIDS pandemic.
The ratings were, however, negatively affected by the impact of the global crisis, particularly deteriorating public finances. Botswana’s credit ratings from Moody’s for foreign and domestic currency government debt issues are both rated at A2, but the outlook was revised from “stable” to “negative” in February 2010. S&P downgraded Botswana’s rating by one notch at the same time. However, in November 2011, Moodys upgraded the outlook back to stable, reflecting the improvement in public finances and the considerable efforts that had been made in eliminating the budget deficit.
The table below shows 2013 country credit ratings from Moody’s for long-term domestic currency debt. Bot-swana is rated the same as Poland and Slovakia, and has a higher credit rating than Brazil, Spain, Hungary, Malaysia, Russia and South Africa.
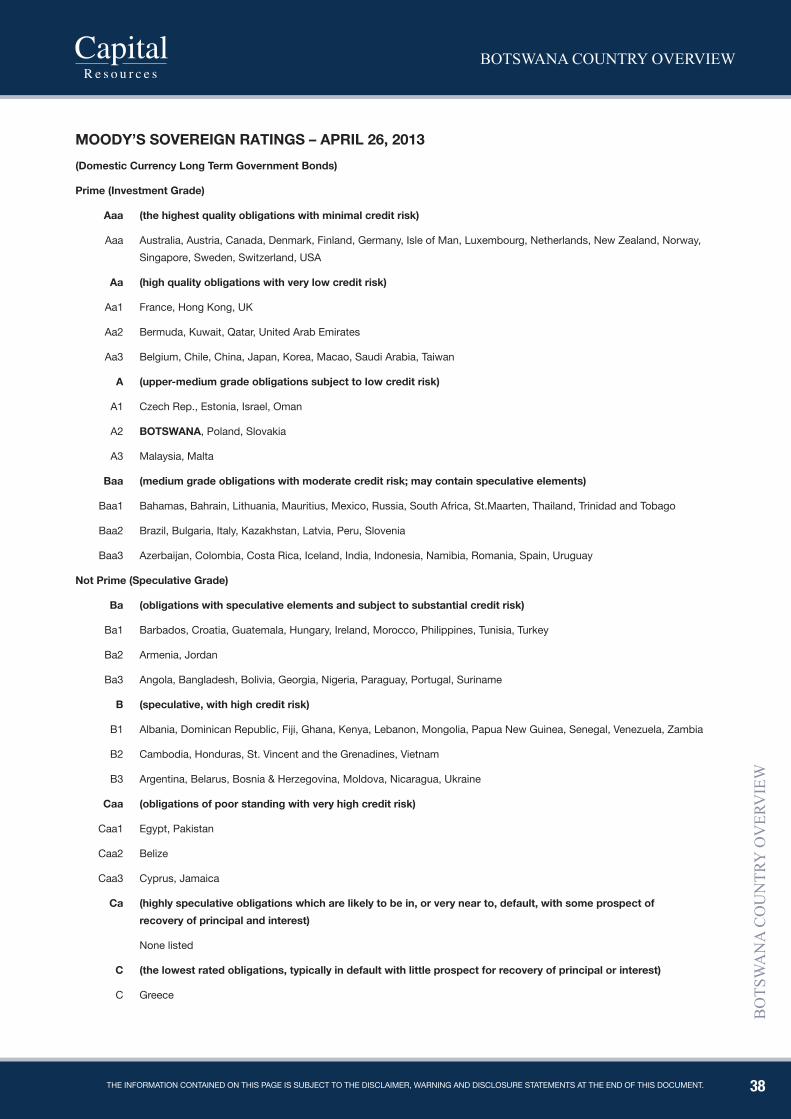
38
BOTSWANA COUNTRY OVERVIEW
BO
TSW
AN
A C
OU
NTR
Y O
VER
VIE
W
The informaTion conTained on This page is subjecT To The disclaimer, warning and disclosure sTaTemenTs aT The end of This documenT.
MOODY’s sOVEREIGN RATINGs – ApRIl 26, 2013(Domestic Currency long Term Government Bonds)
prime (Investment Grade)
Aaa (the highest quality obligations with minimal credit risk)
Aaa Australia, Austria, Canada, Denmark, Finland, Germany, Isle of Man, Luxembourg, Netherlands, New Zealand, Norway, Singapore, Sweden, Switzerland, USA
Aa (high quality obligations with very low credit risk)
Aa1 France, Hong Kong, UK
Aa2 Bermuda, Kuwait, Qatar, United Arab Emirates
Aa3 Belgium, Chile, China, Japan, Korea, Macao, Saudi Arabia, Taiwan
A (upper-medium grade obligations subject to low credit risk)
A1 Czech Rep., Estonia, Israel, Oman
A2 BOTsWANA, Poland, Slovakia
A3 Malaysia, Malta
Baa (medium grade obligations with moderate credit risk; may contain speculative elements)
Baa1 Bahamas, Bahrain, Lithuania, Mauritius, Mexico, Russia, South Africa, St.Maarten, Thailand, Trinidad and Tobago
Baa2 Brazil, Bulgaria, Italy, Kazakhstan, Latvia, Peru, Slovenia
Baa3 Azerbaijan, Colombia, Costa Rica, Iceland, India, Indonesia, Namibia, Romania, Spain, Uruguay
Not prime (speculative Grade)
Ba (obligations with speculative elements and subject to substantial credit risk)
Ba1 Barbados, Croatia, Guatemala, Hungary, Ireland, Morocco, Philippines, Tunisia, Turkey
Ba2 Armenia, Jordan
Ba3 Angola, Bangladesh, Bolivia, Georgia, Nigeria, Paraguay, Portugal, Suriname
B (speculative, with high credit risk)
B1 Albania, Dominican Republic, Fiji, Ghana, Kenya, Lebanon, Mongolia, Papua New Guinea, Senegal, Venezuela, Zambia
B2 Cambodia, Honduras, St. Vincent and the Grenadines, Vietnam
B3 Argentina, Belarus, Bosnia & Herzegovina, Moldova, Nicaragua, Ukraine
Caa (obligations of poor standing with very high credit risk)
Caa1 Egypt, Pakistan
Caa2 Belize
Caa3 Cyprus, Jamaica
Ca (highly speculative obligations which are likely to be in, or very near to, default, with some prospect of recovery of principal and interest)
None listed
C (the lowest rated obligations, typically in default with little prospect for recovery of principal or interest)
C Greece
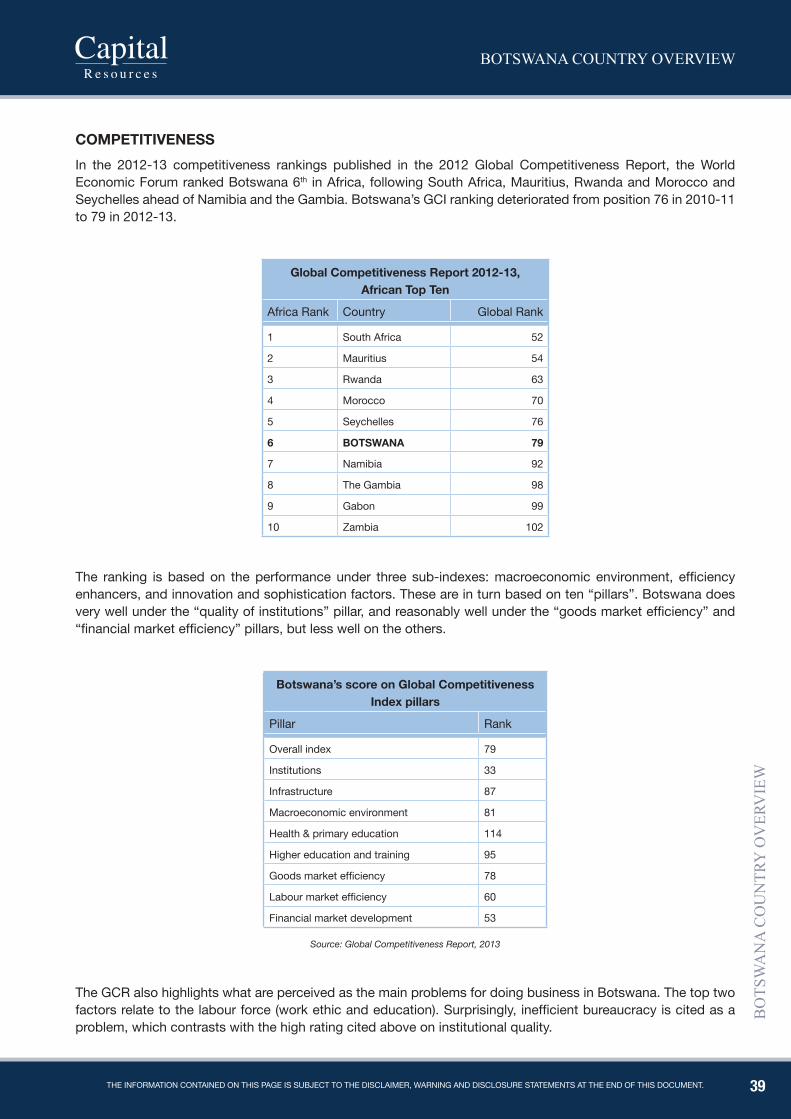
39
BOTSWANA COUNTRY OVERVIEW
BO
TSW
AN
A C
OU
NTR
Y O
VER
VIE
W
The informaTion conTained on This page is subjecT To The disclaimer, warning and disclosure sTaTemenTs aT The end of This documenT.
COMpETITIVENEssIn the 2012-13 competitiveness rankings published in the 2012 Global Competitiveness Report, the World Economic Forum ranked Botswana 6th in Africa, following South Africa, Mauritius, Rwanda and Morocco and Seychelles ahead of Namibia and the Gambia. Botswana’s GCI ranking deteriorated from position 76 in 2010-11 to 79 in 2012-13.
Global Competitiveness Report 2012-13, African Top Ten
Africa Rank Country Global Rank
1 South Africa 52
2 Mauritius 54
3 Rwanda 63
4 Morocco 70
5 Seychelles 76
6 BOTsWANA 79
7 Namibia 92
8 The Gambia 98
9 Gabon 99
10 Zambia 102
The ranking is based on the performance under three sub-indexes: macroeconomic environment, efficiency enhancers, and innovation and sophistication factors. These are in turn based on ten “pillars”. Botswana does very well under the “quality of institutions” pillar, and reasonably well under the “goods market efficiency” and “financial market efficiency” pillars, but less well on the others.
Botswana’s score on Global Competitiveness Index pillars
Pillar Rank
Overall index 79
Institutions 33
Infrastructure 87
Macroeconomic environment 81
Health & primary education 114
Higher education and training 95
Goods market efficiency 78
Labour market efficiency 60
Financial market development 53
Source: Global Competitiveness Report, 2013
The GCR also highlights what are perceived as the main problems for doing business in Botswana. The top two factors relate to the labour force (work ethic and education). Surprisingly, inefficient bureaucracy is cited as a problem, which contrasts with the high rating cited above on institutional quality.
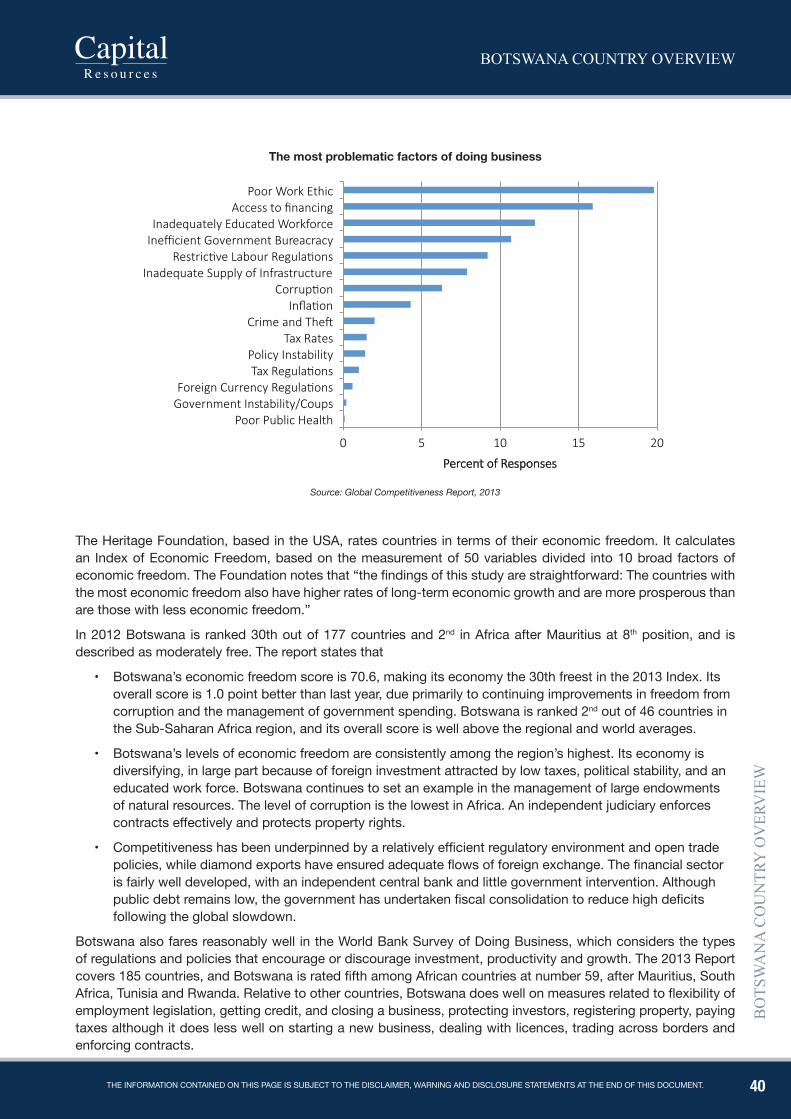
40
BOTSWANA COUNTRY OVERVIEW
BO
TSW
AN
A C
OU
NTR
Y O
VER
VIE
W
The informaTion conTained on This page is subjecT To The disclaimer, warning and disclosure sTaTemenTs aT The end of This documenT.
Source: Global Competitiveness Report, 2013
The Heritage Foundation, based in the USA, rates countries in terms of their economic freedom. It calculates an Index of Economic Freedom, based on the measurement of 50 variables divided into 10 broad factors of economic freedom. The Foundation notes that “the findings of this study are straightforward: The countries with the most economic freedom also have higher rates of long-term economic growth and are more prosperous than are those with less economic freedom.”
In 2012 Botswana is ranked 30th out of 177 countries and 2nd in Africa after Mauritius at 8th position, and is described as moderately free. The report states that
• Botswana’s economic freedom score is 70.6, making its economy the 30th freest in the 2013 Index. Its overall score is 1.0 point better than last year, due primarily to continuing improvements in freedom from corruption and the management of government spending. Botswana is ranked 2nd out of 46 countries in the Sub-Saharan Africa region, and its overall score is well above the regional and world averages.
• Botswana’s levels of economic freedom are consistently among the region’s highest. Its economy is diversifying, in large part because of foreign investment attracted by low taxes, political stability, and an educated work force. Botswana continues to set an example in the management of large endowments of natural resources. The level of corruption is the lowest in Africa. An independent judiciary enforces contracts effectively and protects property rights.
• Competitiveness has been underpinned by a relatively efficient regulatory environment and open trade policies, while diamond exports have ensured adequate flows of foreign exchange. The financial sector is fairly well developed, with an independent central bank and little government intervention. Although public debt remains low, the government has undertaken fiscal consolidation to reduce high deficits following the global slowdown.
Botswana also fares reasonably well in the World Bank Survey of Doing Business, which considers the types of regulations and policies that encourage or discourage investment, productivity and growth. The 2013 Report covers 185 countries, and Botswana is rated fifth among African countries at number 59, after Mauritius, South Africa, Tunisia and Rwanda. Relative to other countries, Botswana does well on measures related to flexibility of employment legislation, getting credit, and closing a business, protecting investors, registering property, paying taxes although it does less well on starting a new business, dealing with licences, trading across borders and enforcing contracts.
The most problematic factors of doing business
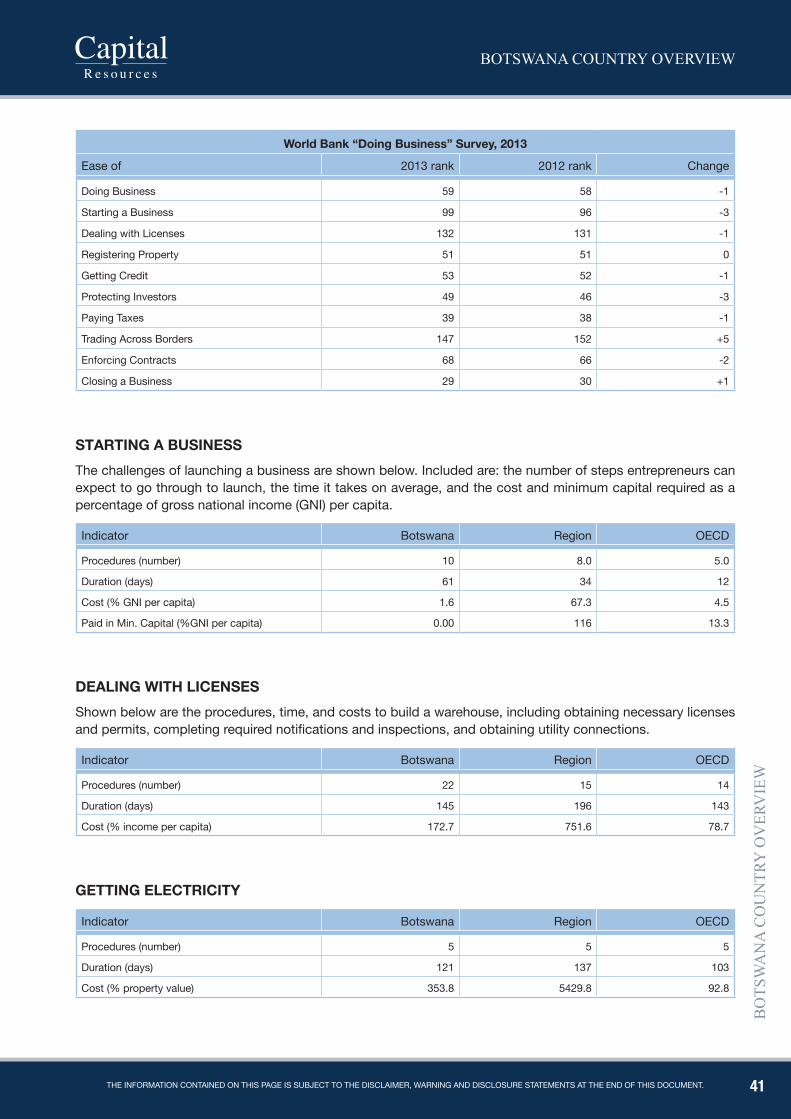
41
BOTSWANA COUNTRY OVERVIEW
BO
TSW
AN
A C
OU
NTR
Y O
VER
VIE
W
The informaTion conTained on This page is subjecT To The disclaimer, warning and disclosure sTaTemenTs aT The end of This documenT.
World Bank “Doing Business” survey, 2013
Ease of 2013 rank 2012 rank Change
Doing Business 59 58 -1
Starting a Business 99 96 -3
Dealing with Licenses 132 131 -1
Registering Property 51 51 0
Getting Credit 53 52 -1
Protecting Investors 49 46 -3
Paying Taxes 39 38 -1
Trading Across Borders 147 152 +5
Enforcing Contracts 68 66 -2
Closing a Business 29 30 +1
sTARTING A BUsINEssThe challenges of launching a business are shown below. Included are: the number of steps entrepreneurs can expect to go through to launch, the time it takes on average, and the cost and minimum capital required as a percentage of gross national income (GNI) per capita.
Indicator Botswana Region OECD
Procedures (number) 10 8.0 5.0
Duration (days) 61 34 12
Cost (% GNI per capita) 1.6 67.3 4.5
Paid in Min. Capital (%GNI per capita) 0.00 116 13.3
DEAlING WITh lICENsEsShown below are the procedures, time, and costs to build a warehouse, including obtaining necessary licenses and permits, completing required notifications and inspections, and obtaining utility connections.
Indicator Botswana Region OECD
Procedures (number) 22 15 14
Duration (days) 145 196 143
Cost (% income per capita) 172.7 751.6 78.7
GETTING ElECTRICITY
Indicator Botswana Region OECD
Procedures (number) 5 5 5
Duration (days) 121 137 103
Cost (% property value) 353.8 5429.8 92.8
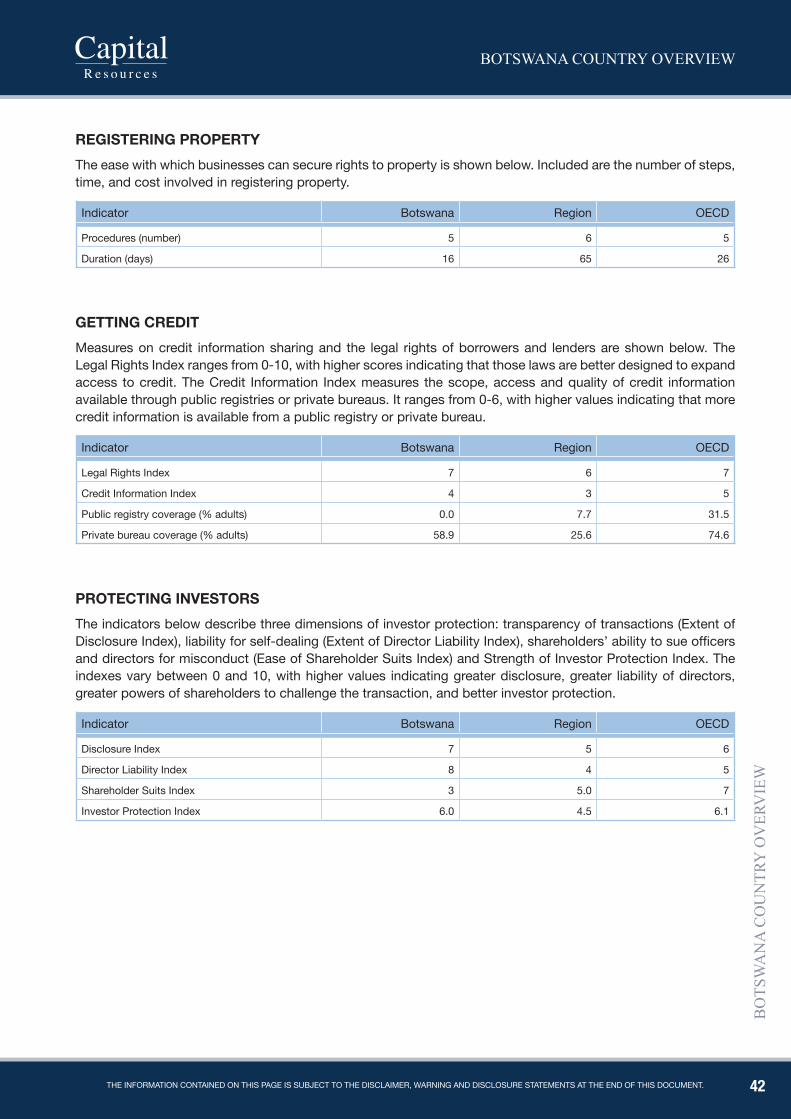
42
BOTSWANA COUNTRY OVERVIEW
BO
TSW
AN
A C
OU
NTR
Y O
VER
VIE
W
The informaTion conTained on This page is subjecT To The disclaimer, warning and disclosure sTaTemenTs aT The end of This documenT.
REGIsTERING pROpERTYThe ease with which businesses can secure rights to property is shown below. Included are the number of steps, time, and cost involved in registering property.
Indicator Botswana Region OECD
Procedures (number) 5 6 5
Duration (days) 16 65 26
GETTING CREDITMeasures on credit information sharing and the legal rights of borrowers and lenders are shown below. The Legal Rights Index ranges from 0-10, with higher scores indicating that those laws are better designed to expand access to credit. The Credit Information Index measures the scope, access and quality of credit information available through public registries or private bureaus. It ranges from 0-6, with higher values indicating that more credit information is available from a public registry or private bureau.
Indicator Botswana Region OECD
Legal Rights Index 7 6 7
Credit Information Index 4 3 5
Public registry coverage (% adults) 0.0 7.7 31.5
Private bureau coverage (% adults) 58.9 25.6 74.6
pROTECTING INVEsTORsThe indicators below describe three dimensions of investor protection: transparency of transactions (Extent of Disclosure Index), liability for self-dealing (Extent of Director Liability Index), shareholders’ ability to sue officers and directors for misconduct (Ease of Shareholder Suits Index) and Strength of Investor Protection Index. The indexes vary between 0 and 10, with higher values indicating greater disclosure, greater liability of directors, greater powers of shareholders to challenge the transaction, and better investor protection.
Indicator Botswana Region OECD
Disclosure Index 7 5 6
Director Liability Index 8 4 5
Shareholder Suits Index 3 5.0 7
Investor Protection Index 6.0 4.5 6.1
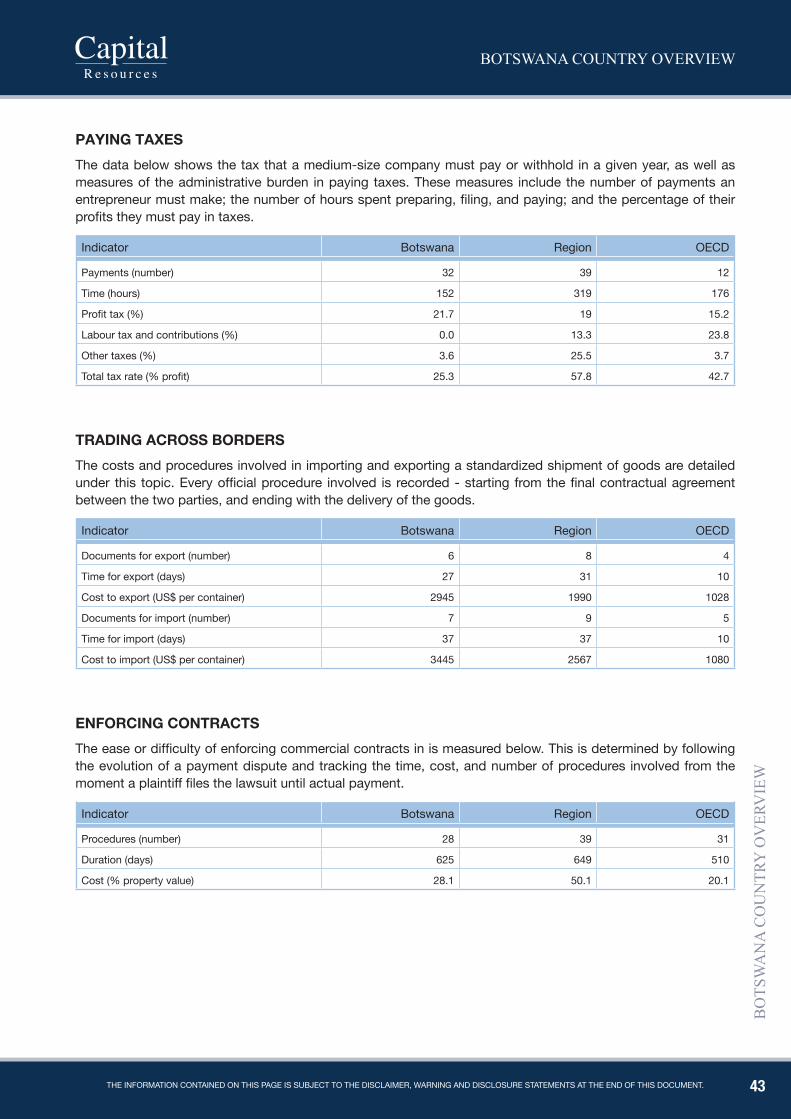
43
BOTSWANA COUNTRY OVERVIEW
BO
TSW
AN
A C
OU
NTR
Y O
VER
VIE
W
The informaTion conTained on This page is subjecT To The disclaimer, warning and disclosure sTaTemenTs aT The end of This documenT.
pAYING TAxEsThe data below shows the tax that a medium-size company must pay or withhold in a given year, as well as measures of the administrative burden in paying taxes. These measures include the number of payments an entrepreneur must make; the number of hours spent preparing, filing, and paying; and the percentage of their profits they must pay in taxes.
Indicator Botswana Region OECD
Payments (number) 32 39 12
Time (hours) 152 319 176
Profit tax (%) 21.7 19 15.2
Labour tax and contributions (%) 0.0 13.3 23.8
Other taxes (%) 3.6 25.5 3.7
Total tax rate (% profit) 25.3 57.8 42.7
TRADING ACROss BORDERsThe costs and procedures involved in importing and exporting a standardized shipment of goods are detailed under this topic. Every official procedure involved is recorded - starting from the final contractual agreement between the two parties, and ending with the delivery of the goods.
Indicator Botswana Region OECD
Documents for export (number) 6 8 4
Time for export (days) 27 31 10
Cost to export (US$ per container) 2945 1990 1028
Documents for import (number) 7 9 5
Time for import (days) 37 37 10
Cost to import (US$ per container) 3445 2567 1080
ENFORCING CONTRACTsThe ease or difficulty of enforcing commercial contracts in is measured below. This is determined by following the evolution of a payment dispute and tracking the time, cost, and number of procedures involved from the moment a plaintiff files the lawsuit until actual payment.
Indicator Botswana Region OECD
Procedures (number) 28 39 31
Duration (days) 625 649 510
Cost (% property value) 28.1 50.1 20.1
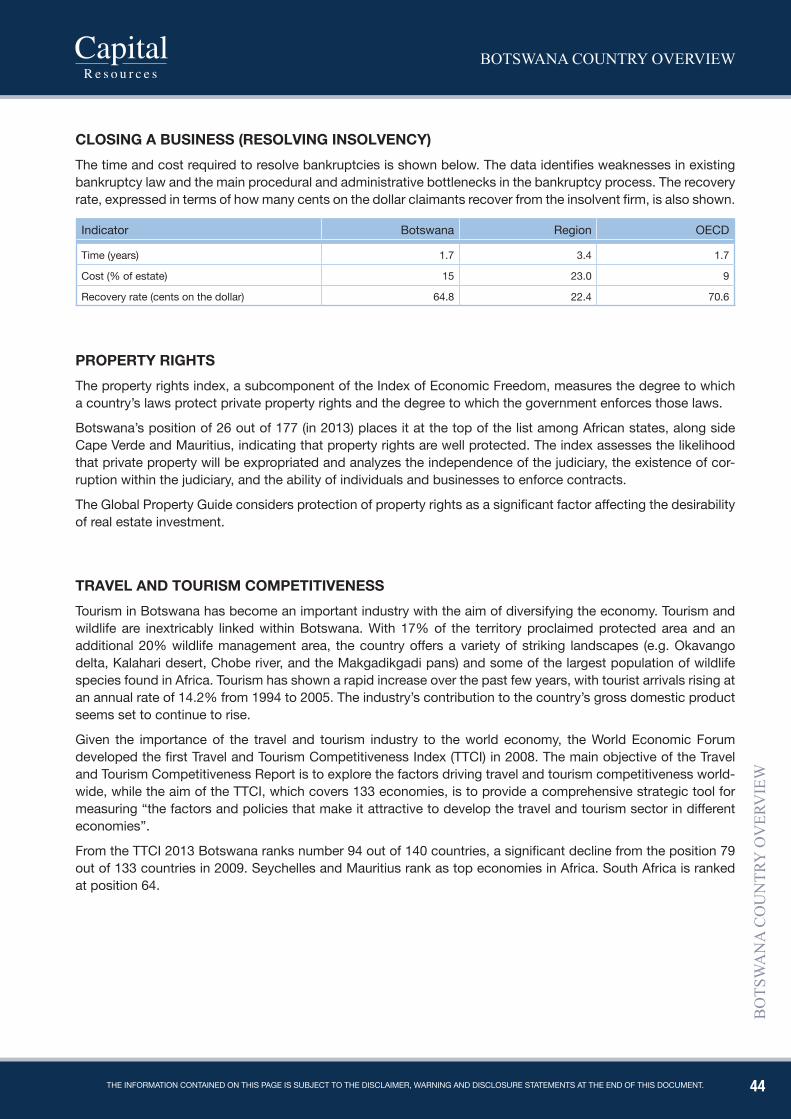
44
BOTSWANA COUNTRY OVERVIEW
BO
TSW
AN
A C
OU
NTR
Y O
VER
VIE
W
The informaTion conTained on This page is subjecT To The disclaimer, warning and disclosure sTaTemenTs aT The end of This documenT.
ClOsING A BUsINEss (REsOlVING INsOlVENCY)The time and cost required to resolve bankruptcies is shown below. The data identifies weaknesses in existing bankruptcy law and the main procedural and administrative bottlenecks in the bankruptcy process. The recovery rate, expressed in terms of how many cents on the dollar claimants recover from the insolvent firm, is also shown.
Indicator Botswana Region OECD
Time (years) 1.7 3.4 1.7
Cost (% of estate) 15 23.0 9
Recovery rate (cents on the dollar) 64.8 22.4 70.6
pROpERTY RIGhTs The property rights index, a subcomponent of the Index of Economic Freedom, measures the degree to which a country’s laws protect private property rights and the degree to which the government enforces those laws.
Botswana’s position of 26 out of 177 (in 2013) places it at the top of the list among African states, along side Cape Verde and Mauritius, indicating that property rights are well protected. The index assesses the likelihood that private property will be expropriated and analyzes the independence of the judiciary, the existence of cor-ruption within the judiciary, and the ability of individuals and businesses to enforce contracts.
The Global Property Guide considers protection of property rights as a significant factor affecting the desirability of real estate investment.
TRAVEl AND TOURIsM COMpETITIVENEssTourism in Botswana has become an important industry with the aim of diversifying the economy. Tourism and wildlife are inextricably linked within Botswana. With 17% of the territory proclaimed protected area and an additional 20% wildlife management area, the country offers a variety of striking landscapes (e.g. Okavango delta, Kalahari desert, Chobe river, and the Makgadikgadi pans) and some of the largest population of wildlife species found in Africa. Tourism has shown a rapid increase over the past few years, with tourist arrivals rising at an annual rate of 14.2% from 1994 to 2005. The industry’s contribution to the country’s gross domestic product seems set to continue to rise.
Given the importance of the travel and tourism industry to the world economy, the World Economic Forum developed the first Travel and Tourism Competitiveness Index (TTCI) in 2008. The main objective of the Travel and Tourism Competitiveness Report is to explore the factors driving travel and tourism competitiveness world-wide, while the aim of the TTCI, which covers 133 economies, is to provide a comprehensive strategic tool for measuring “the factors and policies that make it attractive to develop the travel and tourism sector in different economies”.
From the TTCI 2013 Botswana ranks number 94 out of 140 countries, a significant decline from the position 79 out of 133 countries in 2009. Seychelles and Mauritius rank as top economies in Africa. South Africa is ranked at position 64.
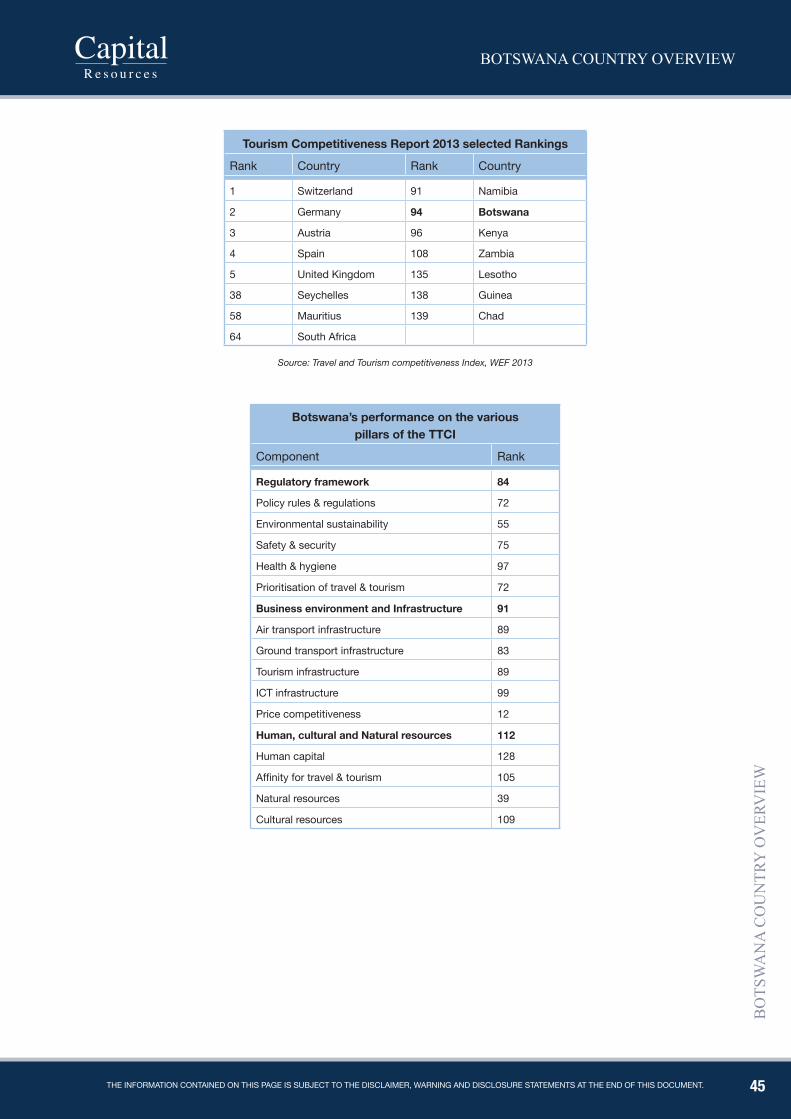
45
BOTSWANA COUNTRY OVERVIEW
BO
TSW
AN
A C
OU
NTR
Y O
VER
VIE
W
The informaTion conTained on This page is subjecT To The disclaimer, warning and disclosure sTaTemenTs aT The end of This documenT.
Tourism Competitiveness Report 2013 selected Rankings
Rank Country Rank Country
1 Switzerland 91 Namibia
2 Germany 94 Botswana
3 Austria 96 Kenya
4 Spain 108 Zambia
5 United Kingdom 135 Lesotho
38 Seychelles 138 Guinea
58 Mauritius 139 Chad
64 South Africa
Source: Travel and Tourism competitiveness Index, WEF 2013
Botswana’s performance on the various pillars of the TTCI
Component Rank
Regulatory framework 84
Policy rules & regulations 72
Environmental sustainability 55
Safety & security 75
Health & hygiene 97
Prioritisation of travel & tourism 72
Business environment and Infrastructure 91
Air transport infrastructure 89
Ground transport infrastructure 83
Tourism infrastructure 89
ICT infrastructure 99
Price competitiveness 12
human, cultural and Natural resources 112
Human capital 128
Affinity for travel & tourism 105
Natural resources 39
Cultural resources 109
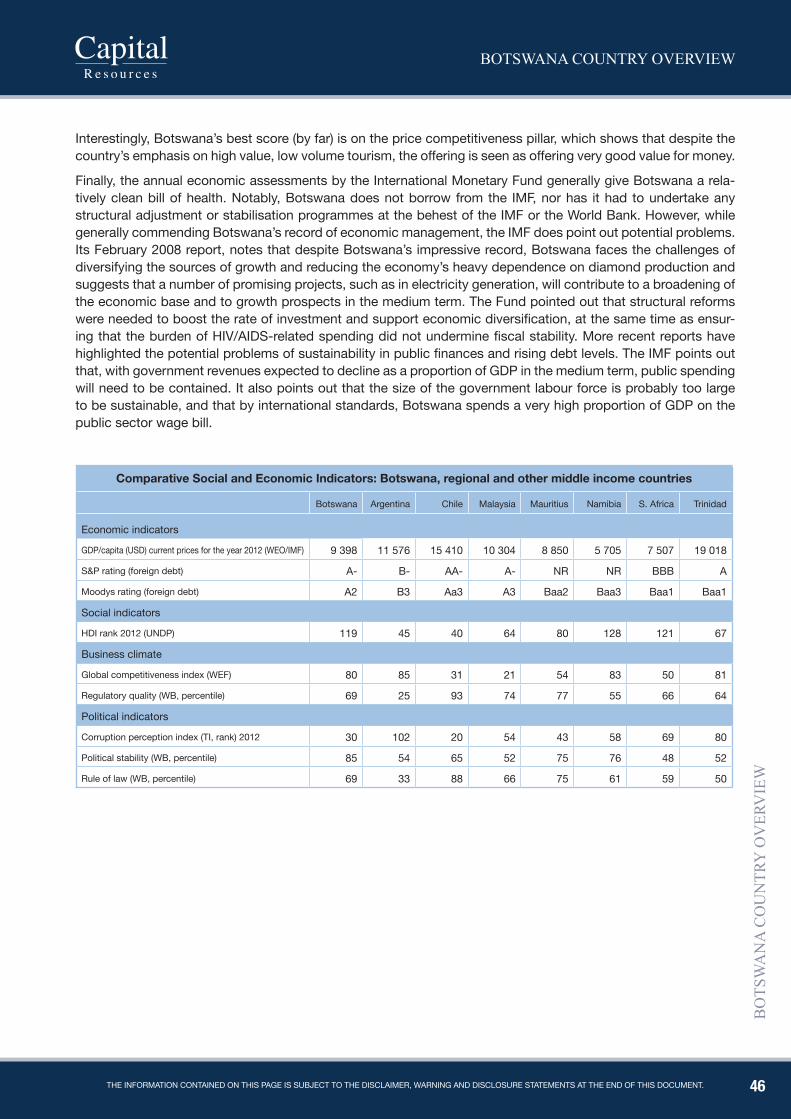
46
BOTSWANA COUNTRY OVERVIEW
BO
TSW
AN
A C
OU
NTR
Y O
VER
VIE
W
The informaTion conTained on This page is subjecT To The disclaimer, warning and disclosure sTaTemenTs aT The end of This documenT.
Interestingly, Botswana’s best score (by far) is on the price competitiveness pillar, which shows that despite the country’s emphasis on high value, low volume tourism, the offering is seen as offering very good value for money.
Finally, the annual economic assessments by the International Monetary Fund generally give Botswana a rela-tively clean bill of health. Notably, Botswana does not borrow from the IMF, nor has it had to undertake any structural adjustment or stabilisation programmes at the behest of the IMF or the World Bank. However, while generally commending Botswana’s record of economic management, the IMF does point out potential problems. Its February 2008 report, notes that despite Botswana’s impressive record, Botswana faces the challenges of diversifying the sources of growth and reducing the economy’s heavy dependence on diamond production and suggests that a number of promising projects, such as in electricity generation, will contribute to a broadening of the economic base and to growth prospects in the medium term. The Fund pointed out that structural reforms were needed to boost the rate of investment and support economic diversification, at the same time as ensur-ing that the burden of HIV/AIDS-related spending did not undermine fiscal stability. More recent reports have highlighted the potential problems of sustainability in public finances and rising debt levels. The IMF points out that, with government revenues expected to decline as a proportion of GDP in the medium term, public spending will need to be contained. It also points out that the size of the government labour force is probably too large to be sustainable, and that by international standards, Botswana spends a very high proportion of GDP on the public sector wage bill.
Comparative social and Economic Indicators: Botswana, regional and other middle income countries
Botswana Argentina Chile Malaysia Mauritius Namibia S. Africa Trinidad
Economic indicators
GDP/capita (USD) current prices for the year 2012 (WEO/IMF) 9 398 11 576 15 410 10 304 8 850 5 705 7 507 19 018
S&P rating (foreign debt) A- B- AA- A- NR NR BBB A
Moodys rating (foreign debt) A2 B3 Aa3 A3 Baa2 Baa3 Baa1 Baa1
Social indicators
HDI rank 2012 (UNDP) 119 45 40 64 80 128 121 67
Business climate
Global competitiveness index (WEF) 80 85 31 21 54 83 50 81
Regulatory quality (WB, percentile) 69 25 93 74 77 55 66 64
Political indicators
Corruption perception index (TI, rank) 2012 30 102 20 54 43 58 69 80
Political stability (WB, percentile) 85 54 65 52 75 76 48 52
Rule of law (WB, percentile) 69 33 88 66 75 61 59 50
47
BOTSWANA COUNTRY OVERVIEW
BO
TSW
AN
A C
OU
NTR
Y O
VER
VIE
W
The informaTion conTained on This page is subjecT To The disclaimer, warning and disclosure sTaTemenTs aT The end of This documenT.
NOTEs
48
BOTSWANA COUNTRY OVERVIEW
BO
TSW
AN
A C
OU
NTR
Y O
VER
VIE
W
The informaTion conTained on This page is subjecT To The disclaimer, warning and disclosure sTaTemenTs aT The end of This documenT.
Disclaimer
Produced by: Capital Resources (Pty) Limited
Tel + 267 3188886
Fax + 267 3188887
This report is not and should not be construed as an offer to sell or the solicitation of an offer to purchase or subscribe for any securities. This report has been prepared by Capital Resources (Pty) Limited (“Capital”) for distribution to its clients and other clients of the Capital Group from sources it believes to be reliable. Capital and other members of the Capital Group make no warranty, guarantee, or representation and accepts no liability or responsibility as to its accuracy or completeness. All opinions are those of the research department of Capital only (unless otherwise indicated) and are subject to change without notice. Each recipient of this report shall be solely responsible for making its own independent investigation of the companies referred to in this report. This report may not have been distributed to all recipients at the same time.
Group companies and/or their officers, affiliates, directors and employees, including people involved in the preparation or issuance of this report may from time to time (1) have positions in any securities mentioned in this document or in any related investment and may from time to time buy or sell any such securities or investment (2) have an investment banking or broking relationship with a company in this report (3) act as market maker or have assumed an underwriting commitment in the securities of companies in this report or in a related investment (4) have acted on the information contained within this report including effecting transactions for their own account.
This report is issued only for the information of and may only be distributed to professional investors. In the UK it is intended for distribution only to persons of a kind described in Article 11(3) of the Financial Services Act 1986 (Investment Advertisement)(Exemptions) Order 1996 (as amended). It may be distributed in the United States solely to “major US institutional investors” as defined in Rule 15a-6 of the US Securities Exchange Act of 1934.