Embed Size (px)
DESCRIPTION
Â
Citation preview

The Boston Urban HubFirst Quarter 2016
A Comprehensive Analysis ofThe Boston Condominium Market
www.Raveis.com
18 Arlington Street Boston, MA 02116 I 617.266.5200

1
The Boston Urban Hub First Quarter 2016
Welcome to the First Quarter 2016 edition of The Boston Urban Hub, Raveis Research’s quarterly review of the condominium market in Boston’s urban core. Our goal is to provide insight on emerging trends by reviewing market
data from closings in First Quarter 2016 and comparing it to closings that occurred in the previous quarter and the same quarter a year ago.
We have defined the Urban Hub as the Boston neighborhoods with the highest concentration of multi-family housing, either built as “for sale” product or luxury rental with the potential for future sale and/or conversion. The neighborhoods include Back Bay, Beacon Hill, Charlestown, Fenway, Midtown, North End, Waterfront/Seaport, South Boston, South End, and West End. We have recently expanded our definition of the Urban Hub, and have included key statistics on the emerging neighborhoods of Dorchester and East Boston.
Condo sales in First Quarter 2016 fell roughly 34% however, it had an 8% increase year over year. The Back Bay, Beacon Hill, Downtown/Midtown, Back Bay, and Seaport/Waterfront neighborhoods led the market with the highest Average Price while South Boston experienced the highest number of sales.
We hope you will find this edition of The Boston Urban Hub informative and useful. Today’s market is in an exciting transition, making it even more important to work with a sales and marketing partner with a proven track record of producing optimal results for its developer clients. We welcome any questions you may have regarding this report and the future of Boston’s condominium market.
Sincerely,
Rachel Marden Director of Research
South Boston experienced the highest number of sales ...
*All information in this report sourced from LINK unless otherwise noted

2
The Boston Urban Hub First Quarter 2016
First Quarter 2016 Neighborhood Sales Summary
With the increase of new development inventory closings in The Seaport, the neighborhood experienced a 92% increase in number of sales year over year. The Average Price in The Seaport surpassed Back Bay for the highest in the Urban Hub.
... Average Priceper SF increased 11% ...
First Quarter 2016 Urban Hub Sales SummaryWe had a steady First Quarter in the Urban Hub with Average Price increasing 12% year over year. Number of Sales, Median Price, and Average Price per square foot also had a steady increase.
*Dorchester & East Boston Data source MLSpin

3
The Boston Urban Hub First Quarter 2016
Sales – ClosingsWith 543 closed sales in the Urban Hub, First Quarter 2016 followed the seasonal first quarter trend, however it increased 10% year over year.
Sales – Under Agreement
Sales Under Agreement is derived from the number of condo listings reported as being under agreement during the quarter. A sale usually closes within eight to ten weeks and in many cases closes in the following quarter. With the return of new development sales, in which contracts are signed pre-construction and during construction, closings may occur as much as three years later. However, not all new development sales are reported as under agreement until they close. Sales Under Agreement in First Quarter 2016 followed the seasonal trend of declining quarter over quarter.
0
200
400
600
800
1000
1200
1Q13 2Q13 3Q13 4Q13 1Q14 2Q14 3Q14 4Q14 1Q15 2Q15 3Q15 4Q15 1Q16
504
1054
1156
870
597
965 923
662
495
890993
827
0
300
600
900
1200
1500
1Q13 2Q13 3Q13 4Q13 1Q14 2Q14 3Q14 4Q14 1Q15 2Q15 3Q15 4Q15 1Q16
418
1211
482385
331
645
340 339 279
546
329 321
415 1192 476 381 330 638 336 331 274 539 325 313
3 19 6 4 1 7 4 8 5 7 4 8
543
25218763
4
The Boston Urban Hub First Quarter 2016
0% 10% 20% 30% 40% 50% 60%
$0-$400,000
$401,000-$800,000
$801,000-$1,200,000
$1,201,000-$1,600,000
$1,601,000-$2,000,000
$2,000,000+
2016
2015
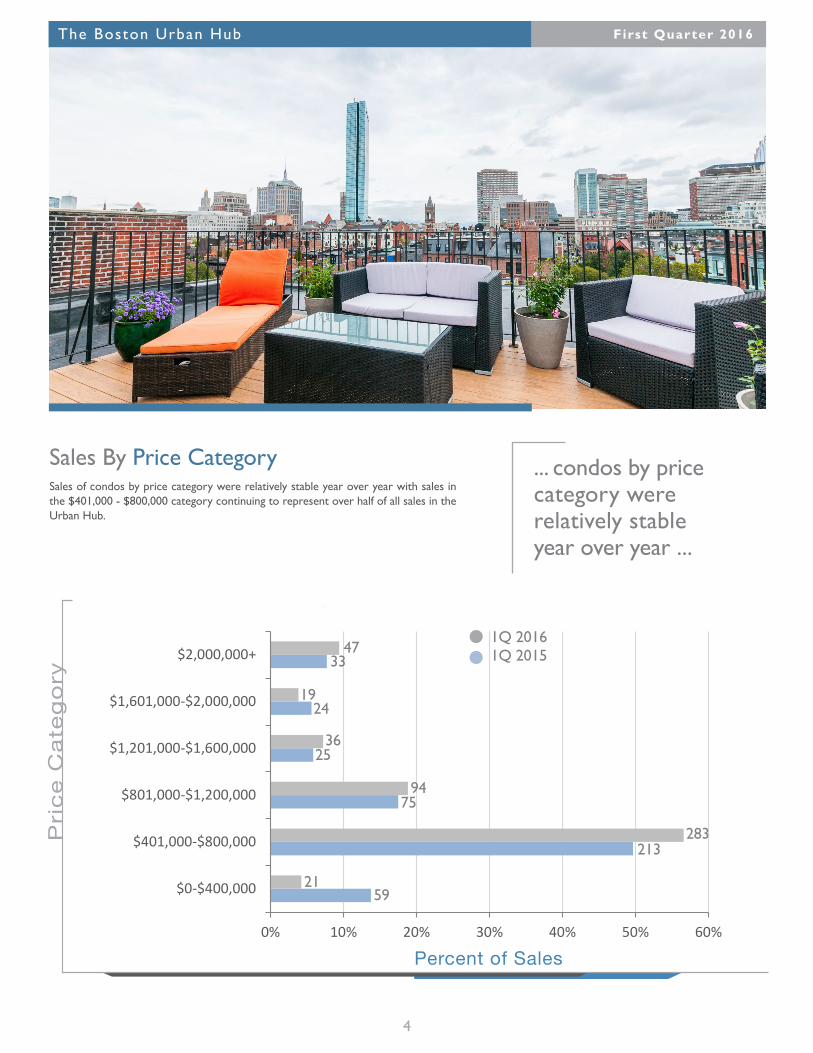
Sales By Price Category Sales of condos by price category were relatively stable year over year with sales in the $401,000 - $800,000 category continuing to represent over half of all sales in the Urban Hub.
... condos by price category were relatively stable year over year ...
1Q 20161Q 201547
33
1924
3625
9475
283213
2159
5
The Boston Urban Hub First Quarter 2016
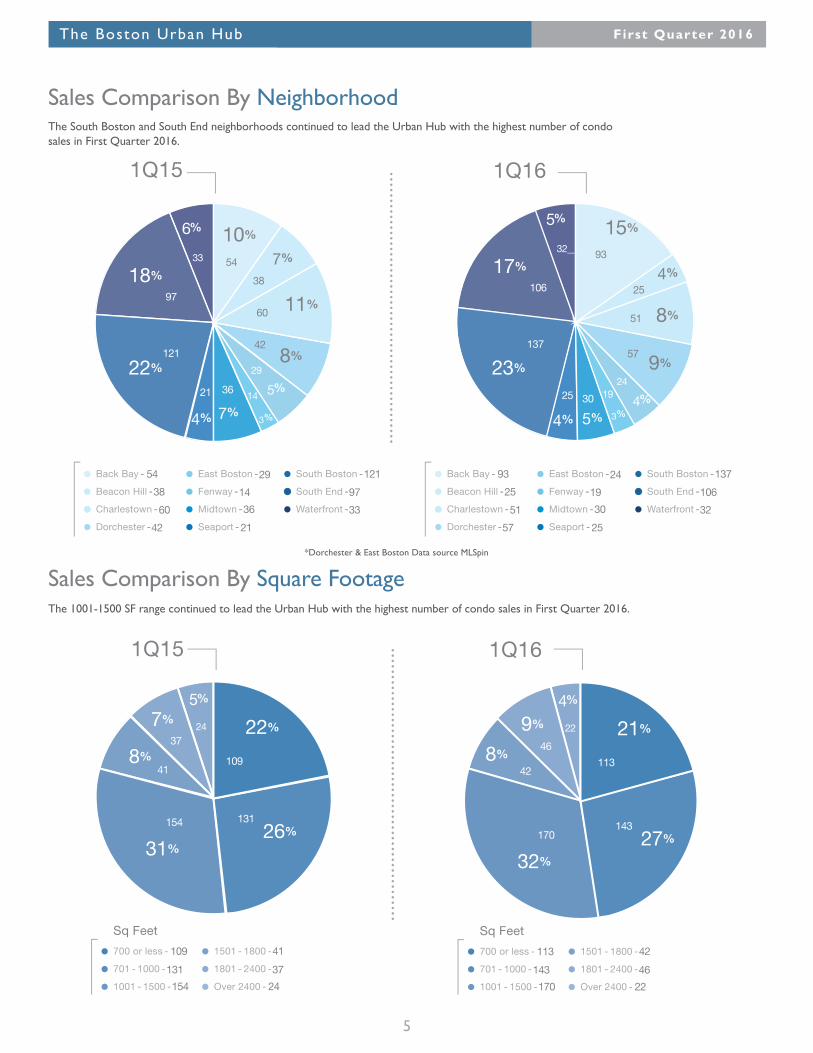
Sales Comparison By NeighborhoodThe South Boston and South End neighborhoods continued to lead the Urban Hub with the highest number of condo sales in First Quarter 2016.
Sales Comparison By Square FootageThe 1001-1500 SF range continued to lead the Urban Hub with the highest number of condo sales in First Quarter 2016.
93
25
51
57
24
19
30
25
137
106
32
113
143
170
42
46
22
1Q15 1Q16
1Q15 1Q16
*Dorchester & East Boston Data source MLSpin
54
38
60
42
29
14
36
21
121
97
33
109
131
154
41
37
24
131
26%154
31%
109
22%24
5%
37
7%
418%
143
27%170
32%
113
21%22
4%
46
9%
428%
121
22%
97
18%
21
4%
54
10%
60
42
38
7%
36
7%14
3%
29
5%
33
6%
8%
11%
137
23%
106
17%
25
4%
93
15%
51
57
254%
30
5%
19
3%
24
4%
32__
5%
9%
8%

6
The Boston Urban Hub First Quarter 2016
Sales Comparison By Number of BedroomsTwo Bedroom condos represented 48% of all condo sales in the Urban Hub in the First Quarter 2016.
6
1Q15 1Q16
25 257
174 75
7 248
169 70
174
25
257
5%
14%
48%
33%
75
169
248
14%
50%
34%
70

7
The Boston Urban Hub First Quarter 2016
0
100000
200000
300000
400000
500000
600000
700000
800000
PriceAverage Price decreased 15% since last quarter but increased 12% year over year. Median price decreased 8% since last quarter but increased 11% year over year.
Historical Sales PriceThe Urban Hub had tremendous growth in Frist Quarter 2016, Median Price increased 21% year over year.
1Q13 2Q13 3Q13 4Q13 1Q14 2Q14 3Q14 4Q14 1Q15 2Q15 3Q15 4Q15 1Q160
537,
250
536,
000
525,
000
645,
000
660,
000
600,
000
599,
500
630,
000
630,
000
692,
000
640,
000
762,
500
700,
000

8
The Boston Urban Hub First Quarter 2016
New Developments
New Development condos were in strong demand in First Quarter 2016 with very brisk pre-sale activity at Sepia at Ink Block, 22 Liberty and Millennium Tower. With the introduction of the ultra-luxury product at Four Seasons Hotel and Four Seasons Private Residences at One Dalton Street, the Boston condo market will enter a new level of pricing, services and amenities.
8