Embed Size (px)
Citation preview

Boston University Common Data Set 1
Name of College/University: Boston University
Mailing Address: One Silber Way
Boston MA 02215
Street Address (if different)
Main Phone: (617) 353-2000
www Home Page Address: http://www.bu.edu
Admissions Phone Number: (617) 353-2300
Admissions Toll-Free Number: N/A
Admissions Office Mailing Address: 233 Bay State Road
Boston MA 02215
Admissions Fax Number: (617) 353-9695
Admissions E-mail Address: [email protected]; International: [email protected]
Separate URL application site: https://app.commonapp.org/
Public
Private (nonprofit) X
Proprietary
Coeducational college X
Men's college
Women's college
Semester X
Quarter
Trimester
"4-1-4"
Continuous
Differs by program (describe):
Other (describe):
A. General Information
A1. General information
A2. Institutional control
A3. Institution classification
A4. Academic year calendar
Boston University Institutional Research 2017-2018

Boston University Common Data Set 2
Certificate X
Diploma
Associate
Transfer associate
Terminal associate
Bachelor's X
Postbachelor's certificate X
Master's X
Post-master's certificate X
Doctoral - Research and Scholarship X
Doctoral - Professional Practice X
A5. Degrees offered
Boston University Institutional Research 2017-2018

Boston University Common Data Set 3
UndergraduatesMen Women Men Women
Degree-seeking, first-time freshmen 1,444 2,054 0 0
Other first-year, degree-seeking 5 7 1 0
All other degree-seeking 4,949 7,890 188 178
Total degree-seeking 6,398 9,951 189 178
203 287 427 447
Total undergraduates 6,601 10,238 616 625
GraduateMen Women Men Women
Degree-seeking, first-time 1,788 2,533 485 709
All other degree-seeking 2,569 3,163 1,555 1,903
36 57 182 295
Total graduate 4,393 5,753 2,222 2,907
Total undergraduate enrollment 18,080Total graduate and professional enrollment 15,275
Grand Total All Students 33,355
Non-resident aliens
Hispanic
Black, non-Hispanic
White, non-Hispanic
American Indian/Alaskan Native
Asian, non-Hispanic
Hawaiian/Pacific Islander
Two or More Races, non-Hispanic
Race/ethnicity unknown
Total
773 3,631 3,853
B. Enrollment and Persistence
B1. Institutional enrollment - men and women (Fall 2017)
Full-time Part-time
All other undergraduates enrolled in credit courses
Full-time Part-time
All other graduates enrolled in credit courses
B2. Enrollment by racial/ethnic category
All first-year degree-seeking *
All undergraduate degree-seeking All undergraduate
6,637 7,087
0 8 9
453 1,929 1,991
152 682 721
1,280
143 635 652
136 687 1,180
557 2,487 2,566
4 20 21
3,498 16,716 18,080
Boston University Institutional Research 2017-2018

Boston University Common Data Set 4
1st Degree 2nd Degree TOTAL
Certificate/diploma degrees 403 0 403
Associate degrees 0 0 0
Bachelor's degrees 4,200 233 4,433
Postbachelor's certificate degrees 21 0 21
Master's degrees 4,589 55 4,644
Post-master's degrees 78 0 78
Doctoral Degrees - Research/Scholarship 509 0 509
Doctoral Degrees - Professional Practice 557 0 557
Doctoral Degrees - Other Awarded 0 0 0
10,357 288 10,645
B3. Number of degrees awarded by your institution from July 1, 2016 to June 30, 2017
Boston University Institutional Research 2017-2018

Boston University Common Data Set 5
Graduation Rates
Fall 2011 Cohort
Total (sum of 3 columes to the left)
4022
13
4009
3266
191
36
3493
87%
G. Total graduating within six years (sum of questions B7, B8, and B9) (D, E, F) 441 942 2110H. Six-year graduation rate for 2011 cohort (question B10 divided by question B6) (G divided by C) 84% 87% 88%
417 903 1946
E. Of the initial 2011 cohort, how many completed the program in more than four years but in five years or less (after August 31, 2015 and by August 31, 2016) 19 34 138
F. Of the initial 2011 cohort, how many completed the program in more than five years but in six years or less (after August 31, 2016 and by August 31, 2017) 5 5 26
Recipients of a Federal Pell Grant
Recipients of a Subsidized Stafford Loan who did not receive a Pell Grant
Students who did not receive either a Pell Grant or a subsidized Stafford Loan
A. Initial 2011 cohort of first-time, full-time bachelor's (or equivalent) degree-seeking undergraduate students 526 1087 2409
B. Of the initial 2011 cohort, how many did not persist and did not graduate for the following reasons: deceased, permanently disabled, armed forces, foreign aid service of the federal government, or official church missions; total allowable exclusions 1 1 11
C. Final 2011 cohort, after adjusting for allowable exclusions 525 1086 2398
D. Of the initial 2011 cohort, how many completed the program in four years or less (by August 31, 2015)
Boston University Institutional Research 2017-2018

Boston University Common Data Set 6
Fall 2010 Cohort
Total (sum of 3 columes to the left)
4409
18
4391
3555
194
50
3799
87%86%
9
1032
87%
37
2119
87%
36
1193
981
2448
1966
42 116
4
648
H. Six-year graduation rate for 2010 cohort (question B10 divided by question B6) (G divided by C)
750
0
1194
1
2465
17
750
608
Recipients of a Subsidized Stafford Loan who did not receive a Pell Grant
Students who did not receive either a Pell Grant or a subsidized Stafford Loan
A. Initial 2010 cohort of first-time, full-time bachelor's (or equivalent) degree-seeking undergraduate students
B. Of the initial 2010 cohort, how many did not persist and did not graduate for the following reasons: deceased, permanently disabled, armed forces, foreign aid service of the federal government, or official church missions; total allowable exclusions
C. Final 2010 cohort, after adjusting for allowable exclusions
G. Total graduating within six years (sum of questions B7, B8, and B9) (sum D, E, F)
F. Of the initial 2010 cohort, how many completed the program in more than five years but in six years or less (after August 31, 2015 and by August 31, 2016)
E. Of the initial 2010 cohort, how many completed the program in more than four years but in five years or less (after August 31, 2014 and by August 31, 2015)
D. Of the initial 2010 cohort, how many completed the program in four years or less (by August 31, 2014)
Recipients of a Federal Pell Grant
Boston University Institutional Research 2017-2018

Boston University Common Data Set 7
93%
B12 - 21. Two-year institutions graduation rate
B22. For the cohort of all full-time, first-time bachelor's (or equivalent) degree-seeking undergraduate students who entered your institution as freshmen in fall 2016 (or the preceding summer term), what percentage was enrolled at your institution as of the date your institution calculates its official enrollment in fall 2017?
Boston University Institutional Research 2017-2018

Boston University Common Data Set 8
Men Women TotalApplicants 25,203 35,622 60,825
Offered admission 6,126 9,147 15,273
Full-time enrolled 1,444 2,054 3,498
Part-time enrolled 0 0 0
Do you have a policy of placing students on a wait-list? Yes
Total freshman applicants placed on wait-list 4,399
Total freshman applicants accepting place on wait-list 2,584
Total freshman applicants accepted from wait-list 7
Is wait-list ranked? No
Release wait-list information to school counselors? No
Required
High school diploma is required and GED accepted; home-schooled students should contact the Office of Admissions.
C4. Does your institution require or recommend a general college preparatory program for degree-seeking students?
C. First-Time, First-Year (Freshman) Admission Fall 2017
C1. First-time, first-year (freshman) students admissions statistics
C2. Freshman wait-listed students (students who met admission requirements but whose final admission was contingent on space availability)
C3. High school completion requirement
Boston University Institutional Research 2017-2018

Boston University Common Data Set 9
English 4.0
Mathematics* 3.0
Science (with labs) 3.0
Foreign language 2.0
History/Social Studies 3.0
Academic Electives -
Computer Science -
Visual/Performing Arts -
Other -
Total 15.0
* Mathematics: requires study through pre-calculus and recommends the study of calculus.
No
C5. Distribution of high school units required and/or recommended
Units Required Units Recommended
4.0
-
-
-
20.0
C6. Do you have an open admissions policy, under which virtually all secondary school graduates or students with GED equivalency diplomas are admitted without regard to academic record, test scores, or other qualifications?
4.0
4.0
4.0
4.0
-
-
Boston University Institutional Research 2017-2018

Boston University Common Data Set 10
Academic factors
Rigor of secondary school record XClass rank XAcademic GPA XStandardized test scores XApplication essay XRecommendations X
Non-academic factors
Interview 1 XExtracurricular activities XTalent/ability 2 X XCharacter/personal qualities XFirst generation XAlumni/ae relation XGeographical residence XState residency XReligious affiliation/commitment XRacial/ethnic status XVolunteer work XWork experience XLevel of applicant's interest X
2 Talent/ability is very important for College of Fine Arts applicants, otherwise not considered.
C7. Relative importance of each of the following academic non academic factors in your first-time, first-year, degree-seeking (freshman) admissions decisions
Very Important Important Considered
Not Considered
1 Interviews are only required for seven-year Accelerated Medical and Dental program finalists and Boston and Medeiros Scholarship nominees.
Boston University Institutional Research 2017-2018
Boston University Common Data Set 11
Yes
SAT or ACT (no preference) Required for some programs
SAT Subject Required for some programs
ACT with writing component required
ACT with writing component recommended
ACT with or without writing component accepted
SAT with essay component required
SAT with essay component recommended
SAT with or without essay component accepted
Not using essay component.
Yes
January 2
Not required for most programs at Boston University. If required, January 2 is the deadline.
A. Does your institution make use of SAT, ACT, or SAT Subject Test scores in admissions decisions for first-time, first-year, degree-seeking applicants?
B. If your institution will make use of the ACT in admission decisions for first-time, first-year, degree-seeking applicants for Fall 2019, please indicate which ONE of the following applies:
C. Please indicate how your institution will use the SAT or ACT writing component.
D. In addition, does your institution use applicants' test scores for academic advising?
E. Latest date by which SAT or ACT scores must be received for fall-term admission.
Latest date by which SAT Subject Test scores must be received for fall-term admission.
C8. Entrance exams
If your institution will make use of the SAT in admission decisions for first-time, first-year, degree-seeking applicants for Fall 2019, please indicate which ONE of the following applies:
Boston University Institutional Research 2017-2018

Boston University Common Data Set 12
School Test
College of Arts & Sciences SAT or ACT X X
Note: There is no transfer admission as an undeclared major.
School Test
College of Fine Arts - SAT or ACT
School of Music
School Test
College of Fine Arts - SAT or ACT
School of Theatre Arts
School Test
College of Fine Arts - SAT or ACT
School of Visual Arts
School Test
College of Communication SAT or ACT X X
Note: There is no transfer admission as an undeclared major.
School Test
School of Education SAT or ACT X X
School Test
College of Engineering SAT or ACT X X
Note: There is no transfer admission as an undeclared major.
Notes: Candidates are required to audition for admission.Check College of Fine Arts website at www.bu.edu/cfa for audition schedules.Candidates for the Theory and Composition program must audition and present a portfolio.
Early Decision
Transfer Admission
Early Admission
Notes: Candidates for the Acting and Theatre Studies Programs must audition for admission. Candidates for the Design, Production and Stage Management Programs must present a portfolio in an interview with the faculty. Check the College of Fine Arts website at www.bu.edu/cfa for audition and portfolio preparation schedules.
Early Decision
Transfer Admission
Early Admission
F. Test Policy a
Early Decision
Transfer Admission
Early Admission
Early Decision
Transfer Admission
Early Admission
Early Decision
Transfer Admission
Early Admission
Notes: Candidates are required to submit a portfolio.Check College of Fine Arts website at www.bu.edu/cfa for instructions.There is no transfer admission as an undeclared major.
Early Decision
Transfer Admission
Early Admission
Early Decision
Transfer Admission
Early Admission
Boston University Institutional Research 2017-2018

Boston University Common Data Set 13
School Test
SAT or ACT X X
School Test
School of Management SAT or ACT X X
School Test
SAT or ACT X X
Note: There is no transfer admission as an undeclared major.
School Test
SAT or ACT
SAT Subject Test: Chemistry
SAT Subject Test: Mathematics (level 2)
SAT Subject Test: Foreign Language *
* SAT Subject Test: Foreign Language is recommended, not required.
School Test
SAT or ACT
SAT Subject Test: Chemistry
SAT Subject Test: Mathematics (level 2)
SAT Subject Test: Foreign Language *
* SAT Subject Test: Foreign Language is recommended, not required.
School Test
College of General Studies SAT or ACT X
Early Decision
Transfer Admission
Early Admission
College of Health & Rehabilitation Sciences: Sargent College
Early Decision
Transfer Admission
Early Admission
Seven-Year Accelerated Liberal Arts/Medical Education Combined Degree Program
Notes: Please note that no substitute for the required tests will be accepted. Application due date for accelerated programs is November 15. For all accelerated programs, finalists will be contacted and are required to interview in Boston.
School of Hospitality Administration
Early Decision
Transfer Admission
Early Admission
Early Decision
Transfer Admission
Early Admission
Early Decision
Transfer Admission
Early Admission
Seven-Year Accelerated Liberal Arts/Dental Education Combined Degree Program
Notes: Please note that no substitute for the required tests will be accepted. Application due date for accelerated programs is November 15. For all accelerated programs, finalists will be contacted and are required to interview in Boston.
Early Decision
Transfer Admission
Early Admission
Boston University Institutional Research 2017-2018

Boston University Common Data Set 14
TOEFL and IELTS Tests
SAT Yes
ACT with writing Yes
SAT Subject tests Yes
AP Yes
CLEP No
Institutional Exam Yes
aRequirements for the TOEFL and IELTS tests are available on our admissions website (www.bu.edu/admissions).
The Test of English as a Foreign Language (TOEFL) is required of any student for whom English is not the native or first language. Students who are most competitive for admission will have a composite score of at least 90-100 and minimum scores of 20 in each section. The Board of Admissions looks closely at the score for each section as well as for consistency across all subscores within each single language proficiency test.
G. Please indicate which tests your institution uses for placement (all schools/programs)
IELTS: In lieu of the TOEFL exam, you may submit the International English Language Testing System (IELTS). A score of 7 or higher will also satisfy BU’s English Language proficiency requirement for all programs. Learn more on the IELTS website.
Boston University Institutional Research 2017-2018

Boston University Common Data Set 15
% Submitting Number
SAT I 63% 2,198 640-720
SAT Math 660-760
ACT 52% 1,830 Essay 15-18
ACT Composite 29-32
ACT English 28-34
ACT Math 27-32
ACT Writing 25-30
Percent of first-time, first-year (freshman) students with scores in each range
SAT I Evidence-Based ACT
Distribution Reading & Writing Math Distribution Composite English Math Writing
700-800 38% 55% 30-36 64% 67% 47% 40%
600-699 54% 38% 24-29 35% 29% 49% 54%
500-599 8% 7% 18-23 1% 4% 4% 6%
400-499 0% 0% 12-17 0% 0% 0% 0%
300-399 0% 0% 6-11 0% 0% 0% 0%
200-299 0% 0% below 6 0% 0% 0% 0%
Top 10% 62% 28%
Top 25% 92%
Top 50% 99%
Bottom 50% 1%
Bottom 25% 0%
3.75 and higher 39%
3.50 - 3.74 40%
3.25 - 3.49 14%
3.00 - 3.24 7%
2.50 - 2.99 0%
2.00 - 2.49 0%
1.00 - 1.99 0%
Below 1.00 0%
C9. Percent and number of first-time, first-year (freshman) students enrolled in Fall 2017 who submitted national standardized (SAT/ACT) test scores.
Middle 50th percentile
C10. Percent of all degree-seeking, first-time, first-year (freshman) students who had high school class rank within each of the following ranges
Percent of first-time, first-year (freshman) students who submitted high school class rank:
C11. Percent of all enrolled, degree-seeking, first-time, first-year (freshman) students who had high school grade-point averages within each of the following ranges (using 4.0 scale)
C12. Average high school GPA of all degree-seeking, first-time, first-year (freshman) students who submitted GPA
SAT Evidence-Based Reading and Writing
Boston University Institutional Research 2017-2018
Boston University Common Data Set 16
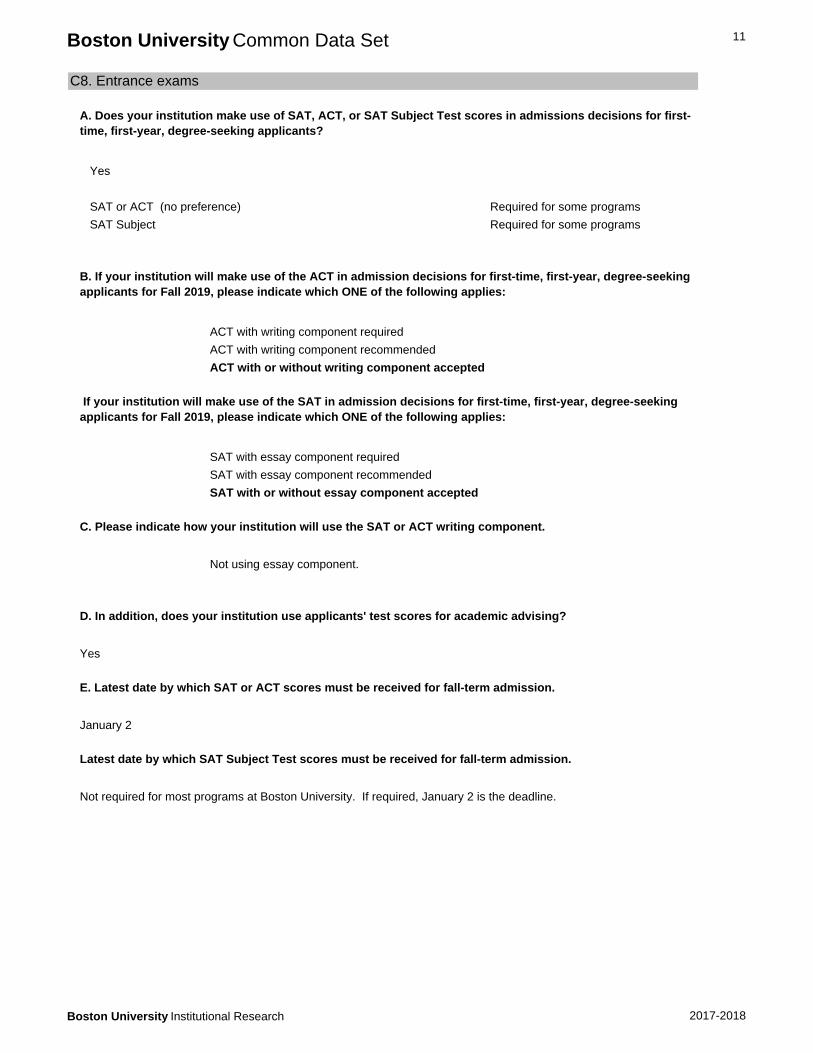
3.66
Percent of total freshman submitting high school GPA 100.0%
Is there an application fee? Yes
Amount of application fee $80
Can it be waived for applicants with financial need? Yes *
* Students should speak with high school guidance counselors to request the submission of a fee waiver.
Does your institution have an application closing date? Yes
January 2 for fall admissions
Yes, in most programs
By April 1
Must reply by May 1.
Deadline for housing deposit: Enrollment deposit due May 1 (no separate housing deposit)
Amount of housing deposit: Enrollment deposit - $650
Refundable if student does not enroll? No
Does your institution allow students to postpone enrollment after admission?
Yes, Deferred admission is allowed with a maximum postponement of one year (freshmen only).
(November 15 for Accelerated Medical and Dental programs. December 1 for Trustee Scholar, Presidential Scholar, Boston High School, and Cardinal Medeiros Scholar programs.)
C15. Are first-time, first-year students accepted for terms other than the fall?
C16. Notification to applicants of admission decision sent
C17. Reply policy for admitted applicants
C18. Deferred admission
C13. Application fee
C14. Application closing date
Boston University Institutional Research 2017-2018

Boston University Common Data Set 17
Yes
Yes
First or only early decision plan closing date November 1
First or only early decision plan notification date December 15
Other early decision plan closing date January 2
Other early decision plan notification date February 15
Number of early decision applications received by your institution 4,159
Number of applicants admitted under early decision plan 1,229
Details about early decision plan
No
C19. Early admission of high school students
Do you have a nonbinding early action plan whereby students are notified of an admission decision well in advance of the regular notification date but do not have to commit to attending your college?
Does your institution allow high school students to enroll as full-time, first-time (freshman) students one year or more before high school graduation?
C20. No longer on the Common Data Set
C21. Early Decision
Does your institution offer an early decision plan for first-time, first-year (freshman) applicants for fall enrollment?
Only available for high school seniors applying for September admission; some programs do not have an Early Decision option. If admitted, students must send in the required enrollment deposit by January 15 for Early Decision. Applicants must withdraw applications to other colleges and universities. A statement of understanding, acknowledging the binding nature of this program must be signed by student, counselor, and parent/guardian.
C22. Early Action
Boston University Institutional Research 2017-2018

Boston University Common Data Set 18
Yes, credits are transferable from other Colleges/Universities.
Applicants Accepted Enrolled
Men 1,767 837 312
Women 2,164 1,207 446
Total 3,931 2,044 758
X Fall *
Winter
X Spring *
Summer
12 credits
High School transcript
College transcript Required of all
Essay or Personal Statement Required of all
Interview Not required
Standardized test scores Not required*
Transfer College Report from prior institutions Required of all**
Not applicable.
D. Transfer Admission
D1. Does your institution enroll transfer students?
D2. Provide the number of students who applied, were admitted, and enrolled as degree-seeking transfer students in fall 2017.
D3. Terms for which transfers may enroll
* Students must be, or have been, a degree candidate at another college or university, completed 12 or more credits, and enrolled full-time in order to be considered a transfer candidate.
D7. Minimum college grade point average required of transfer applicants, specify (on a 4.0 scale)
D4. Must a transfer applicant have a minimum number of credits and the unit of measure?
D5. Indicate all items required of transfer students to apply for admission
Not required for application, required to enroll
* TOEFL (iBT) or IELTS required for all non-native speakers of English.
** Transfer College Report from all prior institutions attended: required. One letter of recommendation should be from a current professor or college administrator familiar with students' academic ability. Students must be in good standing at current college or university.
D6. Minimum high school grade point average required of transfer applicants, specify (on a 4.0 scale)
Boston University Institutional Research 2017-2018

Boston University Common Data Set 19
Average GPA of accepted transfers is 3.6 on a 4.0 scale.
Fall
Spring
No.
Transfer College Report, college transcript, including proof of high school graduation (or GED), course syllabi,
and completed Common App instructor Evaluation Form must be submitted. Recommendations
and an essay are also required.
C
Varies by school and college
Varies by school and college
Not applicable.
D8. List any other application requirements specific to transfer applicants
Please see Boston University web site as well as The Undergraduate Programs Bulletin for specifics relating to your program of interest. (College of Fine Arts candidates must present a portfolio or participate in an audition.) See website for details: http://www.bu.edu/admissions/apply/freshman/cfa-requirements/
D9. Application priority, closing, notification, and candidate reply dates for transfer students.
Closing Date Notification Date Reply Date
D10. Does an open admission policy, if reported, apply to transfer students?
D11. Describe additional requirements for transfer admission, if applicable
D12. Report the lowest grade earned for any course that may be transferred for credit
D13. Maximum number of credits or courses that may be transferred from a two-year institution
D14. Maximum number of credits or courses that may be transferred from a four-year institution
D15. Minimum number of credits that transfers must complete at your institution to earn an associate's degree
March 1 Beginning Mid-April Starting June 1
November 1 Mid-Nov to Mid-Dec
Boston University Institutional Research 2017-2018

Boston University Common Data Set 20
Varies by school and college
D16. Minimum number of credits that transfers must complete at your institution to earn a bachelor's degree
D17. Describe other transfer credit policies
Please see Boston University web site as well as The Undergraduate Programs Bulletin for specifics relating to your program of interest. (College of Fine Arts candidates must present a portfolio or participate in an audition.)
Boston University Institutional Research 2017-2018

Boston University Common Data Set 21
Accelerated Degree Programs Yes
Accelerated Medical and Dental Programs
Cooperative (Work-Study) Program Yes
College of Engineering, only
Cross-registration Yes
Distance Learning Yes
Limited
Double Major Yes
Through the Boston University Collaborative Degree Program (BUCOP)
Dual Enrollment Yes
Only for those enrolled at Boston University Academy
English as a Second Language Courses Yes
Through the Center for English Language and Orientation Program (CELOP)
Exchange Student Program (Domestic) Yes
External Degree Program No
Honors Program Yes
Independent Study Yes
Internships Yes
Liberal Arts/Career Combination Yes
Student-designed Major Yes
Study Abroad Yes
Teacher Certification Program Yes
Weekend College Yes
Other
Through the College of Arts & Sciences, exceptional students assisted by the faculty design their own unique intellectual program of study.
Boston University sponsors one of the largest Study Abroad programs in the country. We offer 100+ programs on six continents and attract over 2,100 students each year. Students may choose from internships, field work/research, or languages and liberal arts programs.
Academic year and summer - Metropolitan College, only. Not generally appropriate for traditional undergraduate students.
Field study in Environmental/Ecological Science in Ecuador at the Biodiversity Station in the tropical rain forest. The Photonics Center.
E. Academic Offerings and Policies
E1. Specify study options: Identify those programs available at your institution
Kilachand Honors College (began Fall, 2010)
Boston University Institutional Research 2017-2018

Boston University Common Data Set 22
Computer Science
English (including Boston University Writing Program)
Foreign Languages
Humanities
Mathematics
Physical or Biological Sciences
Social Sciences
E2. No longer on the Common Data Set
E3. Areas in which all or most students are required to complete some course work prior to graduation
Boston University Institutional Research 2017-2018

Boston University Common Data Set 23
From out-of-state
Men who join fraternities
Women who join sororities
Living in college housing
Living off-campus/commute
Age 25 or older
Average age -- full time
Average age -- all students
There are currently more than 450 student organizations available for students - here is a small sample:
Alianza Latina Minority Engineers Society
Campus Ministries Model UN
Choral Group Music Ensembles
Concert and Jazz Bands Musical Theatre
Dance Opera
Drama/Theatre Radio Station
Habitat for Humanity International Student Government
Intramural Sports Student-Run Film Society
Independent Student Newspaper Symphony Orchestra
International Student Organization Ultimate Frisbee
Literary Magazine UMOJA Club
Marching Band Yearbook
Army ROTC is offered on campus.
Navy ROTC is offered on campus.
Air Force ROTC is offered on campus.
4% 5%
15% 15%
99% 75%
F. Student Life
F1. Percentages of first-time, first-year (freshman) students and all degree-seeking undergraduates enrolled in Fall 2017 who fit the following categories
First-Time, First-Year (Freshman) Students Undergraduates
84% 80%
20.6 21.3
F2. Activities offered
F3. Reserve Officer's Training Corps (ROTC)
1% 25%
2% 13%
20.6 21.0
Boston University Institutional Research 2017-2018

Boston University Common Data Set 24
Co-ed residences
Women-only residences
Apartment for married students (Limited to graduate students only)
No special housing for international students
Wellness housing
Apartment residences available to upper-class students
Specially equipped rooms for physically disabled and hearing impaired students
Cooperative housing
Theme Housing
Other: Specialty Halls/Floors (For groups of students with a common interest or academic major)
Kilachand Hall and Kilachand Honors College House
Gender Neutral housing
Global House living-learning community for students studying languages
F4. Housing Offered
All types of college-owned, -operated, or -affiliated housing available for undergraduates at your institution
Boston University Institutional Research 2017-2018

Boston University Common Data Set 25
First Year
Full-time tuition $50,980
Full-time mandatory fees $1,102
Room & board* (on campus) $15,270
Room only* (on campus) $10,080
Board only* (on campus) $5,190
* Can vary with type of accommodation and meal plan.
12 to 18 credits per term
No.
Not applicable.
Books and supplies $1,000
Room* only $10,080
Board* only $5,190
Transportation $630
Other (personal expenses) $1,320
* Can vary with type of accommodation and meal plan.
Part-time tuition for all students 1593 per credit
Typical part-time fees $60 per semester
$15,270
$10,080
$5,190
G2. Number of credits per term a student can take for the stated full-time tuition
G3. Do tuition and fees vary by year of study (e.g., sophomore, junior, senior)?
G4. If tuition and fees vary by undergraduate instructional program, describe briefly:
G. Annual Expenses
G1. Undergraduate full-time tuition, required fees, room and board
Typical tuition, required fees, and room and board for a full-time, undergraduate student for the 2017-2018 academic year.
Undergraduates
$50,980
$1,102
N/A $10,080
$2,290 $5,190
$2,480 $630
G5. Estimated expenses for a typical program
Resident students
Commuters from home
Commuters not living at home
$1,000 $1,000
$1,320 $1,320
G6. Undergraduate per-credit-hour charges FY 2017-18
Boston University Institutional Research 2017-2018

Boston University Common Data Set 26
Needs-analysis methodology used: Institutional Methodology
Total dollar amount awarded through 2017-18 to full-time and part-time degree-seeking undergraduates
Scholarships and Grants
Federal
State
Institutional
Total Scholarships and Grants
Undergraduate self-help
Student loans
Federal work-study
Total undergraduate self-help
Parent loans
Tuition waivers
Athletic awards
$15,931,009 $145,939
$1,456,853 $4,134
$205,506,905 $20,820,850
H. Financial Aid
H1. Aid awarded to enrolled undergraduates (2017-18 actual as of mid-semester, Fall, 2017)
Need-based aid Non-need-based aid
Need-based aid Non-need-based aid
$32,237,781 $48,480,067
$6,852,053 $0
Other external scholarships/Grants not administered by college $5,166,631 $8,522,876
$228,061,398 $29,493,799
$9,787,833 $16,676,608
$6,091,479 $7,787,865
$3,109,131 $12,103,363
State and other work-study/employment $0 $0
$39,089,834 $48,480,067
Boston University Institutional Research 2017-2018

Boston University Common Data Set 27
H2. Number of enrolled students receiving aid, Fall 2017The number of degree-seeking students who applied for and received financial aid.
Institutional need-based gift aid also based on academics, art (School of Fine Arts, only), music/drama (School of Fine Arts, only). Full-time freshmen are included in full-time undergraduates.
Full-time freshmen Full-time undergraduatesLess than full-time
undergraduates
(a) Number of degree seeking students 3,498
(c) Number in "b" who were determined to have need 1,500 6,439 20
16,349 367
(b) Number in "a" who were Financial Aid Applicants 1,708 7,333 36
(e) Number in "d" who received need-based gift aid 1,485 6,319 18
(d) Number in "c" who received any aid 1,500 6,438 20
(g) Number in "d" who received non-need-based gift aid 323 839 5
(f) Number in "d" who received need-based self-help aid 1,182 5,314 12
(i) Average % of need met for need-based aid recipients 92% 84% 46%
(h) Number in "d" whose need was fully met 479 1,453 7
(k) Average need-based gift for those in "e" $43,252 $36,055 $9,516
(j) Average package (up to need) for those in "d" $47,702 $42,180 $12,031
(m) Average need-based loan for those in "f" $1,886 $4,185 $3,017
(l) Average need-based self-help for those in "f" $3,434 $5,461 $3,329
Boston University Institutional Research 2017-2018

Boston University Common Data Set 28
H2A. Number of Enrolled Students Receiving Non-need based Scholarships and Grants
3526
Full-time freshmen Full-time undergraduatesLess than full-time
undergraduates
(n) Number in "a" with no need who received non-need-based aid 185 1,085 66
(o) Average award for those in "n" $24,138 $20,755 $2,382
(q) Average award for those in "p" $48,386 $51,182
(p) Number in "a" who received non-need-based athletic awards 69 249 0
H3. No longer on the Common Data Set
H4. Provide number of students in 2017 undergraduate class who entered as first-time students and received a bachelor's degree between July 1, 2016 and June 30, 2017, exclude transfers
Boston University Institutional Research 2017-2018
Boston University Common Data Set 29
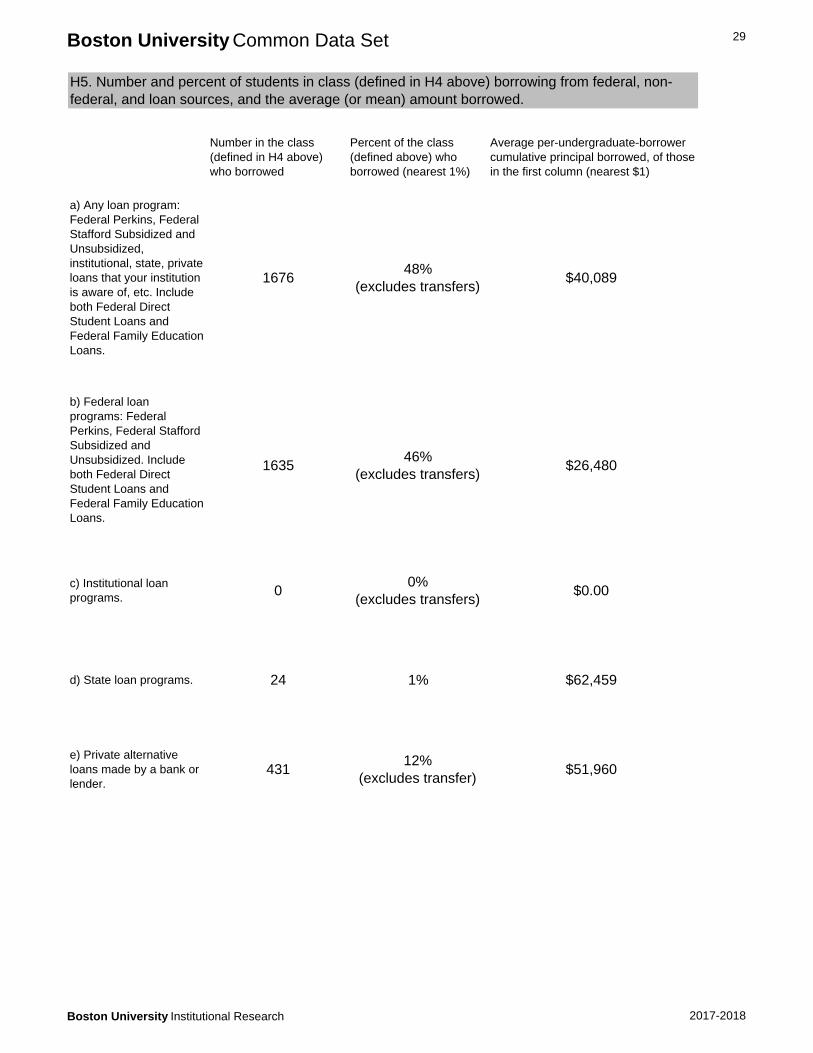
a) Any loan program: Federal Perkins, Federal Stafford Subsidized and Unsubsidized, institutional, state, private loans that your institution is aware of, etc. Include both Federal Direct Student Loans and Federal Family Education Loans.
167648%
(excludes transfers)$40,089
b) Federal loan programs: Federal Perkins, Federal Stafford Subsidized and Unsubsidized. Include both Federal Direct Student Loans and Federal Family Education Loans.
163546%
(excludes transfers)$26,480
H5. Number and percent of students in class (defined in H4 above) borrowing from federal, non-federal, and loan sources, and the average (or mean) amount borrowed.
Number in the class (defined in H4 above) who borrowed
Percent of the class (defined above) who borrowed (nearest 1%)
Average per-undergraduate-borrower cumulative principal borrowed, of those in the first column (nearest $1)
e) Private alternative loans made by a bank or lender.
43112%
(excludes transfer)$51,960
c) Institutional loan programs. 0
0%(excludes transfers)
$0.00
d) State loan programs. 24 1% $62,459
Boston University Institutional Research 2017-2018

Boston University Common Data Set 30
Number of recipients 199
Average aid $34,960
Total aid $6,957,076
Institution's Own Financial Aid Form: Not applicable
CSS Financial Aid/PROFILE: Not applicable
International Student's Financial Aid Application: Not applicable
X Free Application for Federal Student Aid (FAFSA): Required for all
Institution's Own Financial Aid Form: Not applicable
X CSS Financial Aid/PROFILE: Required for all
State (or Province) Scholarship/Grant Form: No required forms.
X Non-custodial (Divorced/Separated) Parent's Statement: Required for some
Business/Farm Supplement: Not applicable.
Other: Not Applicable
Deadline date February 1 (November 1 for Early Decision candidates)
Late March (December 15 for Early Decision candidates)
May 1 or within two weeks of notification of financial aid decision
H6. Aid to undergraduate international students: institution's policy regarding financial aid for undergraduate international (nonresident alien) students
Limited college-administered financial aid is available for undergraduate international students. Scholarship/grant aid is non-need-based.
H11. Freshmen reply date
H7. Financial aid forms international first-year (freshman) financial aid applicants must submit
X International Student's Certification of Finances: Required of all international students for full admission
H8. Financial aid forms domestic first-year (freshman) financial aid applicants must submit
H9. Filing dates for first-year (freshman) students
H10. Notification dates for first-year (freshman) students
Boston University Institutional Research 2017-2018
Boston University Common Data Set 31
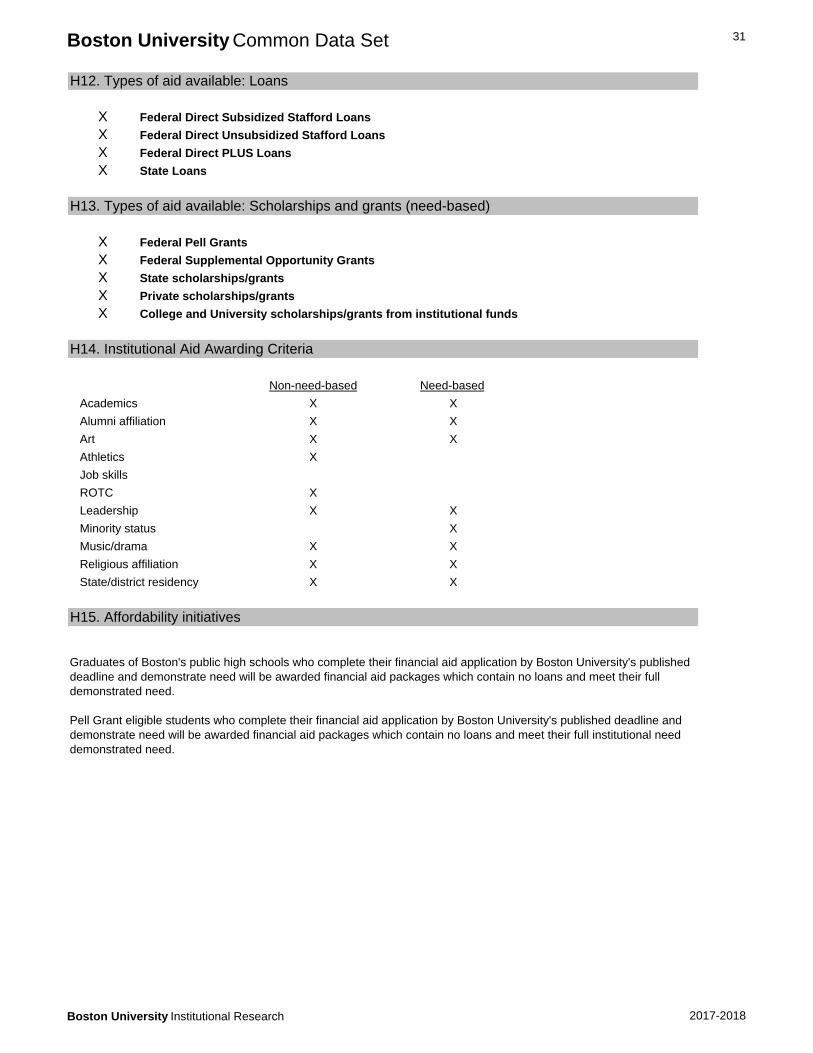
X Federal Direct Subsidized Stafford Loans
X Federal Direct Unsubsidized Stafford Loans
X Federal Direct PLUS Loans
X State Loans
X Federal Pell Grants
X Federal Supplemental Opportunity Grants
X State scholarships/grants
X Private scholarships/grants
X College and University scholarships/grants from institutional funds
Non-need-based Need-based
Academics X X
Alumni affiliation X X
Art X X
Athletics X
Job skills
ROTC X
Leadership X X
Minority status X
Music/drama X X
Religious affiliation X X
State/district residency X X
H12. Types of aid available: Loans
H13. Types of aid available: Scholarships and grants (need-based)
H14. Institutional Aid Awarding Criteria
H15. Affordability initiatives
Graduates of Boston's public high schools who complete their financial aid application by Boston University's published deadline and demonstrate need will be awarded financial aid packages which contain no loans and meet their full demonstrated need.
Pell Grant eligible students who complete their financial aid application by Boston University's published deadline and demonstrate need will be awarded financial aid packages which contain no loans and meet their full institutional need demonstrated need.
Boston University Institutional Research 2017-2018

Boston University Common Data Set 32
Full-time Part-time Total
a. Instructional Faculty 1,839 834 2,673
b. Instructional faculty who are members of minority groups 276 78 354
c. Instructional faculty who are women 777 371 1,148
d. Instructional faculty who are men 1,062 463 1,525
124 35 159
1,640 1,640
141 141
h. Total number whose highest degree is a bachelors 33 33
25 25
369 250 619
* Excludes all School of Medicine Faculty per IPEDS instructions
10 : 1
based on FTE student count of 15,837
based on FTE faculty count of 1,574
Other*
2-9 140
10-19 29
20-29 4
30-39 4
40-49 2
50-99 2
100+ 1
Total 182
* e.g. independent study, practicums, etc.
I2. Fall 2017 Student-to-faculty ratio
I3. Undergraduate class size - Fall 2017
Class Sections Class Subsections
527 131
I. Instructional Faculty
I1. Instructional Faculty* - Fall 2017
e. Instructional faculty who are non-resident aliens (international)
f. Total with doctorate, first professional, or other terminal degree
Not
Ava
ilabl
e
g. Total number whose highest degree is a non-terminal masters
i. Total number whose highest degree is unknown or other
2,830 1,668
152 15
255 35
118 4
1,192 531
371 824
215 128
j. Total number in stand alone graduate/professional programs in which faculty teach virtually only graduate-level students
Boston University Institutional Research 2017-2018

Boston University Common Data Set 33
Agriculture - - -
Architecture - - 0.3%
Area and ethnic studies 3.2% - 0.4%
Biological/life sciences 16.4% - 7.9%
Business/marketing 33.5% - 22.9%
Communications/journalism - - 13.6%
Communication technology - - -
Computer/information sciences 8.9% - 3.5%
Construction trades - - -
Education 0.3% - 1.7%
Engineering 0.3% - 8.9%
Engineering technologies 2.2% - -
English - - 1.5%
Family and consumer sciences - - -
Foreign languages and literature - - 1.0%
Health professions & related sciences 4.0% - 8.1%
History - - 1.1%
Homeland Security, Law/Fire, Protective Serv. 1.5% - 0.1%
Interdisciplinary studies - - 1.8%
Law/legal studies - - -
Liberal arts/general studies - - -
Library science - - -
Mathematics - - 2.2%
Mechanic and repair technologies - - -
Military science and technologies - - -
Natural resources/environmental science - - -
Parks and recreation - - -
Personal and culinary services - - -
Philosophy and religious studies - - 1.1%
Physical sciences - - 1.3%
Precision production - - -
Psychology - - 4.9%
Public administration and social services - - -
Science technologies - - -
Social sciences (excl. history) 12.0% - 14.1%
Social Work 15.6% - -
Theology and religious vocations - - -
Transportation and materials moving - - -
Visual and performing arts 2.2% - 3.6%
Other - - -
Total 100.1% - 100.0%
Diploma/Certificates Associates Bachelor's
J. Degrees Conferred
J1. Degrees conferred between July 1, 2016 and June 30, 2017
Diploma/Certificates Associates Bachelor's
Boston University Institutional Research 2017-2018


![Conversion of Radians and Degrees Degree Radian Radians Degrees Example 1Converting from Degrees to Radians [A] 60° [B] 30° Example 2Converting from Radians](https://img.pdfslide.us/doc/110x75/56649f475503460f94c68e94/conversion-of-radians-and-degrees-degree-radian-radians-degrees-example-1converting.jpg)