Embed Size (px)
Citation preview
1
The Macroeconomics of fiscal policy Federal Reserve Bank of Boston Economic Conference
Is the US prone to over consumption? Cape Cod, 14-16 June 2004
(Verbatim + slides)
I am very grateful for this invitation and also very impressed by the quality of this audience. I am afraid you will have to put up with a low-brow practitioner, speaking in broken English, and struggling to answer a quasi-metaphysical question.
Isn’t the US over-consuming? From an OECD point of view, this is maybe the most perennial question. One which we have been hearing again and again over the years in our Committees. Mostly from our European and Asian members. This is a question which is now being asked about other English-speaking countries too: the UK, Australia, Ireland, Canada and New Zealand. Countries with often low personal saving rates and large current account deficits.
At the same time, all these Anglos, they have had a huge macroeconomic performance over the past decade: strong trend growth and impressive resilience in the short run in the face of shocks. And maybe these low savings are part of a successful pattern in highly flexible and open economies.
After all, falling savings have been key to smooth the slowdown in most English countries while stubbornly high savings in Continental Europe have been key to sink domestic demand. From a long-term perspective, is it that surprising that high-growing countries have been importing a lot of capital, saving less in the process?
To access US capital, foreign savers have to drive up asset prices, make Americans wealthier and less prone to save and thus relieve them of some of their capital. In the process, everybody gains.
So far so good. But there is also a US singularity within the Anglo-group: a very large public deficit, which we don’t see receding over the next few years. And accordingly an extraordinarily low rate of national savings, both by historical and international standards (Slide 4).
What I shall try to argue this morning is twofold:
� During the late 90s the US economy was behaving as a typical member of the Anglo group. And the case for “over-consumption” was not that strong;
� But now, things have changed. National savings are very low and the rate of investment is below what is needed to support natural growth in the long run. At the same time the current account deficit is very large.
Barring an unlikely endogenous recovery in national savings, the time for serious fiscal retrenchment has probably come.
Before starting with the empirical analysis, I would like to tell you how we approached the notion of “over-consumption”. Which is not so easy to capture (Slide 5). “Over-consumption” is clearly a normative concept. There is “over-consumption” if current consumption is too high to be consistent with the maximisation of consumers’ welfare over time.

2
Current consumption is too high today because it will be too low tomorrow. When dealing with optimal saving/consumption there are two dimensions to consider.
Optimal saving should:
� provide appropriate capital accumulation to prepare for future consumption; � allocate efficiently consumption over the life cycle, this is the so-called “consumption smoothing”.
Trying to approach optimal consumption we have also adopted the point of view of a benevolent social planner, mindful of future generations, very much of an intertemporal Rawlsian. The question is also about the US being prone to over-consumption. And for that matter you need to look at several episodes of recent US history. What makes the question about over-consumption very challenging is that (slide 6):
� you are looking for normative answers; � but the empirical material available is mostly about positive economics.
Basically there are two strategies to approach the issue:
First, the “Demiurgic programme”. That is an ambitious optimisation exercise. Using a calibrated general equilibrium model to confront calculated paths of optimal consumption with reality. And then explaining those differences by various imperfections: suboptimal policies, market imperfections, forecasting errors… This option, unfortunately, goes well beyond the means of simple OECD mortals.
Second, a much less ambitious route, which we adopted and where we just tried to glean normative insights from positive empirical analysis, using two approaches:
� ex-post analysis to assess the magnitude of a possible over-consumption syndrome during the late 90s; � ex-ante scenarios to ponder the risks of over-consumption associated with persistently large public
deficits.
For our analysis of the late 90s, we have adopted a very crude rule, which is the following:
� if we observe a stable long-run relationship between say consumption and wealth, then this relationship is deemed optimal. And departures from it are potentially sub-optimal.
Our ex-ante scenario then tries to assess the risk of US and international private investment being crowded out by large American public deficits.
It starts with a broad-gauged assessment of the “financing needs” of the US economy, which are strong:
� the OECD does not see US public deficits falling rapidly in the years ahead; � the rate of private investment is now too low to match the natural rate of growth and will have to rise
(slide 9).
On the financing side, the net asset position of the US is deteriorating rapidly with the risk of too many dollar-denominated assets accumulating in foreign portfolios. Marginal financing from abroad may then become very costly. In any case, income from imported capital would not accrue to US citizens in the future.

3
A benevolent social planner, working with imperfect information, may then conclude that the safe option is to cut public deficits. But he may also want to know whether he could not benefit from an endogenous recovery of private savings. Engineered for instance by forward looking, or altruistic, US taxpayers (slide 8).
After all, this hypothesis is not completely incongruous. Various studies are indeed pointing to the existence of strong private savings offsets in the face of high deficits. This is an issue which we have explored recently at the OECD using panel data analysis. And I will share with you some of our conclusions.
I would like now to move to the empirical analysis and see whether the US was prone to over-consumption in the late 90s and the very early 2000s.
To prove the case for over-consumption, you need to show that either capital accumulation was insufficient or consumption was excessively front-loaded in reaction to higher growth prospects.
Excessive front-loading could come from two sources:
� first, exuberant expectations about future growth leading to overvalued equity prices; � second, abnormally high propensity to consume out of wealth, by historical standards.
You could think of a case of “habit formation” or “ratchet effect”, with people continuing to spend like in the good old days. While, in fact, equity prices are now much lower. This is the kind of thought you could harbour looking at this slide (slide 10) or this one (slide 11).
Here are the questions and now some tentative answers.
� Capital accumulation: it is hard to argue that in the late 90s and the early 2000s capital accumulation was insufficient. We had just the opposite: over-investment.
� Looking now at “over-consumption”, stricto sensu, it is not obvious that consumption was ever out of line, compared with what perceived wealth was suggesting. To illustrate this point we estimated a standard consumption function with all the usual ingredients (housing and financial wealth, short-run interest rates, inflation, unemployment, income …) (Slide 12). Looking at residuals, what we see is a modest case of excess consumption, by 2% in 2000 and down to 1% in 2003 (slide 13). Consumption held up well in 2001/2002/2003 because of lower interest rates, higher housing prices, and solid incomes, supported by fiscal policy.
So, no ratchet effect in sight.
I should add that a number of micro-based studies also found that in the late 90s or early 2000s, there was adequate savings for retirement at the individual level.
This exercise takes wealth as a given. But we know equity prices were overvalued and may still be. This is at least what suggests a very crude utilisation of the Gordon-Shapiro formula (slide 14). Setting the risk premia and the equilibrium real long term interest rate at their average value over the period 1985-95, it seems that implied average growth was somewhat optimistic in the late 90s and maybe still in 2003, but in a mild way. In any case, what is really surprising is the comparison with the euro area where the dividend price ratio was incredibly low in 2000 suggesting either high growth expectations or a very small risk premia. Using this methodology there is still a much stronger case for over-valuation in Europe than in the US.
4
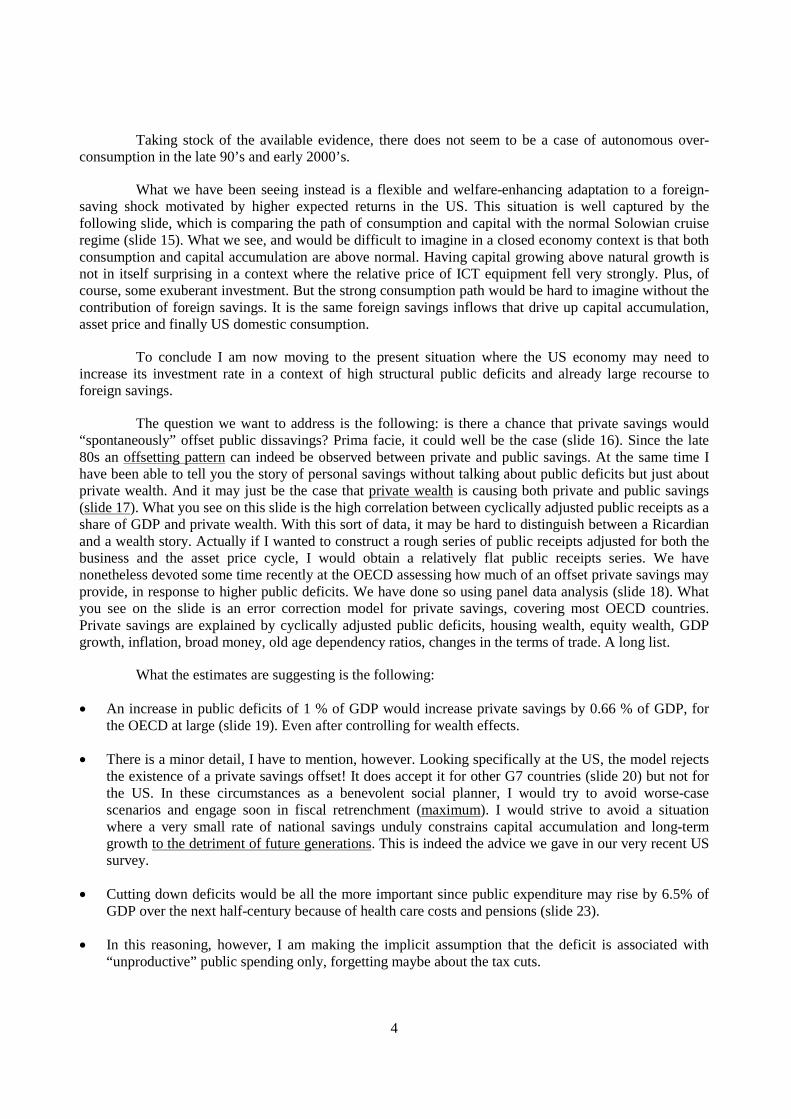
Taking stock of the available evidence, there does not seem to be a case of autonomous over-consumption in the late 90’s and early 2000’s.
What we have been seeing instead is a flexible and welfare-enhancing adaptation to a foreign-saving shock motivated by higher expected returns in the US. This situation is well captured by the following slide, which is comparing the path of consumption and capital with the normal Solowian cruise regime (slide 15). What we see, and would be difficult to imagine in a closed economy context is that both consumption and capital accumulation are above normal. Having capital growing above natural growth is not in itself surprising in a context where the relative price of ICT equipment fell very strongly. Plus, of course, some exuberant investment. But the strong consumption path would be hard to imagine without the contribution of foreign savings. It is the same foreign savings inflows that drive up capital accumulation, asset price and finally US domestic consumption.
To conclude I am now moving to the present situation where the US economy may need to increase its investment rate in a context of high structural public deficits and already large recourse to foreign savings.
The question we want to address is the following: is there a chance that private savings would “spontaneously” offset public dissavings? Prima facie, it could well be the case (slide 16). Since the late 80s an offsetting pattern can indeed be observed between private and public savings. At the same time I have been able to tell you the story of personal savings without talking about public deficits but just about private wealth. And it may just be the case that private wealth is causing both private and public savings (slide 17). What you see on this slide is the high correlation between cyclically adjusted public receipts as a share of GDP and private wealth. With this sort of data, it may be hard to distinguish between a Ricardian and a wealth story. Actually if I wanted to construct a rough series of public receipts adjusted for both the business and the asset price cycle, I would obtain a relatively flat public receipts series. We have nonetheless devoted some time recently at the OECD assessing how much of an offset private savings may provide, in response to higher public deficits. We have done so using panel data analysis (slide 18). What you see on the slide is an error correction model for private savings, covering most OECD countries. Private savings are explained by cyclically adjusted public deficits, housing wealth, equity wealth, GDP growth, inflation, broad money, old age dependency ratios, changes in the terms of trade. A long list.
What the estimates are suggesting is the following:
� An increase in public deficits of 1 % of GDP would increase private savings by 0.66 % of GDP, for the OECD at large (slide 19). Even after controlling for wealth effects.
� There is a minor detail, I have to mention, however. Looking specifically at the US, the model rejects the existence of a private savings offset! It does accept it for other G7 countries (slide 20) but not for the US. In these circumstances as a benevolent social planner, I would try to avoid worse-case scenarios and engage soon in fiscal retrenchment (maximum). I would strive to avoid a situation where a very small rate of national savings unduly constrains capital accumulation and long-term growth to the detriment of future generations. This is indeed the advice we gave in our very recent US survey.
� Cutting down deficits would be all the more important since public expenditure may rise by 6.5% of GDP over the next half-century because of health care costs and pensions (slide 23).
� In this reasoning, however, I am making the implicit assumption that the deficit is associated with “unproductive” public spending only, forgetting maybe about the tax cuts.

5
� To shed light on this issue, I would like to make three remarks:
� first, the tax cuts have an opportunity cost in terms of foregone private capital accumulation.
Back of the envelope calculations suggest the deficit incurred to finance the tax cuts may reduce national income by more than 1% over the next decade, through lower capital accumulation
� Partly offsetting this loss, the lower average marginal tax rate on labour income would increase national income by 0.5%.
� The impact of tax cuts on dividend is not easy to gauge. It needs, however, to be relatively strong to make the deficit financed tax cuts growth enhancing.
So to conclude:
� no obvious over-consumption up to now; � but strong risks in the future, given existing fiscal policies.
1
THE MACROECONOMICS OF FISCAL POLICY
FEDERAL RESERVE BANK OF BOSTON ECONOMIC CONFERENCE
Chatham, Massachusetts June 14-16, 2004
IS THE U.S. PRONE TO “OVER-CONSUMPTION”?
by Jean-Philippe Cotis, Jonathan Coppel and Luiz de Mello
OECD, Economics Department1
1 Jean-Philippe Cotis is the OECD Chief Economist, Jonathan Coppel is a senior economist working in Mr
Cotis’s office and Luiz de Mello is a senior economist in the Country Studies Branch of the Economics Department. Correspondence to the authors can be e-mailed to [email protected]. The authors would like to thank Debbie Bloch for her expert statistical assistance and Alain De Serres, Jorgen Elmeskov, Michael Kennedy, Vincent Koen and Thomas Laubach for useful comments and suggestions on earlier versions of this paper. The views expressed in this paper are those of the authors and do not necessarily reflect those of the OECD secretariat or the Organisation’s member countries.
2
“I can get no remedy against this consumption of the purse: borrowing only lingers and lingers it out, but the disease is incurable” William Shakespeare
1. Introduction
In 2003 U.S. national saving amounted only to 13 ½ per cent of GDP. This was the lowest rate in
U.S. history since the Great Depression and also one of the weakest among OECD countries. Following a
relatively brief period of a rising saving rate over the mid-1990s, it started to decline during the
penultimate years of the investment boom and this continued during the subsequent investment slump. The
weakening of national saving has been associated with a parallel shift of the current account, with the
deficit reaching 5 per cent of GDP, a level widely seen as unsustainable.
In this context, commentators and policy makers outside the U.S. have been increasingly worried
about a “structural” lack of saving in America, with potentially adverse consequences for capital
accumulation OECD-wide. A major source of concern in the short run is a steep back-up of long-term
interest rates crowding out private investment at a premature stage of the recovery. From a longer-term
perspective too, the substantial fall of U.S. national saving is not seen as an optimal response to the
acceleration in total factor productivity and potential output that the American economy has enjoyed since
the mid-1990s. It is often felt that the U.S. investment boom has led to a costly diversion of foreign saving
with detrimental consequences on potential growth outside America. What would have been needed
instead is a stronger contribution from U.S. domestic saving to the financing of the investment surge.
Whether these concerns are legitimate is an open question as reflected in this session’s title “is the
U.S. prone to ‘over-consumption’?” The issues deserve indeed a thorough examination, with a clear
distinction between the past behaviour of the U.S. economy and future prospects. In a nutshell, this paper
will argue that “prone to over-consumption” is an excessively severe description of the past, but may well
prove a real issue in the future.

3
Looking at past behaviour in a purely descriptive way, it seems obvious that the U.S. has been
consuming over and above what historical and cross-country standards would suggest. The American
situation is not unique, however, and bears many similarities with developments in the UK and other
English-speaking countries, such as Canada and Australia, where either national or household saving have
fallen to very low levels. It should also be added that these countries have in common a very robust
macroeconomic performance in recent years: their output growth has been strong and their resilience
during the past slowdown was impressive.
This common pattern of performance and behaviour could be taken to suggest that falling saving
rates are the desirable response in a variety of circumstances. For instance, during the past conjunctural
slowdown, falling public or private saving in English-speaking countries may have been key to stabilising
the world economy. Conversely, an overhang of precautionary savings may have proved detrimental to
growth, as suggested by the lacklustre performance of Continental Europe.
In a world where capital has become very mobile, falling saving may also be appropriate for
countries experiencing above-average growth and profitability. As foreign investors seek to share in these
gains, home-country asset prices are driven up, generating substantial wealth effects and lower competition
from domestic savers. In principle this decline in domestic saving is welfare enhancing: it allows profitable
portfolio diversification for foreign investors and consumption smoothing for domestic households without
necessarily harming world capital accumulation.
With a bit of creativity one can therefore find good reasons why apparent “over-consumption” was
in fact desirable. Given the very steep fall of U.S. national saving it may nonetheless be worth assessing
the extent to which such a decline could be due to suboptimal public policies and ‘abnormal’ behaviour on
the part of private agents and what this may imply for the sustainability of output and consumption growth
both in the U.S. and world-wide.
4
The objective of this paper is therefore to survey recent empirical work at the OECD and elsewhere
that can shed some light, in a tentative and crude way, on a possible U.S. “over-consumption” problem.
The paper is organised as follows. The next section briefly reviews recent and longer-term developments in
U.S. saving, and considers how these compare internationally. It also addresses a number of important
measurement issues. Section 3 discusses the concept of “prone to over-consumption” adopted in this paper
and how it relates to the theoretical notion of optimum consumption. In section 4 we try to identify periods
of unusually high consumption using econometric methods for ex-post analysis and then assess
judgementally whether these situations represent cases of over-consumption in a normative sense. A fifth
section considers the likely consequences for U.S. national saving and long-term growth of a lasting shift
towards high structural public deficits. Section 6 summarises our main conclusions.
2. Past saving trends
2.1 Measurement of saving2
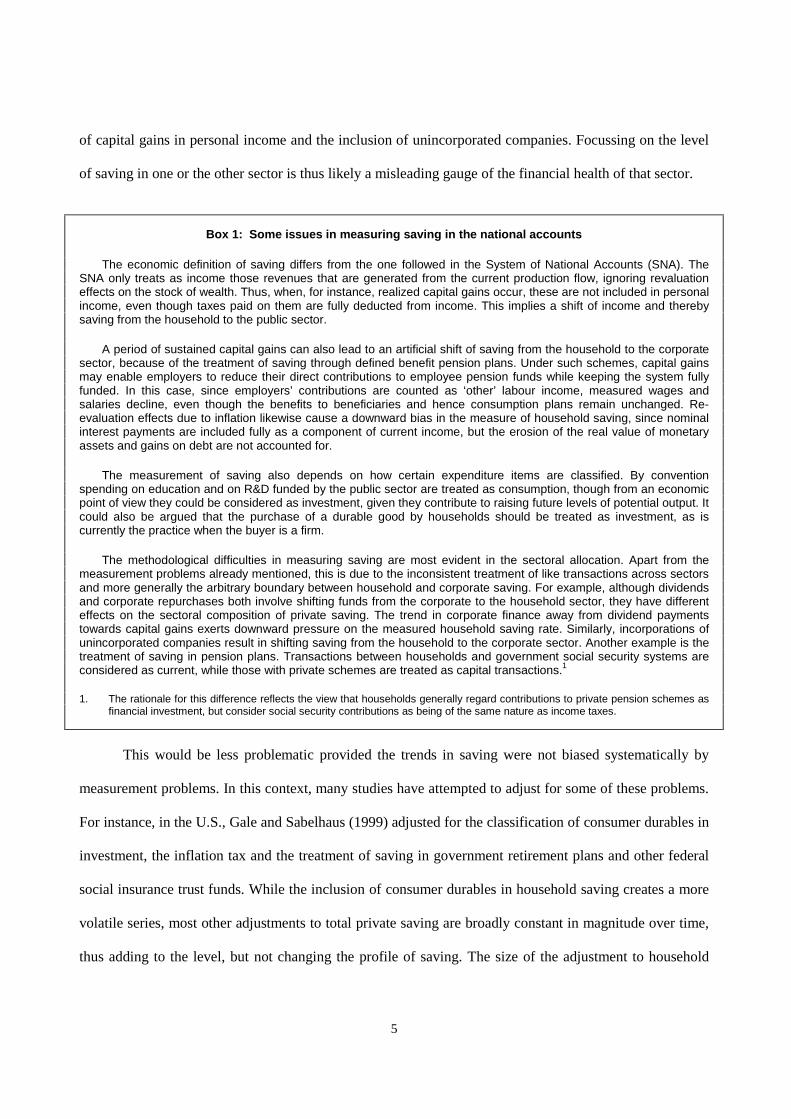
Saving can be conceptualized as output produced in a period that is not consumed in the same
period; instead, it is available for future consumption. In principle then, a straightforward operational
definition of saving is income less consumption. But in practice saving statistics are fraught with
measurement problems (see Box 1). These relate to the measurement of income, the classification of
expenditures between consumption and investment and the allocation of saving between households,
businesses and government sectors.
The effect of these measurement problems not only show up at the aggregate level, where the effects
can be large3 but, sometimes more importantly, also influence the sectoral decomposition of saving. The
household saving rate, for instance, is biased by re-evaluation effects due to inflation, the partial treatment
2 For a detailed discussion on the national accounts measurement of saving see for example, Gale and
Sabelhaus (1999) and Price, De Mello and Kongsrud (2004). 3 See Shafer, Elmeskov and Tease (1992).
5
of capital gains in personal income and the inclusion of unincorporated companies. Focussing on the level
of saving in one or the other sector is thus likely a misleading gauge of the financial health of that sector.
Box 1: Some issues in measuring saving in the national accounts
The economic definition of saving differs from the one followed in the System of National Accounts (SNA). The SNA only treats as income those revenues that are generated from the current production flow, ignoring revaluation effects on the stock of wealth. Thus, when, for instance, realized capital gains occur, these are not included in personal income, even though taxes paid on them are fully deducted from income. This implies a shift of income and thereby saving from the household to the public sector.
A period of sustained capital gains can also lead to an artificial shift of saving from the household to the corporate sector, because of the treatment of saving through defined benefit pension plans. Under such schemes, capital gains may enable employers to reduce their direct contributions to employee pension funds while keeping the system fully funded. In this case, since employers’ contributions are counted as ‘other’ labour income, measured wages and salaries decline, even though the benefits to beneficiaries and hence consumption plans remain unchanged. Re-evaluation effects due to inflation likewise cause a downward bias in the measure of household saving, since nominal interest payments are included fully as a component of current income, but the erosion of the real value of monetary assets and gains on debt are not accounted for.
The measurement of saving also depends on how certain expenditure items are classified. By convention spending on education and on R&D funded by the public sector are treated as consumption, though from an economic point of view they could be considered as investment, given they contribute to raising future levels of potential output. It could also be argued that the purchase of a durable good by households should be treated as investment, as is currently the practice when the buyer is a firm.
The methodological difficulties in measuring saving are most evident in the sectoral allocation. Apart from the measurement problems already mentioned, this is due to the inconsistent treatment of like transactions across sectors and more generally the arbitrary boundary between household and corporate saving. For example, although dividends and corporate repurchases both involve shifting funds from the corporate to the household sector, they have different effects on the sectoral composition of private saving. The trend in corporate finance away from dividend payments towards capital gains exerts downward pressure on the measured household saving rate. Similarly, incorporations of unincorporated companies result in shifting saving from the household to the corporate sector. Another example is the treatment of saving in pension plans. Transactions between households and government social security systems are considered as current, while those with private schemes are treated as capital transactions.1
1. The rationale for this difference reflects the view that households generally regard contributions to private pension schemes as financial investment, but consider social security contributions as being of the same nature as income taxes.
This would be less problematic provided the trends in saving were not biased systematically by
measurement problems. In this context, many studies have attempted to adjust for some of these problems.
For instance, in the U.S., Gale and Sabelhaus (1999) adjusted for the classification of consumer durables in
investment, the inflation tax and the treatment of saving in government retirement plans and other federal
social insurance trust funds. While the inclusion of consumer durables in household saving creates a more
volatile series, most other adjustments to total private saving are broadly constant in magnitude over time,
thus adding to the level, but not changing the profile of saving. The size of the adjustment to household
6
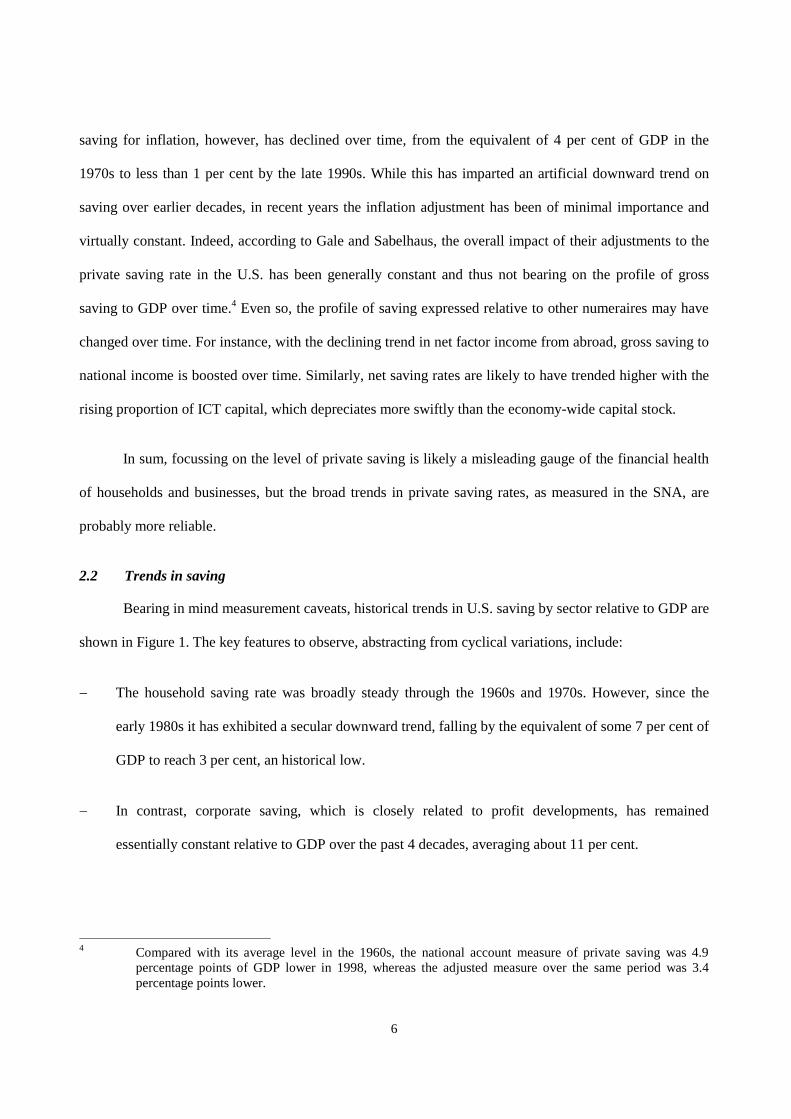
saving for inflation, however, has declined over time, from the equivalent of 4 per cent of GDP in the
1970s to less than 1 per cent by the late 1990s. While this has imparted an artificial downward trend on
saving over earlier decades, in recent years the inflation adjustment has been of minimal importance and
virtually constant. Indeed, according to Gale and Sabelhaus, the overall impact of their adjustments to the
private saving rate in the U.S. has been generally constant and thus not bearing on the profile of gross
saving to GDP over time.4 Even so, the profile of saving expressed relative to other numeraires may have
changed over time. For instance, with the declining trend in net factor income from abroad, gross saving to
national income is boosted over time. Similarly, net saving rates are likely to have trended higher with the
rising proportion of ICT capital, which depreciates more swiftly than the economy-wide capital stock.
In sum, focussing on the level of private saving is likely a misleading gauge of the financial health
of households and businesses, but the broad trends in private saving rates, as measured in the SNA, are
probably more reliable.
2.2 Trends in saving
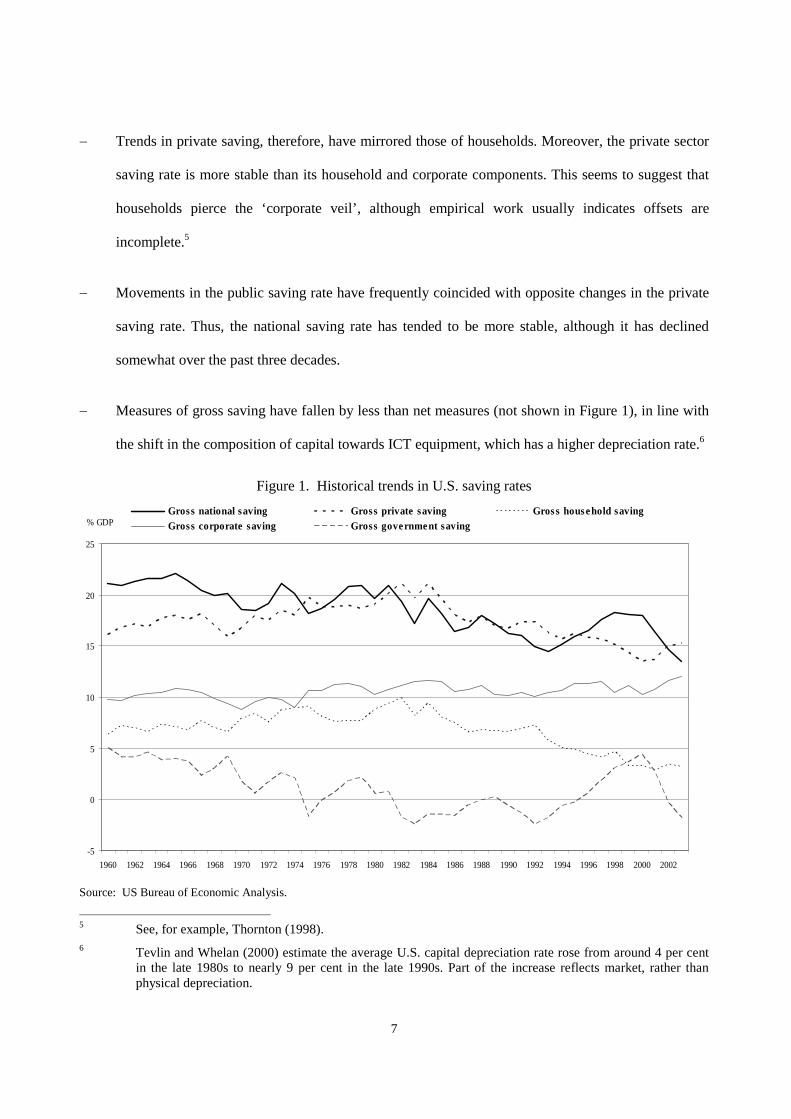
Bearing in mind measurement caveats, historical trends in U.S. saving by sector relative to GDP are
shown in Figure 1. The key features to observe, abstracting from cyclical variations, include:
� The household saving rate was broadly steady through the 1960s and 1970s. However, since the
early 1980s it has exhibited a secular downward trend, falling by the equivalent of some 7 per cent of
GDP to reach 3 per cent, an historical low.
� In contrast, corporate saving, which is closely related to profit developments, has remained
essentially constant relative to GDP over the past 4 decades, averaging about 11 per cent.
4 Compared with its average level in the 1960s, the national account measure of private saving was 4.9
percentage points of GDP lower in 1998, whereas the adjusted measure over the same period was 3.4 percentage points lower.
7
� Trends in private saving, therefore, have mirrored those of households. Moreover, the private sector
saving rate is more stable than its household and corporate components. This seems to suggest that
households pierce the ‘corporate veil’, although empirical work usually indicates offsets are
incomplete.5
� Movements in the public saving rate have frequently coincided with opposite changes in the private
saving rate. Thus, the national saving rate has tended to be more stable, although it has declined
somewhat over the past three decades.
� Measures of gross saving have fallen by less than net measures (not shown in Figure 1), in line with
the shift in the composition of capital towards ICT equipment, which has a higher depreciation rate.6
Figure 1. Historical trends in U.S. saving rates
-5
0
5
10
15
20
25
1960 1962 1964 1966 1968 1970 1972 1974 1976 1978 1980 1982 1984 1986 1988 1990 1992 1994 1996 1998 2000 2002
% GDPGross national saving Gross private saving Gross household savingGross corporate saving Gross government saving
Source: US Bureau of Economic Analysis.
5 See, for example, Thornton (1998). 6 Tevlin and Whelan (2000) estimate the average U.S. capital depreciation rate rose from around 4 per cent
in the late 1980s to nearly 9 per cent in the late 1990s. Part of the increase reflects market, rather than physical depreciation.
8
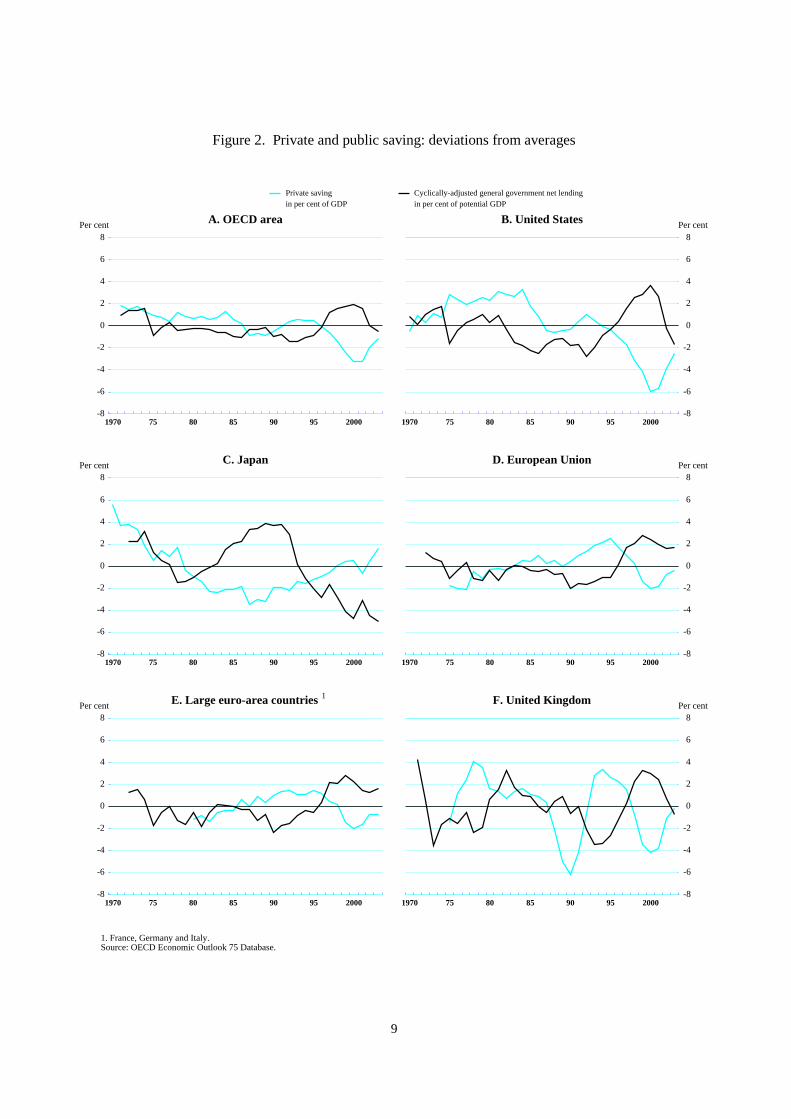
Certain features of trends in U.S. saving are equally evident in other countries. For instance,
changes in fiscal stance have often taken place concomitantly with opposite co-movements in private
saving, thus smoothing fluctuations in national saving (Figure 2), as discussed further in Section 5.7 A
secular decline in domestic saving has also been evident in Japan, France and Italy over the past three
decades, although the initial rate of saving in these countries was higher. And household saving rates have
dropped considerably in most G-7 countries. There are also important differences among OECD countries.
The German and Canadian national saving rate has been remarkably stable, while developments in
corporate saving rates have been diverse, rising in some countries and falling in others. Overall, however,
the U.S. domestic saving rate is lower than in all the other G-7 countries, except the U.K.
7 The average correlation between changes in private saving and the cyclically-adjusted budget balance
between 1970 and 2003 is close to -0.5 for the OECD area as a whole.
9
Figure 2. Private and public saving: deviations from averages
-8
-6
-4
-2
0
2
4
6
8Per cent
1970 75 80 85 90 95 2000
A. OECD area
Private saving Cyclically-adjusted general government net lendingin per cent of GDP in per cent of potential GDP
-8
-6
-4
-2
0
2
4
6
8Per cent
1970 75 80 85 90 95 2000
B. United States
-8
-6
-4
-2
0
2
4
6
8Per cent
1970 75 80 85 90 95 2000
C. Japan
-8
-6
-4
-2
0
2
4
6
8Per cent
1970 75 80 85 90 95 2000
D. European Union
-8
-6
-4
-2
0
2
4
6
8Per cent
1970 75 80 85 90 95 2000
E. Large euro-area countries
1. France, Germany and Italy.Source: OECD Economic Outlook 75 Database.
1
-8
-6
-4
-2
0
2
4
6
8Per cent
1970 75 80 85 90 95 2000
F. United Kingdom
10
3. Conceptual clarifications and approach adopted by the paper
“Over-consumption” is obviously a normative issue, whereas most empirical evidence is based on
positive analysis. To bridge that gap, this section aims to clarify what could be meant by “prone to over-
consumption” and how to use existing empirical studies to glean normative insights on this issue.
3.1 “Prone to over-consumption”: some conceptual clarifications
I. “Over-consumption”
A highly normative notion such as over-consumption is intuitive yet hard to pin down in practice. It
refers to a situation where consumption is too high to be consistent with the maximisation of consumers’
welfare over the long term, leading to unduly low consumption in the future. Beyond this general
definition the challenge is then to clarify, at least in broad terms, what lies behind the words “optimal
consumption” or “optimal saving”.
Maximising the expected utility of consumption over time confers two major roles on saving:
providing appropriate capital accumulation to prepare for future consumption and allocating consumption
in a welfare-improving way over the life-cycle. As a result, consumption on an optimal path should be as
high and smooth as possible. In the steady state, this would imply that consumption, as well as output and
capital, would grow at the natural rate, defined as the sum of technical progress and the growth rate of the
labour force.
The path for optimal consumption will of course deviate from the steady state when the economy is
disturbed by shocks to technical progress and demographic growth, shifts in time preferences or cyclical
fluctuations. These disturbances will affect optimal consumption in sometimes conflicting ways. For
instance, a positive shock to technical progress, which is obviously highly topical in the U.S. case, will call
for an increase in optimal saving so as to stabilise the capital-to-efficient-labour ratio, but also for an
offsetting reallocation of consumption towards the present to avoid “excessive” consumption in the future.
11
It is also important to determine what categories of agents should be involved in the optimisation
process. There are “natural” moral reasons to extend this welfare maximisation to future generations. In the
end, future consumption involves future consumers, not yet born, whose incomes will depend on the
inherited capital stock. Taking a view about optimal consumption is impossible without deciding on the
desirable degree of intergenerational altruism, with strong implications for fiscal policy should the
benevolent social planner discount the welfare of future generations differently than current generations
do. In this respect, what would be very objectionable for an altruistic social planner8 is a situation
combining persistently large public deficits and continuously deteriorating public net wealth – including
unfunded liabilities – with limited intergenerational altruism on the household side.
In a context of strong international mobility of capital, optimal consumption and saving also need
to be cast in a worldwide framework. Although capital mobility does not really matter if all regions of the
world share identical experiences, it matters a lot more with idiosyncratic developments in one region. A
negative idiosyncrasy could materialise in the U.S. under the guise of persistently large public deficits,
with possible adverse consequences for long-term world capital accumulation. Positive idiosyncrasies are
also possible. The best recent example of such an idiosyncrasy is the rapid productivity growth and the
steep fall in the relative price of ICT capital that the U.S. experienced over the past decade. Passing
judgement on how well the U.S. economy reacted to this positive shock is obviously very important for
this discussion.
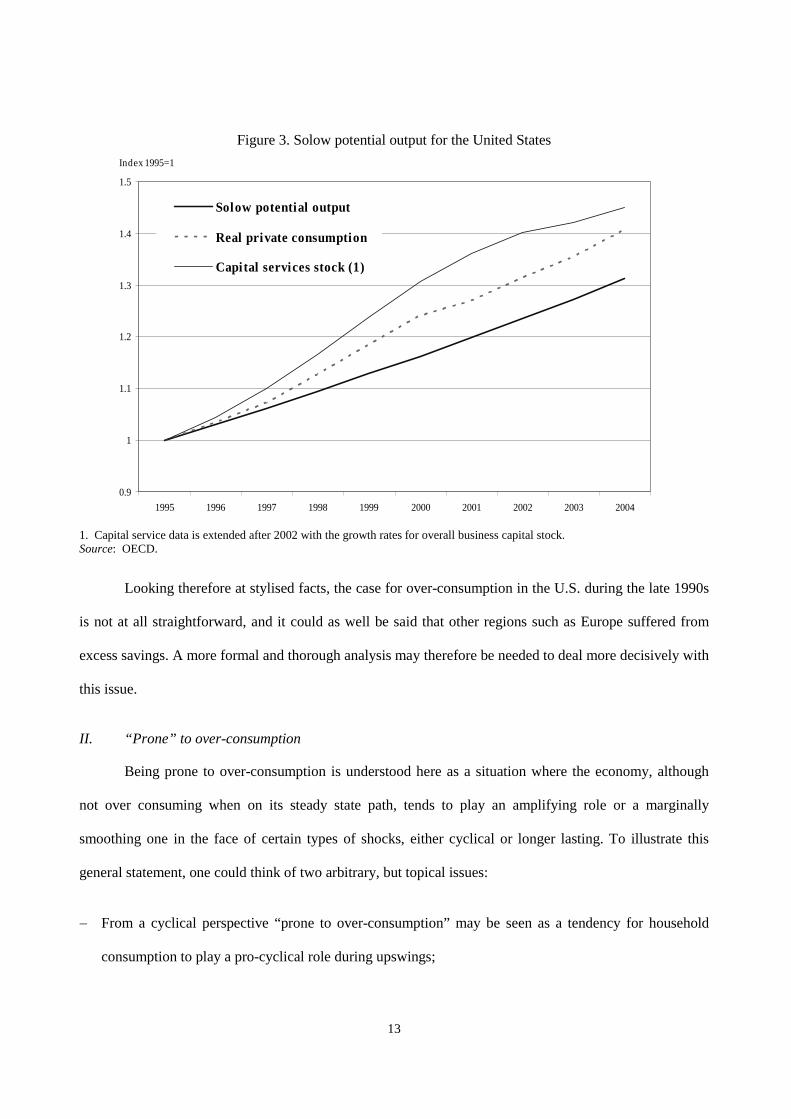
Moving from a closed to an open economy framework makes the task much easier. Indeed, looked at
in the context of a closed economy framework, the way the U.S. economy departed from a well-behaved
Solowian steady state seems rather paradoxical. What is puzzling in a closed-economy context is that
both capital accumulation and consumption have outpaced the natural Solowian output by such a wide
8 As exemplified by the infinitely-lived agent à la Ramsey.

12
margin (Figure 3) 9. Looking at consumption in isolation it is tempting to prognosticate a blatant case of
“over-consumption”. But then how can we explain such an exuberant capital path?10
Explanations for this in a closed economy context all seem unlikely. One could assume, for instance,
that the steep falls in the relative price of capital observed in the U.S. could have induced both capital
deepening and consumption growing above the natural rate, provided some special conditions are met. It
would have been the case, for instance, if the fall in the price of capital elicited a modest increase in the
volume of investment, thus freeing purchasing power for additional consumption.11 However, would have
such a modest investment response been enough to engineer the sort of exuberant capital deepening that
the U.S. economy experienced? One could alternatively invoke wealth effects arising from higher technical
progress to justify a declining saving ratio. But which domestic agents would have financed private sector
physical capital accumulation in the meantime?
If this scenario of very strong consumption growth and capital over-accumulation is an unlikely
outcome in a closed economy, it is easily conceivable in an open-economy context. If indeed technical
progress in one region is strong relative to the rest of the world, foreign savings should spontaneously tend
to displace domestic savings and to increase the capital stock until marginal products of capital are
equalised worldwide. In the process, the price of capital relative to the rest of the world should increase in
the high-growth region, generating positive wealth effects and a higher path of optimal consumption. Since
it increases incomes in both regions, the new equilibrium should be welfare enhancing, providing it is not
founded on mistakenly optimistic relative return expectations.
9 Figure 3 shows the path for potential growth from 1995 based on average total factor productivity growth
over the period of 2.2 per cent per annum and labour force growth of 1.3 per cent per annum. There are several available measures of the capital stock for the U.S. Each series, however, grew at a faster pace than the Solow potential over the period. Between 1995 and 2000 the U.S capital stock had reached a level some 12 per cent above the equivalent for potential output. And over the same period, private consumption had risen to a level almost 7 per cent above the equivalent for Solow potential output. Similar profiles are evident when the same calculations are made over longer time periods.
10 Indeed, it was so strong that it was followed by an investment bust and lingering under-utilisation of production capacity.
11 This would happen in the case of a low elasticity of substitution between capital and labour.
13
Figure 3. Solow potential output for the United States
0.9
1
1.1
1.2
1.3
1.4
1.5
1995 1996 1997 1998 1999 2000 2001 2002 2003 2004
Index 1995=1
Solow potential output
Real private consumption
Capital services stock (1)
1. Capital service data is extended after 2002 with the growth rates for overall business capital stock. Source: OECD.
Looking therefore at stylised facts, the case for over-consumption in the U.S. during the late 1990s
is not at all straightforward, and it could as well be said that other regions such as Europe suffered from
excess savings. A more formal and thorough analysis may therefore be needed to deal more decisively with
this issue.
II. “Prone” to over-consumption
Being prone to over-consumption is understood here as a situation where the economy, although
not over consuming when on its steady state path, tends to play an amplifying role or a marginally
smoothing one in the face of certain types of shocks, either cyclical or longer lasting. To illustrate this
general statement, one could think of two arbitrary, but topical issues:
� From a cyclical perspective “prone to over-consumption” may be seen as a tendency for household
consumption to play a pro-cyclical role during upswings;
14
� From a longer-run angle and looking at national savings, it may take the form of a difficulty to offset a
lasting shift into larger public deficits through a significant increase in private savings.
3.2 The approach adopted: an empirical analysis informed by rough notions of optimal consumption
What would be needed, ideally, to address over-consumption issues is an ambitious optimisation
exercise using calibrated general equilibrium models to confront calculated paths of optimal consumption
with reality. This exercise would obviously involve all areas of public policies to optimise consumption
and output jointly. It may then be possible to pinpoint spells of over-consumption12 and explain their
putative existence by various types of imperfections: sub-optimal regulatory, tax and fiscal policies, market
imperfections or forecasting errors.
Despite its obvious attractiveness, this demiurgic programme goes unfortunately well beyond the
capacities of simple OECD mortals and this paper has more modest ambitions. Rather, this paper will
confine itself to saving behaviour. It first adopts a U.S. historical perspective, trying to identify, ex-post,
periods of unusually high consumption using econometric analysis and to assess judgementally whether
these situations represent cases of over-consumption in a normative sense. This approach is based on the
notion that a long-run stable behavioural relationship, reasonably similar to what is observed abroad, is
presumed to be optimal and that departures from it may be sub-optimal. We then switch to an ex-ante,
forward looking approach, trying to assess whether the projected path of persistently high U.S budget
deficits would be acceptable for an altruistic social planner. To this end, using a variety of econometric
panel data analyses, we try to assess the propensity of households to generate private saving in response to
public dis-saving or vice-versa. Although such offsetting movements in private and public saving can only
be suggestive of households’ altruism, their absence should make the social planner (policy maker) all the
more cautious about the possible consequences of persistent public deficits.
12 However, depending on the choice of the model, the assumptions made about hardly observable variables
(rate of time preference, rate of decline of marginal utility over time etc.) and the criteria chosen for the utility function this approach could lead to many different and thus speculative optimal paths.
15
4. Has U.S. household consumption overshot since the late 1990s?
It was previously mentioned that saving had a role to play both in providing for appropriate capital
accumulation and in allocating consumption over time13. In this section we focus on the efficiency of
saving as a mechanism to allocate consumption in a welfare improving way over the life cycle, knowing
that the U.S. economy has not yet shown obvious signs of suffering from inadequate capital accumulation.
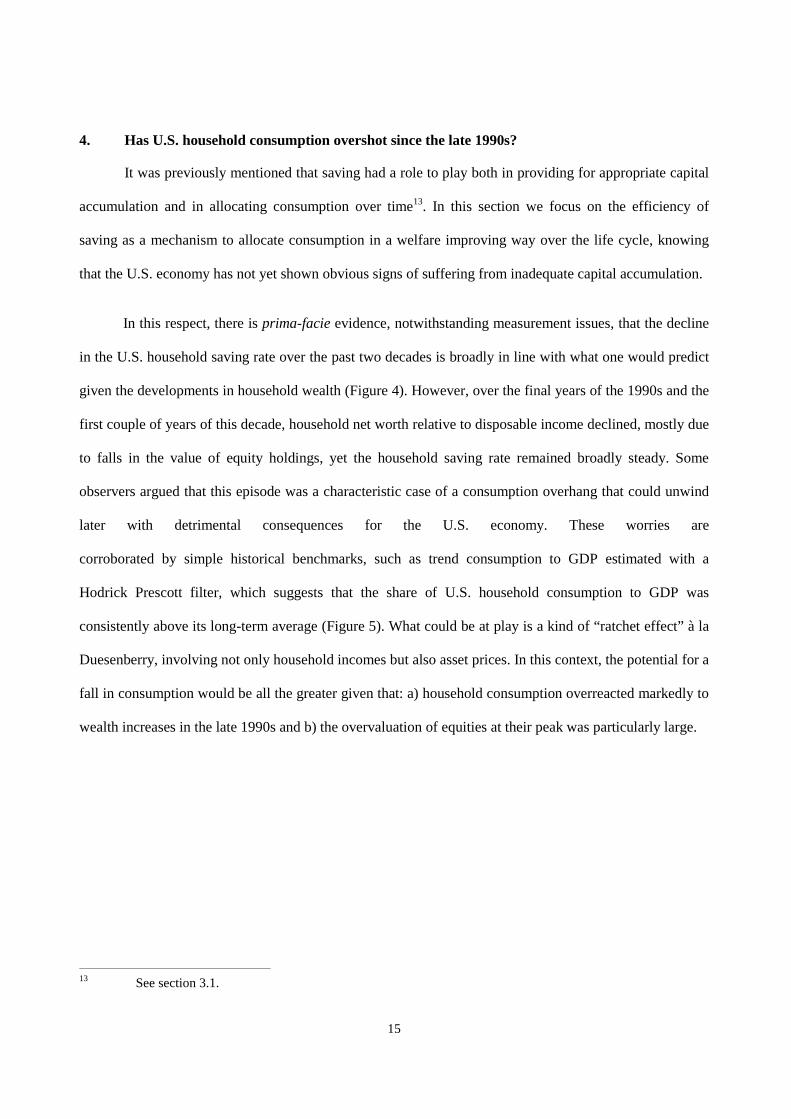
In this respect, there is prima-facie evidence, notwithstanding measurement issues, that the decline
in the U.S. household saving rate over the past two decades is broadly in line with what one would predict
given the developments in household wealth (Figure 4). However, over the final years of the 1990s and the
first couple of years of this decade, household net worth relative to disposable income declined, mostly due
to falls in the value of equity holdings, yet the household saving rate remained broadly steady. Some
observers argued that this episode was a characteristic case of a consumption overhang that could unwind
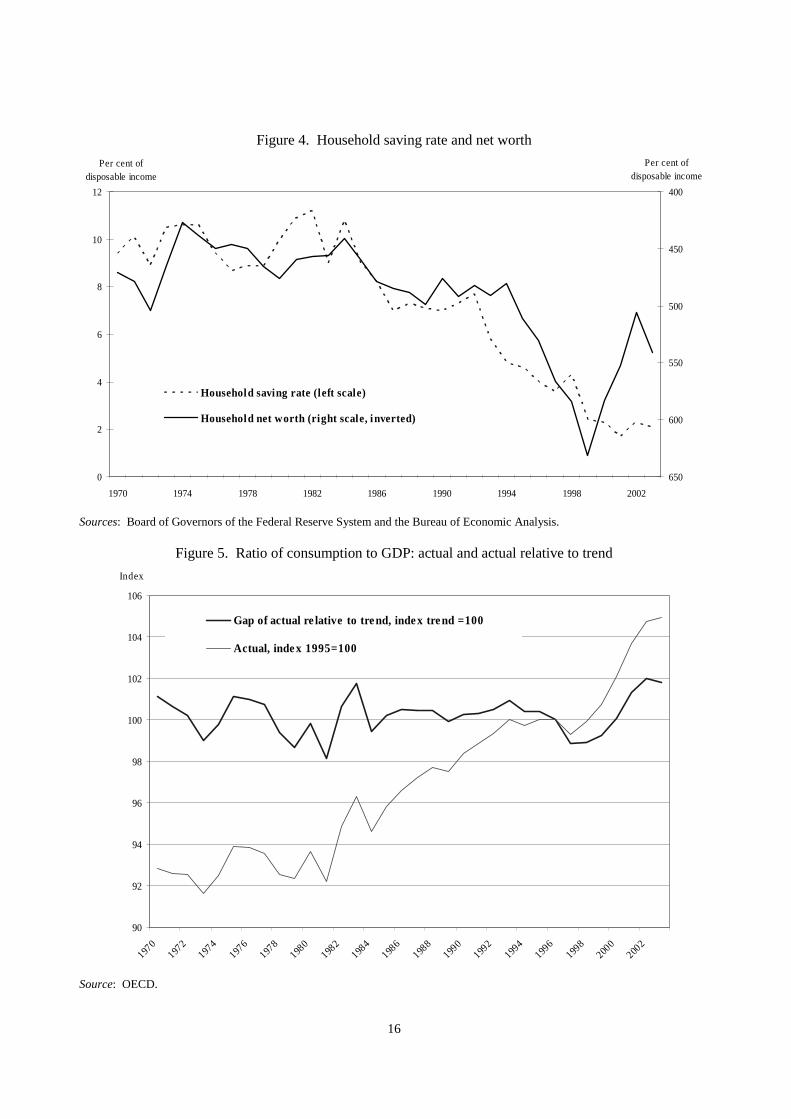
later with detrimental consequences for the U.S. economy. These worries are
corroborated by simple historical benchmarks, such as trend consumption to GDP estimated with a
Hodrick Prescott filter, which suggests that the share of U.S. household consumption to GDP was
consistently above its long-term average (Figure 5). What could be at play is a kind of “ratchet effect” à la
Duesenberry, involving not only household incomes but also asset prices. In this context, the potential for a
fall in consumption would be all the greater given that: a) household consumption overreacted markedly to
wealth increases in the late 1990s and b) the overvaluation of equities at their peak was particularly large.
13 See section 3.1.
16
Figure 4. Household saving rate and net worth
0
2
4
6
8
10
12
1970 1974 1978 1982 1986 1990 1994 1998 2002
Per cent of disposable income
400
450
500
550
600
650
Per cent ofdisposable income
Household saving rate (left scale)
Household net worth (right scale, inverted)
Sources: Board of Governors of the Federal Reserve System and the Bureau of Economic Analysis.
Figure 5. Ratio of consumption to GDP: actual and actual relative to trend
Index
90
92
94
96
98
100
102
104
106
1970
1972
1974
1976
1978
1980
1982
1984
1986
1988
1990
1992
1994
1996
1998
2000
2002
Gap of actual re lative to tre nd, inde x tre nd =100
Actual, inde x 1995=100
Source: OECD.
17
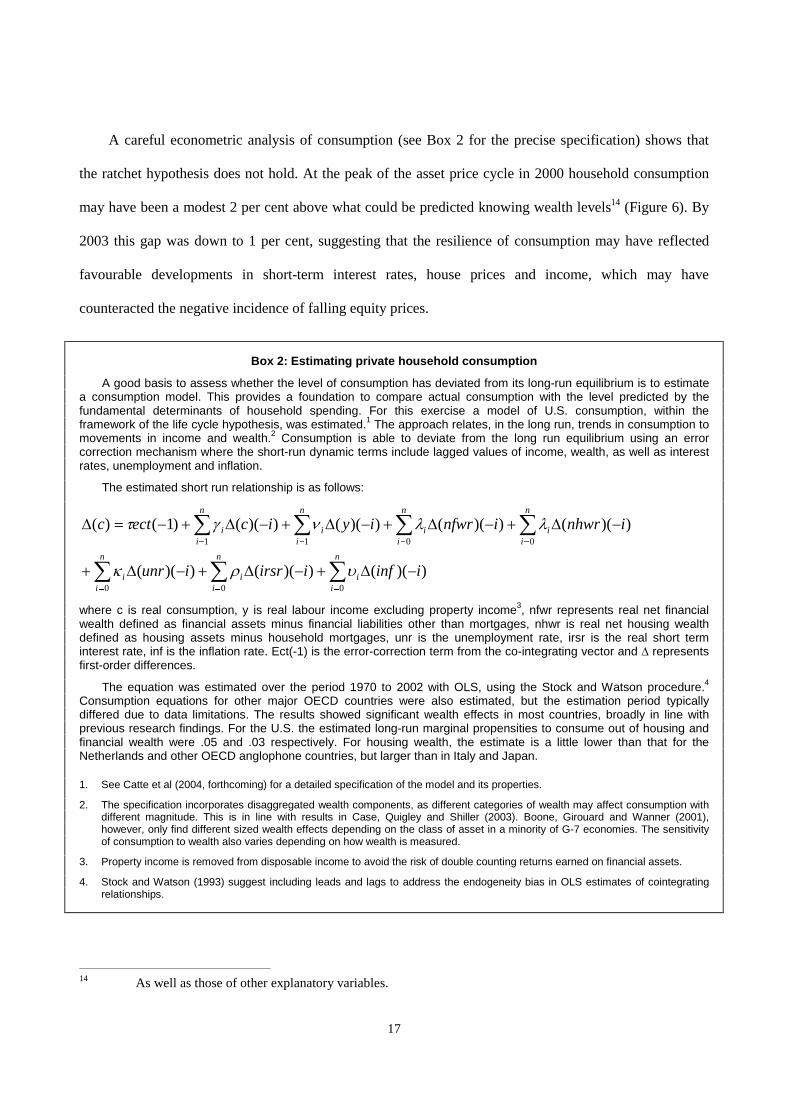
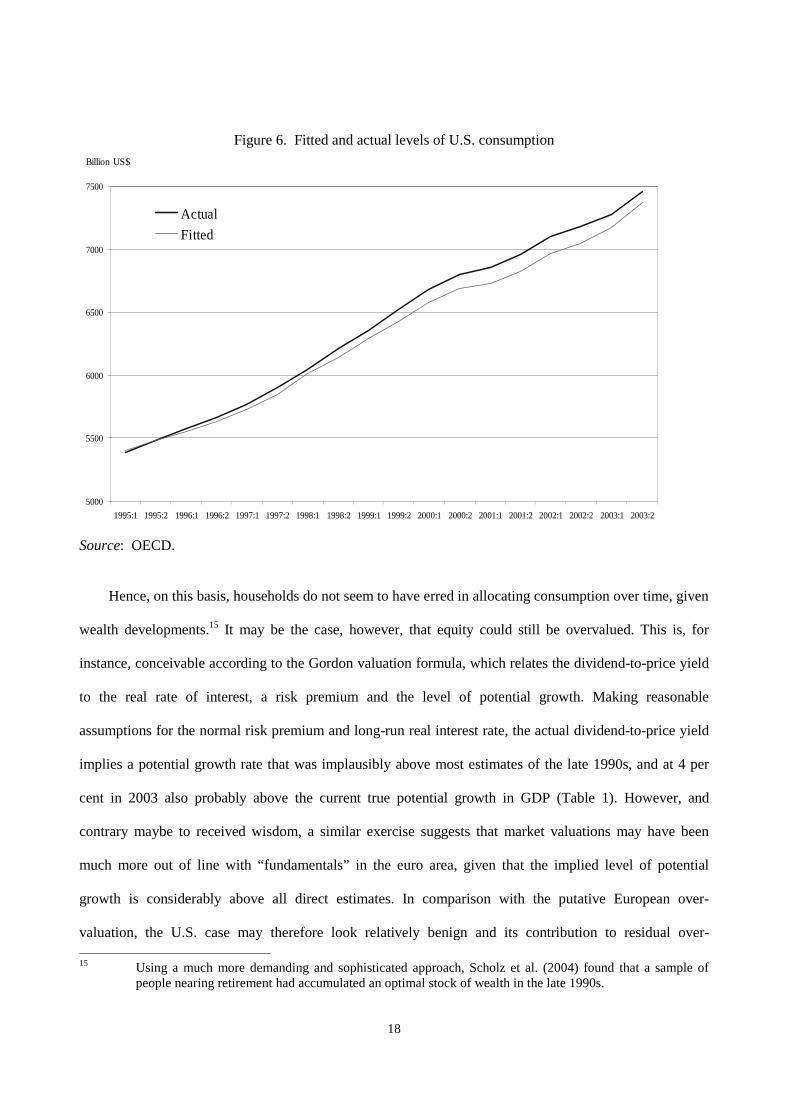
A careful econometric analysis of consumption (see Box 2 for the precise specification) shows that
the ratchet hypothesis does not hold. At the peak of the asset price cycle in 2000 household consumption
may have been a modest 2 per cent above what could be predicted knowing wealth levels14 (Figure 6). By
2003 this gap was down to 1 per cent, suggesting that the resilience of consumption may have reflected
favourable developments in short-term interest rates, house prices and income, which may have
counteracted the negative incidence of falling equity prices.
Box 2: Estimating private household consumption
A good basis to assess whether the level of consumption has deviated from its long-run equilibrium is to estimate a consumption model. This provides a foundation to compare actual consumption with the level predicted by the fundamental determinants of household spending. For this exercise a model of U.S. consumption, within the framework of the life cycle hypothesis, was estimated.1 The approach relates, in the long run, trends in consumption to movements in income and wealth.2 Consumption is able to deviate from the long run equilibrium using an error correction mechanism where the short-run dynamic terms include lagged values of income, wealth, as well as interest rates, unemployment and inflation.
The estimated short run relationship is as follows:
))(())(())((
))(())(())(())(()1()(
000
0011
iinfiirsriunr
inhwrinfwriyicectc
n
ii
n
ii
n
ii
n
ii
n
ii
n
ii
n
ii
���������
���������������
���
����
���
����
���
�����
where c is real consumption, y is real labour income excluding property income3, nfwr represents real net financial wealth defined as financial assets minus financial liabilities other than mortgages, nhwr is real net housing wealth defined as housing assets minus household mortgages, unr is the unemployment rate, irsr is the real short term interest rate, inf is the inflation rate. Ect(-1) is the error-correction term from the co-integrating vector and � represents first-order differences.
The equation was estimated over the period 1970 to 2002 with OLS, using the Stock and Watson procedure.4 Consumption equations for other major OECD countries were also estimated, but the estimation period typically differed due to data limitations. The results showed significant wealth effects in most countries, broadly in line with previous research findings. For the U.S. the estimated long-run marginal propensities to consume out of housing and financial wealth were .05 and .03 respectively. For housing wealth, the estimate is a little lower than that for the Netherlands and other OECD anglophone countries, but larger than in Italy and Japan.
1. See Catte et al (2004, forthcoming) for a detailed specification of the model and its properties.
2. The specification incorporates disaggregated wealth components, as different categories of wealth may affect consumption with different magnitude. This is in line with results in Case, Quigley and Shiller (2003). Boone, Girouard and Wanner (2001), however, only find different sized wealth effects depending on the class of asset in a minority of G-7 economies. The sensitivity of consumption to wealth also varies depending on how wealth is measured.
3. Property income is removed from disposable income to avoid the risk of double counting returns earned on financial assets.
4. Stock and Watson (1993) suggest including leads and lags to address the endogeneity bias in OLS estimates of cointegrating relationships.
14 As well as those of other explanatory variables.
18
Figure 6. Fitted and actual levels of U.S. consumption
5000
5500
6000
6500
7000
7500
1995:1 1995:2 1996:1 1996:2 1997:1 1997:2 1998:1 1998:2 1999:1 1999:2 2000:1 2000:2 2001:1 2001:2 2002:1 2002:2 2003:1 2003:2
Billion US$
Actual
Fitted
Source: OECD.
Hence, on this basis, households do not seem to have erred in allocating consumption over time, given
wealth developments.15 It may be the case, however, that equity could still be overvalued. This is, for
instance, conceivable according to the Gordon valuation formula, which relates the dividend-to-price yield
to the real rate of interest, a risk premium and the level of potential growth. Making reasonable
assumptions for the normal risk premium and long-run real interest rate, the actual dividend-to-price yield
implies a potential growth rate that was implausibly above most estimates of the late 1990s, and at 4 per
cent in 2003 also probably above the current true potential growth in GDP (Table 1). However, and
contrary maybe to received wisdom, a similar exercise suggests that market valuations may have been
much more out of line with “fundamentals” in the euro area, given that the implied level of potential
growth is considerably above all direct estimates. In comparison with the putative European over-
valuation, the U.S. case may therefore look relatively benign and its contribution to residual over- 15 Using a much more demanding and sophisticated approach, Scholz et al. (2004) found that a sample of
people nearing retirement had accumulated an optimal stock of wealth in the late 1990s.
19
consumption may be modest, bearing in mind that such calculations are very sensitive to the specific
assumptions made.
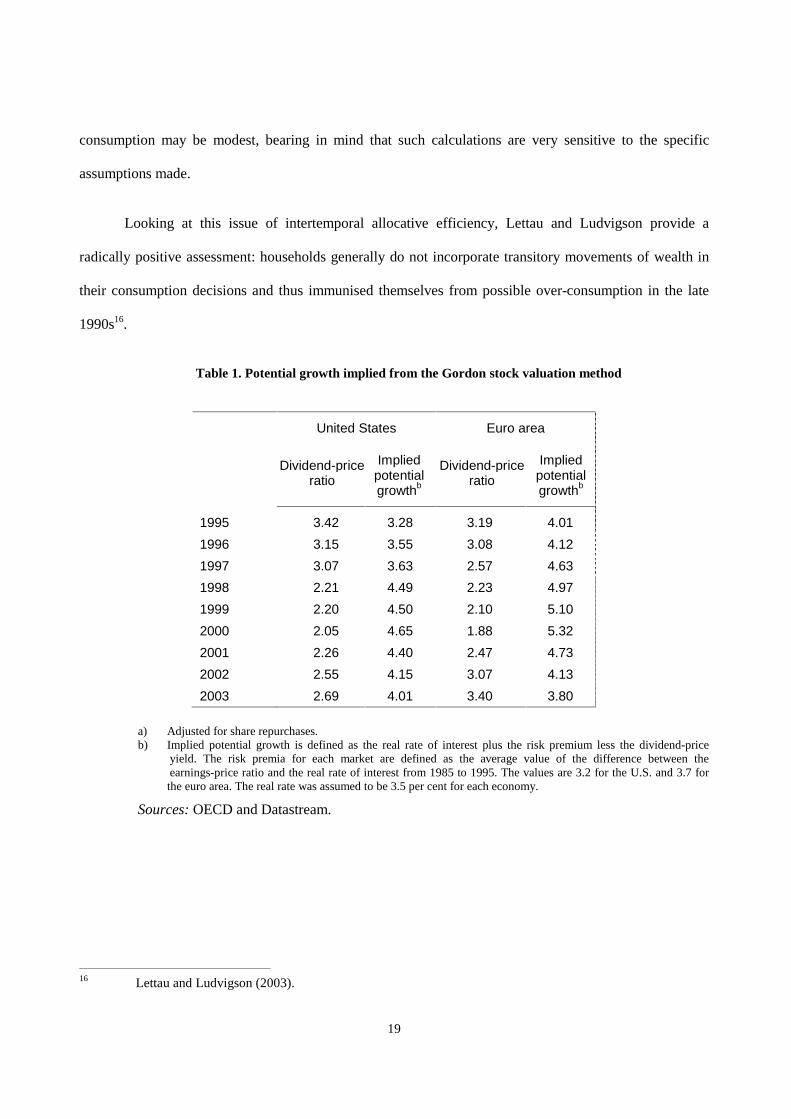
Looking at this issue of intertemporal allocative efficiency, Lettau and Ludvigson provide a
radically positive assessment: households generally do not incorporate transitory movements of wealth in
their consumption decisions and thus immunised themselves from possible over-consumption in the late
1990s16.
Table 1. Potential growth implied from the Gordon stock valuation method
United States Euro area
Dividend-price ratio
Implied potential growthb
Dividend-price ratio
Implied potential growthb
1995 3.42 3.28 3.19 4.01
1996 3.15 3.55 3.08 4.12
1997 3.07 3.63 2.57 4.63
1998 2.21 4.49 2.23 4.97
1999 2.20 4.50 2.10 5.10
2000 2.05 4.65 1.88 5.32
2001 2.26 4.40 2.47 4.73
2002 2.55 4.15 3.07 4.13
2003 2.69 4.01 3.40 3.80
a) Adjusted for share repurchases. b) Implied potential growth is defined as the real rate of interest plus the risk premium less the dividend-price
yield. The risk premia for each market are defined as the average value of the difference between the earnings-price ratio and the real rate of interest from 1985 to 1995. The values are 3.2 for the U.S. and 3.7 for the euro area. The real rate was assumed to be 3.5 per cent for each economy.
Sources: OECD and Datastream.
16 Lettau and Ludvigson (2003).
20
5. Hysteresis in public deficits and durably low national saving
5.1 The need for an increase in national saving
Since 2000, real business investment as a share of GDP has fallen by 2.5 percentage points and is
currently at the level which prevailed in 1997. It is not obvious that, at present investment rates, capital
accumulation will be sufficient to match a high potential GDP growth rate.17 Should the rate of private
investment increase, it is uncertain whether foreign savings could easily be made available to finance this
expansion, knowing that the current account deficit is already around 5 per cent of GDP and that the U.S.
experiences a negative net asset position of around 30 per cent of GDP and steadily deteriorating. Hence in
the next few years, the U.S. economy may need to increase its investment rate while reducing its recourse
to foreign savings. This, in turn, may call for a strong increase in national savings, which have collapsed by
more than 4 per cent of GDP since 2000, accounted for by a steep deterioration of structural public deficits.
With U.S. structural public deficits forecast by the OECD to remain very high for an extended
number of years, the recovery in private saving may need to be strong. It is hard to visualise which public
policies – other than fiscal retrenchment – could trigger such a surge in saving. A move towards higher
saving could still occur spontaneously however if households were well behaved, thus trying to partly
offset declining public net wealth by an increasing private net wealth position18.
5.2 Uncertainties surrounding the rise of national saving
Whether, however, U.S. households are in a position to display such behaviour remains an open
question. One may argue that over the 1990s public and private saving tended to exhibit inverse
17 In fact, based on a simple version of the neo-classical growth model, and using conservative assumptions
about the equilibrium capital-output ratio and depreciation rate, one finds the current investment rate to be below the sustainable or long-term equilibrium rate that is consistent with the 3.5 per cent natural rate of GDP growth assumed earlier. OECD’s assessment is indeed that after growing at 4% on average during the late 90s and early 2000s the US business capital stock grew at 1.5% a year only in 2002 and 2003.
18 A tightening of monetary policy, possibly associated with falling asset prices, could impact national savings. Should negative wealth effects and substitution effects outweigh income effects, an increase in interest rates may stimulate personal savings. At the same time, however, business and public sector savings may decrease because of higher interest payments. The sign and magnitude of changes in national savings in reaction to a monetary tightening remain therefore uncertain.
21
movements, thus opening the possibility for Ricardian equivalence to hold in the U.S. It has to be noted,
however, that such an inverse correlation has been less strong since 2000. Hence, the disappointing post-
2000 experience may cast a doubt on whether the fall in private saving experienced in the 1990s reflected
the marked improvement of public saving. Falling private saving could have indeed been primarily a
consequence of rising private wealth.
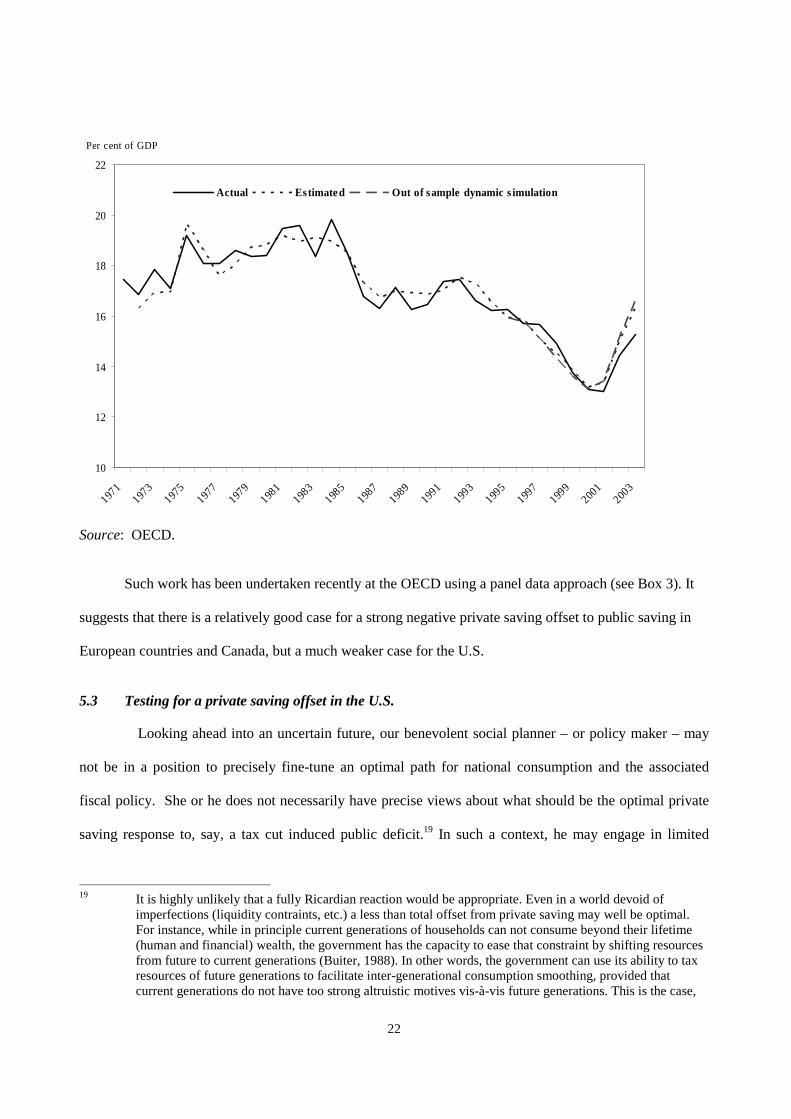
This suspicion is heightened by the fact that OECD estimated consumption equations incorporating
wealth, but not public saving (cf supra) as explanatory variables display relatively small residuals. It is also
telling that a different type of private saving equation featuring public saving but only indirectly
accounting for private wealth through its fundamental determinants (e.g. productivity growth) do an
excellent job at out- of-sample forecasting from 1995-2000 (where the correlation between private wealth
and public saving is strong) and a relatively poorer job in the period 2000-2003 when the correlation
weakens (Figure 7). To try and clarify this issue it may thus be worth examining the performance of private
saving equations nesting both public saving and indicators of housing and financial wealth as well as short-
run real interest rates, GDP growth and other control variables.
Figure 7. Gross private saving rates: actual and simulated
22
10
12
14
16
18
20
22
1971
1973
1975
1977
1979
1981
1983
1985
1987
1989
1991
1993
1995
1997
1999
2001
2003
Per cent of GDP
Actual Estimate d Out of sample dynamic s imulation
Source: OECD.
Such work has been undertaken recently at the OECD using a panel data approach (see Box 3). It
suggests that there is a relatively good case for a strong negative private saving offset to public saving in
European countries and Canada, but a much weaker case for the U.S.
5.3 Testing for a private saving offset in the U.S.
Looking ahead into an uncertain future, our benevolent social planner – or policy maker – may
not be in a position to precisely fine-tune an optimal path for national consumption and the associated
fiscal policy. She or he does not necessarily have precise views about what should be the optimal private
saving response to, say, a tax cut induced public deficit.19 In such a context, he may engage in limited
19 It is highly unlikely that a fully Ricardian reaction would be appropriate. Even in a world devoid of
imperfections (liquidity contraints, etc.) a less than total offset from private saving may well be optimal. For instance, while in principle current generations of households can not consume beyond their lifetime (human and financial) wealth, the government has the capacity to ease that constraint by shifting resources from future to current generations (Buiter, 1988). In other words, the government can use its ability to tax resources of future generations to facilitate inter-generational consumption smoothing, provided that current generations do not have too strong altruistic motives vis-à-vis future generations. This is the case,
23
optimization and try to avoid, for instance, worst-case scenarios. One such scenario would be delaying
fiscal adjustment for too long only to discover that private savers were not offsetting changes in public
saving. Our prudent social planner would certainly want to verify that private offsets have been reliably
identified by the experts.
This section will try to carry out this preliminary check by testing the existence of private saving
offsets in the U.S. in response to movements in public saving, using panel data analysis. At this stage we
do not try to disentangle the various sources of offset (i.e. Ricardian equivalence, substitutability between
public and private spending, or a transitory shock to government revenues and expenditures, etc.) but just
to verify if under one form or another private saving offsets show up in the data.
We thus estimate the magnitude of private saving offsets to cyclically-adjusted public deficits for
a sample of 16 OECD countries in the period 1970-2002. Being based on pooled cross-country and time-
series data the aim of this empirical exercise is to compare OECD-wide and U.S. saving.20
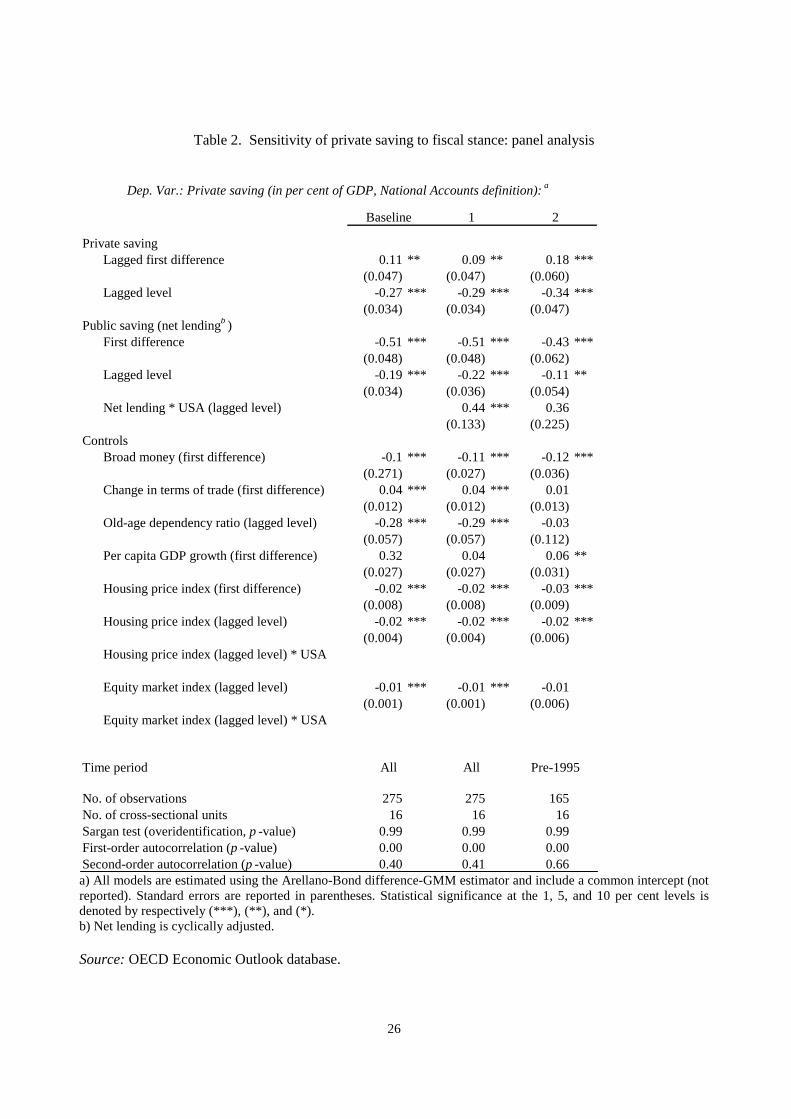
Estimation of the baseline regressions yields the parsimonious models reported in Table 2.21 The
private saving offset to changes in the cyclically-adjusted public net lending is estimated in the sample of
OECD countries at about one-half in the short term and two-thirds in the long term.22 As regards wealth
for instance, in a world where population growth does not take place only within existing dynastic families but also involves future unrelated families, for instance immigrants, who will share the tax burden.
20 Country selection has been guided by data availability. The dataset includes Australia, Belgium, Canada, Denmark, Finland, France, Germany, Italy, Japan, Netherlands, Norway, New Zealand, Spain, Sweden, United Kingdom, and United States. The dataset predates the latest U.S. re-benchmarking exercise, which resulted inter alia in a downward revision to the level of private saving in the U.S.
21 Empirical literature based on reduced-form saving equations has also focused on the association between public saving and private consumption, such as Giavazzi and Pagano (1996), on the one hand, and national saving, as in Giavazzi et al. (2000), on the other. Previous empirical studies focusing on private, rather than national saving as a left hand-side variable in a reduced-form saving equation include Loayza et al. (2001), and De Serres and Pelgrin (2002). Exclusive focus on household, rather than private or national, saving, such as Callen and Thimann (1997), is relatively uncommon.
22 The estimated private saving offset is greater in magnitude in the short-term than that reported by Loayza et al. (2001) for OECD countries (about 0.1), using a comparable GMM estimator, but lower than those reported by Haque et al. (1999) and De Serres and Pelgrin (2002) using error-correction mean group estimators (about 0.9 and 0.7, respectively); by Masson et al. (1998), using a static fixed-effects estimator (about 0.8), and by Edwards (1996), for both industrial and developing countries using an instrumental variables estimator (about 0.6).

24
variables, the equity market index affects private saving negatively in the long term and housing wealth is
negatively associated with private saving in the short and long term.
Estimates of the private saving offset (not reported) do not change significantly in magnitude when
other measures of public saving are used. This is so, even though measuring public saving by the budget
balance uncorrected for the business cycle is likely to create endogeneity biases arising from the size of
automatic stabilisers, to the extent that causality may run from private to public saving, and not the
converse. Nor does the offset coefficient vary significantly in magnitude when the fiscal stance is
measured by the primary budget balance (adjusted for the cycle) -- arguably a more accurate measure of
discretionary fiscal impulses.

25
Box 3. Estimating private saving
There are several options for estimating the relationship between private and public saving. Our preference is for a reduced-form error-correction set-up, in which private saving is regressed on public saving and short- and long-term dynamics are modeled explicitly.1 Unit root tests for the individual time series and the panel as a whole, as well as residuals-based cointegration tests for the pooled data, suggest that this is a valid approach to estimating the dynamic relationship between private and public saving.2 In particular, the saving equation to be estimated can be written as:
ittiitpubti
pubit
privti
privti
privit eXXSSSSS �������������
���� 1,2241,1231,21,1020 )( ���(1)
where priv
itSand
pubitS
denote, respectively, the private and the public saving ratios in country i at time t, Xit is a vector
of control variables, u and e are disturbance terms, and � is the first-difference operator.
The set of control variables is standard in empirical literature, and includes the old-age dependency ratio, the real interest rate, consumer price inflation, changes in the terms of trade, the ratio of broad money (M2) to GDP, and the growth rate of per capita GDP. Proxies for wealth effects (equity market and housing price indices) are also included in the estimating equation because, as noted above, the extent to which movements in private saving offset those in the cyclically-adjusted budget balance is also affected by fluctuations in household wealth, which may themselves be correlated with budget action.3
1. A more conventional approach is to estimate the reduced-form saving equation in a partial equilibrium set-up, in which the lagged dependent variable is included in the set of regressors primarily to deal with inertia in saving behaviour. However, we prefer the error-correction specification because the partial-equilibrium set-up only allows for very simple dynamics, making the estimation of long-term private saving offsets often unrealistically high. The approach adopted here also differs from that followed in De Serres and Pelgrin. They focus on gross public saving, defined as the general government financial balance plus gross public sector investment. Here, public saving is defined as cyclically-adjusted net lending of the general government.
2. A variety of unit root tests were carried out for the individual times series and the IPS test was carried out for the panel as a whole, suggesting that the variables of interest are non-stationary. The Pedroni-Kao cointegration test was also carried out, suggesting that there is a stable long-term relationship between private and public saving.
3. The decline in equity wealth since 2000 has taken place concomitantly with an expansionary fiscal stance and an increase in private saving rates after 2001. Whether coincident with budgetary changes, or in part related to them, it is difficult to disentangle the effects of wealth-induced shifts in saving from those deriving from public sector indebtedness per se, and exclusion of these proxies would arguably overstate the private saving offset.
26
Table 2. Sensitivity of private saving to fiscal stance: panel analysis
Private savingLagged first difference 0.11 ** 0.09 ** 0.18 ***
(0.047) (0.047) (0.060)Lagged level -0.27 *** -0.29 *** -0.34 ***
(0.034) (0.034) (0.047)Public saving (net lendingb )
First difference -0.51 *** -0.51 *** -0.43 ***(0.048) (0.048) (0.062)
Lagged level -0.19 *** -0.22 *** -0.11 **(0.034) (0.036) (0.054)
Net lending * USA (lagged level) 0.44 *** 0.36(0.133) (0.225)
ControlsBroad money (first difference) -0.1 *** -0.11 *** -0.12 ***
(0.271) (0.027) (0.036)Change in terms of trade (first difference) 0.04 *** 0.04 *** 0.01
(0.012) (0.012) (0.013)Old-age dependency ratio (lagged level) -0.28 *** -0.29 *** -0.03
(0.057) (0.057) (0.112)Per capita GDP growth (first difference) 0.32 0.04 0.06 **
(0.027) (0.027) (0.031)Housing price index (first difference) -0.02 *** -0.02 *** -0.03 ***
(0.008) (0.008) (0.009)Housing price index (lagged level) -0.02 *** -0.02 *** -0.02 ***
(0.004) (0.004) (0.006)Housing price index (lagged level) * USA
Equity market index (lagged level) -0.01 *** -0.01 *** -0.01(0.001) (0.001) (0.006)
Equity market index (lagged level) * USA
Time period
No. of observations 275 275 165No. of cross-sectional units 16 16 16Sargan test (overidentification, p -value) 0.99 0.99 0.99First-order autocorrelation (p -value) 0.00 0.00 0.00Second-order autocorrelation (p -value) 0.40 0.41 0.66
Pre-1995
2
Dep. Var.: Private saving (in per cent of GDP, National Accounts definition): a
1
All
Baseline
All
a) All models are estimated using the Arellano-Bond difference-GMM estimator and include a common intercept (not reported). Standard errors are reported in parentheses. Statistical significance at the 1, 5, and 10 per cent levels is denoted by respectively (***), (**), and (*). b) Net lending is cyclically adjusted. Source: OECD Economic Outlook database.

27
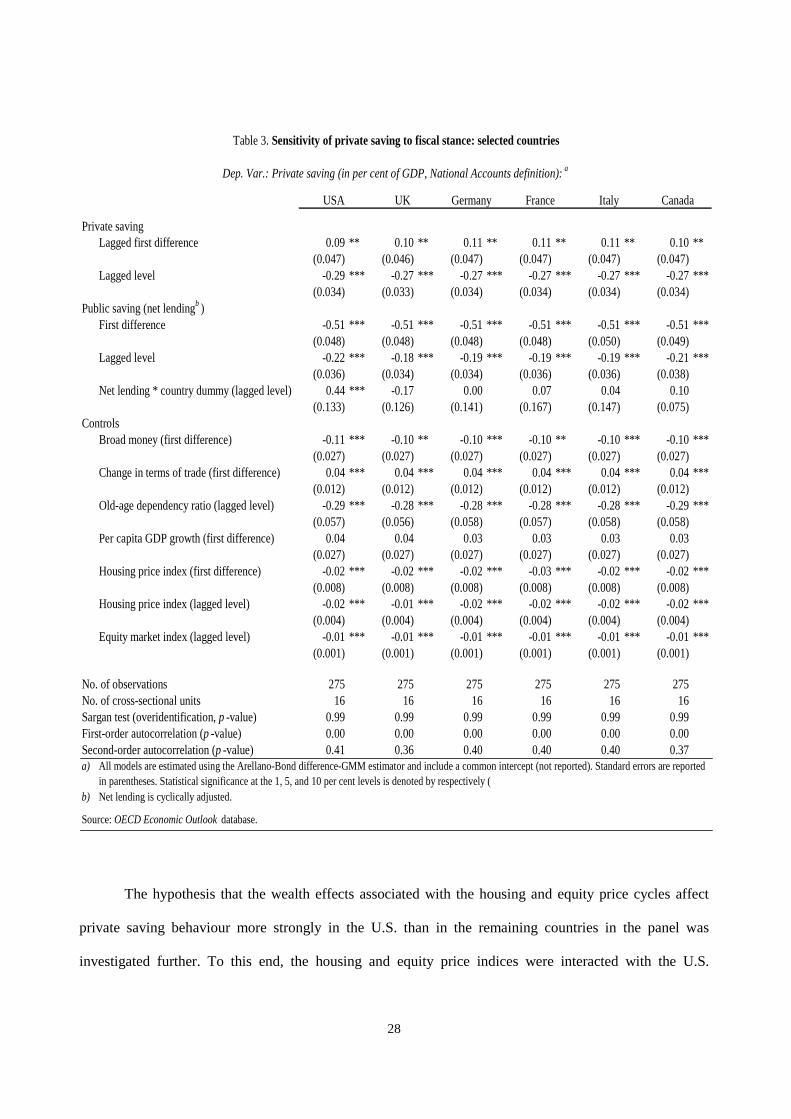
5.4 How different is the U.S. case?
To assess whether the estimated private saving offset differs in the United States from the OECD
average, the cyclically-adjusted budget balance (measuring public saving) was interacted with a dummy
variable taking value “1” for the United States and “0” for all other countries in the panel.23 Based on this
methodology, the private saving offset appears to be positive, rather than negative in the United States over
the longer term. Although this finding should be interpreted with precaution24, it does not bode well for the
existence of strong, robust Ricardian effects in the U.S.25 Furthermore, we also experimented with an
interaction dummy for other selected G7 countries (United Kingdom, Germany, France, Italy, and
Canada), but the results reported in Table 3 do not suggest a lack of robustness of the negative private
saving offset in those countries. For countries like the UK and Canada which are characterized by strong
wealth effects, the coexistence of negative offsets and wealth effects does not seem problematic.
23 The option of running a separate regression for the U.S. alone could not be pursued because of data
availability, with at most 30 observations per country in the panel. 24 As already mentioned, it may still be the case that a strong complementarity between public and private
consumption or a transitory shock to government revenues and expenditures is overriding a truly Ricardian behaviour in reaction to tax changes.
25 Indeed, equation 1 in Table 2 shows smaller residuals than alternative regressions from the mid 1990s onwards. The interaction of the U.S. dummy with net lending in first difference, to test the hypothesis that the private saving offset is different from the OECD average in the United States in the short term, was not found to be statistically significant. The finding is robust to the estimation of the saving equation in a partial equilibrium set-up, where the lagged dependent variable is included in the set of regressors and all variables enter the estimating equation in levels, and by fixed effects.
28
Private savingLagged first difference 0.09 ** 0.10 ** 0.11 ** 0.11 ** 0.11 ** 0.10 **
(0.047) (0.046) (0.047) (0.047) (0.047) (0.047)Lagged level -0.29 *** -0.27 *** -0.27 *** -0.27 *** -0.27 *** -0.27 ***
(0.034) (0.033) (0.034) (0.034) (0.034) (0.034)Public saving (net lendingb )
First difference -0.51 *** -0.51 *** -0.51 *** -0.51 *** -0.51 *** -0.51 ***(0.048) (0.048) (0.048) (0.048) (0.050) (0.049)
Lagged level -0.22 *** -0.18 *** -0.19 *** -0.19 *** -0.19 *** -0.21 ***(0.036) (0.034) (0.034) (0.036) (0.036) (0.038)
Net lending * country dummy (lagged level) 0.44 *** -0.17 0.00 0.07 0.04 0.10(0.133) (0.126) (0.141) (0.167) (0.147) (0.075)
ControlsBroad money (first difference) -0.11 *** -0.10 ** -0.10 *** -0.10 ** -0.10 *** -0.10 ***
(0.027) (0.027) (0.027) (0.027) (0.027) (0.027)Change in terms of trade (first difference) 0.04 *** 0.04 *** 0.04 *** 0.04 *** 0.04 *** 0.04 ***
(0.012) (0.012) (0.012) (0.012) (0.012) (0.012)Old-age dependency ratio (lagged level) -0.29 *** -0.28 *** -0.28 *** -0.28 *** -0.28 *** -0.29 ***
(0.057) (0.056) (0.058) (0.057) (0.058) (0.058)Per capita GDP growth (first difference) 0.04 0.04 0.03 0.03 0.03 0.03
(0.027) (0.027) (0.027) (0.027) (0.027) (0.027)Housing price index (first difference) -0.02 *** -0.02 *** -0.02 *** -0.03 *** -0.02 *** -0.02 ***
(0.008) (0.008) (0.008) (0.008) (0.008) (0.008)Housing price index (lagged level) -0.02 *** -0.01 *** -0.02 *** -0.02 *** -0.02 *** -0.02 ***
(0.004) (0.004) (0.004) (0.004) (0.004) (0.004)Equity market index (lagged level) -0.01 *** -0.01 *** -0.01 *** -0.01 *** -0.01 *** -0.01 ***
(0.001) (0.001) (0.001) (0.001) (0.001) (0.001)
No. of observations 275 275 275 275 275 275No. of cross-sectional units 16 16 16 16 16 16Sargan test (overidentification, p -value) 0.99 0.99 0.99 0.99 0.99 0.99First-order autocorrelation (p -value) 0.00 0.00 0.00 0.00 0.00 0.00Second-order autocorrelation (p -value) 0.41 0.36 0.40 0.40 0.40 0.37a)
b)
Source: OECD Economic Outlook database.
Table 3. Sensitivity of private saving to fiscal stance: selected countries
Dep. Var.: Private saving (in per cent of GDP, National Accounts definition): a
USA UK Germany
Net lending is cyclically adjusted.
All models are estimated using the Arellano-Bond difference-GMM estimator and include a common intercept (not reported). Standard errors are reported in parentheses. Statistical significance at the 1, 5, and 10 per cent levels is denoted by respectively (
CanadaFrance Italy
The hypothesis that the wealth effects associated with the housing and equity price cycles affect
private saving behaviour more strongly in the U.S. than in the remaining countries in the panel was
investigated further. To this end, the housing and equity price indices were interacted with the U.S.
29
dummy. The results suggest that a rise in equity prices may depress private saving by a higher amount in
the U.S. than in the remaining countries in the panel, but the estimated coefficient is not significant at
classical levels. Rather than dismissing this possibility, we believe that a failure to find a statistically
significant link may be due to data inadequacies, given that housing and equity price indices are proxies
for, rather than the actual measurement of, household wealth.
Altogether this exercise suggests that the case for negative private saving offsets in the U.S. is
probably less compelling than in many other OECD countries. This may reflect a greater confidence in the
U.S. public that deficits in their country are less persistent than elsewhere. Should it be the case, the risk of
over-consumption seems strong enough to warrant very substantial retrenchment in the next few years.
5.5 Fiscal sustainability in the longer term
Fiscal retrenchment may also be needed to mitigate future public spending pressures due to
materialize towards the end of this decade when the baby-boomers start to retire. These developments will
place additional stresses on public finances and downward pressure on saving and capital formation. A
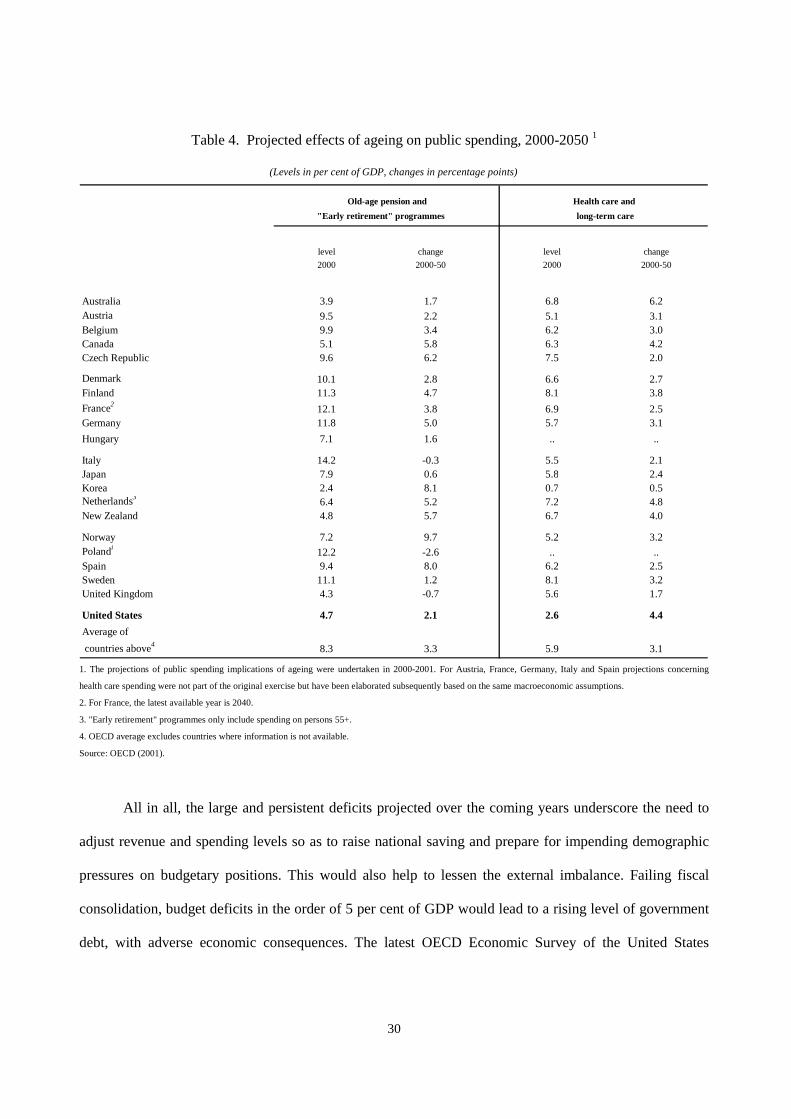
recent OECD study (Dang, Antolin and Oxley, 2001) projected the fiscal impact of age-related spending
for member countries. The results, based on national models and using an agreed upon set of assumptions
about macroeconomic and demographic developments, suggest public spending on age-related pension and
early retirement programmes in the U.S. could rise by the equivalent of 2.1 per cent of GDP over the next
half century (Table 4). Moreover, public spending on health and long-term care was projected to rise by
4.4 per cent of GDP.26
26 These calculations exclude the recent extension of the U.S. old-age pharmaceutical benefit scheme (the
2003 Medicare Prescription Drug Improvement and Modernisation Act), which may well reduce private saving previously committed to meeting future health spending requirements.
30
Table 4. Projected effects of ageing on public spending, 2000-2050 1
Old-age pension and Health care and
long-term care
level change level change
2000 2000-50 2000 2000-50
Australia 3.9 1.7 6.8 6.2Austria 9.5 2.2 5.1 3.1Belgium 9.9 3.4 6.2 3.0Canada 5.1 5.8 6.3 4.2Czech Republic 9.6 6.2 7.5 2.0
Denmark 10.1 2.8 6.6 2.7Finland 11.3 4.7 8.1 3.8
France212.1 3.8 6.9 2.5
Germany 11.8 5.0 5.7 3.1
Hungary 7.1 1.6 .. ..
Italy 14.2 -0.3 5.5 2.1Japan 7.9 0.6 5.8 2.4Korea 2.4 8.1 0.7 0.5Netherlands3
6.4 5.2 7.2 4.8New Zealand 4.8 5.7 6.7 4.0
Norway 7.2 9.7 5.2 3.2Polandi
12.2 -2.6 .. ..Spain 9.4 8.0 6.2 2.5Sweden 11.1 1.2 8.1 3.2United Kingdom 4.3 -0.7 5.6 1.7
United States 4.7 2.1 2.6 4.4
Average of
countries above4 8.3 3.3 5.9 3.1
"Early retirement" programmes
(Levels in per cent of GDP, changes in percentage points)
1. The projections of public spending implications of ageing were undertaken in 2000-2001. For Austria, France, Germany, Italy and Spain projections concerning
health care spending were not part of the original exercise but have been elaborated subsequently based on the same macroeconomic assumptions.
2. For France, the latest available year is 2040.
3. "Early retirement" programmes only include spending on persons 55+.
4. OECD average excludes countries where information is not available.
Source: OECD (2001).
All in all, the large and persistent deficits projected over the coming years underscore the need to
adjust revenue and spending levels so as to raise national saving and prepare for impending demographic
pressures on budgetary positions. This would also help to lessen the external imbalance. Failing fiscal
consolidation, budget deficits in the order of 5 per cent of GDP would lead to a rising level of government
debt, with adverse economic consequences. The latest OECD Economic Survey of the United States
31
attempted to calculate the implications for national income. Based on a large number of assumptions,27 it
concluded that the beneficial effects of the tax reductions since 200128 on long-run labour supply were
more than offset by the negative effects of the decline in national saving and capital formation.
6. Conclusions
This paper offers two main conclusions. First, it is difficult to talk about serious, “over-
consumption” in the U.S. during the late 1990s. Lower U.S. saving did not hamper capital accumulation in
a context where massive inflows of foreign saving led to an investment overhang. There are no signs
either that, given levels of wealth observed in the late 1990s, consumption had been incompatible with an
efficient allocation of saving over time. There were at least no signs of an excessive propensity to consume
out of wealth or income. There may have been however, an element of “ex-post over-consumption”
inasmuch as equity markets proved to be over-valued and households may not have distinguished
accurately between permanent and transitory wealth. It should also be noted that, based on standard equity
valuation methods, current equity prices may still be somewhat overvalued. Moving into the future, it
seems that the investment ratio will have to rise significantly from current levels in order to match U.S.
natural growth, in a context where high public and external deficits are expected to persist over an
extended number of years. What may then be needed is a large recovery in private saving.
Our second conclusion, however, is that the evidence of private saving offsets to public deficits in
the U.S. is far less compelling than in many other OECD countries. One should not underestimate, in these
circumstances, the risk stemming from a failure to lift national saving and its negative consequences on
national income. Should the U.S. manage, however, to increase further its current account deficit in order
to finance high public deficits and higher private investment, the consequences for the outside world may
not be very positive: foreign savers may still benefit from superior opportunities by investing in the U.S.
27 For details see Appendix 2.1 of the 2004 OECD Economic Survey of the United States. 28 The main tax-reducing acts were the Economic Growth and Tax Relief Reconciliation Act of 2001, the Job
Creation and Worker Assistance Act of 2002 and the Jobs and Growth Tax Relief Reconciliation Act of 2003.

32
but saving available worldwide for private investment would be much lower. In this context, the risk of
over-consumption seems strong enough to warrant very substantial retrenchment in the next few years in
the U.S. as well as other large OECD countries.
33
REFERENCES AUERBACH, A (1985), ‘Saving in the U.S.: some conceptual issues’, in Hendershott, H. Ed. The Level
and Composition of Household Saving, Cambridge, Mass.: Balinger.
BOONE, L., N.GIROUARD and I. WANNER (2001), ‘Financial market liberalisation, wealth and consumption’, OECD Economics Department Working Papers, No. 308
BUITER, W (1988), ‘Death, birth, productivity growth and debt neutrality’, The Economic Journal, Vol. 98.
CALLEN, T. and C. THIMANN (1997), ‘Empirical determinants of household saving: evidence from OECD countries’, IMF Working Paper, No. 97/181.
CARMAN, K., J. GOKHALE and L. KOTLIKOFF (2003), ‘The impact on consumption and saving of current and future fiscal policies’, NBER Working Paper, No. 10085.
CASE, K., J. QUIGLEY and R. SHILLER (2003), ‘Comparing wealth effects: the stock market versus the housing market’ Berkeley University, Program on Housing and Urban Policy Working Paper No. W101-004.
CATTE, P., N. GIROUARD, R. PRICE and C. ANDRÉ (2004), ‘Housing markets, wealth and the business cycle’, OECD Economics Department Working Papers, forthcoming.
CERISOLA, M and P. DE MASI (1999), ‘Determinants of the US personal saving rate’, United States: Selected Issues, International Monetary Fund Staff Country Report No. 99/101.
DANG, T-T., P. ANTOLIN and H. OXLEY (2001), ‘Fiscal implications of ageing: projections of age-related spending’, OECD Economics Department Working Papers, No. 305.
DE SERRES, A. and F. PELGRIN (2002), ‘The decline in private saving rates in the 1990s in OECD Countries: how much can be explained by non-wealth determinants?’ OECD Economics Department Working Papers, No. 344.
EDWARDS, S. (1996), ‘Why are Latin America’s saving rates so low: an international comparative analysis’, Journal of Development Economics, Vol. 51.
GALE, W and P. ORSZAG (2002), ‘The economic effects of long-term fiscal discipline’, Urban-Brookings Tax Policy Center Discussion Paper No.8.
GALE, W. and J. SABELHAUS (1999), ‘Perspectives on the household saving rate’, Brookings Papers on Economic Activity, Vol. No. 1, pp. 181-224.
GIAVAZZI, F. and M. PAGANO (1996), ‘Non-Keynesian effects of fiscal policy changes: international evidence and Swedish experience’, Swedish Economic Policy Review, Vol. 3, No. 1.
GIAVAZZI, F., T. JAPPELLI and M. PAGANO (2000), ‘Searching for non-linear effects of fiscal policy : evidence from industrial and developing countries’, European Economic Review, Vol. 44.
34
HAQUE, N., M. PESARAN and S. SHARMA (1999), ‘Neglected heterogeneity and dynamics in cross-country savings regressions’, IMF Working Paper, No. 02/208.
LETTAU, M. and S. LUDVIGSON (2003), ‘Understanding trend and cycle in asset values: re-evaluating the wealth effect on consumption’, NBER Working Paper, No. 9848.
LOAYZA, N., K. SCHMIDT-HEBBEL and L. SERVEN (2001), ‘What drives private saving across the world?’ Review of Economics and Statistics, Vol. 82.
LUSARDI, A., J. SKINNER and S. VENTI (2001), ‘Saving puzzles and saving policies in the United States’, NBER Working Paper, No. 8237.
MAKI, D and M. PALUMBO (2001), ‘Disintegrating the wealth effect: a cohort analysis of household saving in the 1990s’, Federal Reserve Board Discussion Paper, Washington.
MANKIW, N (2000), ‘The savers-spenders theory of fiscal policy’, American Economic Review, Vol. 90.
MASSON, P.R., T. BAYOUMI and H. SAMIEL (1998), ‘International evidence on the determinants of private saving’ The World Bank Economic Review, Vol. 12.
MUHLEISEN, M. and C. TOWE (Eds.) (2004), ‘U.S. fiscal policies and priorities for long-run sustainability’ IMF Occasional Paper, No. 227.
OECD (2004), OECD Economic Survey, United States, Paris.
PARKER, J (1999), ‘The consumption function revisited’, Princeton University Working Paper.
PELGRIN, F., S. SCHICH and A. DE SERRES (2002), ‘Increases in business investment rates in OECD countries in the 1990s: how much can be explained by fundamentals?’ OECD Economics Department Working Papers, No. 327.
PRICE, R., L. DE MELLO and P. KONGSRUD (2004), ‘Saving behaviour and the effectiveness of fiscal policy’, OECD Economics Department Working Paper, forthcoming.
SCHOLZ, J., A. SESHADRI and S. KHITATRAKUN (2004), ‘Are Americans saving ‘optimally’ for retirement?’, NBER Working Paper, No. 10260.
SHAFER, J., J. ELMESKOV and W. TEASE (1992), ‘Saving trends and measurement issues’, Scandinavian Journal of Economics, Vol. 94, No.2.
STOCK, J. and M. WATSON (1993), ‘A simple estimator of cointegrating vectors in higher order integrated systems’, Econometrica, Vol. 61, No. 4.
TEVLIN, S. and K. WHELAN (2000), ‘Explaining the investment boom of the 1990s’, Federal Reserve Board, Finance and Economics Discussion Series, 2000-11.
THORNTON, J (1998), ‘Corporate taxes and household saving: panel evidence from five OECD countries’, Economia Internazionale, Vol. 51, No. 2.
1
Is the U.S. prone to “over-consumption”?
Jean-Philippe Cotis
OECD Chief Economist
THE MACROECONOMICS OF FISCAL POLICY
FEDERAL RESERVE BANK OF BOSTONECONOMIC CONFERENCE
Chatham, MassachusettsJune 14-16, 2004

2
Issues and motivation of the paper
� Current context of low saving and business investment together with large deficits in the current account of the balance of payments and the government budget.
� Is there a ‘structural’ lack of saving in the U.S?– In the recent past (late 1990s), the U.S may have been under
saving– Risk of inadequate capital accumulation in the future?– A suboptimal outcome for the U.S and also the world at large?
� The issues deserve a thorough examination, with a clear distinction between the past behaviour of the U.S. economy and future prospects.
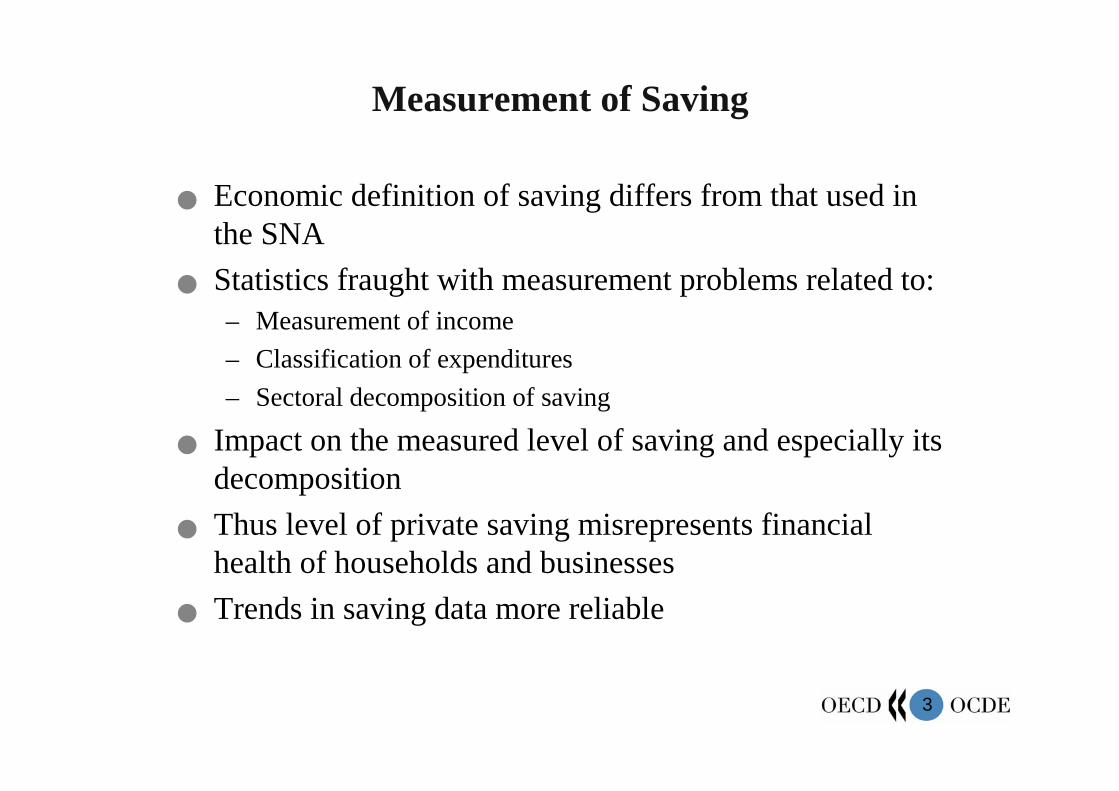
3
Measurement of Saving
� Economic definition of saving differs from that used in the SNA
� Statistics fraught with measurement problems related to:– Measurement of income
– Classification of expenditures
– Sectoral decomposition of saving
� Impact on the measured level of saving and especially its decomposition
� Thus level of private saving misrepresents financial health of households and businesses
� Trends in saving data more reliable
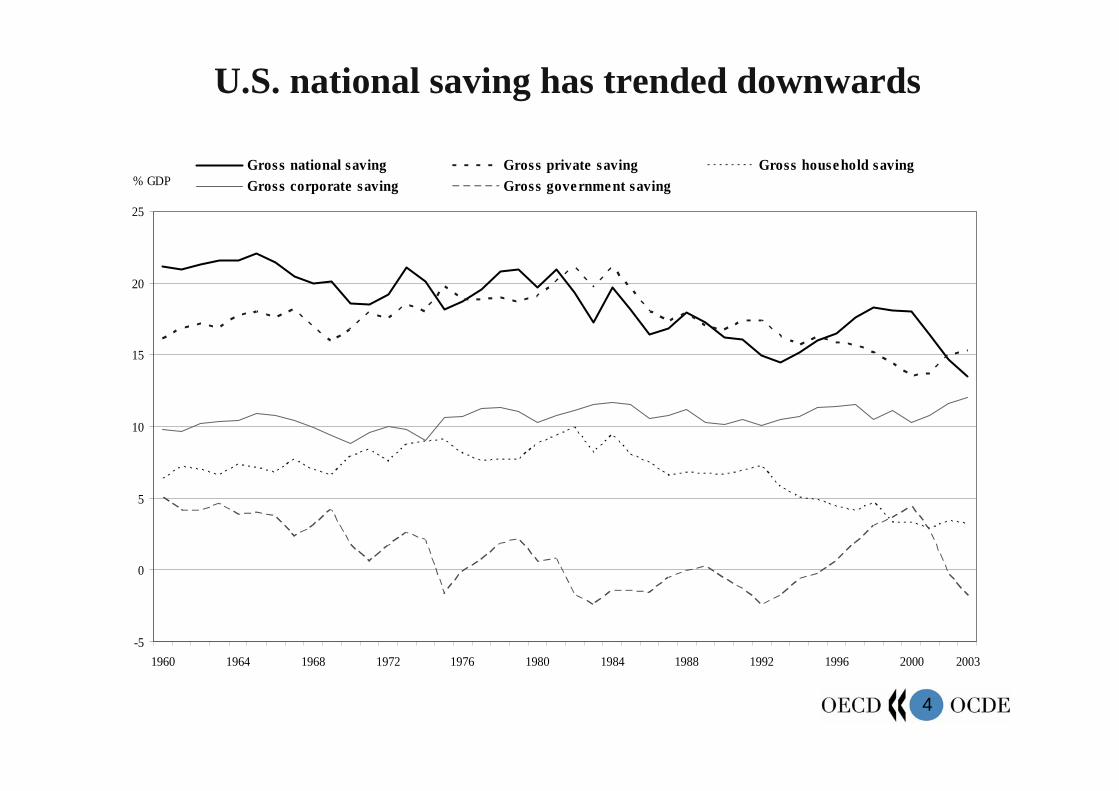
4
U.S. national saving has trended downwards
-5
0
5
10
15
20
25
1960 1964 1968 1972 1976 1980 1984 1988 1992 1996 2000 2003
% GDPGross national saving Gross private saving Gross household savingGross corporate saving Gross government saving
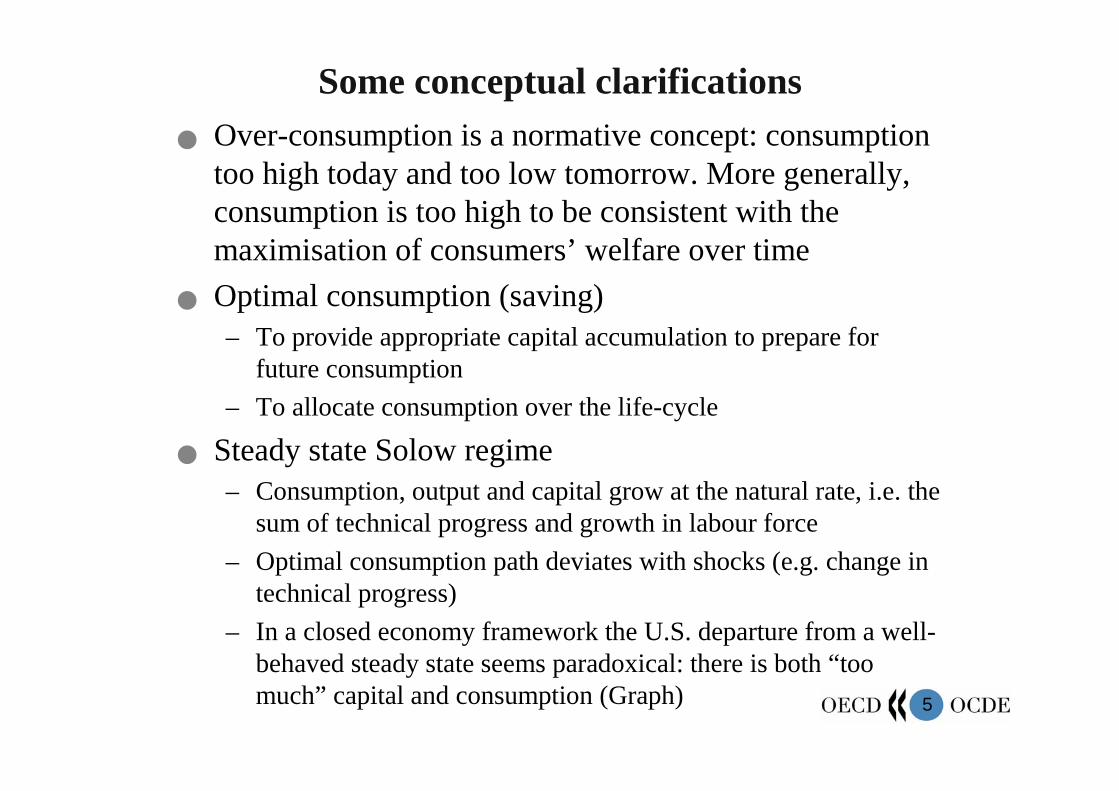
5
Some conceptual clarifications� Over-consumption is a normative concept: consumption
too high today and too low tomorrow. More generally, consumption is too high to be consistent with the maximisation of consumers’ welfare over time
� Optimal consumption (saving)– To provide appropriate capital accumulation to prepare for
future consumption
– To allocate consumption over the life-cycle
� Steady state Solow regime– Consumption, output and capital grow at the natural rate, i.e. the
sum of technical progress and growth in labour force
– Optimal consumption path deviates with shocks (e.g. change in technical progress)
– In a closed economy framework the U.S. departure from a well-behaved steady state seems paradoxical: there is both “too much” capital and consumption (Graph)

6
Strategy of the paper
� A fundamental contradiction: normative answer required but empirical work mostly positive
� “Demiurgic programme”– Requires an ambitious optimisation exercise
– Using a calibrated general equilibrium model to confront calculated paths of optimal consumption with reality
– To explain differences by various imperfections: tax and fiscal policies, market failures, forecasting errors etc
� Less ambitious goal is to glean normative insights from positive empirical analysis by:– Observing, ex post, past relationships on the assumption that a long
and stable relationship may be deemed optimal
– Ex ante, or forward looking analysis
7
Has U.S household consumption overshot since the late 1990s?
� Ex-post analysis: two dimensions:
– Adequate provision of capital accumulation
– Optimal allocation of consumption over time
� No sign in the past of under accumulation. Rather, the contrary: a capital overhang
8
Hysteresis in public deficits and durably low national saving
� Need to increase national saving– To finance capital accumulation
– While the current account deficit position is already very weak
� How could higher national saving come about?– Reducing public deficits
– A spontaneous private saving offset
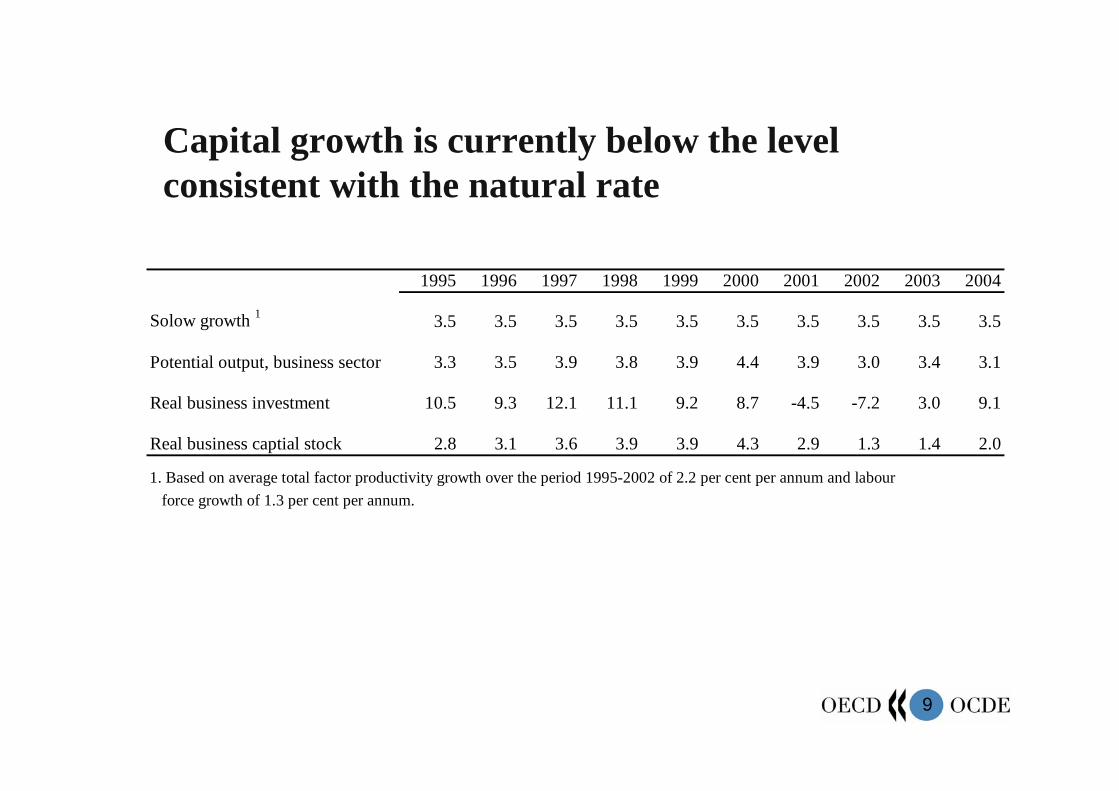
9
Capital growth is currently below the level consistent with the natural rate
1995 1996 1997 1998 1999 2000 2001 2002 2003 2004
Solow growth 1 3.5 3.5 3.5 3.5 3.5 3.5 3.5 3.5 3.5 3.5
Potential output, business sector 3.3 3.5 3.9 3.8 3.9 4.4 3.9 3.0 3.4 3.1
Real business investment 10.5 9.3 12.1 11.1 9.2 8.7 -4.5 -7.2 3.0 9.1
Real business captial stock 2.8 3.1 3.6 3.9 3.9 4.3 2.9 1.3 1.4 2.0
1. Based on average total factor productivity growth over the period 1995-2002 of 2.2 per cent per annum and labour
force growth of 1.3 per cent per annum.
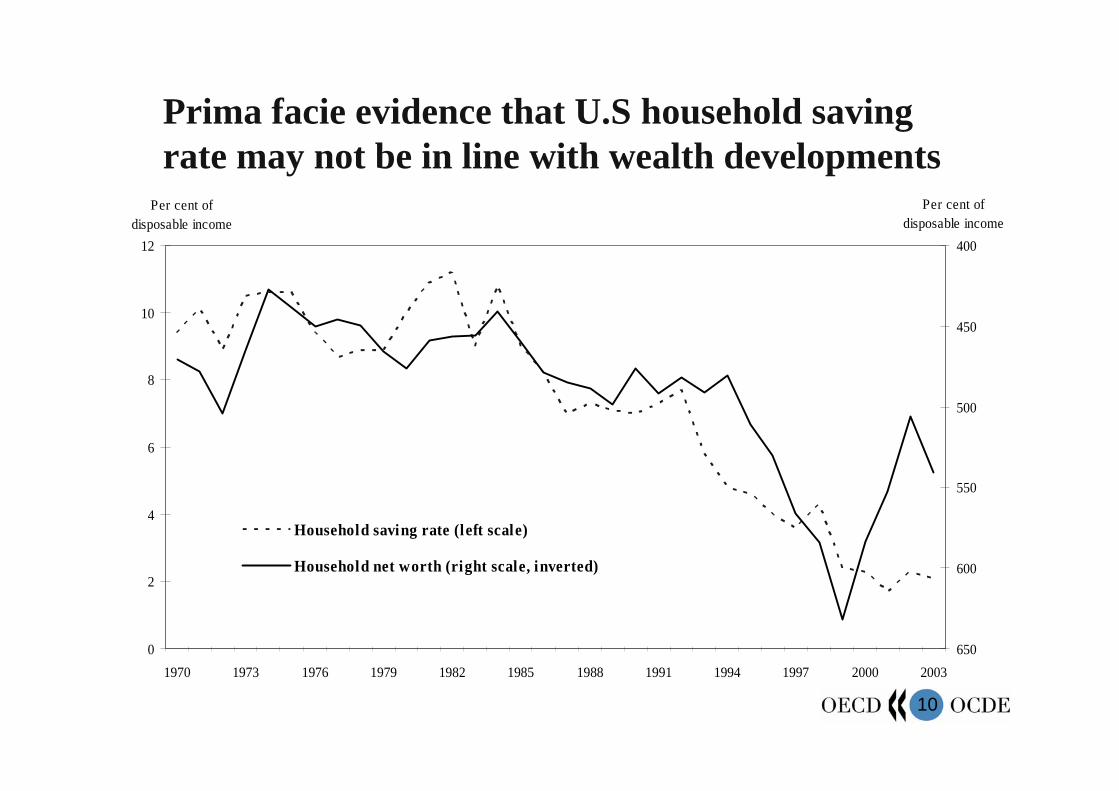
10
Prima facie evidence that U.S household saving rate may not be in line with wealth developments
0
2
4
6
8
10
12
1970 1973 1976 1979 1982 1985 1988 1991 1994 1997 2000 2003
Per cent of disposable income
400
450
500
550
600
650
Per cent ofdisposable income
Household saving rate (left scale)
Household net worth (right scale, inverted)
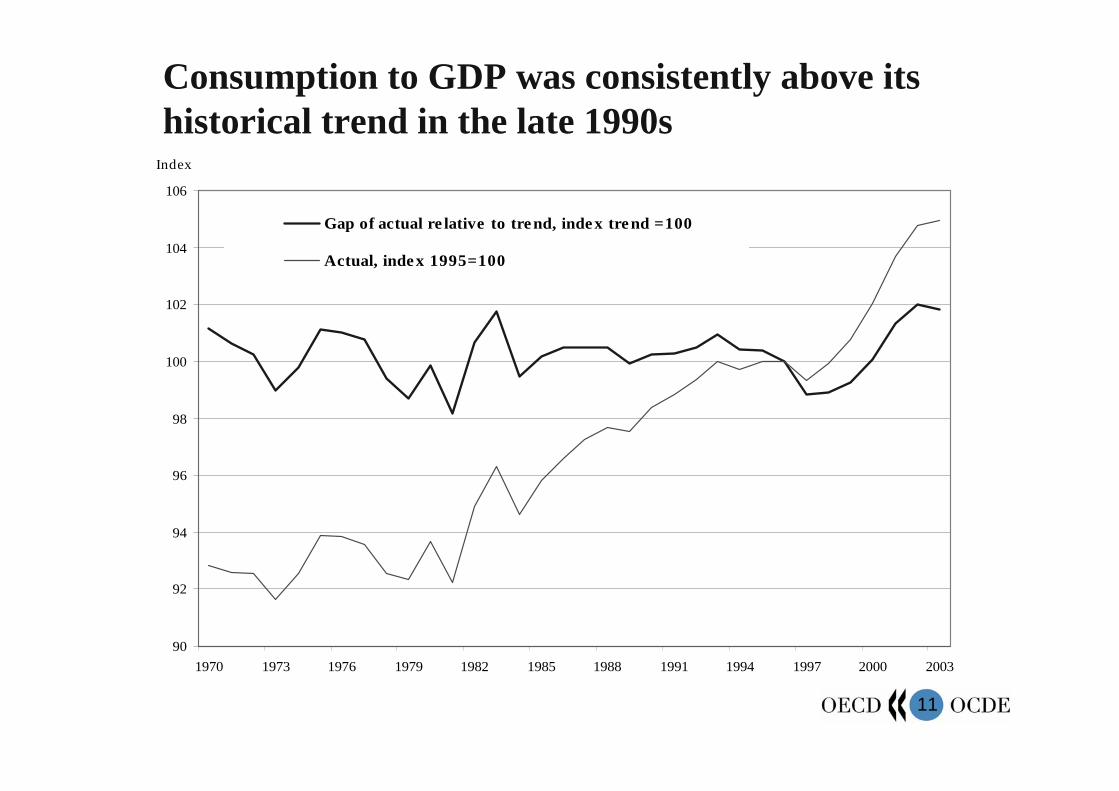
11
Consumption to GDP was consistently above its historical trend in the late 1990s
Index
90
92
94
96
98
100
102
104
106
1970 1973 1976 1979 1982 1985 1988 1991 1994 1997 2000 2003
Gap of actual re lative to tre nd, inde x tre nd =100
Actual, inde x 1995=100
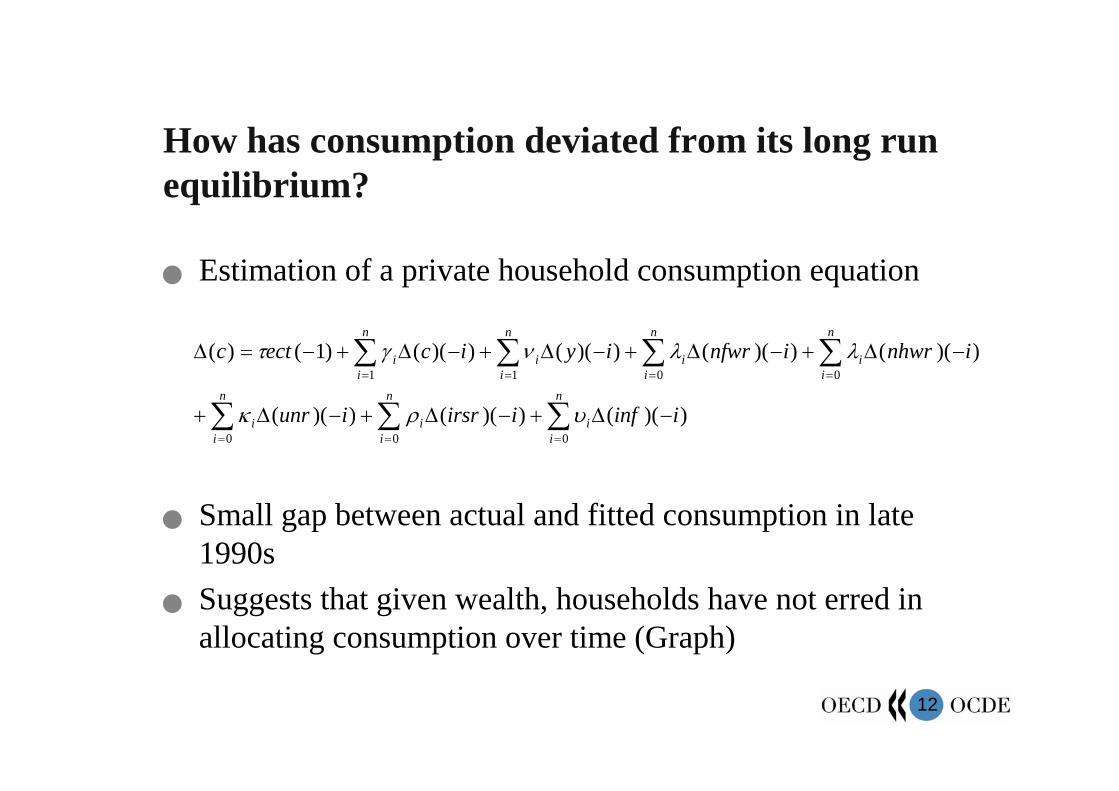
12
How has consumption deviated from its long run equilibrium?
� Estimation of a private household consumption equation
� Small gap between actual and fitted consumption in late 1990s
� Suggests that given wealth, households have not erred in allocating consumption over time (Graph)
))(())(())((
))(())(())(())(()1()(
000
0011
iinfiirsriunr
inhwrinfwriyicectc
n
ii
n
ii
n
ii
n
ii
n
ii
n
ii
n
ii
���������
���������������
���
����
���
����
���
�����
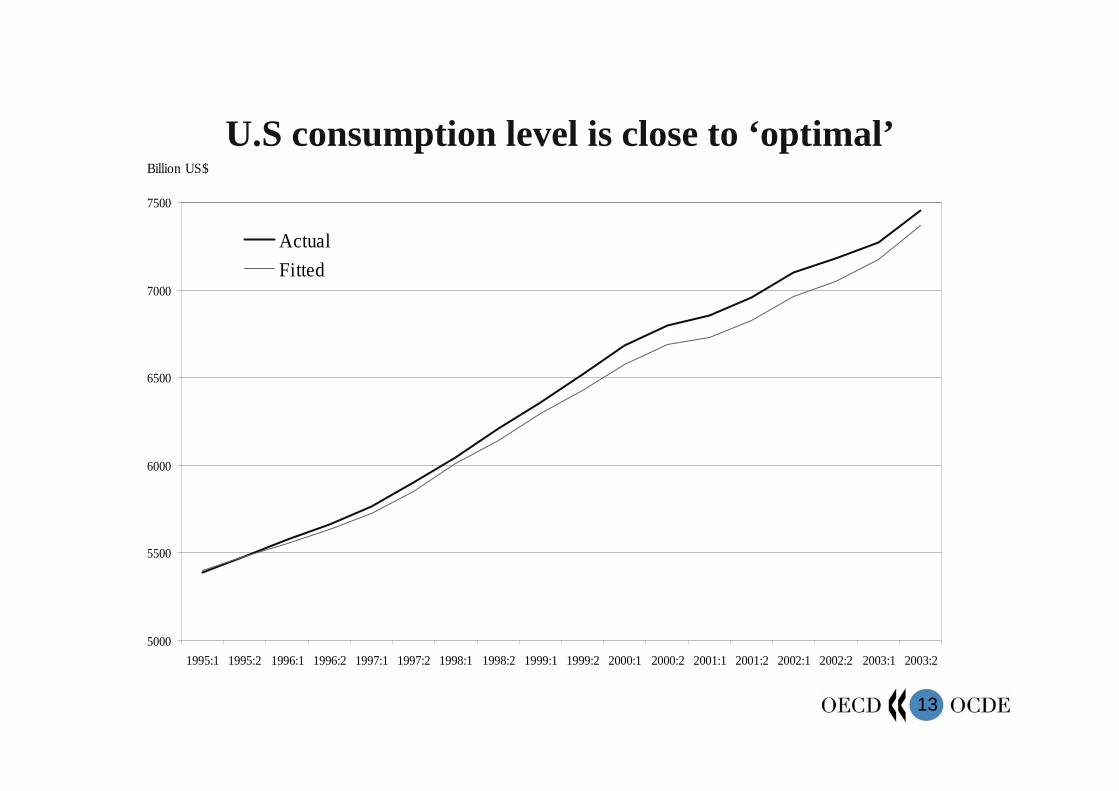
13
U.S consumption level is close to ‘optimal’
5000
5500
6000
6500
7000
7500
1995:1 1995:2 1996:1 1996:2 1997:1 1997:2 1998:1 1998:2 1999:1 1999:2 2000:1 2000:2 2001:1 2001:2 2002:1 2002:2 2003:1 2003:2
Billion US$
Actual
Fitted
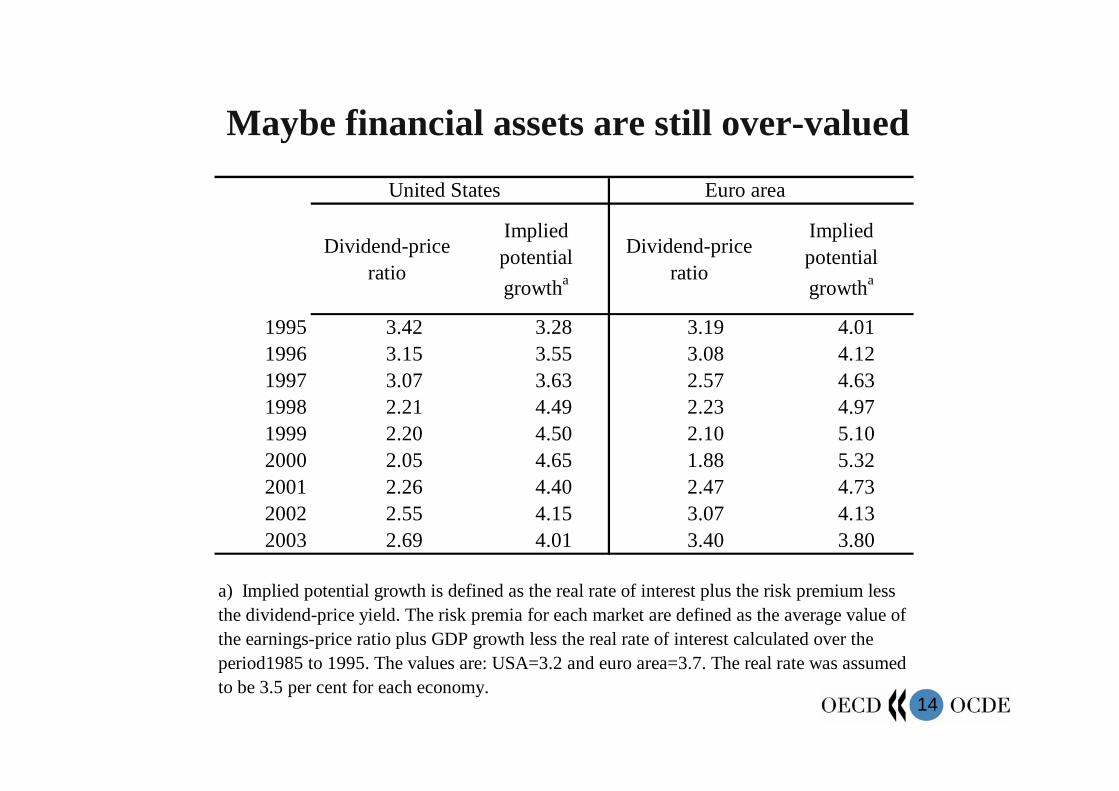
14
Maybe financial assets are still over-valued
Dividend-price ratio
Implied potential
growtha
Dividend-price ratio
Implied potential
growtha
1995 3.42 3.28 3.19 4.011996 3.15 3.55 3.08 4.121997 3.07 3.63 2.57 4.631998 2.21 4.49 2.23 4.971999 2.20 4.50 2.10 5.102000 2.05 4.65 1.88 5.322001 2.26 4.40 2.47 4.732002 2.55 4.15 3.07 4.132003 2.69 4.01 3.40 3.80
a) Implied potential growth is defined as the real rate of interest plus the risk premium less the dividend-price yield. The risk premia for each market are defined as the average value of the earnings-price ratio plus GDP growth less the real rate of interest calculated over the period1985 to 1995. The values are: USA=3.2 and euro area=3.7. The real rate was assumed to be 3.5 per cent for each economy.
United States Euro area

15
Solow potential output for the United States
0.9
1
1.1
1.2
1.3
1.4
1.5
1995 1996 1997 1998 1999 2000 2001 2002 2003 2004
Index 1995=1
Solow potential output
Real private consumption
Capital services stock (1)
1. Capital service data is extended after 2002 with the growth rates for overall business capital stock.
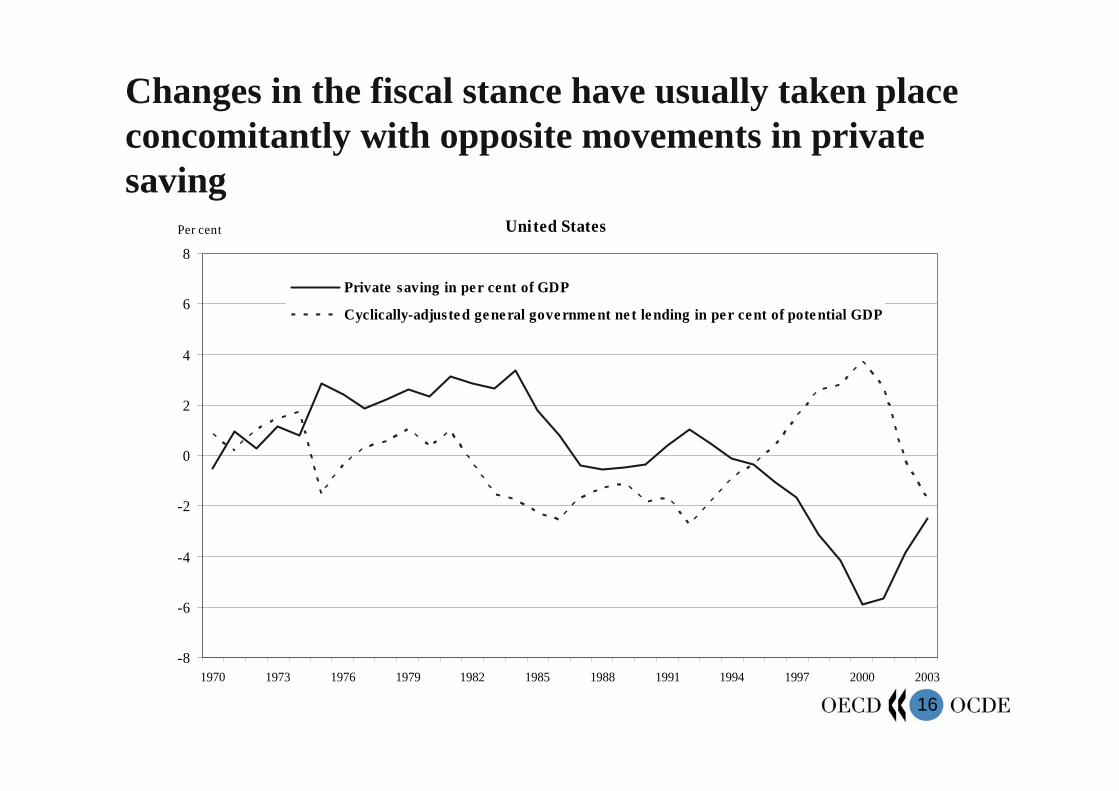
16
Changes in the fiscal stance have usually taken place concomitantly with opposite movements in private saving
United States
-8
-6
-4
-2
0
2
4
6
8
1970 1973 1976 1979 1982 1985 1988 1991 1994 1997 2000 2003
Per cent
Private saving in per cent of GDP
Cyclically-adjuste d ge ne ral gove rnme nt ne t le nding in per cent of pote ntial GDP
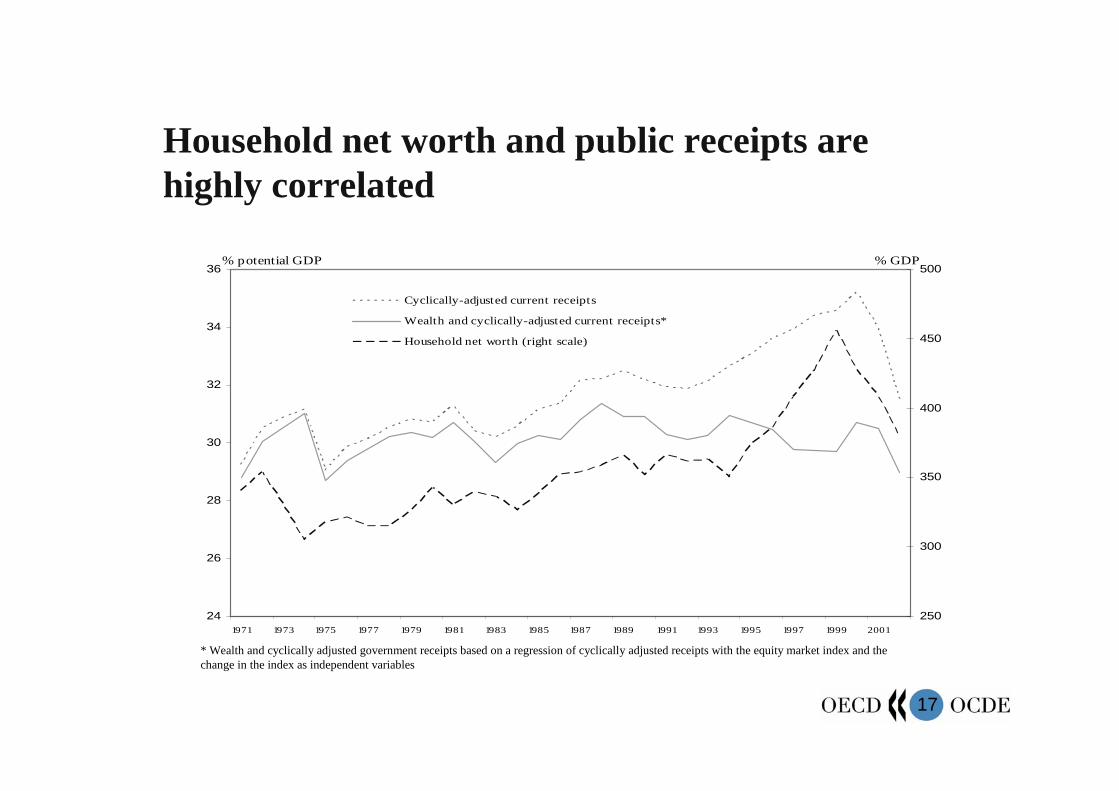
17
Household net worth and public receipts are highly correlated
24
26
28
30
32
34
36
1971 1973 1975 1977 1979 1981 1983 1985 1987 1989 1991 1993 1995 1997 1999 2001
% potential GDP
250
300
350
400
450
500% GDP
Cyclically-adjusted current receipts
Wealth and cyclically-adjusted current receipts*
Household net worth (right scale)
* Wealth and cyclically adjusted government receipts based on a regression of cyclically adjusted receipts with the equity market index and the change in the index as independent variables
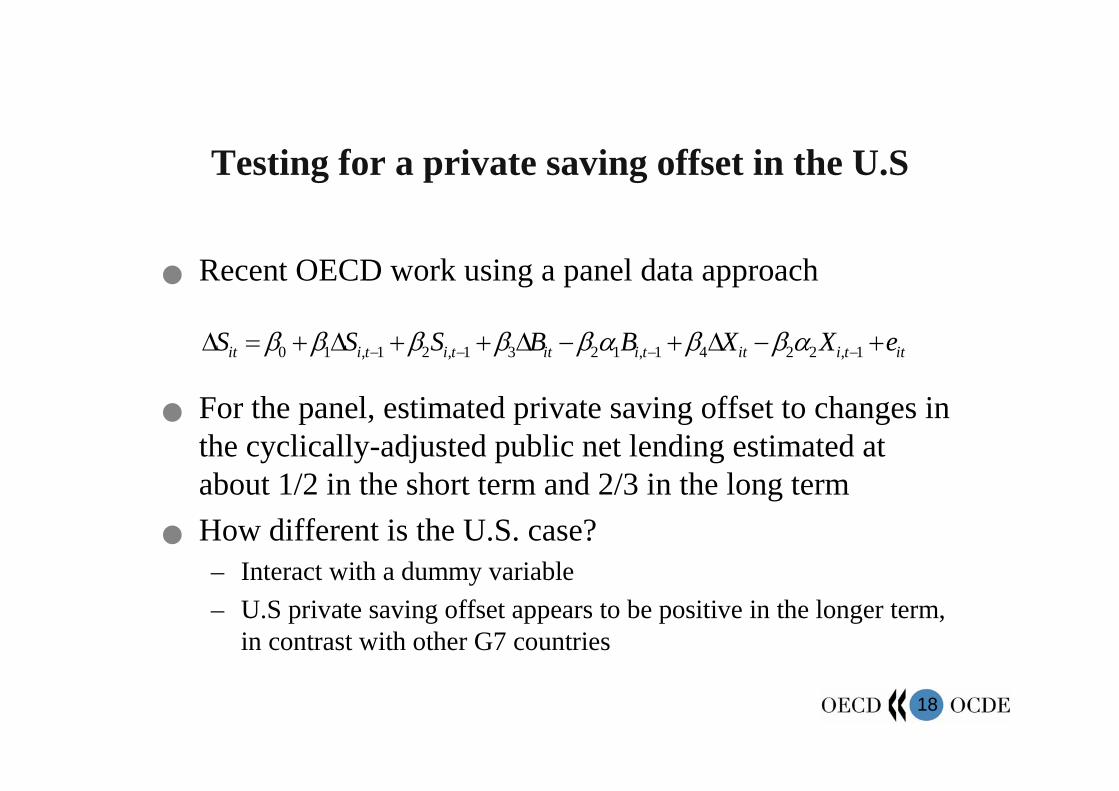
18
Testing for a private saving offset in the U.S
� Recent OECD work using a panel data approach
� For the panel, estimated private saving offset to changes in the cyclically-adjusted public net lending estimated at about 1/2 in the short term and 2/3 in the long term
� How different is the U.S. case?– Interact with a dummy variable
– U.S private saving offset appears to be positive in the longer term, in contrast with other G7 countries
ittiittiittitiit eXXBBSSS ������������ ���� 1,2241,1231,21,10 ��
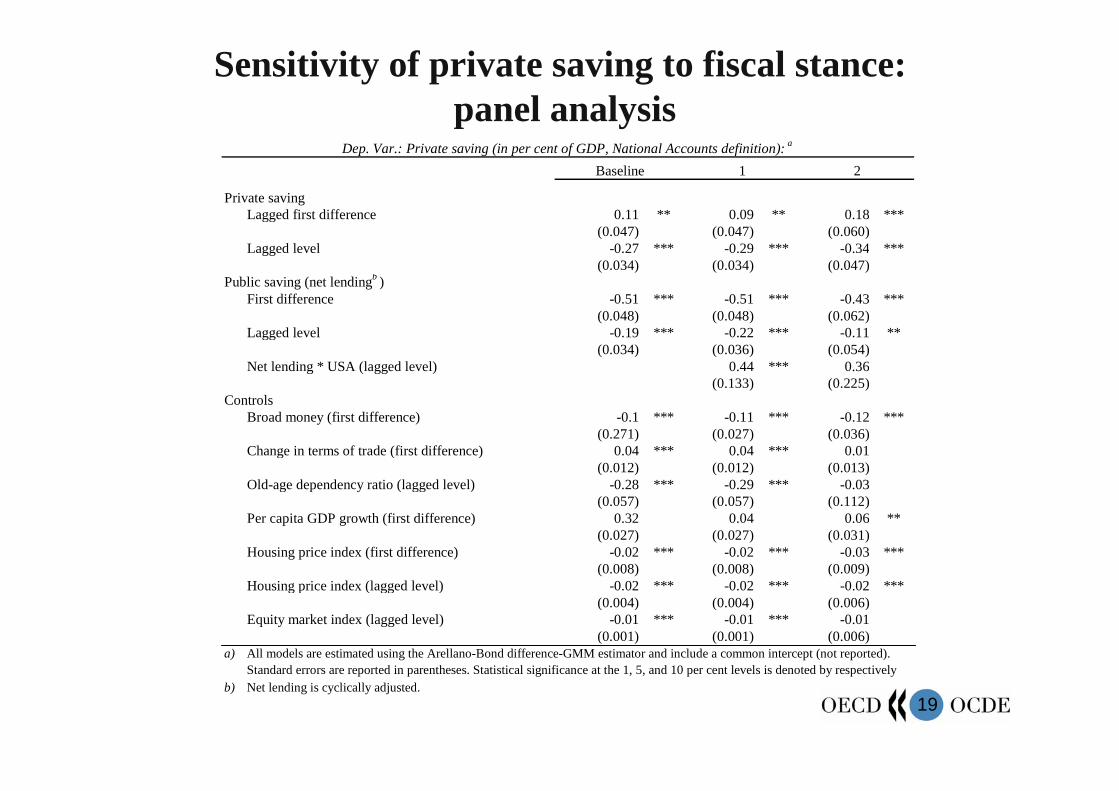
19
Sensitivity of private saving to fiscal stance:panel analysis
Private savingLagged first difference 0.11 ** 0.09 ** 0.18 ***
(0.047) (0.047) (0.060)Lagged level -0.27 *** -0.29 *** -0.34 ***
(0.034) (0.034) (0.047)Public saving (net lendingb )
First difference -0.51 *** -0.51 *** -0.43 ***(0.048) (0.048) (0.062)
Lagged level -0.19 *** -0.22 *** -0.11 **(0.034) (0.036) (0.054)
Net lending * USA (lagged level) 0.44 *** 0.36(0.133) (0.225)
ControlsBroad money (first difference) -0.1 *** -0.11 *** -0.12 ***
(0.271) (0.027) (0.036)Change in terms of trade (first difference) 0.04 *** 0.04 *** 0.01
(0.012) (0.012) (0.013)Old-age dependency ratio (lagged level) -0.28 *** -0.29 *** -0.03
(0.057) (0.057) (0.112)Per capita GDP growth (first difference) 0.32 0.04 0.06 **
(0.027) (0.027) (0.031)Housing price index (first difference) -0.02 *** -0.02 *** -0.03 ***
(0.008) (0.008) (0.009)Housing price index (lagged level) -0.02 *** -0.02 *** -0.02 ***
(0.004) (0.004) (0.006)Equity market index (lagged level) -0.01 *** -0.01 *** -0.01
(0.001) (0.001) (0.006)a)
b)
2
Dep. Var.: Private saving (in per cent of GDP, National Accounts definition): a
1
Net lending is cyclically adjusted.
Baseline
All models are estimated using the Arellano-Bond difference-GMM estimator and include a common intercept (not reported). Standard errors are reported in parentheses. Statistical significance at the 1, 5, and 10 per cent levels is denoted by respectively
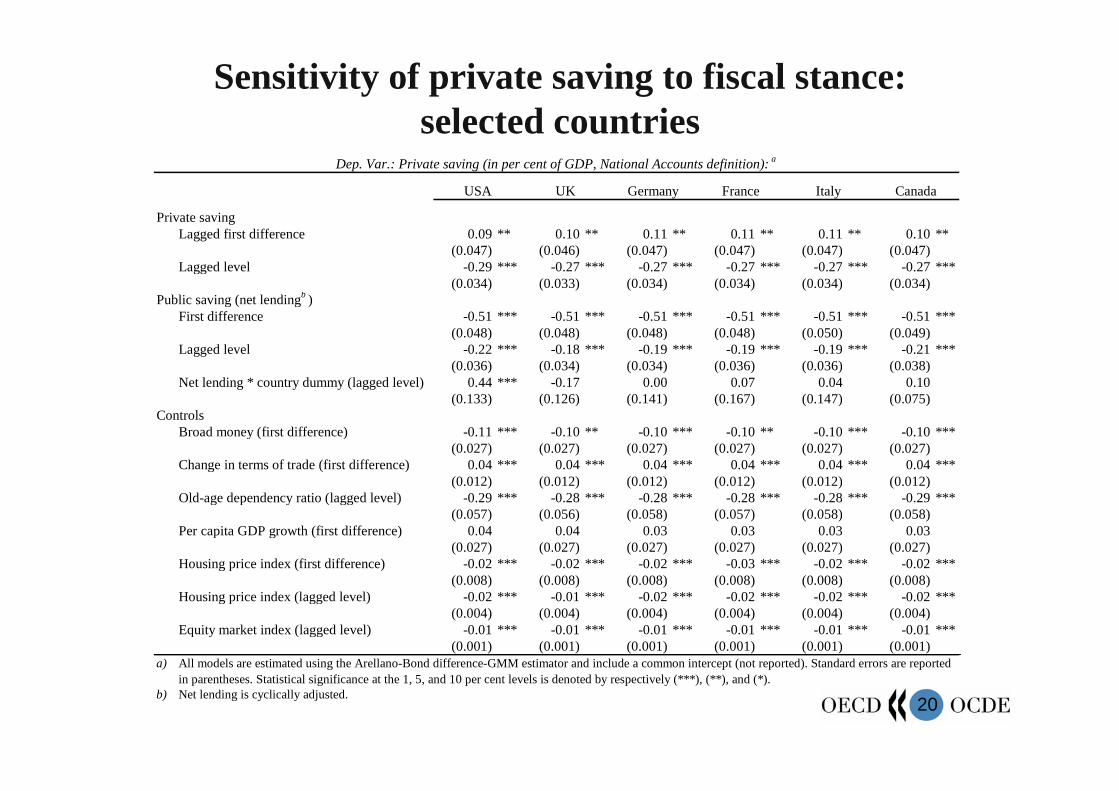
20
Sensitivity of private saving to fiscal stance: selected countries
Private savingLagged first difference 0.09 ** 0.10 ** 0.11 ** 0.11 ** 0.11 ** 0.10 **
(0.047) (0.046) (0.047) (0.047) (0.047) (0.047)Lagged level -0.29 *** -0.27 *** -0.27 *** -0.27 *** -0.27 *** -0.27 ***
(0.034) (0.033) (0.034) (0.034) (0.034) (0.034)Public saving (net lendingb )
First difference -0.51 *** -0.51 *** -0.51 *** -0.51 *** -0.51 *** -0.51 ***(0.048) (0.048) (0.048) (0.048) (0.050) (0.049)
Lagged level -0.22 *** -0.18 *** -0.19 *** -0.19 *** -0.19 *** -0.21 ***(0.036) (0.034) (0.034) (0.036) (0.036) (0.038)
Net lending * country dummy (lagged level) 0.44 *** -0.17 0.00 0.07 0.04 0.10(0.133) (0.126) (0.141) (0.167) (0.147) (0.075)
ControlsBroad money (first difference) -0.11 *** -0.10 ** -0.10 *** -0.10 ** -0.10 *** -0.10 ***
(0.027) (0.027) (0.027) (0.027) (0.027) (0.027)Change in terms of trade (first difference) 0.04 *** 0.04 *** 0.04 *** 0.04 *** 0.04 *** 0.04 ***
(0.012) (0.012) (0.012) (0.012) (0.012) (0.012)Old-age dependency ratio (lagged level) -0.29 *** -0.28 *** -0.28 *** -0.28 *** -0.28 *** -0.29 ***
(0.057) (0.056) (0.058) (0.057) (0.058) (0.058)Per capita GDP growth (first difference) 0.04 0.04 0.03 0.03 0.03 0.03
(0.027) (0.027) (0.027) (0.027) (0.027) (0.027)Housing price index (first difference) -0.02 *** -0.02 *** -0.02 *** -0.03 *** -0.02 *** -0.02 ***
(0.008) (0.008) (0.008) (0.008) (0.008) (0.008)Housing price index (lagged level) -0.02 *** -0.01 *** -0.02 *** -0.02 *** -0.02 *** -0.02 ***
(0.004) (0.004) (0.004) (0.004) (0.004) (0.004)Equity market index (lagged level) -0.01 *** -0.01 *** -0.01 *** -0.01 *** -0.01 *** -0.01 ***
(0.001) (0.001) (0.001) (0.001) (0.001) (0.001)a)
b) Net lending is cyclically adjusted.
All models are estimated using the Arellano-Bond difference-GMM estimator and include a common intercept (not reported). Standard errors are reported in parentheses. Statistical significance at the 1, 5, and 10 per cent levels is denoted by respectively (***), (**), and (*).
CanadaFrance Italy
Dep. Var.: Private saving (in per cent of GDP, National Accounts definition): a
USA UK Germany
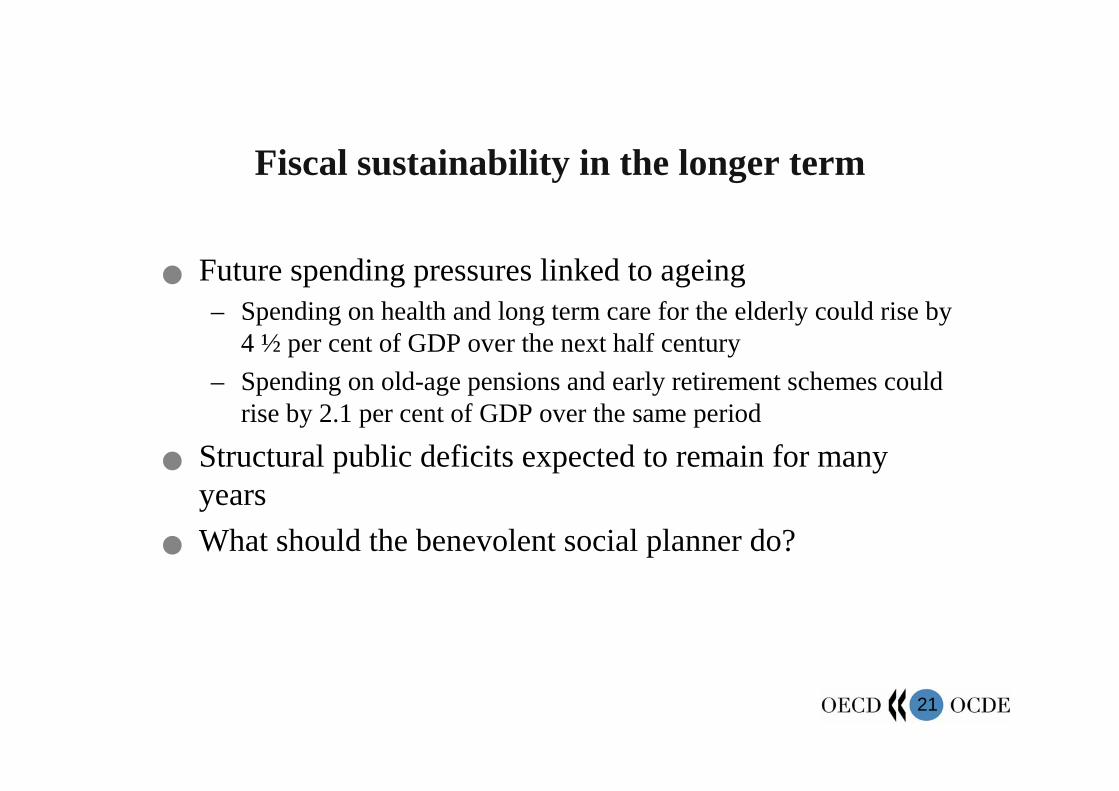
21
Fiscal sustainability in the longer term
� Future spending pressures linked to ageing– Spending on health and long term care for the elderly could rise by
4 ½ per cent of GDP over the next half century
– Spending on old-age pensions and early retirement schemes could rise by 2.1 per cent of GDP over the same period
� Structural public deficits expected to remain for many years
� What should the benevolent social planner do?
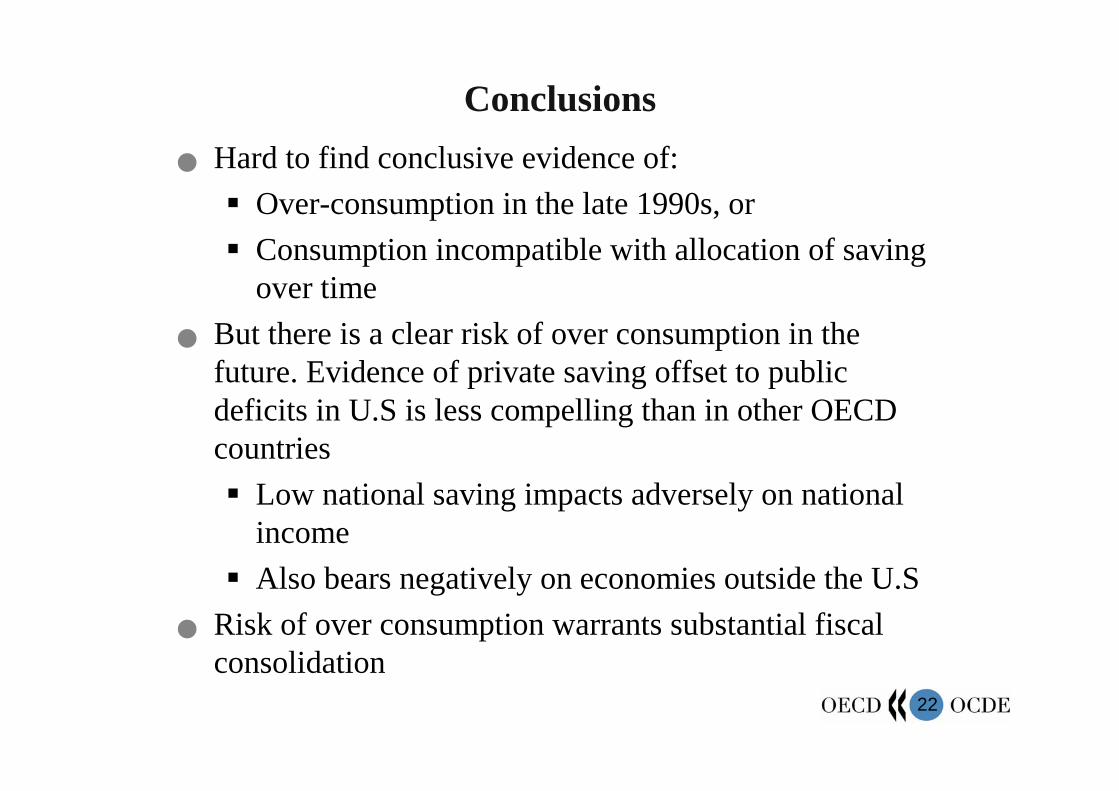
22
Conclusions
� Hard to find conclusive evidence of:
� Over-consumption in the late 1990s, or
� Consumption incompatible with allocation of saving over time
� But there is a clear risk of over consumption in the future. Evidence of private saving offset to public deficits in U.S is less compelling than in other OECD countries
� Low national saving impacts adversely on national income
� Also bears negatively on economies outside the U.S
� Risk of over consumption warrants substantial fiscal consolidation

23
SPARES
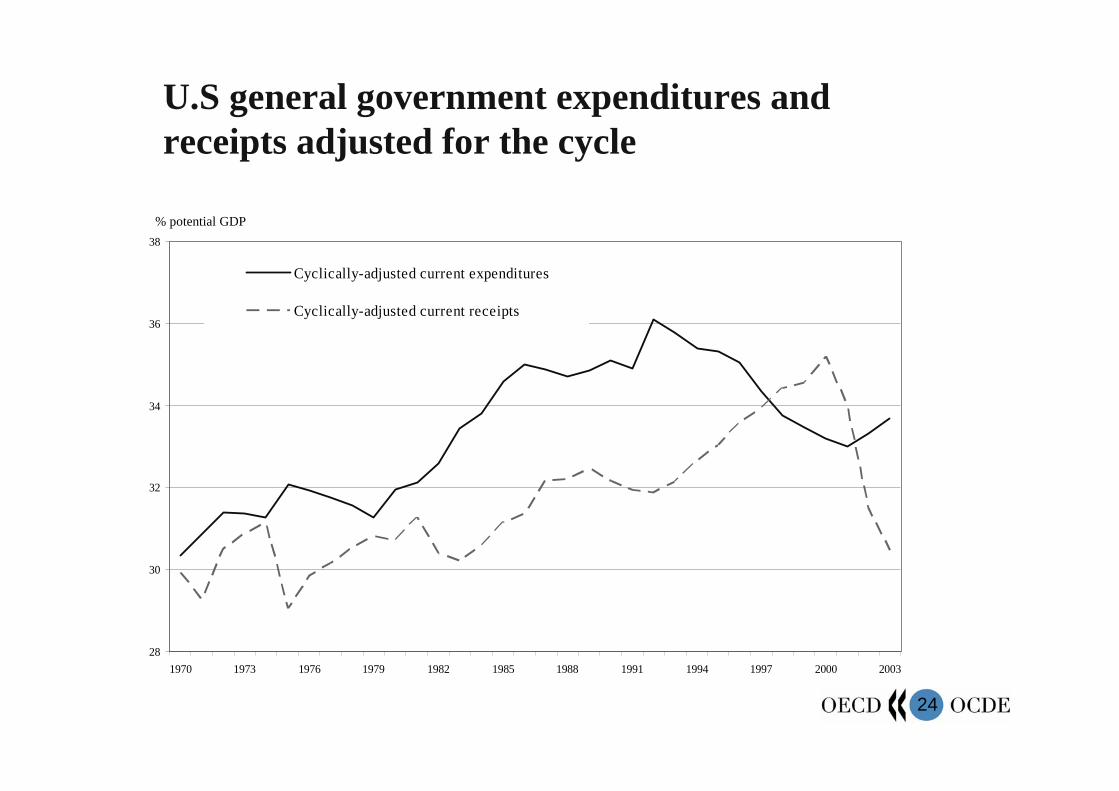
24
U.S general government expenditures and receipts adjusted for the cycle
28
30
32
34
36
38
1970 1973 1976 1979 1982 1985 1988 1991 1994 1997 2000 2003
Cyclically-adjusted current expenditures
Cyclically-adjusted current receipts
% potential GDP
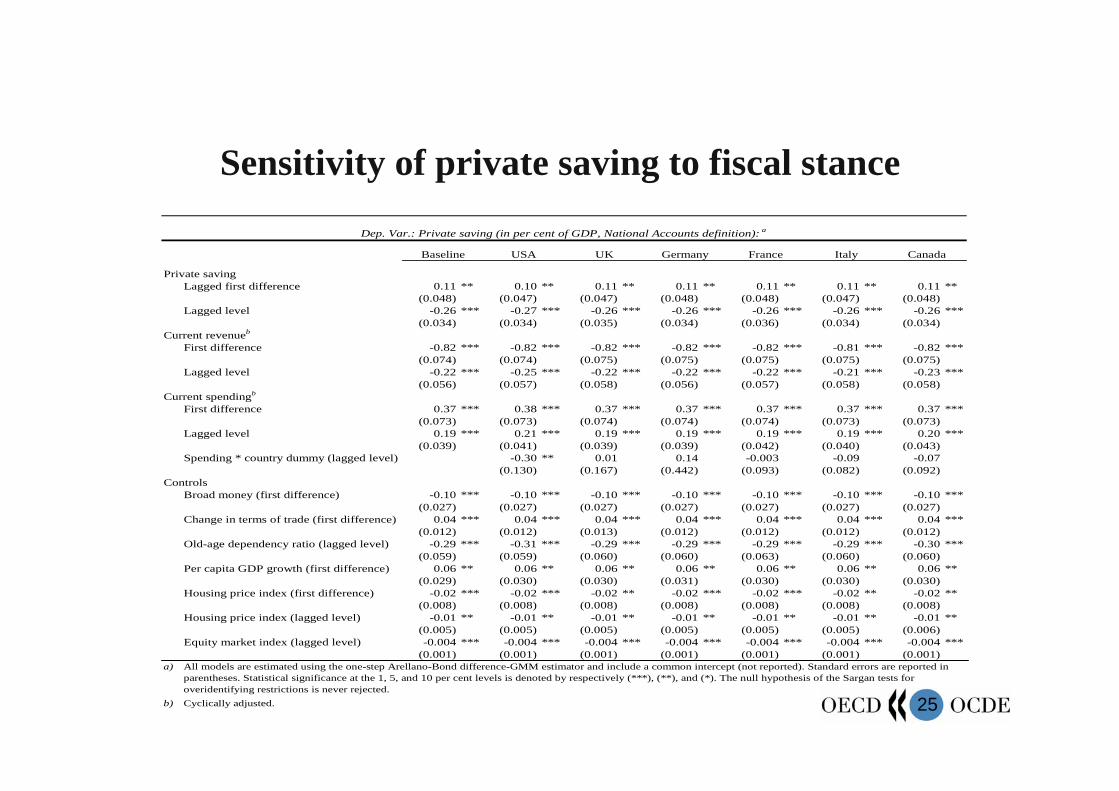
25
Sensitivity of private saving to fiscal stance
Private savingLagged first difference 0.11 ** 0.10 ** 0.11 ** 0.11 ** 0.11 ** 0.11 ** 0.11 **
(0.048) (0.047) (0.047) (0.048) (0.048) (0.047) (0.048)Lagged level -0.26 *** -0.27 *** -0.26 *** -0.26 *** -0.26 *** -0.26 *** -0.26 ***
(0.034) (0.034) (0.035) (0.034) (0.036) (0.034) (0.034)Current revenueb
First difference -0.82 *** -0.82 *** -0.82 *** -0.82 *** -0.82 *** -0.81 *** -0.82 ***(0.074) (0.074) (0.075) (0.075) (0.075) (0.075) (0.075)
Lagged level -0.22 *** -0.25 *** -0.22 *** -0.22 *** -0.22 *** -0.21 *** -0.23 ***(0.056) (0.057) (0.058) (0.056) (0.057) (0.058) (0.058)
Current spendingb
First difference 0.37 *** 0.38 *** 0.37 *** 0.37 *** 0.37 *** 0.37 *** 0.37 ***(0.073) (0.073) (0.074) (0.074) (0.074) (0.073) (0.073)
Lagged level 0.19 *** 0.21 *** 0.19 *** 0.19 *** 0.19 *** 0.19 *** 0.20 ***(0.039) (0.041) (0.039) (0.039) (0.042) (0.040) (0.043)
Spending * country dummy (lagged level) -0.30 ** 0.01 0.14 -0.003 -0.09 -0.07(0.130) (0.167) (0.442) (0.093) (0.082) (0.092)
ControlsBroad money (first difference) -0.10 *** -0.10 *** -0.10 *** -0.10 *** -0.10 *** -0.10 *** -0.10 ***
(0.027) (0.027) (0.027) (0.027) (0.027) (0.027) (0.027)Change in terms of trade (first difference) 0.04 *** 0.04 *** 0.04 *** 0.04 *** 0.04 *** 0.04 *** 0.04 ***
(0.012) (0.012) (0.013) (0.012) (0.012) (0.012) (0.012)Old-age dependency ratio (lagged level) -0.29 *** -0.31 *** -0.29 *** -0.29 *** -0.29 *** -0.29 *** -0.30 ***
(0.059) (0.059) (0.060) (0.060) (0.063) (0.060) (0.060)Per capita GDP growth (first difference) 0.06 ** 0.06 ** 0.06 ** 0.06 ** 0.06 ** 0.06 ** 0.06 **
(0.029) (0.030) (0.030) (0.031) (0.030) (0.030) (0.030)Housing price index (first difference) -0.02 *** -0.02 *** -0.02 ** -0.02 *** -0.02 *** -0.02 ** -0.02 **
(0.008) (0.008) (0.008) (0.008) (0.008) (0.008) (0.008)Housing price index (lagged level) -0.01 ** -0.01 ** -0.01 ** -0.01 ** -0.01 ** -0.01 ** -0.01 **
(0.005) (0.005) (0.005) (0.005) (0.005) (0.005) (0.006)Equity market index (lagged level) -0.004 *** -0.004 *** -0.004 *** -0.004 *** -0.004 *** -0.004 *** -0.004 ***
(0.001) (0.001) (0.001) (0.001) (0.001) (0.001) (0.001)a)
b)
All models are estimated using the one-step Arellano-Bond difference-GMM estimator and include a common intercept (not reported). Standard errors are reported in parentheses. Statistical significance at the 1, 5, and 10 per cent levels is denoted by respectively (***), (**), and (*). The null hypothesis of the Sargan tests for overidentifying restrictions is never rejected.
Cyclically adjusted.
Dep. Var.: Private saving (in per cent of GDP, National Accounts definition): a
Baseline USA UK Germany France Italy Canada
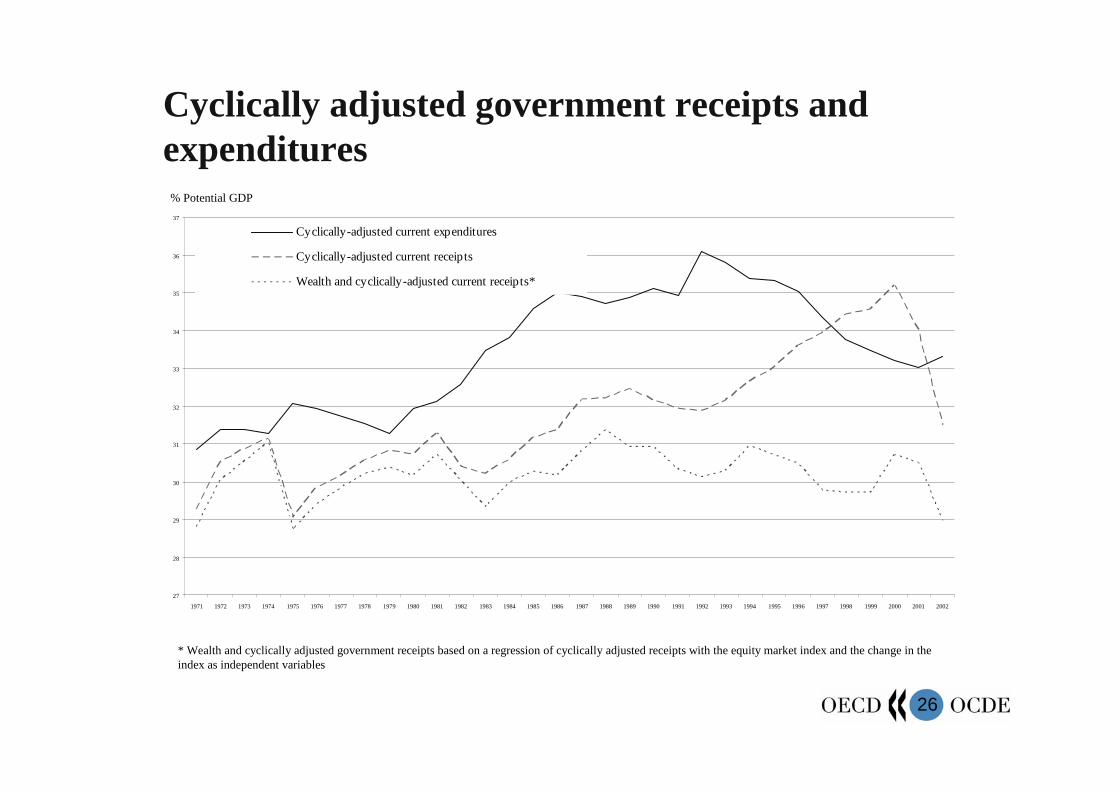
26
Cyclically adjusted government receipts and expenditures
27
28
29
30
31
32
33
34
35
36
37
1971 1972 1973 1974 1975 1976 1977 1978 1979 1980 1981 1982 1983 1984 1985 1986 1987 1988 1989 1990 1991 1992 1993 1994 1995 1996 1997 1998 1999 2000 2001 2002
Cyclically-adjusted current expenditures
Cyclically-adjusted current receipts
Wealth and cyclically-adjusted current receipts*
% Potential GDP
* Wealth and cyclically adjusted government receipts based on a regression of cyclically adjusted receipts with the equity market index and the change in the index as independent variables
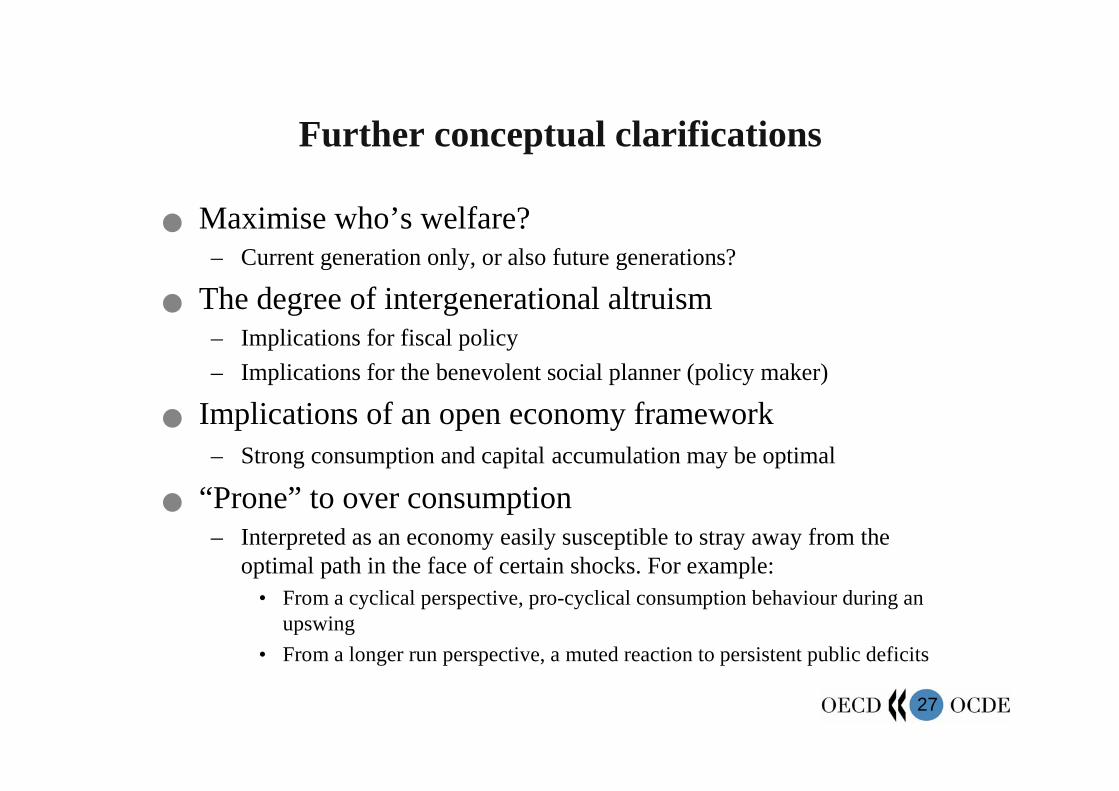
27
Further conceptual clarifications
� Maximise who’s welfare?– Current generation only, or also future generations?
� The degree of intergenerational altruism– Implications for fiscal policy
– Implications for the benevolent social planner (policy maker)
� Implications of an open economy framework– Strong consumption and capital accumulation may be optimal
� “Prone” to over consumption– Interpreted as an economy easily susceptible to stray away from the
optimal path in the face of certain shocks. For example:• From a cyclical perspective, pro-cyclical consumption behaviour during an
upswing
• From a longer run perspective, a muted reaction to persistent public deficits
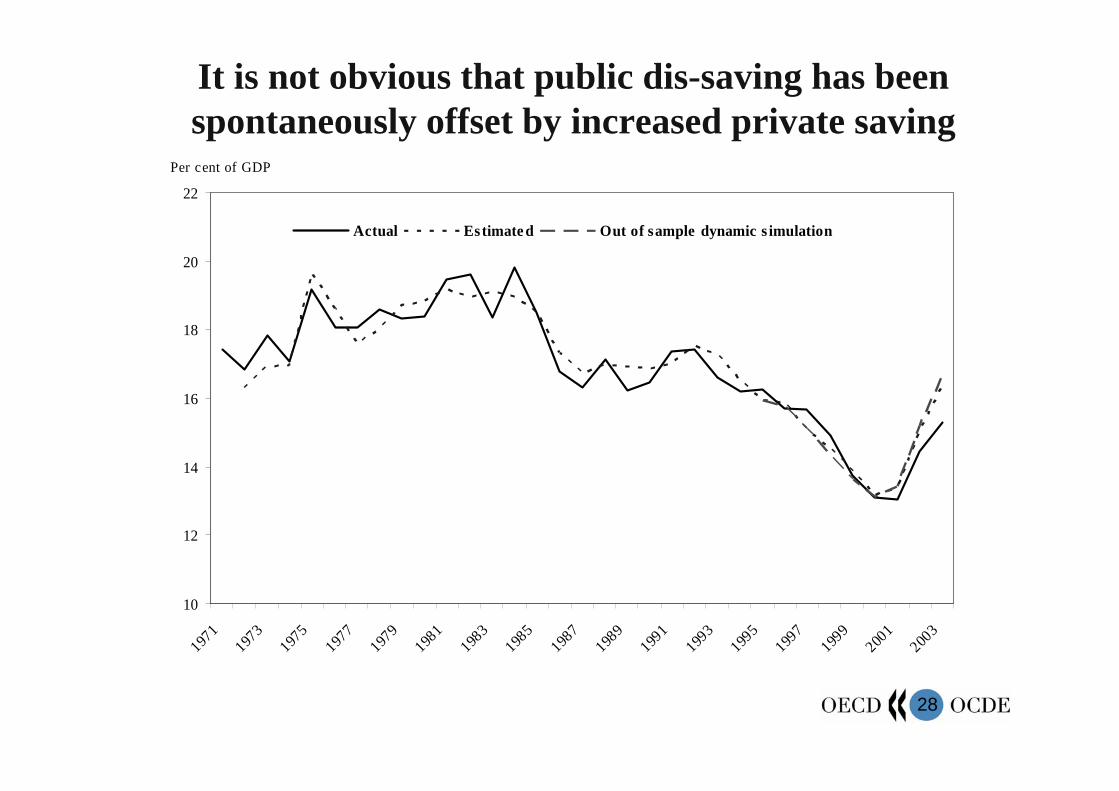
28
It is not obvious that public dis-saving has been spontaneously offset by increased private saving
10
12
14
16
18
20
22
1971
1973
1975
1977
1979
1981
1983
1985
1987
1989
1991
1993
1995
1997
1999
2001
2003
Per cent of GDP
Actual Estimate d Out of sample dynamic s imulation