Embed Size (px)
Citation preview
Boston College Consolidated Financial Statements May 31, 2018 and 2017
Boston College Index May 31, 2018 and 2017
Page(s)
Report of Independent Auditors ........................................................................................................... 1–2
Consolidated Financial Statements
Consolidated Statements of Financial Position............................................................................................ 3
Consolidated Statement of Activities ........................................................................................................... 4
Consolidated Statements of Cash Flows ..................................................................................................... 5
Notes to Consolidated Financial Statements ......................................................................................... 6–17
PricewaterhouseCoopers LLP, 101 Seaport Boulevard, Suite 500, Boston, MA 02210 T: (617) 530 5000, F: (617) 530 5001, www.pwc.com/us
Report of Independent Auditors
To the Trustees of Boston College:
We have audited the accompanying consolidated financial statements of Boston College and its
subsidiaries (the “University”), which comprise the consolidated statements of financial position as of
May 31, 2018 and 2017, and the related consolidated statements of activities for the year ended May 31,
2018 and of cash flows for the years ended May 31, 2018 and 2017.
Management’s Responsibility for the Consolidated Financial Statements
Management is responsible for the preparation and fair presentation of the consolidated financial
statements in accordance with accounting principles generally accepted in the United States of America;
this includes the design, implementation and maintenance of internal control relevant to the preparation
and fair presentation of consolidated financial statements that are free from material misstatement,
whether due to fraud or error.
Auditors’ Responsibility
Our responsibility is to express an opinion on the consolidated financial statements based on our audits.
We conducted our audits in accordance with auditing standards generally accepted in the United States of
America. Those standards require that we plan and perform the audits to obtain reasonable assurance
about whether the consolidated financial statements are free from material misstatement.
An audit involves performing procedures to obtain audit evidence about the amounts and disclosures in
the consolidated financial statements. The procedures selected depend on our judgment, including the
assessment of the risks of material misstatement of the consolidated financial statements, whether due to
fraud or error. In making those risk assessments, we consider internal control relevant to the University’s
preparation and fair presentation of the consolidated financial statements in order to design audit
procedures that are appropriate in the circumstances, but not for the purpose of expressing an opinion on
the effectiveness of the University’s internal control. Accordingly, we express no such opinion. An audit
also includes evaluating the appropriateness of accounting policies used and the reasonableness of
significant accounting estimates made by management, as well as evaluating the overall presentation of
the consolidated financial statements. We believe that the audit evidence we have obtained is sufficient
and appropriate to provide a basis for our audit opinion.
2
Opinion
In our opinion, the consolidated financial statements referred to above present fairly, in all material
respects, the financial position of Boston College and its subsidiaries as of May 31, 2018 and 2017 and
the changes in their net assets for the year ended May 31, 2018 and their cash flows for the years ended
May 31, 2018 and 2017 in accordance with accounting principles generally accepted in the United States
of America.
Other Matter
We previously audited the consolidated statement of financial position as of May 31, 2017, and the related
consolidated statements of activities and of cash flows for the year then ended (not presented herein), and
in our report dated September 29, 2017, we expressed an unmodified opinion on those consolidated
financial statements. In our opinion, the information set forth in the accompanying summarized financial
information as of May 31, 2017 and for the year then ended is consistent, in all material respects, with the
audited consolidated financial statements from which it has been derived.
Boston, Massachusetts
September 28, 2018
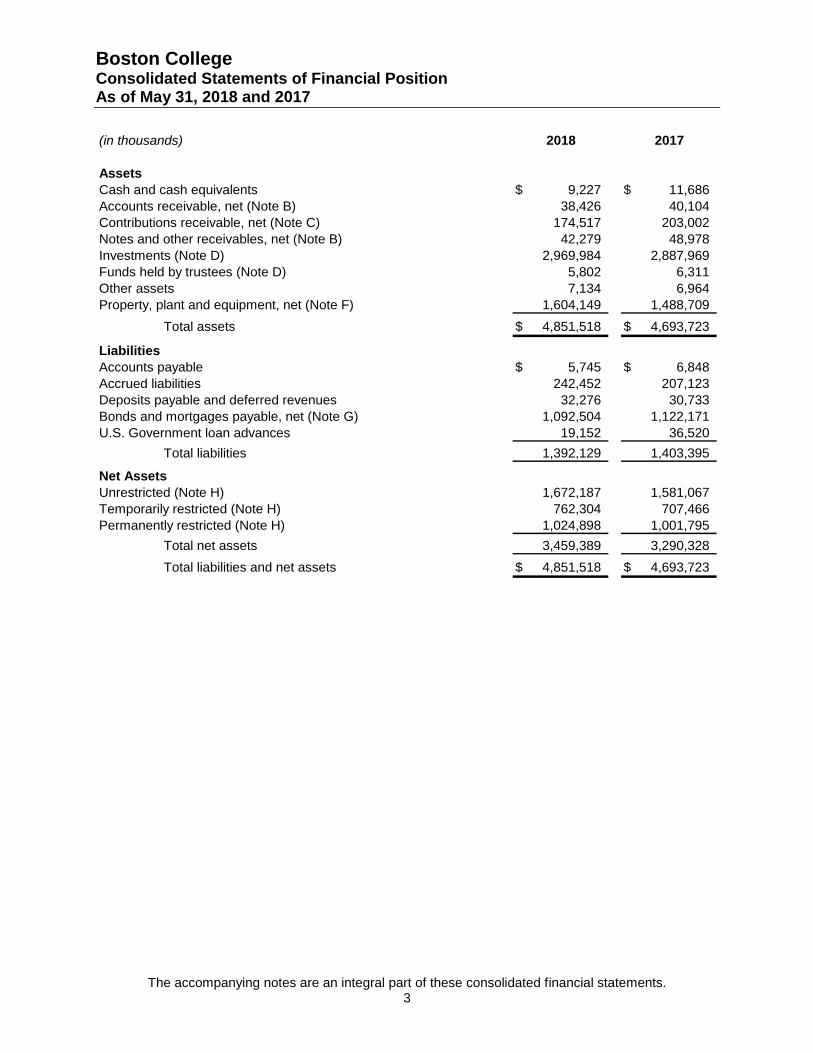
Boston College Consolidated Statements of Financial Position As of May 31, 2018 and 2017
The accompanying notes are an integral part of these consolidated financial statements. 3
(in thousands) 2018 2017
Assets
Cash and cash equivalents 9,227$ 11,686$
Accounts receivable, net (Note B) 38,426 40,104
Contributions receivable, net (Note C) 174,517 203,002
Notes and other receivables, net (Note B) 42,279 48,978
Investments (Note D) 2,969,984 2,887,969
Funds held by trustees (Note D) 5,802 6,311
Other assets 7,134 6,964
Property, plant and equipment, net (Note F) 1,604,149 1,488,709
Total assets 4,851,518$ 4,693,723$
Liabilities
Accounts payable 5,745$ 6,848$
Accrued liabilities 242,452 207,123
Deposits payable and deferred revenues 32,276 30,733
Bonds and mortgages payable, net (Note G) 1,092,504 1,122,171
U.S. Government loan advances 19,152 36,520
Total liabilities 1,392,129 1,403,395
Net Assets
Unrestricted (Note H) 1,672,187 1,581,067
Temporarily restricted (Note H) 762,304 707,466
Permanently restricted (Note H) 1,024,898 1,001,795
Total net assets 3,459,389 3,290,328
Total liabilities and net assets 4,851,518$ 4,693,723$
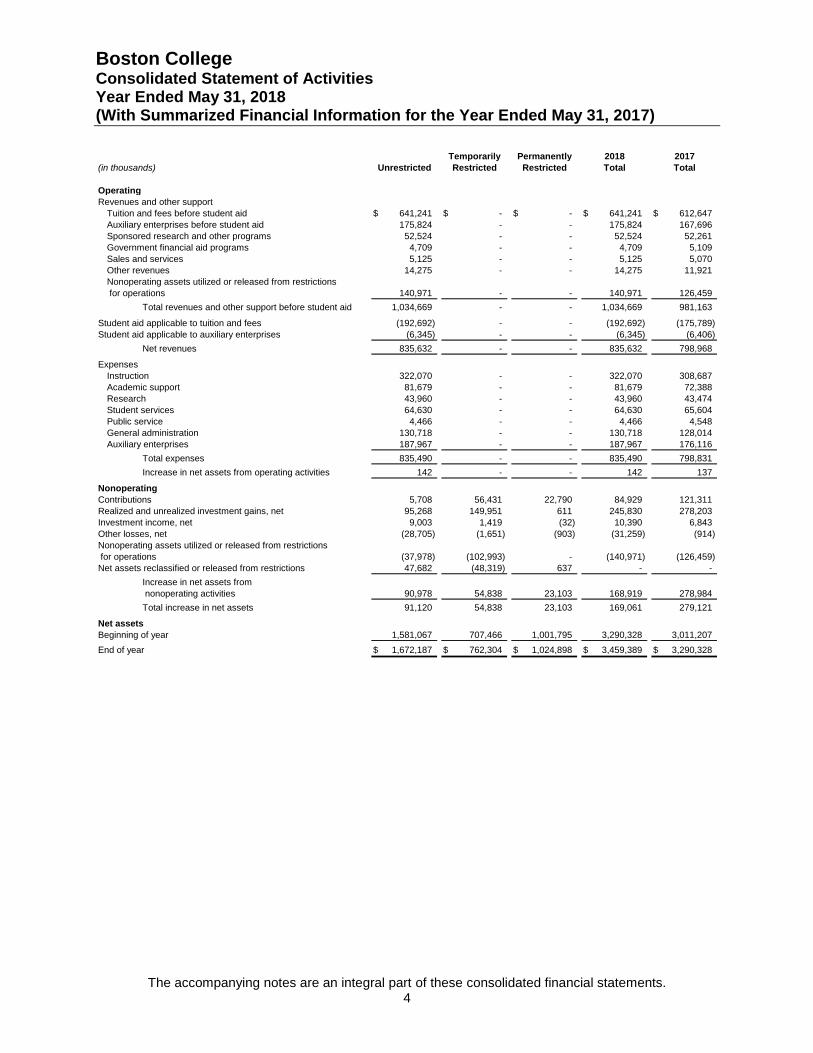
Boston College Consolidated Statement of Activities Year Ended May 31, 2018 (With Summarized Financial Information for the Year Ended May 31, 2017)
The accompanying notes are an integral part of these consolidated financial statements. 4
Temporarily Permanently 2018 2017
(in thousands) Unrestricted Restricted Restricted Total Total
Operating
Revenues and other support
Tuition and fees before student aid 641,241$ -$ -$ 641,241$ 612,647$
Auxiliary enterprises before student aid 175,824 - - 175,824 167,696
Sponsored research and other programs 52,524 - - 52,524 52,261
Government financial aid programs 4,709 - - 4,709 5,109
Sales and services 5,125 - - 5,125 5,070
Other revenues 14,275 - - 14,275 11,921
Nonoperating assets utilized or released from restrictions
for operations 140,971 - - 140,971 126,459
Total revenues and other support before student aid 1,034,669 - - 1,034,669 981,163
Student aid applicable to tuition and fees (192,692) - - (192,692) (175,789)
Student aid applicable to auxiliary enterprises (6,345) - - (6,345) (6,406)
Net revenues 835,632 - - 835,632 798,968
Expenses
Instruction 322,070 - - 322,070 308,687
Academic support 81,679 - - 81,679 72,388
Research 43,960 - - 43,960 43,474
Student services 64,630 - - 64,630 65,604
Public service 4,466 - - 4,466 4,548
General administration 130,718 - - 130,718 128,014
Auxiliary enterprises 187,967 - - 187,967 176,116
Total expenses 835,490 - - 835,490 798,831
Increase in net assets from operating activities 142 - - 142 137
Nonoperating
Contributions 5,708 56,431 22,790 84,929 121,311
Realized and unrealized investment gains, net 95,268 149,951 611 245,830 278,203
Investment income, net 9,003 1,419 (32) 10,390 6,843
Other losses, net (28,705) (1,651) (903) (31,259) (914)
Nonoperating assets utilized or released from restrictions
for operations (37,978) (102,993) - (140,971) (126,459)
Net assets reclassified or released from restrictions 47,682 (48,319) 637 - -
Increase in net assets from
nonoperating activities 90,978 54,838 23,103 168,919 278,984
Total increase in net assets 91,120 54,838 23,103 169,061 279,121
Net assets
Beginning of year 1,581,067 707,466 1,001,795 3,290,328 3,011,207
End of year 1,672,187$ 762,304$ 1,024,898$ 3,459,389$ 3,290,328$
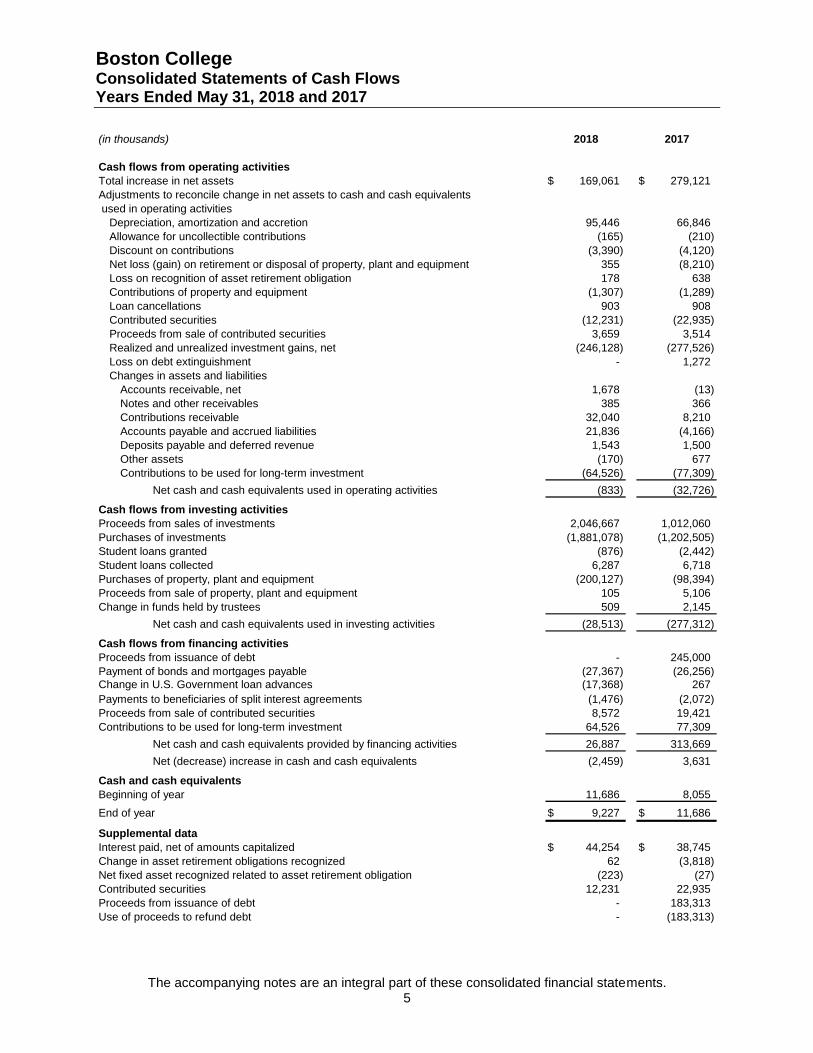
Boston College Consolidated Statements of Cash Flows Years Ended May 31, 2018 and 2017
The accompanying notes are an integral part of these consolidated financial statements. 5
(in thousands) 2018 2017
Cash flows from operating activities
Total increase in net assets 169,061$ 279,121$
Adjustments to reconcile change in net assets to cash and cash equivalents
used in operating activities
Depreciation, amortization and accretion 95,446 66,846
Allowance for uncollectible contributions (165) (210)
Discount on contributions (3,390) (4,120)
Net loss (gain) on retirement or disposal of property, plant and equipment 355 (8,210)
Loss on recognition of asset retirement obligation 178 638
Contributions of property and equipment (1,307) (1,289)
Loan cancellations 903 908
Contributed securities (12,231) (22,935)
Proceeds from sale of contributed securities 3,659 3,514
Realized and unrealized investment gains, net (246,128) (277,526)
Loss on debt extinguishment - 1,272
Changes in assets and liabilities
Accounts receivable, net 1,678 (13)
Notes and other receivables 385 366
Contributions receivable 32,040 8,210
Accounts payable and accrued liabilities 21,836 (4,166)
Deposits payable and deferred revenue 1,543 1,500
Other assets (170) 677
Contributions to be used for long-term investment (64,526) (77,309)
Net cash and cash equivalents used in operating activities (833) (32,726)
Cash flows from investing activities
Proceeds from sales of investments 2,046,667 1,012,060
Purchases of investments (1,881,078) (1,202,505)
Student loans granted (876) (2,442)
Student loans collected 6,287 6,718
Purchases of property, plant and equipment (200,127) (98,394)
Proceeds from sale of property, plant and equipment 105 5,106
Change in funds held by trustees 509 2,145
Net cash and cash equivalents used in investing activities (28,513) (277,312)
Cash flows from financing activities
Proceeds from issuance of debt - 245,000
Payment of bonds and mortgages payable (27,367) (26,256)
Change in U.S. Government loan advances (17,368) 267
Payments to beneficiaries of split interest agreements (1,476) (2,072)
Proceeds from sale of contributed securities 8,572 19,421
Contributions to be used for long-term investment 64,526 77,309
Net cash and cash equivalents provided by financing activities 26,887 313,669
Net (decrease) increase in cash and cash equivalents (2,459) 3,631
Cash and cash equivalents
Beginning of year 11,686 8,055
End of year 9,227$ 11,686$
Supplemental data
Interest paid, net of amounts capitalized 44,254$ 38,745$
Change in asset retirement obligations recognized 62 (3,818)
Net fixed asset recognized related to asset retirement obligation (223) (27)
Contributed securities 12,231 22,935
Proceeds from issuance of debt - 183,313
Use of proceeds to refund debt - (183,313)
Boston College Notes to Consolidated Financial Statements May 31, 2018 and 2017
6
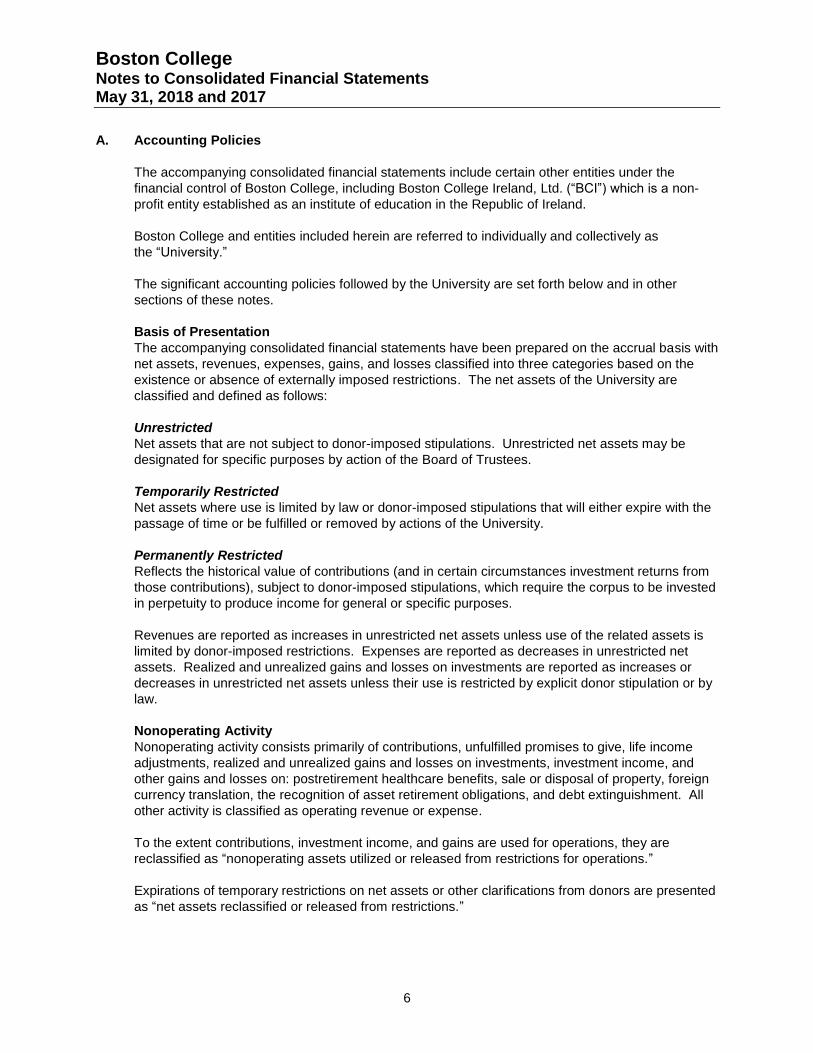
A. Accounting Policies
The accompanying consolidated financial statements include certain other entities under the
financial control of Boston College, including Boston College Ireland, Ltd. (“BCI”) which is a non-
profit entity established as an institute of education in the Republic of Ireland.
Boston College and entities included herein are referred to individually and collectively as
the “University.”
The significant accounting policies followed by the University are set forth below and in other
sections of these notes.
Basis of Presentation
The accompanying consolidated financial statements have been prepared on the accrual basis with
net assets, revenues, expenses, gains, and losses classified into three categories based on the
existence or absence of externally imposed restrictions. The net assets of the University are
classified and defined as follows:
Unrestricted
Net assets that are not subject to donor-imposed stipulations. Unrestricted net assets may be
designated for specific purposes by action of the Board of Trustees.
Temporarily Restricted
Net assets where use is limited by law or donor-imposed stipulations that will either expire with the
passage of time or be fulfilled or removed by actions of the University.
Permanently Restricted
Reflects the historical value of contributions (and in certain circumstances investment returns from
those contributions), subject to donor-imposed stipulations, which require the corpus to be invested
in perpetuity to produce income for general or specific purposes.
Revenues are reported as increases in unrestricted net assets unless use of the related assets is
limited by donor-imposed restrictions. Expenses are reported as decreases in unrestricted net
assets. Realized and unrealized gains and losses on investments are reported as increases or
decreases in unrestricted net assets unless their use is restricted by explicit donor stipulation or by
law.
Nonoperating Activity
Nonoperating activity consists primarily of contributions, unfulfilled promises to give, life income
adjustments, realized and unrealized gains and losses on investments, investment income, and
other gains and losses on: postretirement healthcare benefits, sale or disposal of property, foreign
currency translation, the recognition of asset retirement obligations, and debt extinguishment. All
other activity is classified as operating revenue or expense.
To the extent contributions, investment income, and gains are used for operations, they are
reclassified as “nonoperating assets utilized or released from restrictions for operations.”
Expirations of temporary restrictions on net assets or other clarifications from donors are presented
as “net assets reclassified or released from restrictions.”
Boston College Notes to Consolidated Financial Statements May 31, 2018 and 2017
7
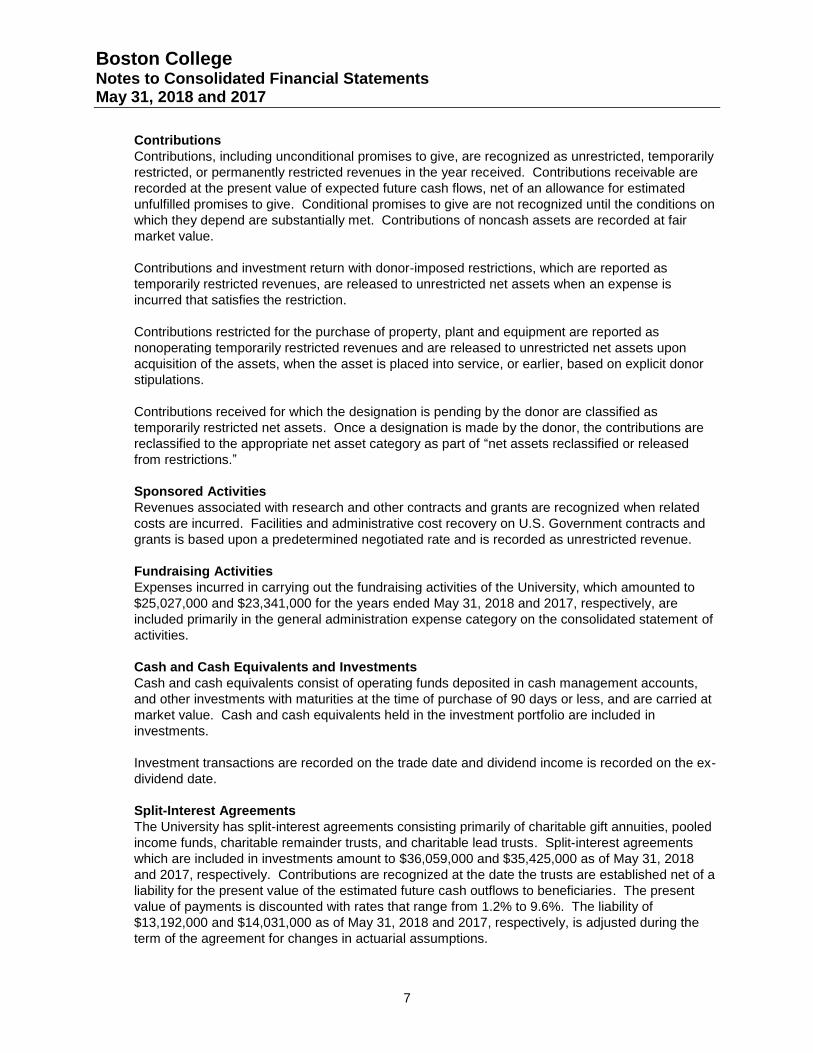
Contributions
Contributions, including unconditional promises to give, are recognized as unrestricted, temporarily
restricted, or permanently restricted revenues in the year received. Contributions receivable are
recorded at the present value of expected future cash flows, net of an allowance for estimated
unfulfilled promises to give. Conditional promises to give are not recognized until the conditions on
which they depend are substantially met. Contributions of noncash assets are recorded at fair
market value.
Contributions and investment return with donor-imposed restrictions, which are reported as
temporarily restricted revenues, are released to unrestricted net assets when an expense is
incurred that satisfies the restriction.
Contributions restricted for the purchase of property, plant and equipment are reported as
nonoperating temporarily restricted revenues and are released to unrestricted net assets upon
acquisition of the assets, when the asset is placed into service, or earlier, based on explicit donor
stipulations.
Contributions received for which the designation is pending by the donor are classified as
temporarily restricted net assets. Once a designation is made by the donor, the contributions are
reclassified to the appropriate net asset category as part of “net assets reclassified or released
from restrictions.”
Sponsored Activities
Revenues associated with research and other contracts and grants are recognized when related
costs are incurred. Facilities and administrative cost recovery on U.S. Government contracts and
grants is based upon a predetermined negotiated rate and is recorded as unrestricted revenue.
Fundraising Activities
Expenses incurred in carrying out the fundraising activities of the University, which amounted to
$25,027,000 and $23,341,000 for the years ended May 31, 2018 and 2017, respectively, are
included primarily in the general administration expense category on the consolidated statement of
activities.
Cash and Cash Equivalents and Investments
Cash and cash equivalents consist of operating funds deposited in cash management accounts,
and other investments with maturities at the time of purchase of 90 days or less, and are carried at
market value. Cash and cash equivalents held in the investment portfolio are included in
investments.
Investment transactions are recorded on the trade date and dividend income is recorded on the ex-
dividend date.
Split-Interest Agreements
The University has split-interest agreements consisting primarily of charitable gift annuities, pooled
income funds, charitable remainder trusts, and charitable lead trusts. Split-interest agreements
which are included in investments amount to $36,059,000 and $35,425,000 as of May 31, 2018
and 2017, respectively. Contributions are recognized at the date the trusts are established net of a
liability for the present value of the estimated future cash outflows to beneficiaries. The present
value of payments is discounted with rates that range from 1.2% to 9.6%. The liability of
$13,192,000 and $14,031,000 as of May 31, 2018 and 2017, respectively, is adjusted during the
term of the agreement for changes in actuarial assumptions.
Boston College Notes to Consolidated Financial Statements May 31, 2018 and 2017
8
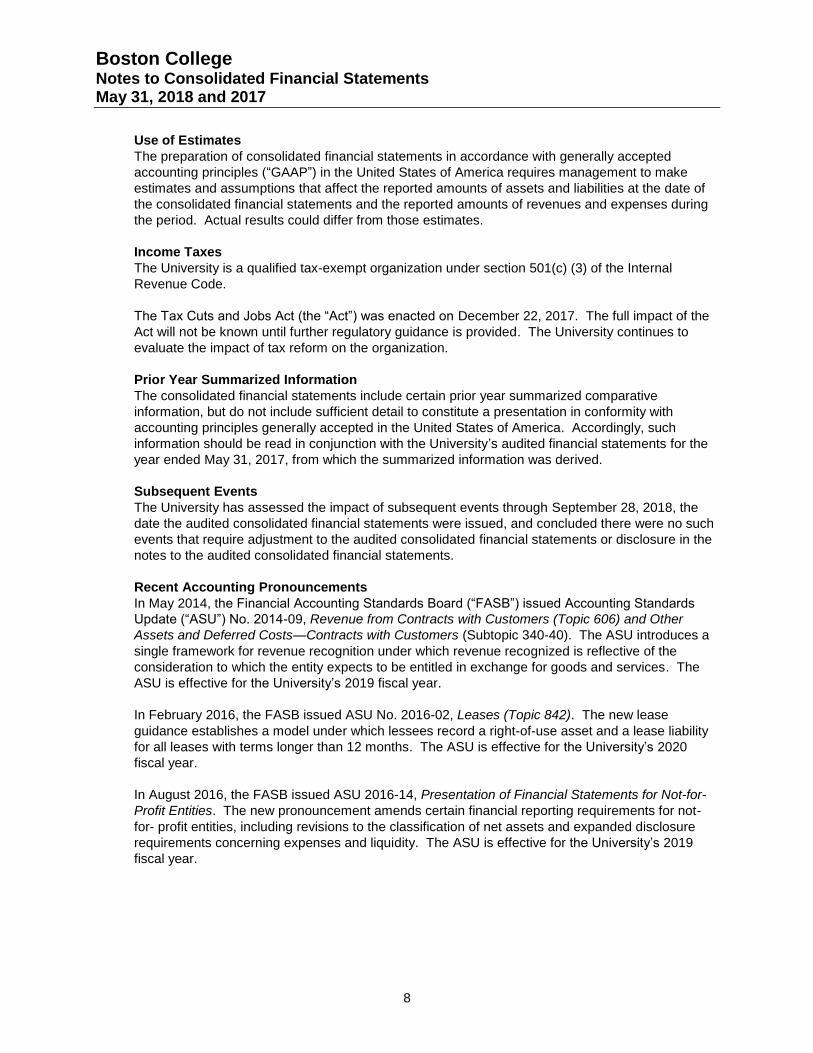
Use of Estimates
The preparation of consolidated financial statements in accordance with generally accepted
accounting principles (“GAAP”) in the United States of America requires management to make
estimates and assumptions that affect the reported amounts of assets and liabilities at the date of
the consolidated financial statements and the reported amounts of revenues and expenses during
the period. Actual results could differ from those estimates.
Income Taxes
The University is a qualified tax-exempt organization under section 501(c) (3) of the Internal
Revenue Code.
The Tax Cuts and Jobs Act (the “Act”) was enacted on December 22, 2017. The full impact of the
Act will not be known until further regulatory guidance is provided. The University continues to
evaluate the impact of tax reform on the organization.
Prior Year Summarized Information
The consolidated financial statements include certain prior year summarized comparative
information, but do not include sufficient detail to constitute a presentation in conformity with
accounting principles generally accepted in the United States of America. Accordingly, such
information should be read in conjunction with the University’s audited financial statements for the
year ended May 31, 2017, from which the summarized information was derived.
Subsequent Events
The University has assessed the impact of subsequent events through September 28, 2018, the
date the audited consolidated financial statements were issued, and concluded there were no such
events that require adjustment to the audited consolidated financial statements or disclosure in the
notes to the audited consolidated financial statements.
Recent Accounting Pronouncements
In May 2014, the Financial Accounting Standards Board (“FASB”) issued Accounting Standards
Update (“ASU”) No. 2014-09, Revenue from Contracts with Customers (Topic 606) and Other
Assets and Deferred Costs—Contracts with Customers (Subtopic 340-40). The ASU introduces a
single framework for revenue recognition under which revenue recognized is reflective of the
consideration to which the entity expects to be entitled in exchange for goods and services. The
ASU is effective for the University’s 2019 fiscal year.
In February 2016, the FASB issued ASU No. 2016-02, Leases (Topic 842). The new lease
guidance establishes a model under which lessees record a right-of-use asset and a lease liability
for all leases with terms longer than 12 months. The ASU is effective for the University’s 2020
fiscal year.
In August 2016, the FASB issued ASU 2016-14, Presentation of Financial Statements for Not-for-
Profit Entities. The new pronouncement amends certain financial reporting requirements for not-
for- profit entities, including revisions to the classification of net assets and expanded disclosure
requirements concerning expenses and liquidity. The ASU is effective for the University’s 2019
fiscal year.
Boston College Notes to Consolidated Financial Statements May 31, 2018 and 2017
9
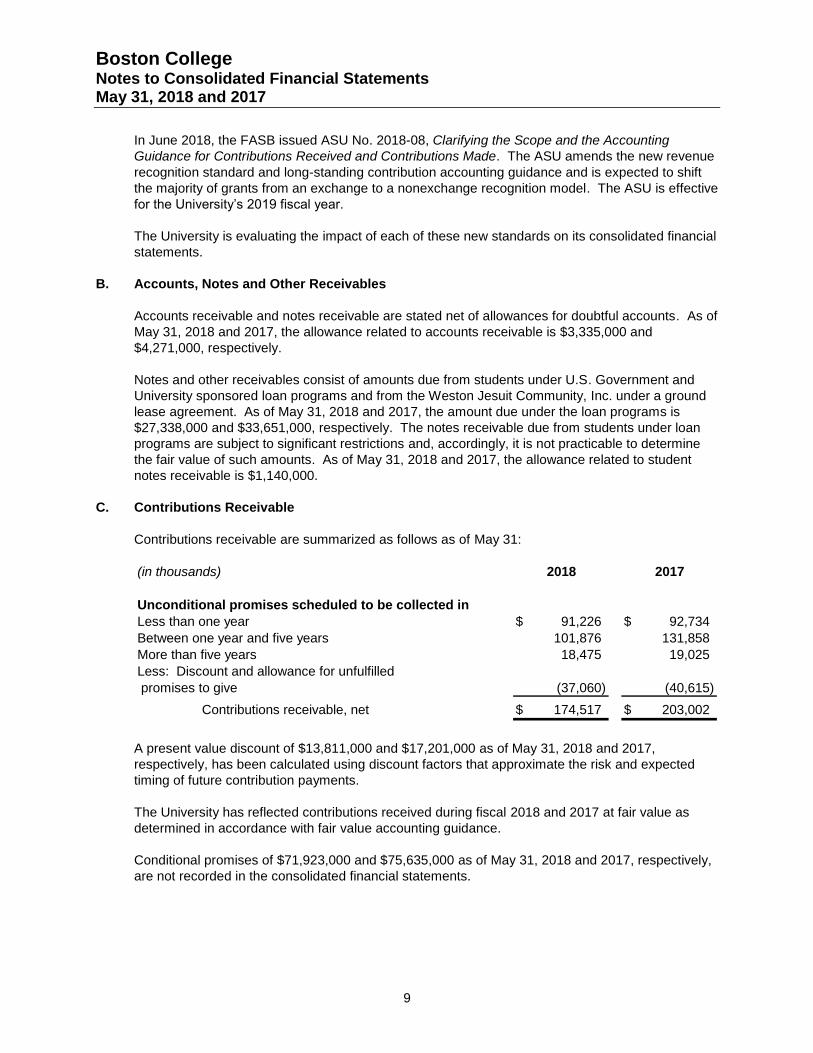
In June 2018, the FASB issued ASU No. 2018-08, Clarifying the Scope and the Accounting
Guidance for Contributions Received and Contributions Made. The ASU amends the new revenue
recognition standard and long-standing contribution accounting guidance and is expected to shift
the majority of grants from an exchange to a nonexchange recognition model. The ASU is effective
for the University’s 2019 fiscal year.
The University is evaluating the impact of each of these new standards on its consolidated financial
statements.
B. Accounts, Notes and Other Receivables
Accounts receivable and notes receivable are stated net of allowances for doubtful accounts. As of
May 31, 2018 and 2017, the allowance related to accounts receivable is $3,335,000 and
$4,271,000, respectively.
Notes and other receivables consist of amounts due from students under U.S. Government and
University sponsored loan programs and from the Weston Jesuit Community, Inc. under a ground
lease agreement. As of May 31, 2018 and 2017, the amount due under the loan programs is
$27,338,000 and $33,651,000, respectively. The notes receivable due from students under loan
programs are subject to significant restrictions and, accordingly, it is not practicable to determine
the fair value of such amounts. As of May 31, 2018 and 2017, the allowance related to student
notes receivable is $1,140,000.
C. Contributions Receivable
Contributions receivable are summarized as follows as of May 31:
(in thousands) 2018 2017
Unconditional promises scheduled to be collected in
Less than one year 91,226$ 92,734$
Between one year and five years 101,876 131,858
More than five years 18,475 19,025
Less: Discount and allowance for unfulfilled
promises to give (37,060) (40,615)
Contributions receivable, net 174,517$ 203,002$
A present value discount of $13,811,000 and $17,201,000 as of May 31, 2018 and 2017,
respectively, has been calculated using discount factors that approximate the risk and expected
timing of future contribution payments.
The University has reflected contributions received during fiscal 2018 and 2017 at fair value as
determined in accordance with fair value accounting guidance.
Conditional promises of $71,923,000 and $75,635,000 as of May 31, 2018 and 2017, respectively,
are not recorded in the consolidated financial statements.
Boston College Notes to Consolidated Financial Statements May 31, 2018 and 2017
10
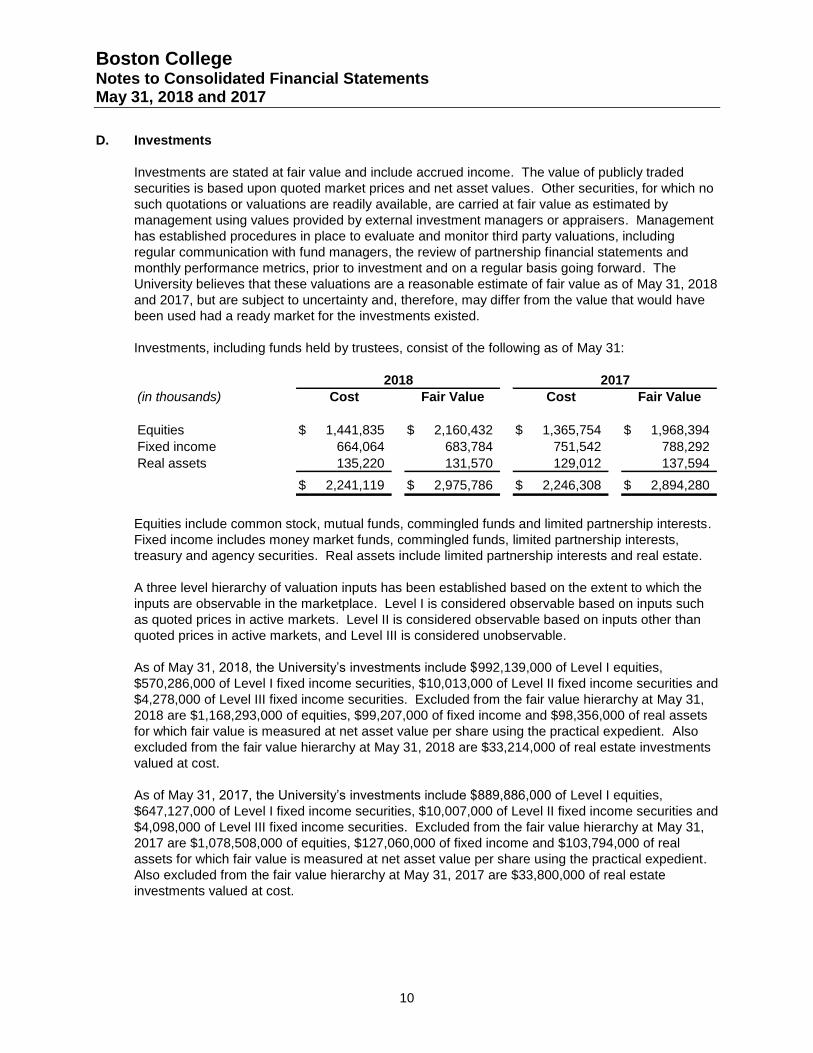
D. Investments
Investments are stated at fair value and include accrued income. The value of publicly traded
securities is based upon quoted market prices and net asset values. Other securities, for which no
such quotations or valuations are readily available, are carried at fair value as estimated by
management using values provided by external investment managers or appraisers. Management
has established procedures in place to evaluate and monitor third party valuations, including
regular communication with fund managers, the review of partnership financial statements and
monthly performance metrics, prior to investment and on a regular basis going forward. The
University believes that these valuations are a reasonable estimate of fair value as of May 31, 2018
and 2017, but are subject to uncertainty and, therefore, may differ from the value that would have
been used had a ready market for the investments existed.
Investments, including funds held by trustees, consist of the following as of May 31:
(in thousands) Cost Fair Value Cost Fair Value
Equities 1,441,835$ 2,160,432$ 1,365,754$ 1,968,394$
Fixed income 664,064 683,784 751,542 788,292
Real assets 135,220 131,570 129,012 137,594
2,241,119$ 2,975,786$ 2,246,308$ 2,894,280$
2018 2017
Equities include common stock, mutual funds, commingled funds and limited partnership interests.
Fixed income includes money market funds, commingled funds, limited partnership interests,
treasury and agency securities. Real assets include limited partnership interests and real estate.
A three level hierarchy of valuation inputs has been established based on the extent to which the
inputs are observable in the marketplace. Level I is considered observable based on inputs such
as quoted prices in active markets. Level II is considered observable based on inputs other than
quoted prices in active markets, and Level III is considered unobservable.
As of May 31, 2018, the University’s investments include $992,139,000 of Level I equities,
$570,286,000 of Level I fixed income securities, $10,013,000 of Level II fixed income securities and
$4,278,000 of Level III fixed income securities. Excluded from the fair value hierarchy at May 31,
2018 are $1,168,293,000 of equities, $99,207,000 of fixed income and $98,356,000 of real assets
for which fair value is measured at net asset value per share using the practical expedient. Also
excluded from the fair value hierarchy at May 31, 2018 are $33,214,000 of real estate investments
valued at cost.
As of May 31, 2017, the University’s investments include $889,886,000 of Level I equities,
$647,127,000 of Level I fixed income securities, $10,007,000 of Level II fixed income securities and
$4,098,000 of Level III fixed income securities. Excluded from the fair value hierarchy at May 31,
2017 are $1,078,508,000 of equities, $127,060,000 of fixed income and $103,794,000 of real
assets for which fair value is measured at net asset value per share using the practical expedient.
Also excluded from the fair value hierarchy at May 31, 2017 are $33,800,000 of real estate
investments valued at cost.
Boston College Notes to Consolidated Financial Statements May 31, 2018 and 2017
11
As of May 31, 2018, $21,768,000, $10,013,000 and $4,278,000 of split interest agreements are
included in Level I, Level II and Level III, respectively. As of May 31, 2017, $21,320,000,
$10,007,000 and $4,098,000 of split interest agreements are included in Level I, Level II and
Level III, respectively.
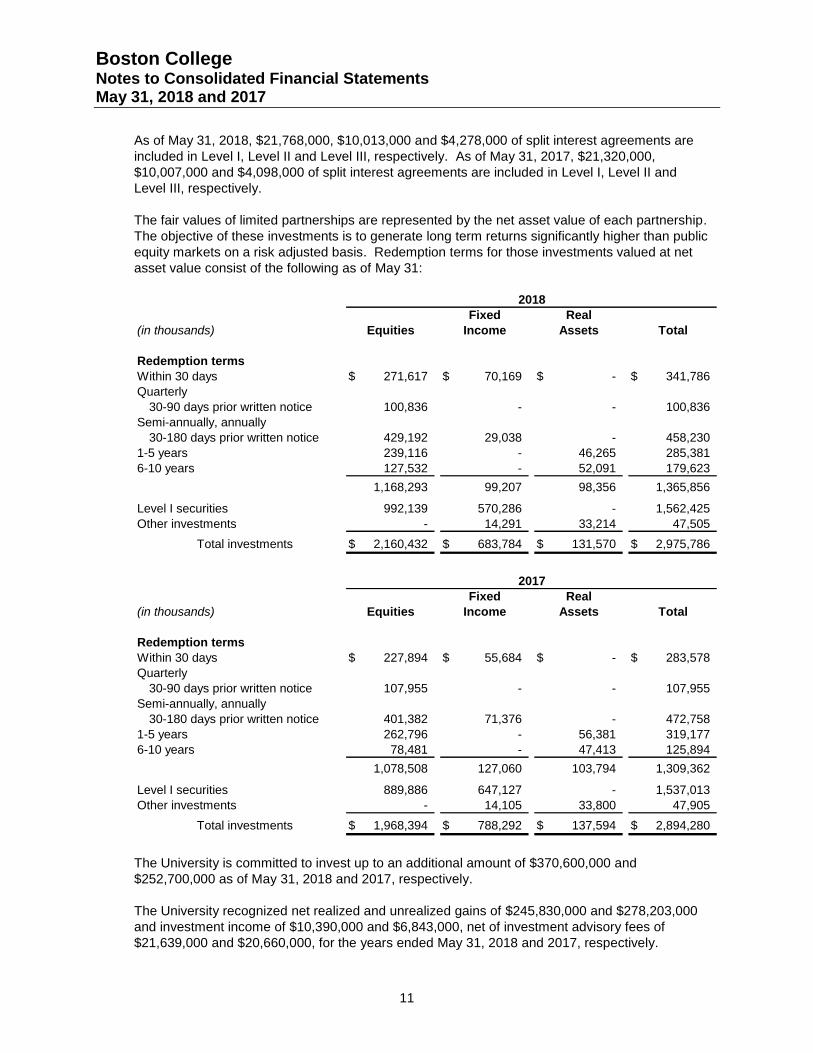
The fair values of limited partnerships are represented by the net asset value of each partnership.
The objective of these investments is to generate long term returns significantly higher than public
equity markets on a risk adjusted basis. Redemption terms for those investments valued at net
asset value consist of the following as of May 31:
Fixed Real
(in thousands) Equities Income Assets Total
Redemption terms
Within 30 days 271,617$ 70,169$ -$ 341,786$
Quarterly
30-90 days prior written notice 100,836 - - 100,836
Semi-annually, annually
30-180 days prior written notice 429,192 29,038 - 458,230
1-5 years 239,116 - 46,265 285,381
6-10 years 127,532 - 52,091 179,623
1,168,293 99,207 98,356 1,365,856
Level I securities 992,139 570,286 - 1,562,425
Other investments - 14,291 33,214 47,505
Total investments 2,160,432$ 683,784$ 131,570$ 2,975,786$
2018
Fixed Real
(in thousands) Equities Income Assets Total
Redemption terms
Within 30 days 227,894$ 55,684$ -$ 283,578$
Quarterly
30-90 days prior written notice 107,955 - - 107,955
Semi-annually, annually
30-180 days prior written notice 401,382 71,376 - 472,758
1-5 years 262,796 - 56,381 319,177
6-10 years 78,481 - 47,413 125,894
1,078,508 127,060 103,794 1,309,362
Level I securities 889,886 647,127 - 1,537,013
Other investments - 14,105 33,800 47,905
Total investments 1,968,394$ 788,292$ 137,594$ 2,894,280$
2017
The University is committed to invest up to an additional amount of $370,600,000 and
$252,700,000 as of May 31, 2018 and 2017, respectively.
The University recognized net realized and unrealized gains of $245,830,000 and $278,203,000
and investment income of $10,390,000 and $6,843,000, net of investment advisory fees of
$21,639,000 and $20,660,000, for the years ended May 31, 2018 and 2017, respectively.
Boston College Notes to Consolidated Financial Statements May 31, 2018 and 2017
12
E. Endowment
The net assets associated with the University’s endowment funds are classified in accordance with
relevant state law as interpreted by the Board of Trustees. These classifications are unrestricted,
temporarily restricted, and permanently restricted based on the existence or absence of donor-
imposed restrictions. Unrestricted net assets include Board-designated funds, and any
accumulated income and appreciation thereon. Temporarily restricted net assets include
contributions not yet designated by donors and accumulated appreciation on temporarily and
permanently restricted funds. Permanently restricted net assets include contributions designated
by donors to be invested in perpetuity to produce income for general or specific purposes.
The long-term performance objective of the endowment portfolio is to attain an average annual
total return that exceeds the University’s spending rate plus inflation within acceptable levels of risk
over a full market cycle. To achieve its long-term rate of return objectives, the University relies on
a total return strategy in which investment returns are achieved through both capital appreciation
and current yield.
The University has a spending policy for its donor restricted endowment, as approved by the
University’s Board of Trustees, that aims to provide a stable and predictable source of funding for
the University’s academic and strategic initiatives and also to protect the real value of the
endowment over time. Under this policy the amount that can be expended for current operations is
a weighted average based on two components; prior year spending adjusted for an inflationary
factor, and 5% of a twelve quarter moving average of market values.
As of May 31, 2018 and 2017, there were no endowment funds with a market value less than
historical value.
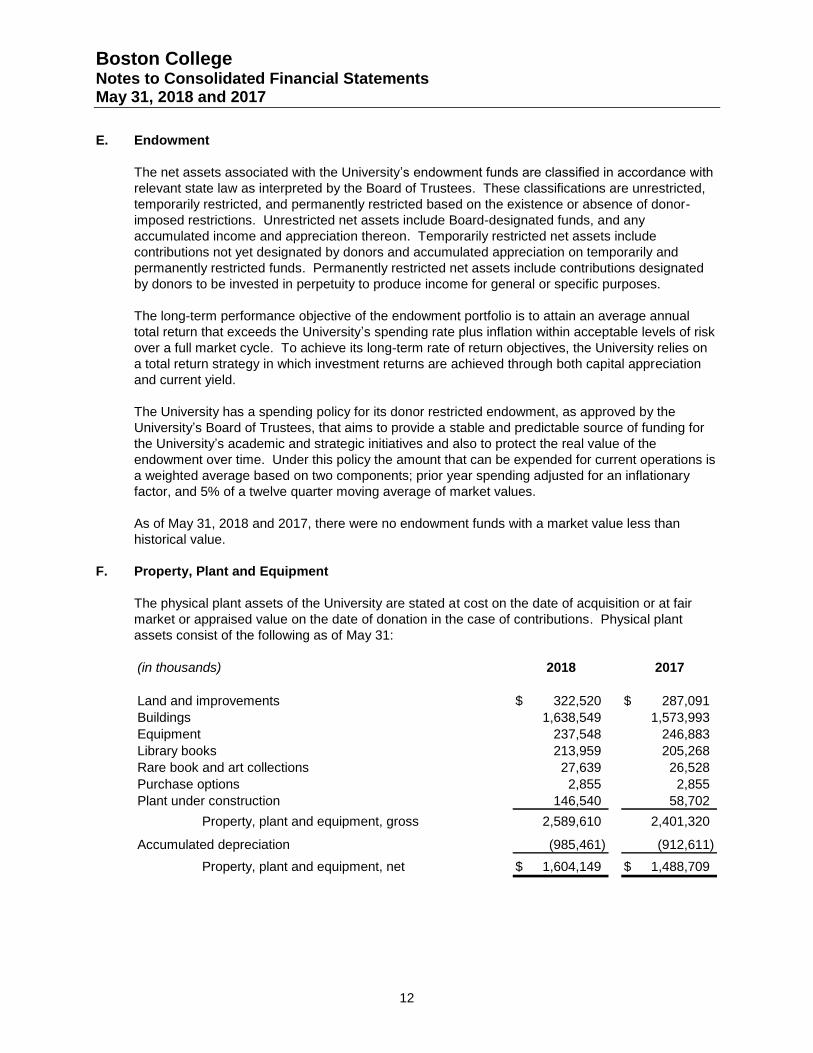
F. Property, Plant and Equipment
The physical plant assets of the University are stated at cost on the date of acquisition or at fair
market or appraised value on the date of donation in the case of contributions. Physical plant
assets consist of the following as of May 31:
(in thousands) 2018 2017
Land and improvements 322,520$ 287,091$
Buildings 1,638,549 1,573,993
Equipment 237,548 246,883
Library books 213,959 205,268
Rare book and art collections 27,639 26,528
Purchase options 2,855 2,855
Plant under construction 146,540 58,702
Property, plant and equipment, gross 2,589,610 2,401,320
Accumulated depreciation (985,461) (912,611)
Property, plant and equipment, net 1,604,149$ 1,488,709$
Boston College Notes to Consolidated Financial Statements May 31, 2018 and 2017
13
Annual provisions for depreciation of physical plant assets are computed on a straight-line basis
over the expected useful lives of the individual assets, averaging 20 years for land improvements,
25-60 years for buildings, 2-15 years for equipment and 10 or 50 years for library books. Rare
book and art collections are reflected at historical cost and are not depreciated. Depreciation for
the years ended May 31, 2018 and 2017 amounted to $97,000,000 and $68,101,000, respectively.
Maintenance and repairs are expensed as incurred, and improvements are capitalized. When
assets are retired or disposed of, the cost and accumulated depreciation thereon are removed from
the accounts, and gains or losses are included in the consolidated statement of activities. The
University retired or disposed of $24,599,000 and $20,528,000 in gross plant assets for the years
ended May 31, 2018 and 2017, respectively.
Property, plant and equipment additions of $25,919,000 and $14,249,000 are included in accrued
liabilities for the years ended May 31, 2018 and 2017, respectively.
The University recognized $658,000 and $821,000 of operating expenses relating to the accretion
of liabilities associated with the retirement of long-lived assets, for the years ended May 31, 2018
and 2017, respectively. Conditional asset retirement obligations of $13,711,000 and $12,991,000
as of May 31, 2018 and 2017, respectively, are included in accrued liabilities.
The University has commitments of $110,734,000 to complete various capital projects as of
May 31, 2018.
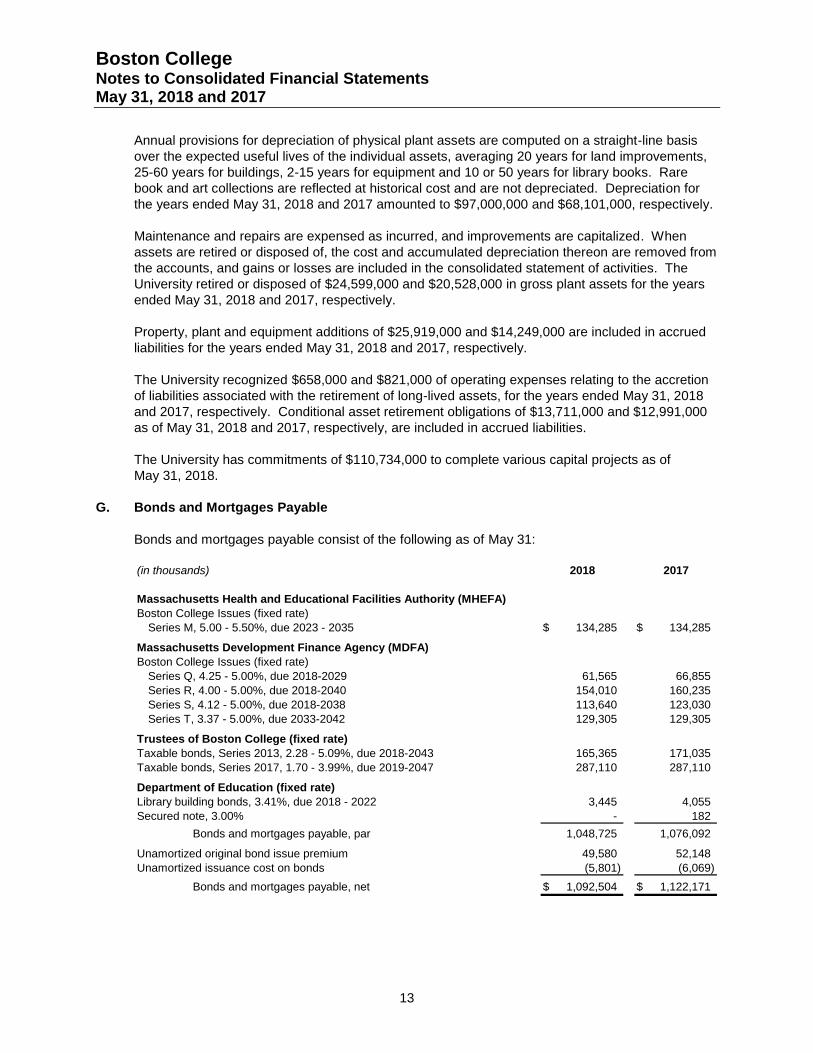
G. Bonds and Mortgages Payable
Bonds and mortgages payable consist of the following as of May 31:
(in thousands) 2018 2017
Massachusetts Health and Educational Facilities Authority (MHEFA)
Boston College Issues (fixed rate)
Series M, 5.00 - 5.50%, due 2023 - 2035 134,285$ 134,285$
Massachusetts Development Finance Agency (MDFA)
Boston College Issues (fixed rate)
Series Q, 4.25 - 5.00%, due 2018-2029 61,565 66,855
Series R, 4.00 - 5.00%, due 2018-2040 154,010 160,235
Series S, 4.12 - 5.00%, due 2018-2038 113,640 123,030
Series T, 3.37 - 5.00%, due 2033-2042 129,305 129,305
Trustees of Boston College (fixed rate)
Taxable bonds, Series 2013, 2.28 - 5.09%, due 2018-2043 165,365 171,035
Taxable bonds, Series 2017, 1.70 - 3.99%, due 2019-2047 287,110 287,110
Department of Education (fixed rate)
Library building bonds, 3.41%, due 2018 - 2022 3,445 4,055
Secured note, 3.00% - 182
Bonds and mortgages payable, par 1,048,725 1,076,092
Unamortized original bond issue premium 49,580 52,148
Unamortized issuance cost on bonds (5,801) (6,069)
Bonds and mortgages payable, net 1,092,504$ 1,122,171$
Boston College Notes to Consolidated Financial Statements May 31, 2018 and 2017
14
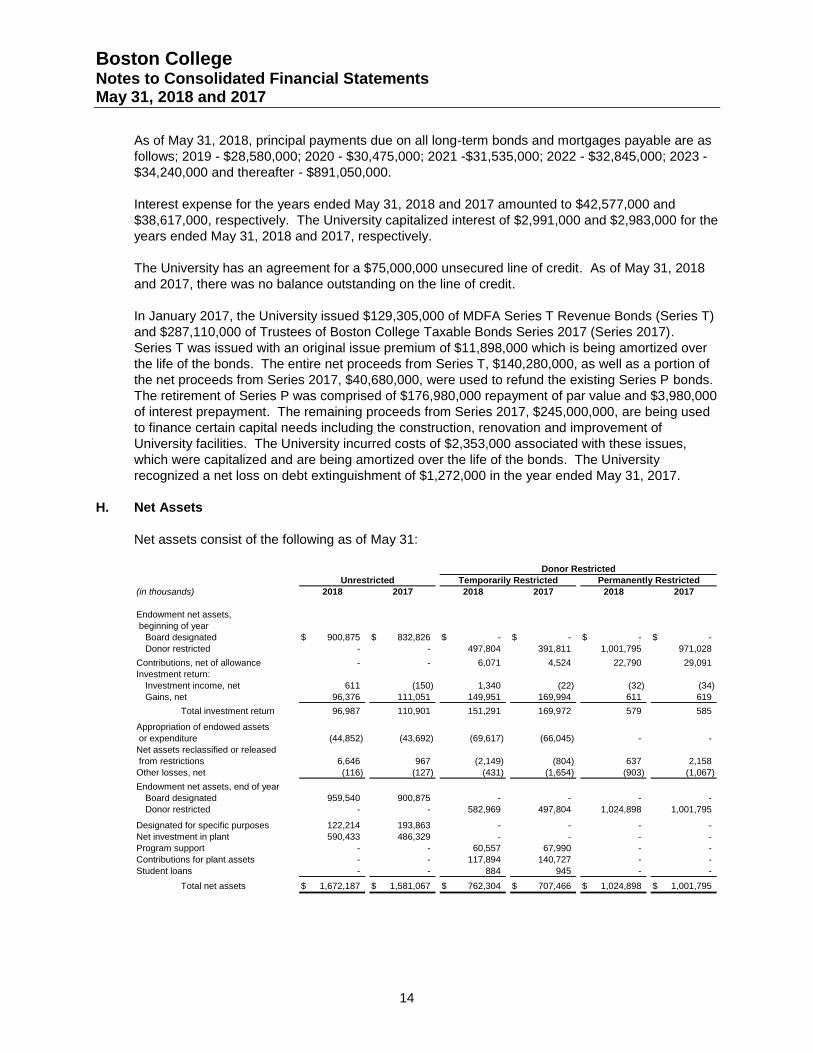
As of May 31, 2018, principal payments due on all long-term bonds and mortgages payable are as
follows; 2019 - $28,580,000; 2020 - $30,475,000; 2021 -$31,535,000; 2022 - $32,845,000; 2023 -
$34,240,000 and thereafter - $891,050,000.
Interest expense for the years ended May 31, 2018 and 2017 amounted to $42,577,000 and
$38,617,000, respectively. The University capitalized interest of $2,991,000 and $2,983,000 for the
years ended May 31, 2018 and 2017, respectively.
The University has an agreement for a $75,000,000 unsecured line of credit. As of May 31, 2018
and 2017, there was no balance outstanding on the line of credit.
In January 2017, the University issued $129,305,000 of MDFA Series T Revenue Bonds (Series T)
and $287,110,000 of Trustees of Boston College Taxable Bonds Series 2017 (Series 2017).
Series T was issued with an original issue premium of $11,898,000 which is being amortized over
the life of the bonds. The entire net proceeds from Series T, $140,280,000, as well as a portion of
the net proceeds from Series 2017, $40,680,000, were used to refund the existing Series P bonds.
The retirement of Series P was comprised of $176,980,000 repayment of par value and $3,980,000
of interest prepayment. The remaining proceeds from Series 2017, $245,000,000, are being used
to finance certain capital needs including the construction, renovation and improvement of
University facilities. The University incurred costs of $2,353,000 associated with these issues,
which were capitalized and are being amortized over the life of the bonds. The University
recognized a net loss on debt extinguishment of $1,272,000 in the year ended May 31, 2017.
H. Net Assets
Net assets consist of the following as of May 31:
(in thousands) 2018 2017 2018 2017 2018 2017
Endowment net assets,
beginning of year
Board designated 900,875$ 832,826$ -$ -$ -$ -$
Donor restricted - - 497,804 391,811 1,001,795 971,028
Contributions, net of allowance - - 6,071 4,524 22,790 29,091
Investment return:
Investment income, net 611 (150) 1,340 (22) (32) (34)
Gains, net 96,376 111,051 149,951 169,994 611 619
Total investment return 96,987 110,901 151,291 169,972 579 585
Appropriation of endowed assets
or expenditure (44,852) (43,692) (69,617) (66,045) - -
Net assets reclassified or released
from restrictions 6,646 967 (2,149) (804) 637 2,158
Other losses, net (116) (127) (431) (1,654) (903) (1,067)
Endowment net assets, end of year
Board designated 959,540 900,875 - - - -
Donor restricted - - 582,969 497,804 1,024,898 1,001,795
Designated for specific purposes 122,214 193,863 - - - -
Net investment in plant 590,433 486,329 - - - -
Program support - - 60,557 67,990 - -
Contributions for plant assets - - 117,894 140,727 - -
Student loans - - 884 945 - -
Total net assets 1,672,187$ 1,581,067$ 762,304$ 707,466$ 1,024,898$ 1,001,795$
Permanently RestrictedTemporarily RestrictedUnrestricted
Donor Restricted
Boston College Notes to Consolidated Financial Statements May 31, 2018 and 2017
15
I. Retirement Programs
All eligible full-time personnel may elect to participate in a defined contribution retirement program.
Under the program, the University makes contributions, currently limited to 8-10% of the annual
wages of participants, up to defined limits. Voluntary contributions by participants are made
subject to IRS limitations. The limitation applicable to University contributions is on a combined
plan basis. For the years ended May 31, 2018 and 2017, the University’s contributions to the
retirement program were $26,802,000 and $26,080,000, respectively.
The University provides certain health care benefits for retired employees through either a defined
benefit retirement medical program or a Retirement Medical Savings Account depending upon
certain age and service requirements. Employees will become eligible for this benefit if they reach
retirement while employed by the University. The plan does not hold assets and is funded as
benefits are paid. The estimated future cost of providing postretirement health care benefits is
recognized on an accrual basis over the period of service during which benefits are earned.
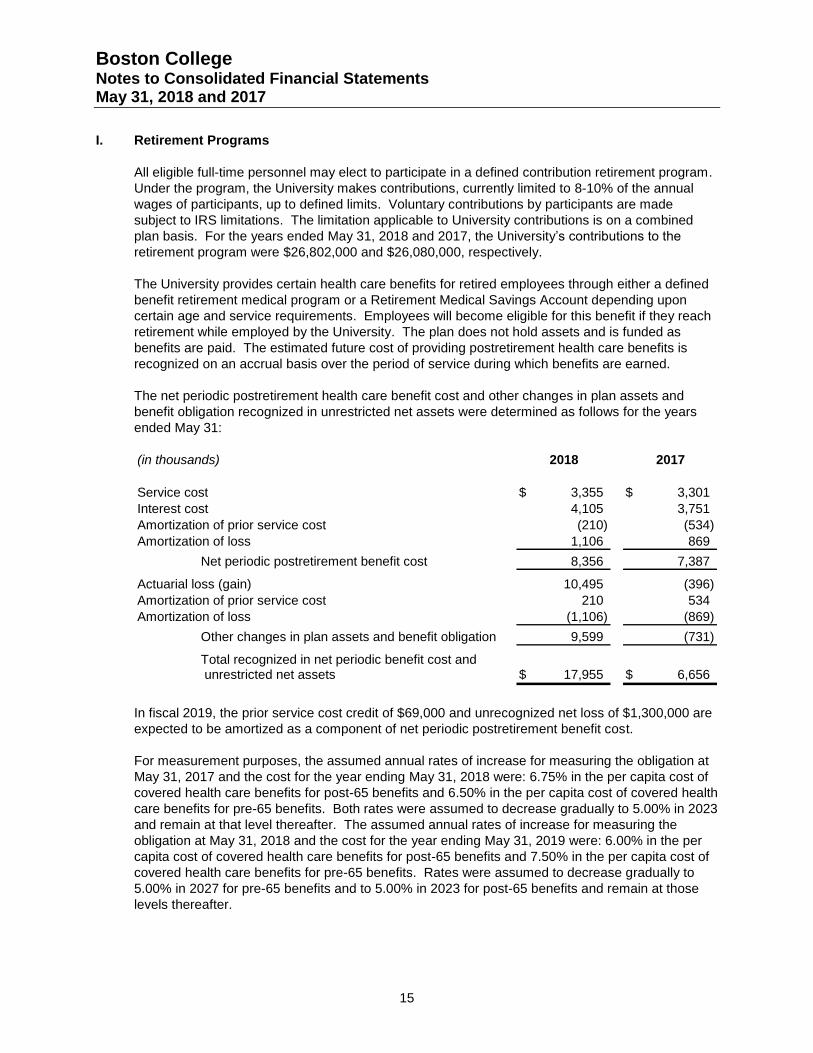
The net periodic postretirement health care benefit cost and other changes in plan assets and
benefit obligation recognized in unrestricted net assets were determined as follows for the years
ended May 31:
(in thousands) 2018 2017
Service cost 3,355$ 3,301$
Interest cost 4,105 3,751
Amortization of prior service cost (210) (534)
Amortization of loss 1,106 869
Net periodic postretirement benefit cost 8,356 7,387
Actuarial loss (gain) 10,495 (396)
Amortization of prior service cost 210 534
Amortization of loss (1,106) (869)
Other changes in plan assets and benefit obligation 9,599 (731)
Total recognized in net periodic benefit cost and unrestricted net assets 17,955$ 6,656$
In fiscal 2019, the prior service cost credit of $69,000 and unrecognized net loss of $1,300,000 are
expected to be amortized as a component of net periodic postretirement benefit cost.
For measurement purposes, the assumed annual rates of increase for measuring the obligation at
May 31, 2017 and the cost for the year ending May 31, 2018 were: 6.75% in the per capita cost of
covered health care benefits for post-65 benefits and 6.50% in the per capita cost of covered health
care benefits for pre-65 benefits. Both rates were assumed to decrease gradually to 5.00% in 2023
and remain at that level thereafter. The assumed annual rates of increase for measuring the
obligation at May 31, 2018 and the cost for the year ending May 31, 2019 were: 6.00% in the per
capita cost of covered health care benefits for post-65 benefits and 7.50% in the per capita cost of
covered health care benefits for pre-65 benefits. Rates were assumed to decrease gradually to
5.00% in 2027 for pre-65 benefits and to 5.00% in 2023 for post-65 benefits and remain at those
levels thereafter.
Boston College Notes to Consolidated Financial Statements May 31, 2018 and 2017
16
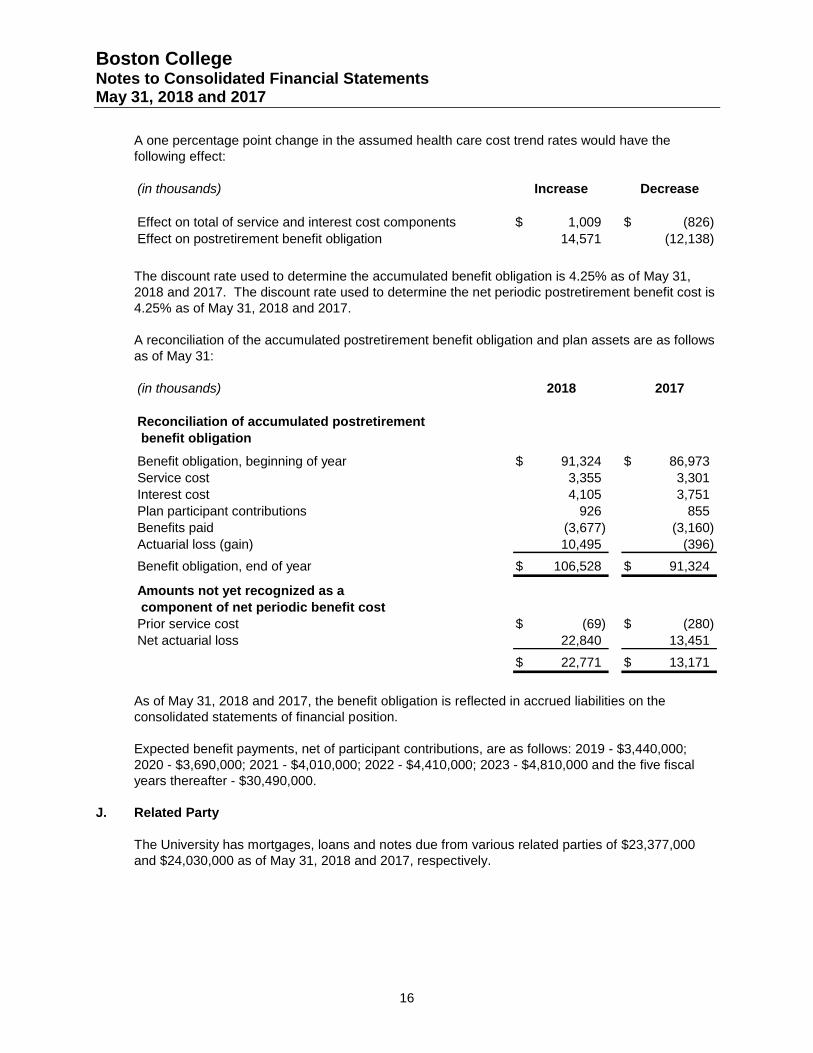
A one percentage point change in the assumed health care cost trend rates would have the
following effect:
(in thousands) Increase Decrease
Effect on total of service and interest cost components 1,009$ (826)$
Effect on postretirement benefit obligation 14,571 (12,138)
The discount rate used to determine the accumulated benefit obligation is 4.25% as of May 31,
2018 and 2017. The discount rate used to determine the net periodic postretirement benefit cost is
4.25% as of May 31, 2018 and 2017.
A reconciliation of the accumulated postretirement benefit obligation and plan assets are as follows
as of May 31:
(in thousands) 2018 2017
Reconciliation of accumulated postretirement
benefit obligation
Benefit obligation, beginning of year 91,324$ 86,973$
Service cost 3,355 3,301
Interest cost 4,105 3,751
Plan participant contributions 926 855
Benefits paid (3,677) (3,160)
Actuarial loss (gain) 10,495 (396)
Benefit obligation, end of year 106,528$ 91,324$
Amounts not yet recognized as a
component of net periodic benefit cost
Prior service cost (69)$ (280)$
Net actuarial loss 22,840 13,451
22,771$ 13,171$
As of May 31, 2018 and 2017, the benefit obligation is reflected in accrued liabilities on the
consolidated statements of financial position.
Expected benefit payments, net of participant contributions, are as follows: 2019 - $3,440,000;
2020 - $3,690,000; 2021 - $4,010,000; 2022 - $4,410,000; 2023 - $4,810,000 and the five fiscal
years thereafter - $30,490,000.
J. Related Party
The University has mortgages, loans and notes due from various related parties of $23,377,000
and $24,030,000 as of May 31, 2018 and 2017, respectively.
Boston College Notes to Consolidated Financial Statements May 31, 2018 and 2017
17
K. Commitments and Contingencies
The University has several legal cases pending that have arisen in the normal course of its
operations. The University believes that the outcome of these cases will have no material adverse
effect on the financial position of the University.