Embed Size (px)
Citation preview

Chapter Six
STATEFINANCES
With significant changes in fiscal federalism anticipatedand new responsibilities devolving from Washington tothe states, the importance of state finances has rarely
been so critical — includes information on statebudgetary procedures and fund management, revenuesand expenditures, state debt, taxes, federal government
grants and payments to states, and federal programspending by state.
For additional information on Chapter Six contactCindy Jasper, at The Council of State Governments,(606) 244-8163 or E-mail: [email protected].

BUDGET
The Council of State Governments 229
Table 6.1STATE BUDGETARY CALENDARS
Agency Governor’s Frequency ofBudget requests Agency budget Legislature Fiscal legislative/
guidelines to submitted hearings sent to adopts year budgetState agencies to governor held legislature budget begins cycles
Alabama .............................. September November January February Feb/May October Annual/AnnualAlaska .................................. July October November December May July Annual/AnnualArizona ............................... June 1 September 1 Nov/Dec January Jan/April July Annual/Annual,.............................................. Biennial (a)Arkansas ............................. March July August Sept/Dec Jan/April July Biennial/BiennialCalifornia ............................ May/Nov September Sept/Nov January 10 June 15 July Annual/Annual
Colorado ............................. June August 1-15 August/Sept November 1 May July Annual/AnnualConnecticut ........................ July September February February May/June (b) July Annual/BiennialDelaware ............................ August Oct/Nov Oct/Nov January June 30 July Annual/AnnualFlorida ................................. June September November January April/May July Annual/AnnualGeorgia ............................... May September Nov/Dec January March July Annual/Annual
Hawaii ................................. July/Aug September November December April July Annual/BiennialIdaho .................................... June September . . . January March July Annual/AnnualIllinois .................................. September Oct/Nov Nov/Dec February May July Annual/AnnualIndiana ................................. May August Sept/Nov January April July Annual/BiennialIowa ..................................... June October 1 Nov/Dec January April/May July Annual/Annual
Kansas ................................. June September November January May July Annual/Annual,.............................................. Biennial (c)Kentucky ............................. July October . . . January April July Biennial/BiennialLouisiana ............................. September November February February June July Annual/AnnualMaine ................................... July September Oct/Dec January June July Biennial/BiennialMaryland ............................ June August 31 Oct/Nov January April July Annual/Annual
Massachusetts.................... August October October January June July Annual/AnnualMichigan ............................. October November December (d) July October Annual/AnnualMinnesota ........................... May/June October 31 Sept/Oct January (e) May July Annual/BiennialMississippi ........................... June August . . . November . . . July Annual/AnnualMissouri .............................. July October . . . January April/May July Annual/Annual,.............................................. Biennial (f)
Montana(g) ......................... Jan 31/August May/Sept 1 May-June/SepOJanaury April July Biennial/Biennial.............................................. Sept-OctNebraska............................. July September Jan/Feb January April July Annual/BiennialNevada ................................ May/June September Sept/Dec January June July Biennial/BiennialNew Hampshire ................. August October November February May July Annual/BiennialNew Jersey......................... July/August October . . . January June July Annual/Annual
New Mexico ....................... July September Sept/Dec January Feb/March July Annual/AnnualNew York ............................ July September Oct/Nov January March April Annual/AnnualNorth Carolina .................. January August Sept/Nov February June July Biennial/BiennialNorth Dakota ..................... March June/July July/Oct December Jan/April July Biennial/BiennialOhio ...................................... July Sept/Oct Oct/Nov February (h) June July Annual/Biennial
Oklahoma ............................ July October Oct/Dec February (i) May (j) July Annual/AnnualOregon ................................ Jan/July September Sept/Nov January Jan/June July Biennial/BiennialPennsylvania ....................... August October Dec/Jan February (k) June July Annual/AnnualRhode Island ....................... July October Nov/Dec February June July Annual/AnnualSouth Carolina ................... August October . . . January June July Annual/Annual
South Dakota ...................... June/July September Sept/Oct December March July Annual/AnnualTennessee............................ August October November January (l) April/May July Annual/AnnualTexas .................................... March July/Nov July/Sept January May September Biennial/BiennialUtah ..................................... July September Oct/Nov December February July Annual/AnnualVermont .............................. September October Nov/Dec January May July Annual/Annual (m)
Virginia ............................... April/August June/Oct Sept/Oct December March/April July Annual/BiennialWashington .......................... April September . . . December April/May July Annual/BiennialWest Virginia ...................... July September Oct/Nov January March July Annual/AnnualWisconsin ............................ June September . . . January June/July July Biennial/BiennialWyoming ............................. May 15 September (n) December March July Annual/Biennial
See footnotes at end of table.

BUDGET
230 The Book of the States 1998-99
STATE BUDGETARY CALENDARS — Continued
Source: National Association of State Budget Officers, Budgetary Processesin the States, 1997.
Key:. . . — Not applicable(a) Agencies are divided into major budget units and other budget units.
Major budget units submit annual budget requests, and other budget unitssubmit biennial budget requests. Beginning with the fiscal 2000-2001 bien-nium, all agencies will be on a biennial budget cycle.
(b) Legislature adopts budget during June of odd years, May of even years.(c) Twenty agencies are on a biennial budget cycle. The rest are on an an-
nual cycle.(d) Within 30 days after legislature convenes in regular session, except when
a newly elected governor is inaugurated when presentation must occur within60 days after legislature convenes.
(e) Fourth Tuesday.(f) There is a constitutional authority to do annual and biennial budgeting.
Beginning in fiscal 1994, the operating budget has been on an annual basiswhile the capital budget has been on a biennial basis.
(g) Montana uses an Executive Planning Process (EPP) for proposals toprovide new services, add FTE, change program services or alter fundingsources. The earlier dates reflect this process which is linked with the regularbudget in the September 1 submittal.
(h) Budget submission delayed to mid-March for new governors.(i) First Monday.(j) Last Friday.(k) Budget is submitted in March when governor has been elected for first
full term.(l) The budget may be submitted by March 1 during the first year of a
governor’s term.(m) State Constitution prescribes a biennial legislature; in practice, legis-
lature meets annually, in regular and adjourned sessions.(n) By November 20.
BUDGET
The Council of State Governments 231
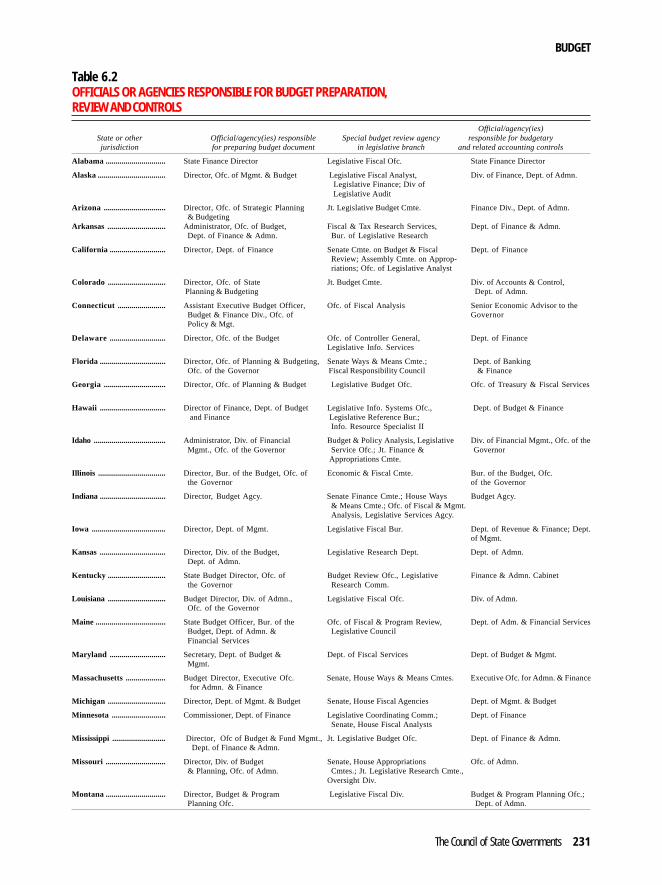
Table 6.2OFFICIALS OR AGENCIES RESPONSIBLE FOR BUDGET PREPARATION,REVIEW AND CONTROLS
Official/agency(ies)State or other Official/agency(ies) responsible Special budget review agency responsible for budgetaryjurisdiction for preparing budget document in legislative branch and related accounting controls
Alabama .............................. State Finance Director Legislative Fiscal Ofc. State Finance Director
Alaska .................................. Director, Ofc. of Mgmt. & Budget Legislative Fiscal Analyst, Div. of Finance, Dept. of Admn............................................... Legislative Finance; Div of.............................................. Legislative Audit
Arizona ............................... Director, Ofc. of Strategic Planning Jt. Legislative Budget Cmte. Finance Div., Dept. of Admn............................................... & BudgetingArkansas ............................. Administrator, Ofc. of Budget, Fiscal & Tax Research Services, Dept. of Finance & Admn............................................... Dept. of Finance & Admn. Bur. of Legislative Research
California ............................ Director, Dept. of Finance Senate Cmte. on Budget & Fiscal Dept. of Finance.............................................. Review; Assembly Cmte. on Approp-.............................................. riations; Ofc. of Legislative Analyst
Colorado ............................. Director, Ofc. of State Jt. Budget Cmte. Div. of Accounts & Control,.............................................. Planning & Budgeting Dept. of Admn.
Connecticut ........................ Assistant Executive Budget Officer, Ofc. of Fiscal Analysis Senior Economic Advisor to the.............................................. Budget & Finance Div., Ofc. of Governor.............................................. Policy & Mgt.
Delaware ............................ Director, Ofc. of the Budget Ofc. of Controller General, Dept. of Finance.............................................. Legislative Info. Services
Florida ................................. Director, Ofc. of Planning & Budgeting, Senate Ways & Means Cmte.; Dept. of Banking.............................................. Ofc. of the Governor Fiscal Responsibility Council & Finance
Georgia ............................... Director, Ofc. of Planning & Budget Legislative Budget Ofc. Ofc. of Treasury & Fiscal Services..............................................
Hawaii ................................. Director of Finance, Dept. of Budget Legislative Info. Systems Ofc., Dept. of Budget & Finance.............................................. and Finance Legislative Reference Bur.;.............................................. Info. Resource Specialist II
Idaho .................................... Administrator, Div. of Financial Budget & Policy Analysis, Legislative Div. of Financial Mgmt., Ofc. of the.............................................. Mgmt., Ofc. of the Governor Service Ofc.; Jt. Finance & AppropriationGovernors&.............................................. Appropriations Cmte.
Illinois .................................. Director, Bur. of the Budget, Ofc. of Economic & Fiscal Cmte. Bur. of the Budget, Ofc............................................... the Governor of the Governor
Indiana ................................. Director, Budget Agcy. Senate Finance Cmte.; House Ways Budget Agcy............................................... & Means Cmte.; Ofc. of Fiscal & Mgmt............................................... Analysis, Legislative Services Agcy.
Iowa ..................................... Director, Dept. of Mgmt. Legislative Fiscal Bur. Dept. of Revenue & Finance; Dept............................................... of Mgmt.
Kansas ................................. Director, Div. of the Budget, Legislative Research Dept. Dept. of Admn............................................... Dept. of Admn.
Kentucky ............................. State Budget Director, Ofc. of Budget Review Ofc., Legislative Finance & Admn. Cabinet.............................................. the Governor Research Comm.
Louisiana ............................. Budget Director, Div. of Admn., Legislative Fiscal Ofc. Div. of Admn............................................... Ofc. of the Governor
Maine ................................... State Budget Officer, Bur. of the Ofc. of Fiscal & Program Review, Dept. of Adm. & Financial Services.............................................. Budget, Dept. of Admn. & Legislative Council.............................................. Financial Services
Maryland ............................ Secretary, Dept. of Budget & Dept. of Fiscal Services Dept. of Budget & Mgmt............................................... Mgmt.
Massachusetts.................... Budget Director, Executive Ofc. Senate, House Ways & Means Cmtes. Executive Ofc. for Admn. & Finance.............................................. for Admn. & Finance
Michigan ............................. Director, Dept. of Mgmt. & Budget Senate, House Fiscal Agencies Dept. of Mgmt. & Budget
Minnesota ........................... Commissioner, Dept. of Finance Legislative Coordinating Comm.; Dept. of Finance.............................................. Senate, House Fiscal Analysts
Mississippi ........................... Director, Ofc of Budget & Fund Mgmt., Jt. Legislative Budget Ofc. Dept. of Finance & Admn............................................... Dept. of Finance & Admn.
Missouri .............................. Director, Div. of Budget Senate, House Appropriations Ofc. of Admn............................................... & Planning, Ofc. of Admn. Cmtes.; Jt. Legislative Research Cmte., Cmte Legislative Research Center.............................................. Oversight Div.
Montana .............................. Director, Budget & Program Legislative Fiscal Div. Budget & Program Planning Ofc.;.............................................. Planning Ofc. Dept. of Admn.
BUDGET
232 The Book of the States 1998-99
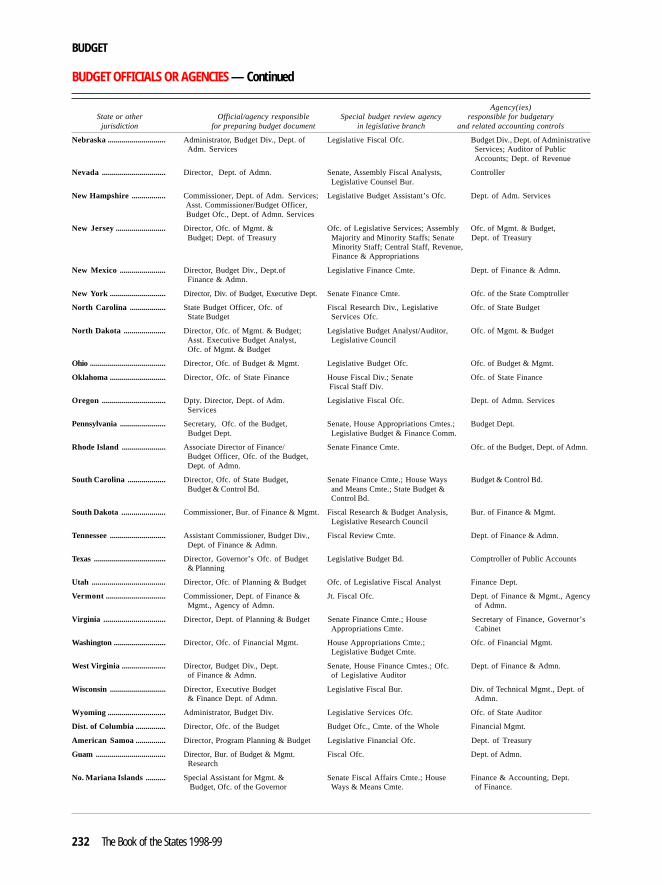
BUDGET OFFICIALS OR AGENCIES — Continued
Agency(ies)State or other Official/agency responsible Special budget review agency responsible for budgetary
jurisdiction for preparing budget document in legislative branch and related accounting controls
Nebraska............................. Administrator, Budget Div., Dept. of Legislative Fiscal Ofc. Budget Div., Dept. of Administrative.............................................. Adm. Services Services; Auditor of Public.............................................. Accounts; Dept. of Revenue
Nevada ................................ Director, Dept. of Admn. Senate, Assembly Fiscal Analysts, Controller.............................................. Legislative Counsel Bur.
New Hampshire ................. Commissioner, Dept. of Adm. Services; Legislative Budget Assistant’s Ofc. Dept. of Adm. Services.............................................. Asst. Commissioner/Budget Officer,.............................................. Budget Ofc., Dept. of Admn. Services
New Jersey......................... Director, Ofc. of Mgmt. & Ofc. of Legislative Services; Assembly Ofc. of Mgmt. & Budget,.............................................. Budget; Dept. of Treasury Majority and Minority Staffs; Senate Dept. of Treasury.............................................. Minority Staff; Central Staff, Revenue, Finance & Appropriations.............................................. Finance & Appropriations
New Mexico ....................... Director, Budget Div., Dept.of Legislative Finance Cmte. Dept. of Finance & Admn............................................... Finance & Admn.
New York ............................ Director, Div. of Budget, Executive Dept.Senate Finance Cmte. Ofc. of the State Comptroller
North Carolina .................. State Budget Officer, Ofc. of Fiscal Research Div., Legislative Ofc. of State Budget.............................................. State Budget Services Ofc.
North Dakota ..................... Director, Ofc. of Mgmt. & Budget; Legislative Budget Analyst/Auditor, Ofc. of Mgmt. & Budget.............................................. Asst. Executive Budget Analyst, Legislative Council.............................................. Ofc. of Mgmt. & Budget
Ohio ...................................... Director, Ofc. of Budget & Mgmt. Legislative Budget Ofc. Ofc. of Budget & Mgmt.
Oklahoma ............................ Director, Ofc. of State Finance House Fiscal Div.; Senate Ofc. of State Finance.............................................. Fiscal Staff Div.
Oregon ................................ Dpty. Director, Dept. of Adm. Legislative Fiscal Ofc. Dept. of Admn. Services.............................................. Services
Pennsylvania ....................... Secretary, Ofc. of the Budget, Senate, House Appropriations Cmtes.; Budget Dept............................................... Budget Dept. Legislative Budget & Finance Comm.
Rhode Island ...................... Associate Director of Finance/ Senate Finance Cmte. Ofc. of the Budget, Dept. of Admn............................................... Budget Officer, Ofc. of the Budget,.............................................. Dept. of Admn.
South Carolina ................... Director, Ofc. of State Budget, Senate Finance Cmte.; House Ways Budget & Control Bd............................................... Budget & Control Bd. and Means Cmte.; State Budget &.............................................. Control Bd.
South Dakota ...................... Commissioner, Bur. of Finance & Mgmt. Fiscal Research & Budget Analysis, Bur. of Finance & Mgmt............................................... Legislative Research Council
Tennessee............................ Assistant Commissioner, Budget Div., Fiscal Review Cmte. Dept. of Finance & Admn............................................... Dept. of Finance & Admn.
Texas .................................... Director, Governor’s Ofc. of Budget Legislative Budget Bd. Comptroller of Public Accounts.............................................. & Planning
Utah ..................................... Director, Ofc. of Planning & Budget Ofc. of Legislative Fiscal Analyst Finance Dept.
Vermont .............................. Commissioner, Dept. of Finance & Jt. Fiscal Ofc. Dept. of Finance & Mgmt., Agency.............................................. Mgmt., Agency of Admn. of Admn.
Virginia ............................... Director, Dept. of Planning & Budget Senate Finance Cmte.; House Secretary of Finance, Governor’s.............................................. Appropriations Cmte. Cabinet
Washington .......................... Director, Ofc. of Financial Mgmt. House Appropriations Cmte.; Ofc. of Financial Mgmt............................................... Legislative Budget Cmte.
West Virginia ...................... Director, Budget Div., Dept. Senate, House Finance Cmtes.; Ofc. Dept. of Finance & Admn............................................... of Finance & Admn. of Legislative Auditor
Wisconsin ............................ Director, Executive Budget Legislative Fiscal Bur. Div. of Technical Mgmt., Dept. of.............................................. & Finance Dept. of Admn. Admn.
Wyoming ............................. Administrator, Budget Div. Legislative Services Ofc. Ofc. of State Auditor
Dist. of Columbia ............... Director, Ofc. of the Budget Budget Ofc., Cmte. of the Whole Financial Mgmt.
American Samoa............... Director, Program Planning & Budget Legislative Financial Ofc. Dept. of Treasury
Guam ................................... Director, Bur. of Budget & Mgmt. ResearchFiscal Ofc. Dept. of Admn.Dept. of Admn. Dept.............................................. Researcho
No. Mariana Islands .......... Special Assistant for Mgmt. & Senate Fiscal Affairs Cmte.; House Finance & Accounting, Dept............................................... Budget, Ofc. of the Governor Ways & Means Cmte. of Finance.
f Admn. Dept

BUDGET
The Council of State Governments 233
Agency(ies)State or other Official/agency responsible Special budget review agency responsible for budgetaryjurisdiction for preparing budget document in legislative branch and related accounting controls
Puerto Rico ........................ Director, Ofc. of Budget & Mgmt. Ofc. of Legislative Services Ofc. of Budget & Mgmt.
U.S. Virgin Islands ............. Director, Ofc. of Mgmt. & Budget Post Audit Div. Dept. of Finance
BUDGET OFFICIALS OR AGENCIES — Continued
Sources: The Council of State Governments, State Legislative Leadership,Committees and Staff: 1997 and State Administrative Officials Classifiedby Function: 1997.

234The Book of the States 1998-99
BUDGETS
Table 6.3STATE BALANCED BUDGETS: CONSTITUTIONAL AND STATUTORY PROVISIONS,GUBERNATORIAL AND LEGISLATIVE AUTHORITY
Constitutional and Statutory Provisions Gubernatorial Authority Legislative Authority
Governor Legislature Governor Can reduce Votes requiredmust submit a must pass a must sign a Governor budget without Restrictions to override Votes required Votes required
State or other balanced balanced balanced May carry has line legislative on budget gubernatorial to pass revenue to passjurisdiction budget budget budget over deficit item veto approval reductions veto increase budget
Alabama .............................. C,S S . . . . . . (a) ★ ATB Majority elected Majority MajorityAlaska .................................. S S S . . . ★ . . . . . . 3/4 elected (b) Majority MajorityArizona ............................... C,S C,S C,S (c) ★ (c) ★ . . . . . . 2/3 elected 2/3 elected MajorityArkansas ............................. S S S . . . ★ (d) ATB Majority elected 3/4 elected MajorityCalifornia ............................ C . . . . . . ★ ★ . . . . . . 2/3 elected 2/3 elected 2/3 elected
Colorado ............................. C C C . . . ★ ★ . . . 2/3 elected Majority (e) MajorityConnecticut ........................ S C,S C . . . ★ ★ MR 2/3 elected Majority Majority (f)Delaware ............................ C,S C,S C,S . . . ★ (. . .h ★ 3/5 elected 3/5 elected MajorityFlorida ................................. C,S C,S C,S . . . ★ (i) ★ (g) MR 2/3 elected 2/3 elected MajorityGeorgia ............................... C C C . . . ★ ★ (h) 2/3 elected Majority Majority
Hawaii ................................. C,S . . . C,S . . . ★ (j) ★ (i) . . . 2/3 elected Majority (j) Majority electedIdaho .................................... . . . (l) C (k) . . . . . . ★ ( m★ (l) (m) ★ (l) 2/3 elected Majority MajorityIllinois .................................. C,S C . . . . . . ★ (m) . . . . . . Majority 3/5 (n) Majority Majority 3/5 (n)Indiana ................................. . . . . . . . . . . . . . . . ★ . . . Majority Majority MajorityIowa ..................................... C,S S . . . . . . ★ ★ ATB 2/3 elected Majority Majority
Kansas ................................. S C,S . . . . . . ★ . . . ATB 2/3 elected Majority MajorityKentucky ............................. C,S C,S C,S . . . ★ . . . . . . Majority 2/5 elected MajorityLouisiana ............................. C,S C,S C,S ★ ★ ★ MR 2/3 elected 2/3 elected MajorityMaine ................................... C,S C C,S . . . ★ . . . ATB( 2/3 elected Majority MajorityMaryland ............................ C C (o) ★ . . . ★(p) ★(q) (r) Majority Majority
Massachusetts.................... C,S C,S C,S . . . ★ ★ . . . 2/3 present Majority Majority (s)Michigan ............................. C,S C C,S ★ ★ . . . (t) 2/3 elected Majority MajorityMinnesota ........................... S S C,S . . . ★ ★ MR 2/3 elected Majority MajorityMississippi ........................... S S . . . . . . ★ ★ ATB( 2/3 elected 3/5 MajorityMissouri .............................. C . . . C . . . ★ ★ . . . 2/3 elected Majority Majority
Montana .............................. S C . . . . . . ★ ★ MR(u) 2/3 elected Majority MajorityNebraska............................. C S . . . . . . ★ . . . ★ 3/5 elected Majority 3/5 electedNevada ................................ S C C . . . . . . ★ MR 2/3 elected Majority MajorityNew Hampshire ................. S . . . . . . . . . . . . . . . . . . 2/3 elected Majority MajorityNew Jersey......................... C C C . . . ★ ★ . . . 2/3 elected Majority Majority
New Mexico ....................... C C C . . . ★ . . . . . . 2/3 elected Majority MajorityNew York ............................ C . . . (v) . . . ★ (w) (x) ★ (x) (x) 2/3 elected (y) Majority 2/3 electedNorth Carolina .................. C,S S . . . . . . . . . (y) ★ (z) . . . 3/5 present Majority MajorityNorth Dakota ..................... C C C . . . ★ ★ ATB 2/3 elected Majority MajorityOhio ...................................... C C C . . . (aa) ★ (aa) ★ ★ 3/5 elected Majority Majority
Oklahoma ............................ S C (bb) C (bb) . . . ★ (cc) ★ (cc) ★ 2/3 elected 3/4 elected 3/4 electedOregon ................................ C C C ★ ★ ★ MR 2/3 present 2/3 elected MajorityPennsylvania ....................... C,S . . . C,S . . . ★ (ee) ★ (dd) . . . 2/3 elected Majority elected Majority electedRhode Island ....................... C C S . . . . . . ★ ★ 3/5 present Majority 2/3 electedSouth Carolina ................... C C C . . . ★ (ff) ★ (ee) ★ 2/3 elected Majority Majority

The Council of State Governments
235
BUDGETS
STATE BALANCED BUDGETS — Continued
Constitutional and Statutory Provisions Gubernatorial Authority Legislative Authority
Governor Legislature Governor Can reduce Votes requiredmust submit a must pass a must sign a Governor budget without Restrictions to override Votes required Votes required
State or other balanced balanced balanced May carry has line legislative on budget gubernatorial to pass revenue to passjurisdiction budget budget budget over deficit item veto approval reductions veto increase budget
South Dakota ...................... C C C ★ ★ . . . . . . 2/3 elected 2/3 elected MajorityTennessee............................ C C C . . . ★ ★ . . . Majority Majority MajorityTexas .................................... . . . C,S C . . . ★ ★ . . . 2/3 present Majority MajorityUtah ..................................... S C,S (ff) . . . ★ ★ (gg) ATB (gg) 2/3 elected Majority MajorityVermont .............................. . . . . . . . . . ★ . . . ★ (hh) ★ ★ (hh) 2/3 present Majority Majority
Virginia ............................... (ii) . . . . . . . . . ★(jj) ★ (jj) MR (kk) 2/3 present (ll) Majority (ll) MajorityWashington .......................... S . . . . . . . . . ★ ★ ATB 2/3 present Majority MajorityWest Virginia ...................... . . . C C . . . ★ (ll ) ★ (mm) ★ (mm) 2/3 elected Majority MajorityWisconsin ............................ C C C,S ★ ★ ) ★ (nn) . . . 2/3 present Majority MajorityWyoming ............................. C C . . . . . . ★ ★ . . . 2/3 elected Majority Majority
Puerto Rico ........................ C C C . . . ★ ★ . . . 2/3 elected Majority Majority
Sources: National Association of State Budget Officers, Budgetary Processes in the States, 1997 updatedFebruary 1998 by The Council of State Governments. Update reflects literal reading of state constitutions andstatutes.
Key:C — ConstitutionalS — StatutoryATB — Across the boardMR — Maximum reduction dictated★ — Yes. . . — No(a) The governor may return a bill without limit for recommended amendments for amount and language,
as long as the legislature is still in session.(b) Joint session.(c) The legislature may provide for levying a tax for the ensuing fiscal year sufficient, with other sources of
income, to pay the deficiency.(d) The governor and chief fiscal officer of the state have the authority to reduce general revenue funding
to agencies should shortfalls occur in revenue collections.(e) All tax increases must be approved by a vote of the people.(f) Must have quorum.(g) The elected cabinet (Administrative Commission) for the Executive Branch and the Chief Justice of the
Supreme Court for the Judicial Branch are authorized to resolve deficits under $300 million. Deficits over $300million shall be resolved by the legislature.
(h) The governor, during the first six months of a fiscal year in which the current revenue estimate on whichappropriations are based is expected to exceed acutal revenues, is authorized to require state agencies toreserve such appropriations as specified by the governor for budget reductions to be recommended to thegeneral assembly at its next regular session.
(i) The governor’s authority to reduce, expand or reorganize budgets can be done only pursuant to existingstatutes.
(j) If general fund expenditure ceiling is exceeded, two-thirds vote required; otherwise majority of electedmembers.
(k) Although the constitution requires that the legislature pass a balanced budget, there have been yearswhen they over-appropriated the revenue estimate. The governor, as the chief budget officer of the state, hasalways insured that expenditures do not exceed revenues.
(l) The governor’s authority to reduce budgets is temporary. The State Board of Examiners (Governor, Attor-ney General and Secretary of State) have permanent appropriation reduction authority.
(m) The governor can veto appropriation items entirely (Item Veto) or merely reduce an item of appropria-tion to a lesser amount (Reduction Veto). If the governor reduces an item of appropriation, the remaining itemsin the bill are not affected and can become law immediately.
(n) If the governor vetoes a bill or an item of appropriation entirely, the legislature can override him with athree-fifths vote in each house. If the governor amendatorily vetoes language or reduces an item of appropria-tion, the legislature can accept the amendatory changes or restore the item or appropriation to its original amountwith a majority vote in each house. Appropriations require a majority vote in each house if passed prior tomidnight on June 30th of each year and require a three-fifths vote in each house if passed after that point.
(o) The budget bill when and as passed by both houses, shall be a law immediately without further action bythe governor.
(p) With the approval of the Board of Public Works, the governor may reduce by not more than 25 percentany appropriation that the governor considers unnecessary.
(q) The governor may not, however, reduce an appropriation to the legislative or judicial branches ofgovernment; for the payment of principal and interest on state debt; the funding for public schools (K-12); orthe salary of a public officer during the term of office.
(r) Governor has no veto power over the budget bill.(s) For capital budget, two-thirds votes required.(t) There are both statutory and constitutional restrictions on executive branch authority to make budget
reductions, involving approval by both House and Senate appropriations committees.(u) Additional restrictions on budget reductions exclude principle and interest on state debt, legislative and
judicial branches, school equalization aid and salaries of elected officials.(v) The governor is not technically required to sign a balanced budget, but the governor, legislative leaders
and the comptroller must certify the budget is in balance in order to meet borrowing requirements.(w) Any appropriation added to the governor’s budget by the legislature is subject to line item veto.(x) May reduce budget without approval only for state operations; only restriction on reductions is that
reductions in aid to localities cannot be made without legislative approval.(y) The governor has no veto power over the budget bill, except for appropriations for the legislature and
judiciary and items added to the governor’s original budget proposal. In these cases, 2/3 of elected membersin each chamber can vote to override the gubernatorial veto.
(z) Except for certain block grants.

236The Book of the States 1998-99
BUDGETS
STATE BALANCED BUDGETS — Continued
(aa) Line item veto in appropriation act only.(bb) Legislature could pass and the governor could sign a budget where appropriations exceed cash and
estimated revenues, but consitutional and statutory provisions reduce the appropriations so that the budget isbalanced.
(cc) Would require agreement of agency governing boards and or CEO.(dd) The governor may reduce budgets selectively; he must provide 10 days prior notice and the reasons for
so doing before lapsing current year grant and subsidy money.(ee) The Budget and Control Board can authorize an across-the-board agency reduction when there is a
revenue shortfall. When in session, the General Assembly has five statewide session days to take action toprevent the reduction.
(ff) Governor may allow balanced budget to go into law without signature.(gg) Some restrictions, i.e. cannot cut debt services.
(hh) Reductions based on revenue shortfalls of greater than 1 percent require legislative approval.(ii) Requirement applies only to budget execution. The governor is required to insure that actual expenditures
do not exceed actual revenues.(jj) Governor may return bill without limit for recommended amendments for amount and language. For
purposes of a veto, a line item is defined as an indivisible sum of money that may or may not coincide with theway in which items are displayed in an appropriation act.
(kk) The governor has power to withhold allotments of appropriations, but cannot reduce legislative appropriations.(ll) Two-thirds of members present includes a majority of the members elected. The revenue stabilization
fund was approved by voters in November of 1992.(mm) The governor can reduce expenditures but not appropriations. Public education has priority.(nn) Cannot reduce appropriations, but can withhold allotments.

BUDGET
The Council of State Governments 237
Table 6.4REVENUE ESTIMATING PRACTICES
Primaryauthority Estimates
State or other for revenue bind the Frequency of Multi-yearjurisdiction estimate budget estimates updates forecasting Economic Advisory Boards
Alabama .......................... C ★ As necessary CY + 1 (a)Alaska .............................. E . . . Semi-annual CY + 20 . . .Arizona ........................... C ★ Quarterly CY + 2 . . .Arkansas ......................... E ★ Quarterly CY + 2 Council of Economic AdvisorsCalifornia ........................ E . . . Semi-annual CY + 1 Dept. of Finance Annual Review Conference
Colorado ......................... L . . . Quarterly CY + 5 Governor’s Revenue Estimating Advisory GroupConnecticut .................... E ★ Monthly CY + 4 . . .Delaware ........................ C (b) ★ (b) Bi-monthly CY + 4 Economic and Financial Advisory CouncilFlorida ............................. C ★ Semi-annual, or as needed CY + 1 or 9 . . .Georgia ........................... E ★ As needed CY + 1 House and Senate Appropriations Committees
Hawaii ............................. I (c) . . . Quarterly CY + 6 Council on RevenuesIdaho ................................ E . . . Semi-annual CY + 1 . . .Illinois .............................. E ★ Quarterly CY + 1 Legislature’s Economic and Fiscal CommissionIndiana ............................. C . . . Annual FY + 2 Economic Forecast Committee; Revenue Technical.......................................... Forecast CommitteeIowa ................................. C ★ Quarterly CY + 1 Economic Forecasting Council
Kansas ............................. C ★ Semi-annual CY + 1 Consensus Revenue Estimating GroupKentucky ......................... C ★ Biennial, or as CY + 2 Consensus Forecasting Groupconsencus forecasting.......................................... neededLouisiana ......................... C ★ Quarterly CY + 4 Revenue Estimating Conference; Economic Estimating.......................................... ConferenceMaine ............................... C ★ Semi-annual CY + 2 Consensus Economic Forecasting CommissionMaryland ........................ (d) . . . Semi-annual, or as needed CY + 5 Business Advisory Panel
Massachusetts*.............. E ★ Semi-annual CY + 2 . . .Michigan ......................... C . . . Semi-annual CY + 1 Governor’s Council of Economic AdvisorsMinnesota ....................... E ★ Semi-annual CY + 4 or 5 Council of Economic AdvisorsMississippi* ..................... C ★ Semi-annual CY + 10 (e) . . .Missouri .......................... E ★ Semi-annual CY + 4 . . .
Montana .......................... L (f) . . . As necessary CY + 4 . . .Nebraska......................... C ★ Semi-annual CY + 2 Economic Forecasting Advisory BoardNevada ............................ I ★ As necessary CY + 2 Economic ForumNew Hampshire ............. L ★ Quarterly CY + 6 . . .New Jersey..................... E ★ Semi-annual CY + 1 State Revenue and Forecasting Advisory Commission
New Mexico ................... C . . . Semi-annual CY + 1 . . .New York ........................ C (g) ★ Annually (h) CY + 2 . . .North Carolina .............. L ★ Quarterly CY + 4North Dakota ................. E ★ Semi-annual CY + 2 Advisory Council on Revenue ForecastingOhio .................................. E ★ Semi-annual CY + 2 The Economic Advisory Council to the Governor
Oklahoma ........................ E ★ Informal semi-annual revision CY + 1 . . .Oregon ............................ E ★ Quarterly CY + 5 Governor’s Council of Economic AdvisorsPennsylvania ................... E ★ Semi-annual CY + 5 . . .Rhode Island ................... C ★ Semi-annual CY + 1 . . .South Carolina ............... E ★ Quarterly CY + 1 Board of Economic Advisors
South Dakota.................. L ★ (i) CY + 2 The Governor’s Council of Economic AdvisorsTennessee........................ E ★ Semi-annual or as needed CY + 1 . . .Texas ................................ (e) I (j) ★ As necessary CY + 2 . . .Utah ................................. C ★ Quarterly CY + 1 The Economic Coordinating CommitteeVermont .......................... C . . . Semi-annual CY + 1 . . .
Virginia ........................... E ★ Varies, 2 or 3 times per FY CY + 2 or 3 Governor’s Advisory Board of Economists; Governor’s.......................................... Advisory Council on Revenue EstimatesWashington ...................... C ★ Quarterly CY + 3 Governor’s Council of Economic AdvisorsWest Virginia .................. E ★ Annual (k) CY + 3 Center for Economic Research; Bureau of Employment
Programs; West Virginia Research League; West VirginiaDevelopment Office
Wisconsin ........................ (l) ★ Annual CY + 3 (m)Wyoming ......................... C ★ Semi-annual CY + 5 Consensus Revenue Estimating Group
Dist. of Columbia ........... E ★ Three times a year CY + 5 (n)nsensus tevenue estimating group consensus revenueAmerican Samoa........... E ★ Semi-annual CY + 2 . . .Puerto RicoCPuerto Rico .................... E ★ Three times a year CY + 4 Planning Board
Source: The Council of State Governments’ survey, 1998, except wherenoted by * where data are from The Book of the States, 1996-97.
Key:★ — Yes.. . . — No.C — ConsensusE — ExecutiveL — LegislativeI — IndependentCY — Current yearFY - Fiscal year(a) Various groups advise the Consensus Committee.
(b) There is no formal statute which obligates the legislature to use Dela-ware Ecomonic & Financial Advisory Council estimates. However, since itsinception, DEFAC estimates have been used exclusively.
(c) The Council on Revenues is required by constitution and statute to pre-pare revenue estimates to be used by the executive and legislature.
(d) The Board of Revenue Estimates has statutory authority to prepare theestimates. The board consists of the Comptroller (independently elected), theSecretary of the Department of Budget and Management, and the Treasurer.
(e) University Research Center forecasts 10 years out. Office of PolicyDevelopment forecasts 12 quarters out.
(f) The revenue estimate adopted by the legislature is in the form of a reso-lution and is not binding on the governor. The final budget is subject to nego-

BUDGET
238 The Book of the States 1998-99
Table 6.4REVENUE ESTIMATING PRACTICEStiation between the legislature and the governor, who always has the optionof vetoing the budget.
(g) An annual consensus economic and revenue forecasting conference isrequired by statute. In practice, however, the legislature and executive nego-tiate the revenue estimate for the budget through an informal consensus pro-cess.
(h) The consensus revenue estimate is negotiated annually. In addition, theexecutive produces quarterly revenue estimates.
(i) Semi-annual by executive, annual by legislature.
(j) Texas vests authority for revenue estimation in an independently electedcomptroller.
(k) Unofficial estimates revised quarterly.(l) The executive branch is required by statute to prepare revenue estimates.
The Legislature’s Joint Committee on Finances has final approval of revenueestimates used in the state budget.
(m) A technical forecast advisory group consisting of economists from vari-ous state agencies reviews national and state economic forecasts. It does notreview revenue estimating.
(n) Advisory board planned.

The Council of State Governments
239
MANAGEM
ENT OF FUNDS
Table 6.5ALLOWABLE STATE INVESTMENTS
Certificates Certificates State and localState or other of deposits of deposits Other time Bankers Commercial Corporate government U.S. Treasury U.S. agency Eurodollars Repurchasejurisdiction (in state) (nationally) deposits acceptance paper notes/bonds Mutuals obligations obligations obligations (CDs or TDs) agreements
Alabama .......................... . . . . . . ★ . . . . . . ★ . . . ★ ★ ★ . . . ★Alaska .............................. . . . . . . . . . . . . . . . . . . . . . . . . . . . . . . . . . . . .Arizona ............................ ★ ★ . . . ★ ★ ★ (. . .a) ★ ★ ★ . . . ★Arkansas ......................... ★ . . . ★ . . . . . . . . . . . . ★ . . . . . . . . . ★California ........................ ★ ★ ★ ★ ★ ★ . . . ★ ★ ★ . . . ★
Colorado ......................... ★ . . . ★ ★ ★ ★ ★ (a) ★ ★ ★ . . . ★Connecticut..................... ★ ★ . . . ★ ★ ★ ★ . . . ★ ★ . . . ★Delaware ......................... ★ ★ ★ ★ ★ ★ ★ ★ ★ ★ ★ ★Florida ............................. ★ ★ ★ ★ ★ ★ ★ ★ ★ ★ . . . ★Georgia............................ ★ ★ ★ ★ ★ ★ ★ ★ ★ ★ . . . ★
Hawaii ............................. ★ ★ ★ . . . . . . . . . ★ ★ ★ ★ . . . ★Idaho ................................ ★ . . . . . . ★ ★ . . . . . . ★ ★ ★ . . . ★Illinois .............................. ★ . . . . . . ★ ★ . . . . . . ★ ★ ★ . . . ★Indiana ............................ ★ . . . . . . . . . . . . . . . . . . . . . ★ ★ . . . ★Iowa ................................. ★ . . . ★ ★ ★ ★ . . . . . . ★ ★ . . . ★
Kansas............................. ★ . . . . . . . . . ★ . . . . . . ★ ★ ★ . . . ★Kentucky ......................... ★ ★ ★ ★ ★ . . . ★ ★ ★ ★ . . . ★Louisiana ........................ ★ . . . . . . . . . ★ ★ ★ ★ ★ ★ . . . ★Maine ............................... ★ ★ . . . ★ ★ . . . . . . ★ ★ ★ . . . ★Maryland ........................ ★ . . . ★ ★ ★ . . . ★ ★ ★ ★ . . . ★
Massachusetts................ ★ . . . . . . ★ ★ . . . . . . . . . ★ ★ . . . ★Michigan ......................... ★ ★ ★ ★ ★ ★ ★ ★ ★ ★ ★ ★Minnesota ....................... . . . . . . . . . ★ ★ ★ . . . . . . ★ ★ ★ ★Mississippi ...................... ★ . . . . . . . . . (b) (b) ★ . . . ★ ★ . . . ★Missouri .......................... ★ . . . . . . . . . . . . . . . . . . . . . ★ ★ . . . ★
Montana .......................... . . . . . . . . . . . . . . . . . . . . . . . . . . . . . . . . . . . .Nebraska......................... ★ ★ ★ ★ ★ ★ ★ ★ ★ ★ ★ ★Nevada ............................. ★ ★ . . . ★ ★ ★ . . . ★ ★ ★ . . . ★New Hampshire.............. ★ . . . . . . . . . ★ . . . . . . . . . ★ ★ . . . ★New Jersey ...................... ★ ★ . . . ★ ★ ★ . . . ★ ★ ★ ★ ★
New Mexico .................... ★ . . . . . . . . . . . . . . . . . . . . . ★ ★ . . . ★New York ......................... ★ . . . ★ ★ ★ . . . ★ ★ ★ ★ . . . ★North Carolina ............... ★ . . . . . . ★ ★ ★ . . . . . . ★ ★ . . . ★North Dakota .................. ★ . . . . . . . . . . . . . . . . . . . . . . . . . . . . . . . . .Ohio ................................. ★ . . . . . . ★ ★ . . . ★ ★ ★ ★ . . . ★
Oklahoma ....................... ★ ★ ★ ★ ★ . . . ★ (c) ★ ★ ★ . . . ★Oregon ............................. ★ . . . ★ ★ ★ ★ ★ ★ ★ ★ ★ ★Pennsylvania................... ★ ★ ★ ★ ★ ★ ★ ★ ★ ★ ★ ★Rhode Island .................. ★ ★ ★ . . . ★ . . . . . . . . . ★ ★ ★ ★South Carolina ............... ★ ★ ★ . . . ★ ★ . . . ★ ★ ★ . . . ★
See footnotes at end of table.
240The Book of the States 1998-99
MANAGEM
ENT OF FUNDS
ALLOWABLE STATE INVESTMENTS — Continued
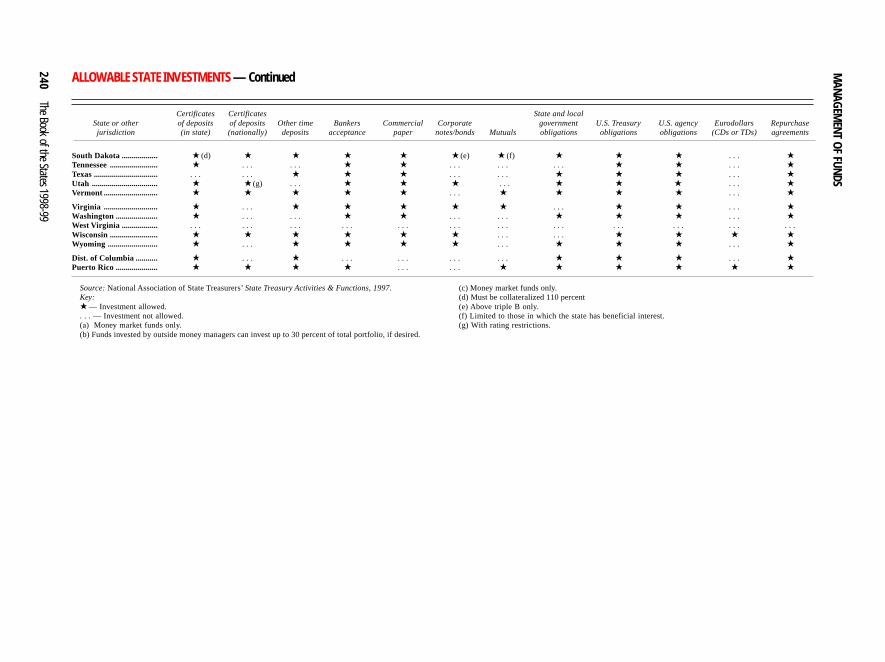
Certificates Certificates State and localState or other of deposits of deposits Other time Bankers Commercial Corporate government U.S. Treasury U.S. agency Eurodollars Repurchasejurisdiction (in state) (nationally) deposits acceptance paper notes/bonds Mutuals obligations obligations obligations (CDs or TDs) agreements
South Dakota.................. ★ (d) ★ ★ ★ ★ (c) ★ (e) ★ (f) ★ ★ ★ . . . ★Tennessee........................ ★ . . . . . . ★ ★ . . . . . . . . . ★ ★ . . . ★Texas ................................ . . . . . . ★ ★ ★ . . . . . . ★ ★ ★ . . . ★Utah ................................. ★ (d) ★ (g) . . . ★ ★ ★ (e. . .) ★ ★ (★d . . . ★Vermont ........................... ★ ★ ★ ★ ★ . . . ★ ★ ★ ★ . . . ★
Virginia ........................... ★ . . . ★ ★ ★ ★ ★ . . . ★ ★ . . . ★Washington ..................... ★ . . . . . . ★ ★ . . . . . . ★ ★ ★ . . . ★West Virginia .................. . . . . . . . . . . . . . . . . . . . . . . . . . . . . . . . . . . . .Wisconsin........................ ★ ★ ★ ★ ★ ★ . . . . . . ★ ★ ★ ★Wyoming ......................... ★ . . . ★ ★ ★ ★ . . . ★ ★ ★ . . . ★
Dist. of Columbia ........... ★ . . . ★ . . . . . . . . . . . . ★ ★ ★ . . . ★Puerto Rico ..................... ★ ★ ★ ★ . . . . . . ★ ★ ★ ★ ★ ★
Source: National Association of State Treasurers’ State Treasury Activities & Functions, 1997.Key:★ — Investment allowed.. . . — Investment not allowed.(a) Money market funds only.(b) Funds invested by outside money managers can invest up to 30 percent of total portfolio, if desired.
(c) Money market funds only.(d) Must be collateralized 110 percent(e) Above triple B only.(f) Limited to those in which the state has beneficial interest.(g) With rating restrictions.

The Council of State Governments
241
MANAGEM
ENT OF FUNDS
Table 6.6CASH MANAGEMENT PROGRAMS AND SERVICES
Reviews of cash management programs
Banking relations Investment practices Agency preparing cash management services
State or other Reviewing Frequency Reviewing Frequency Lock Wire Zero balance Information Account Automatedjurisdiction agency of review agency of review boxes transfers accounts services reconciliation services clearinghouse
Alabama ........................ . . . . . . . . . . . . OF OF . . . IH . . . OFAlaska ............................ SE Annually SE Ongoing OF IH OF IH IH OFArizona ......................... SE Monthly SE Monthly . . . IH,OF OF Y IH,OF IH,OFArkansas ....................... SE As Needed SE Monthly . . . OF . . . IH IH OFCalifornia ...................... SE Biannually SE Quarterly OF IH,OF OF IH,OF IH,OF OF
Colorado ....................... SE Weekly SE Periodically OF OF OF OF OF IH,OFConnecticut .................. SE Quarterly OF Weekly OF IH,OF OF IH,OF IH,OF IH,OFDelaware ...................... (a) 5-7 years (a) Annually OF IH OF IH,OF IH IHFlorida ........................... SE 4 years SE Annually IH,OF OF OF IH IH OFGeorgia ......................... SE Annually SE Daily OF IH,OF OF OF OF IH
Hawaii ........................... SE (b) SE (c) OF OF IH OF IH OFIdaho .............................. SE Ongoing SE Ongoing . . . IH OF IH,OF IH OFIllinois ............................ SE Annually SE Annually OF IH,OF OF IH IH IHIndiana ........................... SE Annually SE Annually OF OF OF . . . . . . OFIowa ............................... SE 4 years SE Monthly OF IH,OF (d) OF OF (e) . . . IH (f)Kansas ........................... SE 3 years SE (g) Annually OF IH OF IH,OF . . . IH,OFKentucky ....................... SE (h) SE Quarterly/Annually . . . OF OF OF IH,OF OFLouisiana ....................... SE As Needed SE As Needed OF OF OF OF OF OFMaine ............................. SE 2 years SE Quarterly OF OF . . . IH,OF IH,OF OFMaryland ...................... SE Annually SE Annually IH,OF IH IH,OF IH IH,OF IH
Massachusetts.............. SE Daily SE Daily OF OF . . . OF IH,OF OFMichigan ....................... SE Annually SE Annually OF OF OF IH . . . OFMinnesota ..................... SE Ongoing (i) SE Ongoing (j) OF IH OF IH . . . IH,OFMississippi ..................... SE Ongoing SE Ongoing . . . OF . . . . . . . . . OFMissouri ........................ SE 4 Years SE 4 Years IH OF OF IH,OF IH,OF OF
Montana ........................ SE Monthly SE Monthly/Annually . . . IH,OF . . . IH . . . IH,OFNebraska....................... SE Ongoing SE Ongoing . . . OF IH,OF IH,OF IH IH,OFNevada .......................... SE Quarterly SE Quarterly/Monthly OF IH,OF OF . . . IH,OF OFNew Hampshire ........... SE As Needed SE Monthly OF OF OF OF OF OFNew Jersey................... SE Ongoing SE Daily OF IH,OF OF IH,OF IH,OF IH,OF
New Mexico ................. SE Periodically SE Periodically OF OF OF IH IH IH,OFNew York ...................... SE . . . SE Annually (k) Y Y Y . . . Y . . .North Carolina ............ SE Annually SE Quarterly IH,OF IH OF IH IH IH,OFNorth Dakota ............... SE Daily SE Daily . . . OF OF . . . IH OFOhio ................................ SE Biannually SE (l) IH,OF OF . . . IH OF IH,OF
Oklahoma ...................... SE Ongoing SE Ongoing OF OF OF IH,OF . . . IH,OFOregon .......................... SE Periodically SE/OF Periodically OF IH,OF OF IH OF IH,OFPennsylvania ................. SE Daily SE Daily OF IH . . . IH,OF IH,OF IHRhode Island ................. SE Quarterly SE Weekly OF IH,OF OF IH,OF IH,OF IH,OFSouth Carolina ............. SE Annually SE/OF Annually OF IH,OF IH,OF . . . IH,OF OF
See footnotes at end of table.

242The Book of the States 1998-99
MANAGEM
ENT OF FUNDS
CASH MANAGEMENT PROGRAMS AND SERVICES — Continued
Reviews of cash management programs
Banking relations Investment practices Agency preparing cash management services
State or other Reviewing Frequency Reviewing Frequency Lock Wire Zero balance Information Account Automatedjurisdiction agency of review agency of review boxes transfers accounts services reconciliation services clearinghouse
South Dakota ................ SE (m) Ongoing SE (m) Annually (n) (o) IH OF IH,OF IH,OF (p) IH,OFTennessee...................... SE Monthly SE Quarterly IH IH . . . IH IH IHTexas .............................. SE Ongoing SE Ongoing IH IH,OF OF OF (q) IH OFUtah ............................... SE Monthly SE Monthly OF IH IH IH IH IHVermont ........................ SE 3 Years SE Annually IH,OF IH,OF OF IH,OF IH IH,OF
Virginia ......................... SE Annually SE/OF Periodically IH,OF OF OF IH,OF IH,OF IH,OFWashington .................... SE Ongoing SE Annually OF OF OF IH,OF IH IH,OFWest Virginia* ............. N.A. N.A. SE Annually IH,OF OF OF N.A. IH,OF IH,OFWisconsin ...................... SE 6 Years SE/OF . . . OF IH,OF OF IH,OF IH,OF IH,OFWyoming ....................... SE Annually SE/OF Annually . . . IH,OF IH . . . IH OF
Dist. of Columbia ......... SE/OF Annually SE/OF Annually IH,OF IH,OF OF . . . IH IH,OFPuerto Rico .................. SE . . . SE . . . OF OF OF IH,OF IH,OF OF
Source: National Association of State Treasurers, State Treasury Activities & Functions, 1997, except wherenoted by * where data are from 1996.
Key:SE — State employee or board.OF — Outside firm.IH — Within treasurer’s office.Y — Utilizes services, performance not specified.. . . — Service not utilized.N.A. — Not available.(a) Cash management policy board.(b) Reviewed when contract expires.(c) No set period for review.(d) Treasurer initiated wires by phone and the use of software.
(e) Treasury uses bank software to access balance and ACH information.(f) State agencies create the files.(g) Board also reviews.(h) Contract renewed on a two-year cycle.(i) Bid every three years.(j) Quarterly formal reviews.(k) Sooner if required by changing market conditions.(l) Weekly, strategic meetings; annual, policy meetings.(m) Daily by treasurer; quarterly by treasurer and Finance Office; annually by treasurer and Department
of Legislative Audit.(n) And as necessary.(o) Service provided by outside firm, but currently not in use.(p) Initiated by bank; verified by state.(q) Balance reporting.
The Council of State Governments
243
MANAGEM
ENT OF FUNDS
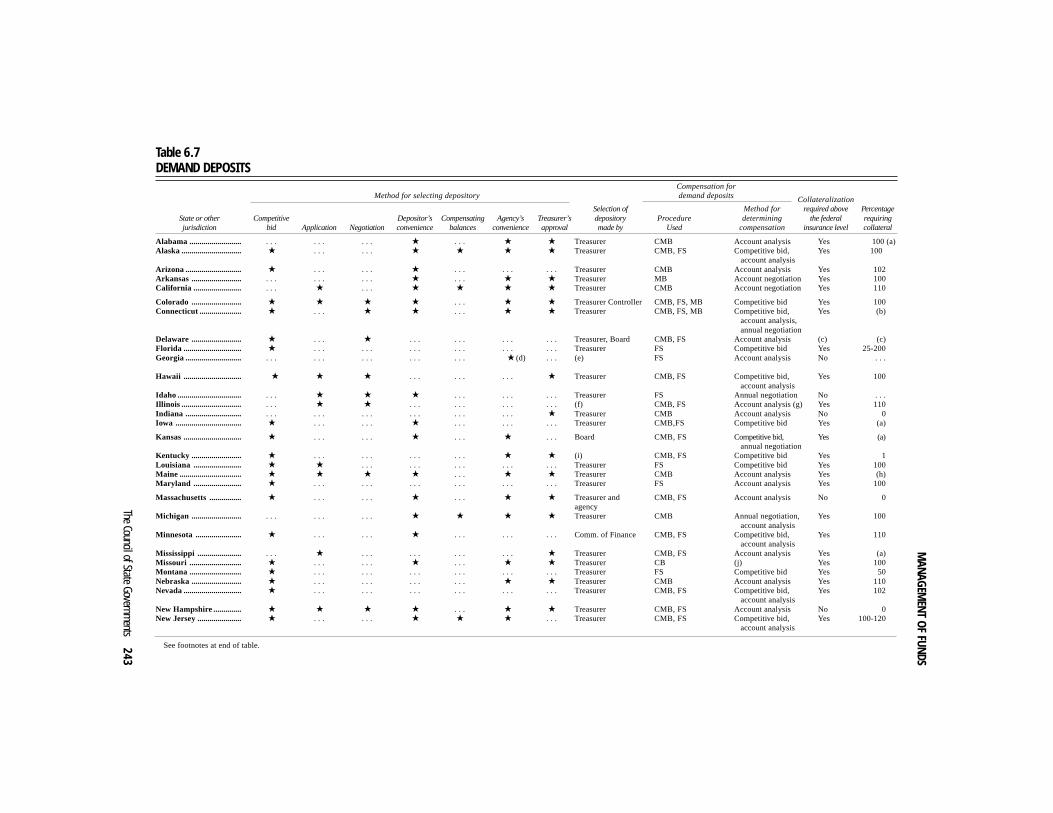
Table 6.7DEMAND DEPOSITS
CollateralizationSelection of Method for required above Percentage
State or other Competitive Depositor’s Compensating Agency’s Treasurer’s depository Procedure determining the federal requiringjurisdiction bid Application Negotiation convenience balances convenience approval made by Used compensation insurance level collateral
Alabama .......................... . . . . . . . . . ★ . . . ★ ★ Treasurer CMB Account analysis Yes 100 (a)Alaska .............................. ★ . . . . . . ★ ★ ★ ★ Treasurer CMB, FS Competitive bid, Yes 100.......................................... account analysisArizona ............................ ★ . . . . . . ★ . . . . . . . . . Treasurer CMB Account analysis Yes 102Arkansas ......................... . . . . . . . . . ★ . . . ★ ★ Treasurer MB Account negotiation Yes 100California ........................ . . . ★ . . . ★ ★ ★ ★ Treasurer CMB Account negotiation Yes 110
Colorado ......................... ★ ★ ★ ★ . . . ★ ★ Treasurer Controller CMB, FS, MB Competitive bid Yes 100Connecticut..................... ★ . . . ★ ★ . . . ★ ★ Treasurer CMB, FS, MB Competitive bid, Yes (b).......................................... account analysis,.......................................... annual negotiationDelaware ......................... ★ . . . ★ . . . . . . . . . . . . Treasurer, Board CMB, FS Account analysis (c) (c)Florida ............................. ★ . . . . . . . . . . . . . . . . . . Treasurer FS Competitive bid Yes 25-200Georgia............................ . . . . . . . . . . . . . . . ★ (d) . . . (e) FS Account analysis No . . ...........................................Hawaii ............................. (e★ ★ ★ . . . . . . . . . ★ Treasurer CMB, FS Competitive bid, Yes 100.......................................... account analysisIdaho ................................ . . . ★ ★ ★ . . . . . . . . . Treasurer FS Annual negotiation No . . .Illinois .............................. . . . ★ ★ . . . . . . . . . . . . (f) CMB, FS Account analysis (g) Yes 110Indiana ............................ . . . . . . . . . . . . . . . . . . ★ Treasurer CMB Account analysis No 0Iowa ................................. ★ . . . . . . ★ . . . . . . . . . Treasurer CMB,FS Competitive bid Yes (a)
Kansas............................. ★ . . . . . . ★ . . . ★ . . . Board CMB, FS Competitive bid, Yes (a).......................................... annual negotiationKentucky ......................... ★ . . . . . . . . . . . . ★ ★ (i) CMB, FS Competitive bid Yes 1Louisiana ........................ ★ ★ . . . . . . . . . . . . . . . Treasurer FS Competitive bid Yes 100Maine ............................... ★ ★ ★ ★ . . . ★ ★ Treasurer CMB Account analysis Yes (h)Maryland ........................ ★ . . . . . . . . . . . . . . . . . . Treasurer FS Account analysis Yes 100
Massachusetts................ ★ . . . . . . ★ . . . ★ ★ Treasurer and CMB, FS Account analysis No 0.......................................... agencyMichigan ......................... . . . . . . . . . ★ ★ ★ ★ Treasurer CMB Annual negotiation, Yes 100.......................................... account analysisMinnesota ....................... ★ . . . . . . ★ . . . . . . . . . Comm. of Finance CMB, FS Competitive bid, Yes 110.......................................... account analysisMississippi ...................... . . . ★ . . . . . . . . . . . . ★ Treasurer CMB, FS Account analysis Yes (a)Missouri .......................... ★ . . . . . . ★ . . . ★ ★ Treasurer CB (j) Yes 100Montana .......................... ★ . . . . . . . . . . . . . . . . . . Treasurer FS Competitive bid Yes 50Nebraska......................... ★ . . . . . . . . . . . . ★ ★ Treasurer CMB Account analysis Yes 110Nevada ............................. ★ . . . . . . . . . . . . . . . . . . Treasurer CMB, FS Competitive bid, Yes 102.......................................... account analysisNew Hampshire.............. ★ ★ ★ ★ . . . ★ ★ Treasurer CMB, FS Account analysis No 0New Jersey ...................... ★ . . . . . . ★ ★ ★ . . . Treasurer CMB, FS Competitive bid, Yes 100-120.......................................... account analysis
Compensation forMethod for selecting depository demand deposits
See footnotes at end of table.

244The Book of the States 1998-99
MANAGEM
ENT OF FUNDS
DEMAND DEPOSITS — Continued
CollateralizationSelection of Method for required above Percentage
State or other Competitive Depositor’s Compensating Agency’s Treasurer’s depository Procedure determining the federal requiringjurisdiction bid Application Negotiation convenience balances convenience approval made by used compensation insurance level collateral
New Mexico .................... . . . . . . . . . . . . . . . ★ ★ Treasurer (k) CMB Account analysis Yes (l)New York ......................... ★ . . . ★ . . . . . . . . . . . . Treasurer CMB, FS Account analysis Yes 100North Carolina ............... . . . . . . . . . ★ . . . ★ ★ Treasurer CMB Account analysis, Yes 100.......................................... annual negotiationNorth Dakota .................. . . . . . . . . . . . . . . . . . . . . . State Constitution (m) State Constitution No . . .Ohio ................................. ★ (n) . . . . . . . . . . . . . . . . . . Board CMB, FS Account analysis Yes 100
Oklahoma ....................... . . . . . . . . . ★ . . . . . . ★ Treasurer CMB, FS Account analysis Yes 110Oregon ............................. . . . . . . . . . ★ . . . ★ ★ Treasurer CMB, FS Negotiation Yes 25Pennsylvania................... . . . ★ . . . . . . . . . . . . . . . Board CMB Account analysis Yes 120Rhode Island .................. . . . . . . . . . . . . . . . . . . ★ Treasurer CMB, FS Account analysis No (o) 0South Carolina ............... . . . . . . ★ . . . . . . . . . ★ Treasurer CMB Account analysis Yes 100
South Dakota.................. (p) . . . . . . . . . . . . . . . . . . Treasurer CB, FS (q) Competitive bid Yes 110Tennessee........................ . . . ★ . . . . . . . . . . . . . . . Treasurer CMB/FS Account analysis, Yes 105.......................................... Competitive bidTexas ................................ . . . ★ . . . . . . . . . . . . . . . Board CMB, FS Account analysis Yes 105 (r)Utah ................................. ★ . . . ★ ★ . . . ★ ★ Treasurer FS Competitive bid, No . . ........................................... account analysisVermont ........................... ★ . . . . . . . . . . . . . . . ★ Treasurer FS Competitive bid Yes 102
Virginia ........................... ★ . . . ★ ★ . . . ★ ★ Treasurer CMB, FS Competitive bid, Yes 50-100 (s).......................................... account analysisWashington ..................... ★ . . . ★ ★ . . . ★ ★ Treasurer, state CMB, FS Account analysis, Yes 10.......................................... agencies competitive bid.......................................... annual negotiationWest Virginia* ................ ★ . . . . . . ★ . . . ★ . . . Board CB,FS Competitive bid, Yes 88.6.......................................... account analysisWisconsin........................ ★ . . . . . . . . . . . . . . . . . . Board FS Account analysis No N.A.Wyoming ......................... ★ . . . . . . . . . . . . . . . . . . Treasurer FS Account analysis, Yes 100.......................................... competitive bid
Dist. of Columbia ........... ★ . . . . . . . . . . . . . . . . . . Treasurer CMB Competitive bid Yes 102Puerto Rico ..................... . . . ★ . . . . . . . . . . . . ★ Treasurer CMB. FS Account analysis Yes 100
Compensation forMethod for selecting depository demand deposits
Source: National Association of State Treasurers, State Treasury Activities & Functions, 1997, except wherenoted by * where data are from 1996.
Key:★ — Method utilized.. . . — Method not utilized.N.A. — Not available.CB — Competitive bid.CMB — Compensating balances.FS — Fee for service.MB — Minimum balance.(a) Public funds in excess of FDIC must be collateralized.(b) Depends upon Risk Based Capital Ratio.(c) Banks must meet certain financial criteria. If they do not meet the criteria they must collateralize to 102
percent MTM.(d) With approval of State Depository Board.(e) Agencies with approval of State Depository Board.(f) Banks/savings and loans request funds in writing, and Treasurer’s staff base deposits on safety and sound-
ness review.(g) Based on fee schedule negotiated in contract.(h) Demand deposits that exceed 25 percent of a bank’s retained earnings must be collateralized.(i) Treasurer, Finance Secretary and a selection committee are responsible for the selection of institutions.(j) Prices are established based on market rates.(k)Treasurer approves agency’s selection.(l) Minimum 50 percent collateral required on alldeposits(m) Fees through interest rates.(n) Approval by State Board of Deposits.(o) Only under special circumstances.(p) Competitive bid for treasury’s primary account, auditor’s warrant imprest account and college accounts.
Auditor and treasurer jointly approve local account service.(q) State agencies pay electronic banking service fees. Daily account analysis with earning credit determina
tion.(r) Requires 125 percent if mortgage backed securities are pledged.(s) Fifty percent, all banks pool risk for remaining 50 percent. One hundred percent, saving banks and thosebanks rated low.

REVENUE AND EXPENDITURE
The Council of State Governments 245
Table 6.8SUMMARY OF FINANCIAL AGGREGATES, BY STATE: 1995(In millions of dollars)
Cash andDebt security
Utilities Utilities outstanding holdings atand liquor Insurance and liquor Insurance at end of end of
State Total General store trust Total General store trust fiscal year fiscal year
United States............ $903,756 $739,016 $6,919 $157,821 $836,894 $724,565 $10,108 $93,282 $427,239 $1,388,001
Alabama .......................... 12,280 10,583 130 1,567 11,542 10,329 140 913 3,759 17,373Alaska .............................. 8,288 7,358 24 906 5,599 5,028 48 504 3,232 28,233Arizona ............................ 12,593 10,510 19 2,064 11,162 9,928 24 1,067 3,037 18,431Arkansas ......................... 7,368 6,467 0 901 6,616 5,986 0 545 1,983 9,240California ........................ 118,303 94,252 137 23,915 109,231 93,384 97 15,128 48,197 182,653
Colorado ......................... 11,555 9,191 0 2,364 9,802 8,210 4 1,364 3,368 18,295Connecticut..................... 13,718 12,060 21 1,637 13,576 11,522 235 1,737 15,456 17,189Delaware ......................... 3,441 3,114 6 321 2,980 2,657 27 244 3,524 6,279Florida ............................. 37,359 31,013 5 6,342 34,750 31,951 34 2,547 15,370 52,464Georgia............................ 20,284 17,123 0 3,161 19,154 17,572 0 1,383 5,622 28,648
Hawaii ............................. 5,778 5,099 0 679 6,015 5,321 1 643 5,196 8,949Idaho ................................ 3,845 3,151 46 649 3,360 2,876 35 384 1,303 6,193Illinois .............................. 34,689 29,064 0 5,626 32,991 28,544 0 4,146 21,950 45,334Indiana ............................ 16,261 14,848 0 1,412 15,284 13,883 0 958 5,457 19,550Iowa ................................. 9,268 8,087 84 1,097 8,586 7,759 58 612 2,111 11,582
Kansas............................. 7,374 6,495 0 880 7,116 6,376 0 657 1,145 7,435Kentucky ......................... 12,846 11,085 0 1,761 11,395 10,074 8 1,196 7,097 16,637Louisiana ........................ 13,956 12,066 0 1,890 14,461 12,926 0 1,326 8,520 24,228Maine ............................... 4,208 3,673 68 467 4,179 3,618 47 468 3,041 6,841Maryland ........................ 16,430 13,696 89 2,645 15,069 12,723 352 1,815 9,438 25,478
Massachusetts................ 24,101 21,545 65 2,490 24,282 21,739 97 2,315 27,734 29,475Michigan ......................... 35,328 30,217 458 4,653 34,669 30,456 356 3,437 12,535 39,872Minnesota ....................... 18,329 15,210 0 3,119 16,380 14,617 0 1,572 4,494 26,655Mississippi ...................... 8,301 7,056 131 1,114 7,414 6,597 105 601 1,924 12,548Missouri .......................... 15,586 12,516 0 3,071 12,482 11,251 0 1,082 6,714 27,125
Montana .......................... 3,293 2,644 37 611 2,988 2,521 33 390 210 6,116Nebraska......................... 4,615 4,195 0 420 4,250 3,997 0 157 1,368 5,521Nevada ............................. 5,478 3,896 81 1,501 4,581 3,677 78 785 1,996 8,839New Hampshire.............. 3,270 2,674 211 385 3,096 2,661 168 210 5,781 8,228New Jersey ...................... 32,675 25,343 428 6,904 32,605 26,275 1,400 4,767 24,358 51,888
New Mexico .................... 6,634 5,660 0 974 6,363 5,779 0 496 1,824 15,252New York ......................... 90,997 69,875 2,108 19,014 81,372 67,992 4,170 8,895 68,466 129,845North Carolina ............... 22,091 19,170 0 2,921 20,437 18,305 0 1,702 4,548 35,306North Dakota .................. 2,448 2,143 0 306 2,213 1,973 0 165 855 3,183Ohio ................................. 41,306 28,263 370 12,673 34,990 27,685 263 6,598 12,295 100,480
Oklahoma ....................... 9,160 7,724 248 1,188 8,990 7,378 243 1,180 3,736 12,762Oregon ............................. 12,986 9,438 176 3,372 11,030 9,391 113 1,408 5,482 17,286Pennsylvania................... 40,015 32,772 676 6,567 39,394 33,263 634 5,128 14,294 54,889Rhode Island .................. 4,156 3,386 8 763 4,265 3,501 39 682 5,516 7,192South Carolina ............... 12,068 9,609 606 1,853 11,623 9,725 704 1,030 5,020 16,213
South Dakota.................. 2,090 1,766 0 324 1,880 1,749 0 105 1,663 4,706Tennessee........................ 12,900 11,522 0 1,378 13,432 12,435 4 850 2,822 14,605Texas ................................ 49,422 40,352 0 9,070 44,643 39,935 0 4,169 9,922 80,650Utah ................................. 6,325 5,304 80 941 5,780 5,183 60 431 2,061 10,798Vermont ........................... 2,074 1,869 28 176 2,014 1,824 27 132 1,668 2,585
Virginia ........................... 18,993 16,251 248 2,494 17,040 15,305 211 1,166 8,716 28,745Washington ..................... 23,576 16,765 253 6,558 21,200 17,215 216 3,429 8,820 35,502West Virginia .................. 6,629 5,628 45 956 6,262 5,328 48 796 2,586 6,864Wisconsin........................ 16,826 15,337 0 1,489 16,302 14,366 0 1,755 8,236 37,784Wyoming ......................... 2,240 1,952 33 255 2,045 1,775 29 213 788 6,058
Revenue Expenditure
Source: U.S. Department of Commerce, Bureau of the Census.Note: Detail may not add to totals due to rounding. Data presented are
statistical in nature and do not represent an accounting statement. Therefore,a difference between an individual government’s total revenues and expendi-tures does not necessarily indicate a budget surplus or deficit.

REVENUE AND EXPENDITURE
246 The Book of the States 1998-99
Table 6.9SUMMARY OF FINANCIAL AGGREGATES, BY STATE: 1996(In millions of dollars)
Cash andDebt security
Utilities Utilities outstanding holdings atand liquor Insurance and liquor Insurance at end of end of
State Total General store trust Total General store trust fuscal year fiscal year
United States............. $967,005 $770,713 $7,079 $189,213 $859,959 $755,277 $10,637 $94,045 $447,339 $1,558,249
Alabama .......................... 12,741 10,894 136 1,710 12,127 10,992 147 988 3,645 18,014Alaska .............................. 8,254 6,819 17 1,418 5,630 5,105 21 504 3,177 31,310Arizona ............................ 12,594 10,867 21 1,706 11,898 10,818 25 1,056 2,936 21,216Arkansas ......................... 8,653 7,023 0 1,630 7,050 6,481 0 569 2,142 10,668California ........................ 123,342 98,185 143 25,014 113,361 98,783 100 14,479 45,859 194,354
Colorado ......................... 11,866 9,461 0 2,405 10,312 8,902 5 1,405 3,577 26,043Connecticut..................... 14,349 12,357 21 1,972 13,530 11,736 186 1,608 16,415 20,152Delaware ......................... 3,619 3,303 7 309 3,248 2,926 54 269 4,279 7,889Florida ............................. 41,680 32,994 5 8,681 36,454 33,619 63 2,772 15,515 59,587Georgia ............................ 22,409 18,345 0 4,064 20,013 18,589 0 1,424 6,200 32,554
Hawaii ............................. 6,383 5,379 0 1,004 5,947 5,229 0 717 5,117 9,676Idaho ................................ 4,384 3,305 47 1,032 3,501 3,083 37 382 1,454 7,014Illinois .............................. 36,991 30,306 0 6,684 34,111 30,092 0 4,019 22,676 50,536Indiana ............................ 16,550 15,065 0 1,485 15,368 14,422 0 946 6,117 21,813Iowa ................................. 9,245 8,133 87 1,024 8,853 8,183 60 610 2,065 12,990
Kansas............................. 7,864 6,892 0 973 7,276 6,680 0 596 1,161 7,557Kentucky ......................... 13,788 11,571 0 2,218 11,842 10,603 8 1,232 7,030 19,462Louisiana ........................ 14,296 11,833 0 2,463 14,030 12,591 0 1,439 7,452 23,556Maine ............................... 4,267 3,836 70 361 4,240 3,735 47 458 3,160 6,372Maryland ........................ 16,041 14,011 89 1,941 15,554 13,355 393 1,805 9,691 30,394
Massachusetts................ 25,197 22,845 69 2,283 24,950 22,790 88 2,072 29,295 33,203Michigan ......................... 38,047 32,129 475 5,443 35,080 31,644 370 3,066 13,668 46,643Minnesota ....................... 20,525 16,192 0 4,333 17,325 15,749 0 1,576 4,858 30,369Mississippi ...................... 8,865 7,461 134 1,269 8,217 7,437 108 672 2,232 13,089Missouri .......................... 17,051 13,022 0 4,029 12,841 11,751 0 1,090 7,128 29,305
Montana .......................... 3,476 2,831 39 606 3,136 2,729 30 377 2,244 6,492Nebraska......................... 4,999 4,536 0 463 4,490 4,320 0 170 1,402 6,260Nevada ............................. 5,997 4,146 46 1,806 4,831 4,024 83 725 2,259 10,136New Hampshire.............. 3,561 2,706 223 632 3,240 2,841 182 217 5,833 8,373New Jersey ...................... 35,857 26,615 447 8,796 32,315 26,035 1,422 4,857 25,602 56,754
New Mexico .................... 8,129 6,318 0 1,811 6,740 6,222 0 519 2,147 16,901New York ......................... 94,277 71,219 2,156 20,902 82,420 68,866 4,657 8,897 73,122 142,507North Carolina ............... 23,387 20,047 0 3,340 21,221 19,410 0 1,810 4,513 38,110North Dakota .................. 2,569 2,144 0 424 2,064 1,860 0 203 819 4,173Ohio ................................. 43,823 29,467 373 13,983 35,517 28,492 260 6,765 12,628 105,128
Oklahoma ....................... 10,609 8,156 246 2,207 9,265 7,912 231 1,123 3,889 14,607Oregon ............................. 15,432 9,958 184 5,290 11,858 9,633 112 2,113 6,086 22,294Pennsylvania................... 42,796 33,512 693 8,592 38,699 33,136 648 4,915 15,046 67,402Rhode Island .................. 4,271 3,346 8 917 4,061 3,400 37 624 5,506 7,600South Carolina ............... 12,602 10,261 644 1,697 12,400 10,683 654 1,062 5,324 18,468
South Dakota.................. 2,284 1,886 0 397 1,975 1,861 0 113 1,704 5,110Tennessee........................ 14,749 12,510 0 2,239 13,829 12,885 4 941 3,069 18,538Texas ................................ 51,118 42,616 0 8,502 46,082 41,519 0 4,563 14,576 103,090Utah ................................. 6,773 5,831 88 854 6,172 5,663 66 443 2,464 11,470Vermont ........................... 2,146 1,950 28 168 2,061 1,918 27 116 1,718 2,734
Virginia ........................... 20,072 16,617 249 3,206 17,717 16,307 218 1,192 8,793 31,094Washington ..................... 24,790 17,195 254 7,341 21,086 17,587 219 3,280 8,991 40,086West Virginia .................. 6,866 5,836 46 985 6,970 5,623 44 1,303 2,830 5,860Wisconsin........................ 25,072 16,778 0 8,294 16,990 15,251 0 1,739 9,127 44,764Wyoming ......................... 2,348 2,004 34 310 2,062 1,807 30 225 799 6,530
Revenue Expenditure
Source: U.S. Department of Commerce, Bureau of the Census.Note: Detail may not add to totals due to rounding. Data presented are
statistical in nature and do not represent an accounting statement. Therefore,a difference between an individual government’s total revenues and expendi-tures does not necessarily indicate a budget surplus or deficit.

REVENUE AND EXPENDITURE
The Council of State Governments 247
Percent Percent Pe rcapita Per capita change change
Item 1996 1995 1994 revised 1996 1995 1995 to 1996 1994 to 1995
Table 6.10NATIONAL TOTALS OF STATE GOVERNMENT FINANCES FOR SELECTED YEARS: 1994-1996
Population (in thousands).............. 264,740,570 262,201,000 259,808,000
Revenue total....................................$ 967,005,172 $ 903,755,501 $ 845,404,580 $ 3,652.65 $ 3,446.80 7.0 6.9 General revenue............................... 770,713,150 739,015,866 692,704,065 2,911.20 2,818.51 4.3 6.7 Taxes ..............................................418,970,791 399,147,521 373,826,669 1,582.57 1,522.30 5.0 6.8 Intergovernmental revenue......... 221,469,370 215,558,360 204,515,917 836.55 822.11 2.7 5.4 From Federal Government...... 208,099,676 202,485,216 191,448,622 786.05 772.25 2.8 5.8 Public welfare........................ 118,153,874 114,944,717 110,522,036 446.30 438.38 2.8 4.0 Education............................... 34,054,557 31,943,573 30,129,520 128.63 121.83 6.6 6.0 Highways................................ 18,809,418 19,418,924 17,767,271 71.05 74.06 (3.1) 9.3 Employment security administration..................... 3,787,030 3,972,476 4,023,578 14.30 15.15 (4.7) (1.3) Other....................................... 33,294,797 32,205,526 29,006,217 125.76 122.83 3.4 11.0 From local government............. 13,369,694 13,073,144 13,067,295 50.50 49.86 2.3 0.0 Charges and miscellaneous revenue ......................................130,272,989 124,309,985 114,361,479 492.08 474.10 4.8 8.7 Liquor stores revenue.................... 3,159,573 3,073,404 3,051,813 11.93 11.72 2.8 0.7 Utility revenue............................... 3,919,223 3,845,228 3,784,363 14.80 14.67 1.9 1.6 Insurance trust revenue................. 189,213,226 157,821,003 145,864,339 714.71 601.91 19.9 8.2 Unemployment compensation ... 33,684,503 37,040,879 29,707,275 127.24 141.27 (9.1) 24.7 Employee retirement.................. 139,316,425 104,450,918 99,435,823 526.24 398.36 33.4 5.0 Other........................................... 16,212,298 16,329,206 16,721,241 61.24 62.28 (0.7) (2.3)
Expenditure and debt redemption ....................................902,353,282 874,365,113 838,563,396 3,408.44 3,334.71 3.2 4.3 Debt redemption.......................... 42,394,650 37,471,443 61,343,973 160.14 142.91 13.1 (38.9) Expenditure total......................... 859,958,632 836,893,670 777,219,423 3,248.31 3,191.80 2.8 7.7 General expenditure...................... 755,276,699 724,564,751 683,969,223 2,852.89 2,763.39 4.2 5.9 Education.....................................263,519,202 249,670,340 230,790,998 995.39 952.21 5.5 8.2 Intergovernmental expenditure.......................... 156,954,115 148,160,436 135,861,024 592.86 565.06 5.9 9.1 State institutions of higher education................................ 92,976,045 89,458,449 83,798,929 351.20 341.18 3.9 6.8 Other education........................ 170,543,157 160,211,891 146,992,069 644.19 611.03 6.4 9.0 Public welfare.............................. 195,730,925 194,786,516 182,363,025 739.33 742.89 0.5 6.8 Intergovernmental expenditure........................ 35,053,889 34,365,957 34,189,235 132.41 131.07 2.0 0.5 Cash assistance, categorical program................................. 34,998,902 36,034,099 35,422,318 132.20 137.43 (2.9) 1.7 Cash assistance, other.............. 2,213,536 2,375,958 2,253,509 8.36 9.06 (6.8) 5.4 Other public welfare................ 158,518,487 156,376,459 144,687,198 598.77 596.40 1.4 8.1 Highways..................................... 58,254,885 57,374,450 53,849,443 220.05 218.82 1.5 6.5 Intergovernmental expenditure........................ 10,707,338 10,481,616 9,622,849 40.44 39.98 2.2 8.9 Regular state highway facilities................................. 54,955,528 54,028,210 50,549,081 207.58 206.06 1.7 6.9 State toll highways/facilities ... 3,299,357 3,346,240 3,300,362 12.46 12.76 (1.4) 1.4 Health and hospitals.................... 62,033,317 60,003,203 57,020,272 234.32 228.84 3.4 5.2 State hospitals and institutions for handicapped................... 29,063,252 28,882,739 27,718,888 109.78 110.15 0.6 4.2 Other......................................... 32,970,065 31,120,464 29,301,384 124.54 118.69 5.9 6.2 Natural resources........................ 12,861,853 12,533,912 11,878,197 48.58 47.80 2.6 5.5 Corrections.................................. 27,324,135 26,069,038 23,134,735 103.21 99.42 4.8 12.7 Financial administration............. 12,493,783 12,761,394 11,376,181 47.19 48.67 (2.1) 12.2 Employment security administration........................... 3,917,577 3,932,011 4,056,438 14.80 15.00 (0.4) (3.1) Police protection......................... 7,173,419 6,451,364 6,000,330 27.10 24.60 11.2 7.5 Interest on general debt ................ 25,402,062 24,485,426 23,719,182 95.95 93.38 3.7 3.2 Veterans’ services ........................ 225,645 206,109 178,847 0.85 0.79 9.5 15.2 Utility expenditure .......................... 8,043,307 7,585,965 7,214,483 30.38 28.93 6.0 5.1 Insurance trust expenditure ............ 94,045,406 93,281,908 84,796,597 355.24 355.76 0.8 10.0 Employee retirement .................... 53,082,851 47,541,349 43,901,307 200.51 181.32 11.7 8.3 Unemployment compensation ...... 29,337,402 35,032,015 28,466,393 110.82 133.61 (16.3) 23.1 Other ............................................. 11,625,153 10,708,544 12,428,897 43.91 40.84 8.6 (13.8)
Total expenditure by character and object ..............................................859,958,632 836,893,670 777,219,423 3,248.31 3,191.80 2.8 7.7 Direct expenditure ........................... 607,856,174 595,915,542 551,584,013 2,296.05 2,272.74 2.0 8.0 Current operation ......................... 405,415,661 396,035,029 368,339,830 1,531.37 1,510.43 2.4 7.5 Capital outlay ............................... 58,915,152 57,828,938 52,928,988 222.54 220.55 1.9 9.3 Construction ............................. 46,924,479 46,113,125 41,648,940 177.25 175.87 1.8 10.7 Purchase of land and existing structures ............................... 2,968,231 2,677,147 2,975,298 11.21 10.21 10.9 (10.0)

REVENUE AND EXPENDITURE
248 The Book of the States 1998-99
Percent Percent Per capita Per capita change change
Item 1996 1995 1994 revised 1996 1995 1995 to 1996 1994 to 1995
NATIONAL TOTALS OF STATE GOVERNMENT FINANCES FOR SELECTED YEARS: 1994-1996 —Continued
Equipment ................................ 9,022,442 9,038,666 8,304,750 34.08 34.47 (0.2) 8.8 Assistance and subsidies ............. 23,312,951 23,511,134 22,280,770 88.06 89.67 (0.8) 5.5 Interest on debt ............................ 26,167,004 25,258,533 24,493,580 98.84 96.33 3.6 3.1 Insurance benefits and repayments ................................ 94,045,406 93,281,908 83,540,845 355.24 355.76 0.8 11.7 Intergovernmental expenditure ....... 252,102,458 240,978,128 225,635,410 952.26 919.06 4.6 6.8
Cash and security holdings at end of fiscal year ....................................1,558,248,670 1,388,001,038 1,256,819,433 5,885.95 5,293.65 12.3 10.4 Insurance trust ................................ 1,103,605,750 962,445,729 791,992,561 4,168.63 3,670.64 14.7 21.5 Unemployment fund balance ...... 36,868,099 36,736,602 28,881,834 139.26 140.11 0.4 27.2 Debt offsets .................................... 226,280,807 215,791,447 205,296,908 854.73 823.00 4.9 5.1
Source: U.S. Department of Commerce, Bureau of the Census.

The Council of State Governments
249
REVENUE AND EXPENDITURE
Taxes
Sales and gross receipts Licenses
Table 6.11STATE GENERAL REVENUE, BY SOURCE AND BY STATE: 1995(In thousands of dollars)
Charges andTotal miscellaneous
general Motor Motor Individual Corporation Intergovernmental generalState revenue (a) Total Total (b) General fuels Total (b) vehicle income net income revenue revenue
United States............. $739,015,866 $399,147,521 $196,850,966 $132,236,159 $25,439,721 $26,082,996 $12,414,315 $125,610,125 $29,075,019 $215,558,360 $124,309,985
Alabama .......................... 10,582,838 5,077,827 2,645,405 1,364,911 457,582 480,698 182,439 1,482,662 236,279 3,240,417 2,264,594Alaska .............................. 7,358,377 1,922,463 101,039 0 39,601 75,078 24,496 0 528,005 980,048 4,455,866Arizona ............................ 10,509,675 6,223,489 3,599,791 2,771,856 451,089 343,607 246,154 1,482,749 417,481 3,026,512 1,259,674Arkansas ......................... 6,466,816 3,391,785 1,888,834 1,301,937 330,110 196,957 91,764 1,047,119 191,600 2,077,582 997,449California ........................ 94,252,188 53,269,075 22,620,541 17,687,262 2,703,674 2,870,933 1,454,043 18,344,342 5,747,929 29,982,101 11,001,012
Colorado ......................... 9,191,036 4,531,366 1,912,593 1,230,748 418,494 267,886 123,295 2,101,708 190,026 2,682,929 1,976,741Connecticut..................... 12,059,596 7,474,119 3,708,795 2,368,000 417,102 316,539 198,301 2,474,355 698,918 2,760,735 1,824,742Delaware ......................... 3,114,156 1,594,818 245,813 0 91,976 525,298 32,206 562,371 193,649 563,423 955,915Florida ............................. 31,012,552 18,564,650 14,326,946 10,656,548 1,337,144 1,299,716 751,821 0 944,969 7,972,736 4,475,166Georgia............................ 17,122,830 9,486,639 4,460,160 3,538,675 518,143 402,384 207,837 3,841,595 653,296 5,223,660 2,412,531
Hawaii ............................. 5,098,822 2,874,496 1,794,971 1,363,262 75,529 83,667 61,277 925,714 47,296 1,138,457 1,085,869Idaho ................................ 3,151,005 1,733,120 814,170 575,752 153,193 149,260 54,158 599,724 129,470 809,915 607,970Illinois .............................. 29,063,506 16,589,789 8,429,624 4,958,866 1,133,329 949,146 730,669 5,312,159 1,481,460 8,165,665 4,308,052Indiana ............................ 14,848,073 8,045,753 3,575,884 2,709,816 605,426 228,396 156,784 3,257,299 874,305 3,438,489 3,363,831Iowa ................................. 8,087,497 4,403,428 2,066,479 1,462,892 362,278 402,385 260,191 1,617,498 220,675 2,188,545 1,495,524
Kansas............................. 6,494,718 3,765,488 1,894,932 1,379,070 286,115 199,053 123,211 1,232,989 261,408 1,599,300 1,129,930Kentucky ......................... 11,084,543 6,284,623 2,926,921 1,680,525 397,014 373,361 162,329 1,964,843 340,912 3,048,428 1,751,492Louisiana ........................ 12,065,711 4,676,969 2,406,763 1,490,235 487,944 445,074 88,115 1,061,606 283,076 4,670,057 2,718,685Maine ............................... 3,673,225 1,812,574 924,905 650,210 153,570 115,010 56,249 640,472 63,290 1,173,254 687,397Maryland ........................ 13,696,205 8,060,982 3,497,867 1,951,031 599,334 357,134 190,977 3,400,487 365,759 3,110,667 2,524,556
Massachusetts................ 21,545,392 11,601,135 3,736,624 2,481,300 577,501 429,049 250,921 5,974,201 1,205,667 5,758,080 4,186,177Michigan ......................... 30,217,499 17,723,494 7,667,135 5,865,988 817,536 853,459 591,029 5,473,072 2,130,395 7,518,487 4,975,518Minnesota ....................... 15,210,377 9,327,886 4,169,687 2,741,603 503,933 711,475 478,082 3,663,517 665,756 3,569,252 2,313,239Mississippi ...................... 7,055,718 3,599,244 2,422,323 1,691,654 348,317 226,427 102,809 683,247 203,339 2,556,495 899,979Missouri .......................... 12,515,675 6,751,959 3,276,588 2,348,110 547,430 481,194 228,433 2,535,063 369,424 3,802,198 1,961,518
Montana .......................... 2,644,417 1,214,152 249,108 0 162,827 140,549 44,777 372,093 75,520 877,193 553,072Nebraska......................... 4,194,950 2,219,725 1,187,409 781,099 259,559 150,584 66,690 740,902 123,924 1,114,224 861,001Nevada ............................. 3,895,534 2,698,343 2,260,371 1,437,820 180,593 307,914 86,833 0 0 781,752 415,439New Hampshire.............. 2,673,938 918,461 540,716 0 101,583 112,031 53,444 37,758 166,451 925,424 830,053New Jersey ...................... 25,342,938 13,606,950 6,975,312 4,133,278 466,695 720,570 393,759 4,540,082 1,028,947 6,051,263 5,684,725
New Mexico .................... 5,660,160 2,844,484 1,615,935 1,218,664 190,626 155,791 115,612 591,734 150,343 1,377,263 1,438,413New York ......................... 69,875,147 34,294,492 11,774,157 6,844,960 487,746 1,013,751 658,242 17,589,489 2,814,568 26,918,482 8,662,173North Carolina ............... 19,170,054 11,425,714 4,861,376 2,794,111 914,233 710,224 320,167 4,699,115 906,007 5,474,923 2,269,417North Dakota .................. 2,142,646 958,725 548,075 283,382 90,035 75,963 40,197 142,997 69,880 691,864 492,057Ohio ................................. 28,263,099 15,186,174 7,481,865 4,752,099 1,251,920 1,332,548 495,860 5,552,503 713,252 8,171,595 4,905,330
See footnotes at end of table.

250The Book of the States 1998-99
REVENUE AND EXPENDITURE
STATE GENERAL REVENUE, BY SOURCE AND BY STATE: 1995 — Continued
Charges andTotal miscellaneous
general Motor Motor Individual Corporation Intergovernmental generalState revenue (a) Total Total (b) General fuels Total (b) vehicle income net income revenue revenue
Oklahoma ....................... 7,724,102 4,416,463 1,850,669 1,143,583 386,705 575,082 460,841 1,416,921 166,746 2,050,805 1,256,834Oregon ............................. 9,438,212 4,286,038 546,570 0 362,219 504,266 277,265 2,797,575 312,001 3,065,310 2,086,864Pennsylvania................... 32,772,410 18,262,139 8,653,385 5,550,290 776,477 1,872,596 493,305 4,929,522 1,784,579 9,184,054 5,326,217Rhode Island .................. 3,386,013 1,490,340 768,656 456,610 123,517 85,202 53,991 530,406 82,160 1,193,087 702,586South Carolina ............... 9,609,448 4,763,097 2,470,390 1,794,120 317,267 326,921 91,619 1,655,954 250,214 3,069,085 1,777,266
South Dakota.................. 1,765,906 694,037 537,716 358,879 88,619 87,654 29,344 0 39,914 665,042 406,827Tennessee........................ 11,521,631 5,907,721 4,564,181 3,360,568 720,409 603,188 197,450 101,511 493,072 4,044,934 1,568,976Texas ................................ 40,351,618 20,288,774 16,436,335 10,274,777 2,236,750 2,790,740 744,547 0 0 12,680,852 7,381,992Utah ................................. 5,303,764 2,675,502 1,358,573 1,066,552 202,705 99,123 47,826 1,024,072 147,374 1,498,486 1,129,776Vermont ........................... 1,869,415 801,376 394,373 173,644 57,542 64,558 38,614 250,283 48,274 633,266 434,773
Virginia ........................... 16,250,572 8,783,939 3,445,191 1,920,623 679,151 429,699 279,192 4,315,545 367,832 3,474,279 3,992,354Washington ..................... 16,765,094 10,195,584 7,635,336 6,047,504 661,934 482,196 232,684 0 0 3,976,651 2,592,859West Virginia .................. 5,628,038 2,731,907 1,460,167 793,465 207,497 150,665 84,448 709,923 218,686 2,001,039 895,092Wisconsin........................ 15,337,062 9,029,488 3,848,148 2,571,854 656,525 436,442 219,004 3,932,948 670,891 3,765,756 2,541,818Wyoming ......................... 1,951,668 666,725 272,162 208,026 43,223 71,553 41,014 0 0 814,299 470,644
Source: U.S. Department of Commerce, Bureau of the Census.Note: Detail may not add to totals due to rounding.(a) Total general revenue equals total taxes plus intergovernmental revenue plus charges and miscellaneous
revenue.(b) Total includes other taxes not shown separately in this table.
Taxes
Sales and gross receipts Licenses

The Council of State Governments
251
REVENUE AND EXPENDITURE
Table 6.12STATE GENERAL REVENUE, BY SOURCE AND BY STATE: 1996(In thousands of dollars)
Charges andTotal miscellaneous
general Motor Motor Individual Corporation Intergovernmental generalState revenue (a) Total Total (b) General fuels Total (b) vehicle income net income revenue revenue
United States............. $770,713,150 $418,970,791 $205,687,307 $139,278,702 $25,981,234 $27,036,285 $12,740,349 $134,683,257 $29,315,684 $221,469,370 $130,272,989
Alabama .......................... 10,894,396 5,257,771 2,773,974 1,439,145 462,197 422,841 169,735 1,577,914 217,616 3,347,019 2,289,606Alaska .............................. 6,818,956 1,519,082 99,124 0 37,740 78,896 29,926 0 326,270 1,017,117 4,282,757Arizona ............................ 10,866,578 6,409,395 3,658,165 2,720,378 497,856 391,385 288,376 1,494,282 448,040 3,104,914 1,352,269Arkansas ......................... 7,023,153 3,708,744 1,939,666 1,375,906 329,908 216,315 98,297 1,162,401 228,801 2,162,774 1,151,635California ........................ 98,185,276 57,746,664 24,092,750 18,980,224 2,722,191 3,034,776 1,517,816 20,760,385 5,831,072 29,087,230 11,351,382
Colorado ......................... 9,460,920 4,820,163 2,037,377 1,321,500 445,152 255,753 131,550 2,274,185 205,700 2,745,933 1,894,824Connecticut..................... 12,356,981 7,830,171 3,932,290 2,444,896 498,126 330,986 204,651 2,614,481 641,389 2,733,965 1,792,845Delaware ......................... 3,302,671 1,688,349 252,744 0 94,381 533,401 32,802 631,598 166,021 661,888 952,434Florida ............................. 32,993,589 19,699,255 15,240,513 11,428,999 1,337,982 1,315,384 786,039 0 1,007,556 8,493,292 4,801,042Georgia............................ 18,345,190 10,292,371 4,785,987 3,823,895 547,641 420,202 208,092 4,244,096 719,400 5,419,889 2,632,930
Hawaii ............................. 5,379,231 3,079,404 1,904,683 1,431,802 77,356 85,456 60,310 999,976 65,547 1,227,974 1,071,853Idaho ................................ 3,304,739 1,857,006 851,793 600,112 159,238 155,992 59,759 655,050 152,735 850,239 597,494Illinois .............................. 30,306,291 17,277,319 8,485,929 5,057,457 1,190,886 951,871 712,097 5,781,239 1,621,276 8,393,871 4,635,101Indiana ............................ 15,064,948 8,437,031 3,761,281 2,867,644 613,035 201,776 124,178 3,477,970 894,403 3,750,143 2,877,774Iowa ................................. 8,133,204 4,440,540 2,147,520 1,456,221 367,154 414,215 271,076 1,588,052 202,929 2,139,113 1,553,551
Kansas............................. 6,891,680 3,978,761 1,930,900 1,401,023 295,872 203,098 125,309 1,377,253 254,873 1,694,054 1,218,865Kentucky ......................... 11,570,606 6,489,256 3,065,661 1,784,031 401,327 381,299 167,911 2,074,572 284,733 3,152,055 1,929,295Louisiana ........................ 11,832,770 4,906,283 2,558,812 1,621,872 502,015 418,327 96,808 1,160,262 327,543 4,110,590 2,815,897Maine ............................... 3,835,918 1,896,564 935,796 657,955 156,448 114,473 56,287 709,491 71,062 1,245,305 694,049Maryland ........................ 14,011,079 8,166,692 3,554,952 2,000,298 606,406 357,725 196,519 3,484,896 330,553 3,239,651 2,604,736
Massachusetts................ 22,845,324 12,455,370 3,887,937 2,610,094 598,773 397,522 219,512 6,706,870 1,227,861 5,827,457 4,562,497Michigan ......................... 32,129,087 19,128,687 8,324,240 6,586,563 783,358 982,069 624,169 5,868,406 2,189,742 7,759,959 5,240,441Minnesota ....................... 16,192,328 10,242,646 4,492,395 2,900,125 519,713 769,236 484,007 4,135,548 703,099 3,619,824 2,329,858Mississippi ...................... 7,461,122 3,860,523 2,602,402 1,831,963 354,682 247,462 108,891 742,157 201,742 2,696,263 904,336Missouri .......................... 13,022,026 7,210,351 3,451,466 2,465,479 565,564 516,491 234,112 2,740,707 425,542 3,710,742 2,100,933
Montana .......................... 2,830,792 1,256,416 269,478 0 176,047 147,824 47,097 383,092 75,762 991,179 583,197Nebraska......................... 4,535,936 2,369,462 1,224,525 814,748 269,114 158,146 71,856 840,210 126,801 1,189,563 976,911Nevada ............................. 4,145,806 2,889,254 2,434,901 1,571,703 196,116 312,972 91,944 0 0 804,368 452,184New Hampshire.............. 2,706,280 837,092 428,740 0 107,300 108,038 52,548 51,857 179,652 1,011,082 858,106New Jersey ...................... 26,614,948 14,384,897 7,363,746 4,318,373 461,045 752,861 394,350 4,733,786 1,155,270 6,663,301 5,566,750
New Mexico .................... 6,318,208 3,060,637 1,735,760 1,283,843 225,631 164,818 119,127 642,800 163,402 1,793,798 1,463,773New York ......................... 71,219,317 34,150,039 11,913,517 6,963,058 504,373 973,607 622,500 17,398,595 2,729,835 27,668,376 9,400,902North Carolina ............... 20,047,157 11,882,318 5,143,859 2,970,566 951,595 732,907 337,461 4,929,008 939,278 5,758,009 2,406,830North Dakota .................. 2,144,456 985,327 559,751 282,131 95,420 77,715 38,095 151,592 74,299 660,161 498,968Ohio ................................. 29,466,705 15,649,492 7,604,288 4,991,363 1,201,612 1,218,717 509,418 5,902,884 807,435 8,726,104 5,091,109
Taxes
Sales and gross receipts Licenses
See footnotes at end of table.

252The Book of the States 1998-99
REVENUE AND EXPENDITURE
STATE GENERAL REVENUE, BY SOURCE AND BY STATE: 1996 — Continued
Charges andTotal miscellaneous
general Motor Motor Individual Corporation Intergovernmental generalState revenue (a) Total Total (b) General fuels Total (b) vehicle income net income revenue revenue
Oklahoma ....................... 8,155,980 4,617,688 1,870,060 1,210,391 341,744 658,486 520,164 1,512,410 163,734 2,197,345 1,340,947Oregon ............................. 9,957,537 4,415,725 591,357 0 380,024 580,688 338,603 2,823,073 300,459 3,333,928 2,207,884Pennsylvania................... 33,511,837 18,295,012 8,757,711 5,701,275 759,649 1,809,068 491,377 5,214,021 1,504,010 9,150,973 6,065,852Rhode Island .................. 3,345,536 1,549,195 778,189 465,133 125,651 80,448 53,599 580,628 86,973 1,110,389 685,952South Carolina ............... 10,260,863 5,113,034 2,603,702 1,919,340 321,641 389,432 96,260 1,813,461 250,867 3,187,100 1,960,729
South Dakota.................. 1,886,175 730,251 572,364 383,423 89,565 90,336 30,387 0 38,099 694,625 461,299Tennessee........................ 12,509,924 6,184,562 4,744,381 3,537,315 715,111 609,567 202,772 114,434 533,862 4,726,180 1,599,182Texas ................................ 42,615,890 21,270,839 17,235,431 10,811,287 2,322,645 3,047,806 765,392 0 0 13,077,010 8,268,041Utah ................................. 5,831,395 2,913,960 1,470,506 1,170,120 206,904 98,909 46,964 1,139,080 176,781 1,757,090 1,160,345Vermont ........................... 1,950,265 841,029 403,847 182,528 58,570 71,538 44,047 280,918 44,818 650,350 458,886
Virginia ........................... 16,616,577 8,900,413 3,588,976 1,995,787 706,823 418,817 257,941 4,300,918 362,830 3,514,798 4,201,366Washington ..................... 17,195,462 10,586,463 7,867,511 6,182,443 676,716 492,932 237,888 0 0 3,890,578 2,718,421West Virginia .................. 5,835,895 2,770,888 1,452,499 797,289 206,139 155,827 89,063 750,889 235,123 2,093,978 971,029Wisconsin........................ 16,778,167 10,292,434 4,029,634 2,708,052 673,525 613,632 230,934 4,857,810 620,889 3,860,097 2,625,636Wyoming ......................... 2,003,979 625,966 274,217 210,952 43,273 74,243 42,333 0 0 767,727 610,286
Taxes
Sales and gross receipts Licenses
Source: U.S. Department of Commerce, Bureau of the Census.Note: Detail may not add to totals due to rounding.(a) Total general revenue equals total taxes plus intergovernmental revenue plus charges and miscellaneous
revenue.
(b) Total includes other taxes not shown separately in this table.

The Council of State Governments
253
REVENUE AND EXPENDITURE
Table 6.13STATE EXPENDITURE, BY CHARACTER AND OBJECT AND BY STATE: 1995(In thousands of dollars)
Direct expenditures
Capital outlay
Land and Assistance Insurance Exhibit: TotalIntergovernmental Current existing and Interest benefits and salaries
State expenditure Total operation Total Construction structures Equipment subsidies on debt repayments and wages
United States.............. $240,978,128 $595,915,542 $396,035,029 $57,828,938 $46,113,125 $2,677,147 $9,038,666 $23,511,134 $25,258,533 $93,281,908 $125,431,931
Alabama .......................... 2,619,713 8,922,168 6,703,955 808,001 527,141 120,034 160,826 303,811 193,752 912,649 2,441,210Alaska .............................. 1,095,556 4,503,477 3,148,468 410,937 329,758 7,920 73,259 146,697 293,414 503,961 893,274Arizona ............................ 3,992,499 7,169,953 4,866,267 622,500 371,531 38,542 212,427 430,043 184,301 1,066,842 1,668,427Arkansas ......................... 1,585,671 5,030,448 3,740,550 478,215 378,166 12,629 87,420 149,215 117,200 545,268 1,348,659California ........................ 44,892,639 64,338,508 41,445,317 4,015,816 3,126,932 261,513 627,371 1,049,052 2,700,304 15,128,019 13,141,094
Colorado ......................... 2,702,979 7,098,873 4,731,295 572,892 425,200 52,332 95,360 194,982 235,749 1,363,955 1,771,583Connecticut..................... 2,408,985 11,166,822 6,923,509 1,014,283 885,917 17,081 111,285 645,858 845,796 1,737,376 2,448,513Delaware ......................... 509,719 2,470,469 1,662,832 274,633 212,665 17,314 44,654 69,483 219,388 244,133 700,639Florida ............................. 10,949,733 23,799,772 16,028,427 3,281,512 2,317,950 616,501 347,061 1,070,009 872,588 2,547,236 5,946,865Georgia............................ 4,849,875 14,304,607 9,822,533 2,139,101 1,710,097 158,337 270,667 649,552 310,114 1,383,307 2,988,906
Hawaii ............................. 144,145 5,870,596 3,737,202 967,244 795,327 43,230 128,687 224,694 298,791 642,665 1,694,894Idaho ................................ 943,526 2,416,788 1,490,746 363,574 287,805 19,327 56,442 85,346 93,300 383,822 556,756Illinois .............................. 7,989,026 25,002,287 15,618,740 2,239,337 1,915,205 72,090 252,042 1,616,748 1,381,077 4,146,385 4,088,797Indiana ............................ 5,114,661 10,169,422 7,718,322 1,006,487 770,350 4,768 231,369 200,903 285,446 958,264 2,389,786Iowa ................................. 2,586,535 5,999,417 4,291,153 696,800 548,655 27,880 120,265 282,800 116,362 612,302 1,684,189
Kansas............................. 2,205,990 4,910,439 3,288,523 686,828 533,768 40,498 112,562 207,783 70,794 656,511 1,367,431Kentucky ......................... 2,790,070 8,604,997 5,791,657 932,029 741,468 23,720 166,841 327,499 357,659 1,196,153 2,123,807Louisiana ........................ 2,981,314 11,479,921 8,415,915 853,816 660,126 26,931 166,759 284,611 599,828 1,325,751 2,889,972Maine ............................... 749,851 3,429,309 2,375,743 238,540 176,163 23,547 38,830 172,202 174,607 468,217 610,475Maryland ........................ 3,073,888 11,995,514 7,923,942 1,176,562 952,600 88,275 135,687 577,348 502,829 1,814,833 2,549,352
Massachusetts................ 4,740,411 19,541,971 12,197,538 2,462,054 2,215,274 54,462 192,318 979,408 1,587,657 2,315,314 3,048,505Michigan ......................... 13,590,202 21,078,496 14,190,991 1,437,985 1,097,969 66,234 273,782 1,296,917 715,459 3,437,144 4,895,533Minnesota ....................... 5,628,502 10,751,307 7,471,602 752,978 526,655 42,206 184,117 679,783 275,101 1,571,843 2,561,274Mississippi ...................... 2,278,909 5,134,999 3,737,654 572,363 438,795 21,028 112,540 108,787 115,636 600,559 1,147,840Missouri .......................... 3,461,819 9,020,227 6,192,522 955,731 678,486 74,186 203,059 440,156 349,921 1,081,897 2,120,554
Montana .......................... 684,581 2,303,226 1,395,406 317,778 276,380 4,805 36,593 82,641 117,866 389,535 467,660Nebraska......................... 1,143,564 3,106,814 2,299,166 480,105 392,241 16,610 71,254 87,440 83,476 156,627 930,099Nevada ............................. 1,424,642 3,156,634 1,751,009 440,657 387,306 5,907 47,444 66,186 113,940 784,842 717,075New Hampshire.............. 374,413 2,721,461 1,872,252 162,089 117,922 12,868 31,299 103,451 373,340 210,329 543,425New Jersey ...................... 7,900,814 24,704,669 15,705,461 2,713,013 2,358,591 51,185 303,237 342,765 1,176,515 4,766,915 4,829,141
New Mexico .................... 1,966,326 4,396,801 3,290,559 297,818 196,710 10,595 90,513 214,797 97,594 496,033 1,202,665New York ......................... 25,189,620 56,182,368 37,196,511 5,337,458 4,528,447 66,759 742,252 917,586 3,836,222 8,894,591 9,779,925North Carolina ............... 6,665,456 13,771,157 9,529,943 1,639,618 1,290,386 14,951 334,281 641,621 257,932 1,702,043 3,189,419North Dakota .................. 437,194 1,775,466 1,304,356 216,631 182,038 1,626 32,967 35,965 53,982 164,532 408,211Ohio ................................. 9,533,638 25,456,658 14,183,294 2,148,551 1,726,848 55,383 366,320 1,710,266 816,419 6,598,128 4,432,636
See footnotes at end of table.

254The Book of the States 1998-99
REVENUE AND EXPENDITURE
STATE EXPENDITURE, BY CHARACTER AND OBJECT AND BY STATE: 1995 — Continued
Direct expenditures
Capital outlay
Land and Assistance Insurance Exhibit: TotalIntergovernmental Current existing and Interest benefits and salaries
State expenditure Total operation Total Construction structures Equipment subsidies on debt repayments and wages
Oklahoma ....................... 2,448,562 6,541,223 4,267,721 618,402 444,916 26,331 147,155 229,694 244,975 1,180,431 1,632,577Oregon ............................. 2,979,586 8,050,394 5,402,554 575,682 439,445 16,619 119,618 297,251 367,305 1,407,602 1,635,100Pennsylvania................... 9,030,954 30,363,515 20,493,957 1,800,075 1,424,524 67,240 308,311 1,707,007 1,234,424 5,128,052 4,782,790Rhode Island .................. 503,523 3,761,617 2,145,060 462,716 422,146 10,454 30,116 167,788 304,392 681,661 712,756South Carolina ............... 2,366,681 9,256,422 6,706,399 939,742 712,952 25,527 201,263 250,662 329,343 1,030,276 2,366,167
South Dakota.................. 336,695 1,542,983 1,067,357 228,007 180,584 7,060 40,363 36,212 106,189 105,218 364,672Tennessee........................ 3,262,616 10,169,758 7,336,166 1,400,739 1,195,430 78,841 126,468 397,055 185,792 850,006 2,249,117Texas ................................ 11,797,328 32,845,982 23,139,692 3,329,826 2,576,683 137,853 615,290 1,456,212 751,615 4,168,637 6,115,608Utah ................................. 1,446,538 4,333,694 3,087,839 564,291 459,919 9,964 94,408 131,372 119,228 430,964 1,236,918Vermont ........................... 308,672 1,704,893 1,258,915 113,745 79,327 6,433 27,985 100,070 100,257 131,906 385,549
Virginia ........................... 4,296,733 12,743,651 8,912,797 1,449,166 1,209,272 4,513 235,381 705,130 510,630 1,165,928 3,526,187Washington ..................... 5,339,678 15,860,612 9,177,355 1,879,957 1,459,813 89,849 330,295 881,724 492,474 3,429,102 3,343,248West Virginia .................. 1,254,636 5,007,133 3,349,303 519,354 426,790 758 91,806 195,363 147,103 796,010 824,087Wisconsin........................ 5,722,997 10,578,866 6,850,868 964,407 763,665 22,264 178,478 515,958 492,175 1,755,458 2,375,982Wyoming ......................... 676,463 1,368,758 795,686 268,893 236,787 2,167 299,39 43,231 48,272 212,676 302,582
Source: U.S. Department of Commerce, Bureau of the Census.Note: Detail may not add to totals due to rounding.

The Council of State Governments
255
REVENUE AND EXPENDITURE
Table 6.14STATE EXPENDITURE, BY CHARACTER AND OBJECT AND BY STATE: 1996(In thousands of dollars)
Direct expenditures
Capital outlay
Land and Assistance Insurance Exhibit: TotalIntergovernmental Current existing and Interest benefits and salaries
State expenditure Total operation Total Construction structures Equipment subsidies on debt repayments and wages
United States............. $252,102,458 $607,856,174 $405,415,661 $58,915,152 $46,924,479 $2,968,231 $9,022,442 $23,312,951 $26,167,004 $94,045,406 $129,577,236
Alabama .......................... 3,076,820 9,049,767 6,782,766 760,751 580,749 38,912 141,090 301,698 216,842 987,710 2,402,694Alaska .............................. 1,057,577 4,571,925 3,193,946 447,790 348,078 19,756 79,956 175,247 250,887 504,055 1,001,121Arizona ............................ 4,255,135 7,643,009 5,168,574 812,062 509,278 69,293 233,491 421,670 185,117 1,055,586 1,738,600Arkansas ......................... 1,636,037 5,414,424 3,956,385 613,005 497,043 14,492 101,470 154,208 121,362 569,464 1,389,189California ........................ 48,758,607 64,602,748 42,804,062 3,776,137 2,843,051 238,897 694,189 1,057,827 2,485,964 14,478,758 13,643,723
Colorado ......................... 2,849,915 7,461,940 4,901,405 601,685 431,467 47,719 122,499 215,386 338,629 1,404,835 1,995,577Connecticut..................... 2,424,347 11,105,275 7,252,236 830,576 704,959 10,178 115,439 502,417 912,157 1,607,889 2,544,668Delaware ......................... 511,314 2,736,860 1,799,728 331,139 227,864 43,575 59,700 67,416 269,636 268,941 746,287Florida ............................. 11,139,772 25,314,445 16,933,584 3,445,480 2,262,186 781,959 401,335 1,051,574 1,112,159 2,771,648 6,279,669Georgia............................ 5,285,164 14,727,874 10,059,737 1,991,271 1,578,505 104,357 308,409 908,227 344,550 1,424,089 3,146,740
Hawaii ............................. 144,333 5,802,343 3,723,497 808,867 721,704 7,633 79,530 220,070 332,513 717,396 1,756,805Idaho ................................ 999,289 2,502,009 1,557,960 349,504 271,005 15,091 63,408 120,013 92,927 381,605 560,113Illinois .............................. 8,549,064 25,562,212 16,509,382 1,999,463 1,656,732 32,310 310,421 1,541,231 1,492,788 4,019,348 4,259,088Indiana ............................ 5,091,091 10,276,596 7,561,996 1,277,462 842,082 177,020 258,360 221,001 270,581 945,556 2,362,751Iowa ................................. 2,672,320 6,180,830 4,436,969 736,516 584,861 30,205 121,450 272,401 125,001 609,943 1,632,767
Kansas............................. 2,262,900 5,012,854 3,313,333 838,590 692,466 41,466 104,658 193,092 71,896 595,943 1,396,107Kentucky ......................... 2,825,097 9,017,289 6,046,604 1,031,364 811,809 38,841 180,714 332,111 375,654 1,231,556 2,308,673Louisiana ........................ 3,025,800 11,004,015 7,667,765 885,672 697,476 26,780 161,416 266,860 744,609 1,439,109 2,929,488Maine ............................... 743,190 3,496,649 2,465,464 230,056 185,008 6,975 38,073 173,191 170,223 457,715 602,134Maryland ........................ 3,238,258 12,315,751 8,141,357 1,226,109 1,006,564 88,990 130,555 548,520 594,267 1,805,498 2,637,029
Massachusetts................ 5,159,973 19,789,756 12,489,648 2,621,376 2,365,194 68,643 187,539 883,702 1,723,374 2,071,656 3,174,327Michigan ......................... 13,299,101 21,780,566 15,249,252 1,582,487 1,216,170 65,117 301,200 1,186,972 696,230 3,065,625 5,120,151Minnesota ....................... 6,068,273 11,257,014 7,823,406 899,030 648,950 51,938 198,142 670,688 287,636 1,576,254 2,873,964Mississippi ...................... 2,506,429 5,710,438 3,930,553 856,423 683,267 32,362 140,794 115,827 135,813 671,822 1,199,456Missouri .......................... 3,434,437 9,406,665 6,463,709 1,112,757 834,686 74,033 204,038 433,122 307,053 1,090,024 2,249,168
Montana .......................... 699,428 2,436,777 1,469,938 352,265 314,929 2,064 35,272 101,490 136,423 376,661 486,957Nebraska......................... 1,175,780 3,313,945 2,503,375 462,086 382,724 9,714 69,648 93,547 85,284 169,653 967,570Nevada ............................. 1,624,270 3,207,072 1,837,481 418,492 341,819 6,906 69,767 68,581 157,788 724,730 772,610New Hampshire.............. 392,423 2,847,611 1,979,919 177,868 119,334 18,813 39,721 96,946 375,769 217,109 569,657New Jersey ...................... 7,771,309 24,543,578 15,700,489 2,242,394 1,938,853 13,495 290,046 406,367 1,336,889 4,857,439 4,716,106
New Mexico .................... 2,055,309 4,685,189 3,520,097 330,113 230,926 9,357 89,830 206,265 109,887 518,827 1,236,087New York ......................... 25,417,231 57,002,935 37,516,213 5,903,696 5,347,028 131,660 425,008 922,131 3,763,506 8,897,389 9,963,891North Carolina ............... 6,653,195 14,567,559 10,044,152 1,863,013 1,405,165 136,238 321,610 598,933 251,128 1,810,333 3,267,121North Dakota .................. 411,331 1,652,281 1,192,918 159,819 136,475 1,469 21,875 41,641 54,697 203,206 406,978Ohio ................................. 10,053,551 25,463,785 14,209,375 2,127,915 1,665,376 57,672 404,867 1,539,320 822,123 6,765,052 4,323,347
See footnotes at end of table.

256The Book of the States 1998-99
REVENUE AND EXPENDITURE
STATE EXPENDITURE, BY CHARACTER AND OBJECT AND BY STATE: 1996 — Continued
Direct expenditures
Capital outlay
Land and Assistance Insurance Exhibit: TotalIntergovernmental Current existing and Interest benefits and salaries
State expenditure Total operation Total Construction structures Equipment subsidies on debt repayments and wages
Oklahoma ....................... 2,536,908 6,728,578 4,447,662 711,251 516,787 37,896 156,568 206,533 240,520 1,122,612 1,669,924Oregon ............................. 3,109,619 8,748,278 5,443,223 563,587 471,474 23,364 68,749 285,374 342,975 2,113,119 1,717,184Pennsylvania................... 9,675,928 29,022,618 19,726,989 1,735,249 1,380,911 38,144 316,194 1,557,080 1,088,227 4,915,073 4,880,418Rhode Island .................. 505,323 3,556,083 2,155,142 317,883 266,977 11,663 39,243 163,830 295,230 623,998 703,099South Carolina ............... 2,720,441 9,679,487 7,159,231 825,810 553,422 51,705 220,683 282,451 349,930 1,062,065 2,462,015
South Dakota.................. 369,368 1,605,264 1,104,479 243,820 185,996 8,078 49,746 35,550 107,946 113,469 366,144Tennessee........................ 3,517,419 10,311,888 7,512,926 1,270,963 1,057,514 63,209 150,240 394,895 192,206 940,898 2,332,205Texas ................................ 12,364,495 33,717,344 23,282,648 3,593,699 2,845,689 137,173 610,837 1,537,204 740,582 4,563,211 6,320,084Utah ................................. 1,526,766 4,645,009 3,283,202 635,015 525,156 13,226 96,633 155,003 128,397 443,392 1,278,854Vermont ........................... 313,167 1,747,892 1,309,201 120,271 86,868 4,950 28,453 97,094 105,021 116,305 402,054
Virginia ........................... 4,462,682 13,254,458 9,033,873 1,503,000 1,271,472 7,254 224,274 975,421 549,920 1,192,244 3,667,590Washington ..................... 5,429,938 15,655,799 9,447,560 1,568,929 1,294,256 27,809 246,864 850,486 509,255 3,279,569 3,478,093West Virginia .................. 1,325,430 5,644,365 3,516,447 521,981 425,689 1,594 94,698 139,455 163,416 1,303,066 938,166Wisconsin........................ 6,290,232 10,699,681 6,983,042 946,705 735,903 26,687 184,115 483,471 547,893 1,738,570 2,408,212Wyoming ......................... 686,672 1,375,444 802,761 253,756 222,582 1,549 29,625 39,412 54,124 225,391 292,581
Source: U.S. Department of Commerce, Bureau of the Census.Note: Detail may not add to totals due to rounding.
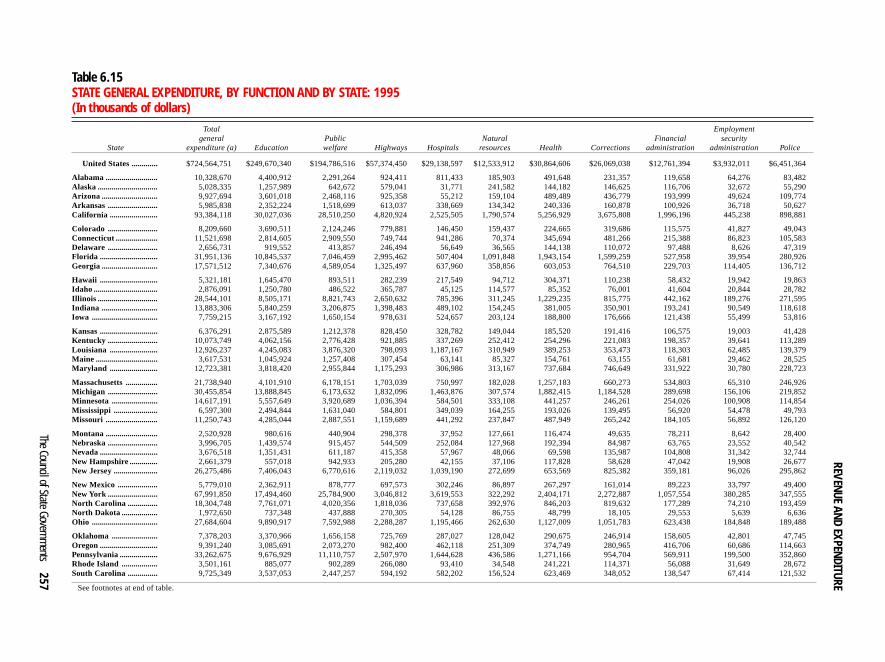
The Council of State Governments
257
REVENUE AND EXPENDITURE
Table 6.15STATE GENERAL EXPENDITURE, BY FUNCTION AND BY STATE: 1995(In thousands of dollars)
Total Employmentgeneral Public Natural Financial security
State expenditure (a) Education welfare Highways Hospitals resources Health Corrections administration administration Police
United States............. $724,564,751 $249,670,340 $194,786,516 $57,374,450 $29,138,597 $12,533,912 $30,864,606 $26,069,038 $12,761,394 $3,932,011 $6,451,364
Alabama .......................... 10,328,670 4,400,912 2,291,264 924,411 811,433 185,903 491,648 231,357 119,658 64,276 83,482Alaska .............................. 5,028,335 1,257,989 642,672 579,041 31,771 241,582 144,182 146,625 116,706 32,672 55,290Arizona ............................ 9,927,694 3,601,018 2,468,116 925,358 55,212 159,104 489,489 436,779 193,999 49,624 109,774Arkansas ......................... 5,985,838 2,352,224 1,518,699 613,037 338,669 134,342 240,336 160,878 100,926 36,718 50,627California ........................ 93,384,118 30,027,036 28,510,250 4,820,924 2,525,505 1,790,574 5,256,929 3,675,808 1,996,196 445,238 898,881
Colorado ......................... 8,209,660 3,690,511 2,124,246 779,881 146,450 159,437 224,665 319,686 115,575 41,827 49,043Connecticut..................... 11,521,698 2,814,605 2,909,550 749,744 941,286 70,374 345,694 481,266 215,388 86,823 105,583Delaware ......................... 2,656,731 919,552 413,857 246,494 56,649 36,565 144,138 110,072 97,488 8,626 47,319Florida ............................. 31,951,136 10,845,537 7,046,459 2,995,462 507,404 1,091,848 1,943,154 1,599,259 527,958 39,954 280,926Georgia............................ 17,571,512 7,340,676 4,589,054 1,325,497 637,960 358,856 603,053 764,510 229,703 114,405 136,712
Hawaii ............................. 5,321,181 1,645,470 893,511 282,239 217,549 94,712 304,371 110,238 58,432 19,942 19,863Idaho ................................ 2,876,091 1,250,780 486,522 365,787 45,125 114,577 85,352 76,001 41,604 20,844 28,782Illinois .............................. 28,544,101 8,505,171 8,821,743 2,650,632 785,396 311,245 1,229,235 815,775 442,162 189,276 271,595Indiana ............................ 13,883,306 5,840,259 3,206,875 1,398,483 489,102 154,245 381,005 350,901 193,241 90,549 118,618Iowa ................................. 7,759,215 3,167,192 1,650,154 978,631 524,657 203,124 188,800 176,666 121,438 55,499 53,816
Kansas............................. 6,376,291 2,875,589 1,212,378 828,450 328,782 149,044 185,520 191,416 106,575 19,003 41,428Kentucky ......................... 10,073,749 4,062,156 2,776,428 921,885 337,269 252,412 254,296 221,083 198,357 39,641 113,289Louisiana ........................ 12,926,237 4,245,083 3,876,320 798,093 1,187,167 310,949 389,253 353,473 118,303 62,485 139,379Maine ............................... 3,617,531 1,045,924 1,257,408 307,454 63,141 85,327 154,761 63,155 61,681 29,462 28,525Maryland ........................ 12,723,381 3,818,420 2,955,844 1,175,293 306,986 313,167 737,684 746,649 331,922 30,780 228,723
Massachusetts................ 21,738,940 4,101,910 6,178,151 1,703,039 750,997 182,028 1,257,183 660,273 534,803 65,310 246,926Michigan ......................... 30,455,854 13,888,845 6,173,632 1,832,096 1,463,876 307,574 1,882,415 1,184,528 289,698 156,106 219,852Minnesota ....................... 14,617,191 5,557,649 3,920,689 1,036,394 584,501 333,108 441,257 246,261 254,026 100,908 114,854Mississippi ...................... 6,597,300 2,494,844 1,631,040 584,801 349,039 164,255 193,026 139,495 56,920 54,478 49,793Missouri .......................... 11,250,743 4,285,044 2,887,551 1,159,689 441,292 237,847 487,949 265,242 184,105 56,892 126,120
Montana .......................... 2,520,928 980,616 440,904 298,378 37,952 127,661 116,474 49,635 78,211 8,642 28,400Nebraska......................... 3,996,705 1,439,574 915,457 544,509 252,084 127,968 192,394 84,987 63,765 23,552 40,542Nevada ............................. 3,676,518 1,351,431 611,187 415,358 57,967 48,066 69,598 135,987 104,808 31,342 32,744New Hampshire.............. 2,661,379 557,018 942,933 205,280 42,155 37,106 117,828 58,628 47,042 19,908 26,677New Jersey ...................... 26,275,486 7,406,043 6,770,616 2,119,032 1,039,190 272,699 653,569 825,382 359,181 96,026 295,862
New Mexico .................... 5,779,010 2,362,911 878,777 697,573 302,246 86,897 267,297 161,014 89,223 33,797 49,400New York ......................... 67,991,850 17,494,460 25,784,900 3,046,812 3,619,553 322,292 2,404,171 2,272,887 1,057,554 380,285 347,555North Carolina ............... 18,304,748 7,761,071 4,020,356 1,818,036 737,658 392,976 846,203 819,632 177,289 74,210 193,459North Dakota .................. 1,972,650 737,348 437,888 270,305 54,128 86,755 48,799 18,105 29,553 5,639 6,636Ohio ................................. 27,684,604 9,890,917 7,592,988 2,288,287 1,195,466 262,630 1,127,009 1,051,783 623,438 184,848 189,488
Oklahoma ....................... 7,378,203 3,370,966 1,656,158 725,769 287,027 128,042 290,675 246,914 158,605 42,801 47,745Oregon ............................. 9,391,240 3,085,691 2,073,270 982,400 462,118 251,309 374,749 280,965 416,706 60,686 114,663Pennsylvania................... 33,262,675 9,676,929 11,110,757 2,507,970 1,644,628 436,586 1,271,166 954,704 569,911 199,500 352,860Rhode Island .................. 3,501,161 885,077 902,289 266,080 93,410 34,548 241,221 114,371 56,088 31,649 28,672South Carolina ............... 9,725,349 3,537,053 2,447,257 594,192 582,202 156,524 623,469 348,052 138,547 67,414 121,532
See footnotes at end of table.

258The Book of the States 1998-99
REVENUE AND EXPENDITURE
STATE GENERAL EXPENDITURE, BY FUNCTION AND BY STATE: 1995 — Continued
Total Employmentgeneral Public Natural Financial security
State expenditure (a) Education welfare Highways Hospitals resources Health Corrections administration administration Police
South Dakota.................. 1,749,347 514,606 374,521 258,290 48,808 78,096 58,078 40,678 38,948 16,543 15,728Tennessee........................ 12,434,586 4,302,667 3,804,888 1,220,053 499,511 168,612 560,550 424,429 112,354 76,267 85,476Texas ................................ 39,935,395 16,285,954 10,635,272 3,037,574 1,858,412 614,036 1,247,912 2,590,405 800,416 265,835 239,995Utah ................................. 5,183,005 2,482,814 923,723 353,984 281,639 112,784 140,097 144,326 108,557 30,082 36,543Vermont ........................... 1,823,942 610,672 510,788 157,005 9,445 54,308 48,071 41,159 37,586 9,648 27,078
Virginia ........................... 15,305,371 5,979,289 2,791,293 1,983,212 1,041,917 137,945 544,456 778,486 365,249 87,707 289,108Washington ..................... 17,214,515 7,273,096 3,729,654 1,536,854 513,864 512,272 854,450 482,761 271,371 151,318 156,600West Virginia .................. 5,328,495 1,993,619 1,576,052 662,595 83,702 151,368 131,278 77,231 135,565 23,810 37,160Wisconsin........................ 14,365,798 5,029,803 3,159,993 1,114,815 432,741 400,609 505,708 509,551 183,291 78,870 55,983Wyoming ......................... 1,775,288 626,319 252,182 287,272 33,556 89,624 73,989 29,570 31,272 20,294 12,258
Source: U.S. Department of Commerce, Bureau of the Census.Note: Detail may not add to totals due to rounding.(a) Does not represent some of detail.

The Council of State Governments
259
REVENUE AND EXPENDITURE
Table 6.16STATE GENERAL EXPENDITURE, BY FUNCTION AND BY STATE: 1996(In thousands of dollars)
Total Employmentgeneral Public Natural Financial security
State expenditure (a) Education welfare Highways Hospitals resources Health Corrections administration administration Police
United States............. $755,276,699 $263,519,202 $195,730,925 $58,254,885 $29,421,119 $12,861,853 $32,612,198 $27,324,135 $12,493,783 $3,917,577 $7,173,419
Alabama .......................... 10,991,713 4,872,259 2,325,418 881,381 815,698 173,797 514,380 220,046 116,567 60,565 86,936Alaska .............................. 5,104,670 1,235,738 712,735 622,849 31,317 267,104 159,218 150,026 109,417 30,671 53,161Arizona ............................ 10,817,960 3,787,629 2,604,854 1,143,426 56,490 169,167 543,341 499,420 184,889 49,379 120,135Arkansas ......................... 6,480,997 2,509,087 1,583,327 698,315 341,661 135,913 246,981 171,002 127,412 42,177 52,061California ........................ 98,782,722 34,779,689 28,804,856 4,522,006 2,779,960 1,876,118 5,564,254 3,843,358 1,889,443 418,102 1,012,166
Colorado ......................... 8,902,394 3,945,360 2,081,070 795,945 145,831 157,835 235,366 353,435 118,442 43,517 52,487Connecticut..................... 11,735,554 2,888,367 2,814,660 712,059 974,436 71,502 365,838 465,481 237,643 90,506 105,413Delaware ......................... 2,925,526 961,679 463,249 256,913 58,416 44,425 152,191 112,563 88,158 9,230 48,433Florida ............................. 33,619,115 10,872,132 7,317,862 3,240,703 526,928 1,240,813 2,079,149 1,646,922 570,341 41,954 295,435Georgia............................ 18,588,949 7,932,766 4,623,301 1,227,547 651,520 355,078 637,639 816,825 251,852 111,791 149,775
Hawaii ............................. 5,229,112 1,548,266 914,957 269,998 181,127 75,358 305,725 105,997 64,562 35,017 8,618Idaho ................................ 3,082,521 1,360,952 528,432 346,443 37,358 115,013 68,235 97,560 41,698 22,622 30,435Illinois .............................. 30,091,928 8,773,134 9,377,244 2,434,886 797,307 266,138 1,512,257 873,100 531,245 195,182 294,643Indiana ............................ 14,422,131 6,141,653 3,155,092 1,532,451 206,466 159,810 401,790 377,538 179,572 87,864 145,747Iowa ................................. 8,182,909 3,262,640 1,710,357 1,046,032 518,934 203,593 178,610 184,142 130,178 52,445 60,942
Kansas............................. 6,679,811 2,960,968 1,101,686 995,807 321,986 159,063 242,856 195,443 104,865 19,173 40,085Kentucky ......................... 10,603,330 4,263,239 2,769,938 1,059,328 365,802 254,950 272,247 225,651 216,315 23,148 115,441Louisiana ........................ 12,590,706 4,347,932 2,976,403 858,290 1,106,628 318,513 387,843 384,368 118,388 62,508 166,195Maine ............................... 3,735,430 1,079,932 1,255,500 361,902 58,821 106,483 175,768 64,002 60,047 25,405 34,058Maryland ........................ 13,355,420 4,050,459 2,923,187 1,220,202 311,714 302,850 760,690 743,494 334,751 35,945 274,073
Massachusetts................ 22,789,668 4,492,012 5,998,677 1,803,223 896,689 227,954 1,285,098 729,089 329,758 63,848 287,109Michigan ......................... 31,643,604 13,811,857 6,440,111 1,935,622 1,448,596 401,096 1,957,679 1,240,703 268,565 192,005 229,261Minnesota ....................... 15,749,033 5,783,448 4,129,255 1,213,571 605,893 329,339 511,199 302,255 230,657 120,495 88,538Mississippi ...................... 7,436,968 2,724,296 1,657,877 718,420 380,099 168,063 242,541 230,472 65,781 46,166 52,324Missouri .......................... 11,751,078 4,386,693 2,898,138 1,151,756 480,455 230,651 551,261 312,039 187,573 54,917 130,094
Montana .......................... 2,729,248 1,014,273 509,929 340,020 32,655 109,983 135,250 66,232 81,182 6,065 30,181Nebraska......................... 4,320,072 1,513,604 975,644 573,918 286,905 130,391 215,763 93,638 68,740 23,377 42,758Nevada ............................. 4,024,021 1,538,772 653,102 399,888 61,659 56,969 78,560 150,718 114,153 35,874 39,218New Hampshire.............. 2,841,106 579,266 987,830 224,301 39,522 34,879 106,147 61,719 50,500 20,063 26,748New Jersey ...................... 26,035,016 7,749,529 6,744,113 1,811,523 993,930 162,647 593,636 874,753 347,068 101,680 258,512
New Mexico .................... 6,221,671 2,457,274 1,118,490 651,328 308,578 89,048 268,229 174,737 86,853 32,693 56,490New York ......................... 68,865,818 17,326,408 26,145,751 2,841,348 3,734,213 325,720 2,699,015 2,377,355 1,164,205 377,999 353,244North Carolina ............... 19,410,421 8,050,726 4,419,392 1,732,824 748,896 402,566 827,710 873,232 185,646 70,282 194,927North Dakota .................. 1,860,406 704,871 361,336 209,406 43,076 76,937 40,496 17,060 31,087 4,585 6,380Ohio ................................. 28,492,233 10,315,461 7,392,179 2,203,465 964,128 284,083 1,304,288 1,144,108 663,684 183,050 191,677
Oklahoma ....................... 7,911,728 3,475,725 1,658,383 831,958 283,127 132,691 309,846 296,108 181,996 37,401 51,211Oregon ............................. 9,632,720 3,473,191 2,115,652 932,933 443,076 238,580 365,736 291,162 411,855 49,733 120,392Pennsylvania................... 33,135,802 10,526,449 9,834,967 2,427,261 1,749,499 431,973 1,255,006 1,076,935 526,770 228,863 624,793Rhode Island .................. 3,400,206 885,633 881,807 210,095 89,839 28,056 241,935 116,224 69,234 33,982 29,724South Carolina ............... 10,683,485 3,832,467 2,554,452 615,953 597,611 171,254 710,015 391,366 132,221 59,671 140,200
See footnotes at end of table.

260The Book of the States 1998-99
REVENUE AND EXPENDITURE
STATE GENERAL EXPENDITURE, BY FUNCTION AND BY STATE: 1996 — Continued
Total Employmentgeneral Public Natural Financial security
State expenditure (a) Education welfare Highways Hospitals resources Health Corrections administration administration Police
South Dakota.................. 1,861,163 529,417 393,005 264,607 48,410 85,781 58,578 43,968 41,511 15,552 19,902Tennessee........................ 12,884,602 4,383,102 3,958,073 1,232,972 512,404 165,741 545,985 444,528 117,606 73,207 87,332Texas ................................ 41,518,628 17,049,364 10,635,810 3,562,728 1,899,361 643,479 1,179,941 2,351,414 488,293 232,584 291,539Utah ................................. 5,662,759 2,751,366 952,023 356,766 281,063 133,280 158,471 157,607 104,653 28,142 43,574Vermont ........................... 1,917,735 622,929 516,178 188,676 9,146 52,923 51,296 43,087 43,159 8,251 34,062
Virginia ........................... 16,306,733 6,430,222 2,916,450 2,010,700 1,090,825 137,836 522,502 808,911 380,303 78,488 312,921Washington ..................... 17,587,160 7,475,270 3,803,631 1,435,374 551,833 437,558 853,254 497,130 271,034 160,416 171,840West Virginia .................. 5,622,818 2,078,675 1,588,057 705,344 81,311 140,023 121,639 82,073 153,727 24,283 39,241Wisconsin........................ 15,251,343 5,323,972 3,193,480 1,172,157 438,162 496,259 530,720 513,291 186,173 81,600 61,004Wyoming ......................... 1,806,556 659,049 253,005 270,265 31,758 82,570 86,024 31,848 34,011 15,104 11,984
Source: U.S. Department of Commerce, Bureau of the Census.Note: Detail may not add to totals due to rounding.(a) Does not represent sum of state figures because total includes miscellaneous expenditures not shown.
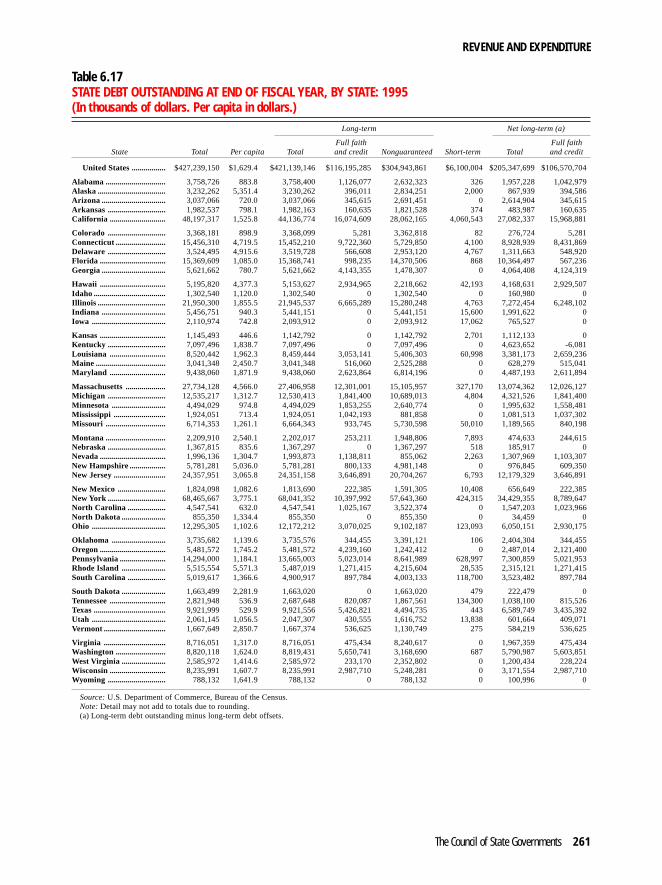
REVENUE AND EXPENDITURE
The Council of State Governments 261
Table 6.17STATE DEBT OUTSTANDING AT END OF FISCAL YEAR, BY STATE: 1995(In thousands of dollars. Per capita in dollars.)
Long-term Net long-term (a)
Full faith Full faithState Total Per capita Total and credit Nonguaranteed Short-term Total and credit
United States................. $427,239,150 $1,629.4 $421,139,146 $116,195,285 $304,943,861 $6,100,004 $205,347,699 $106,570,704
Alabama .............................. 3,758,726 883.8 3,758,400 1,126,077 2,632,323 326 1,957,228 1,042,979Alaska .................................. 3,232,262 5,351.4 3,230,262 396,011 2,834,251 2,000 867,939 394,586Arizona ................................ 3,037,066 720.0 3,037,066 345,615 2,691,451 0 2,614,904 345,615Arkansas ............................. 1,982,537 798.1 1,982,163 160,635 1,821,528 374 483,987 160,635California ............................ 48,197,317 1,525.8 44,136,774 16,074,609 28,062,165 4,060,543 27,082,337 15,968,881
Colorado ............................. 3,368,181 898.9 3,368,099 5,281 3,362,818 82 276,724 5,281Connecticut......................... 15,456,310 4,719.5 15,452,210 9,722,360 5,729,850 4,100 8,928,939 8,431,869Delaware ............................. 3,524,495 4,915.6 3,519,728 566,608 2,953,120 4,767 1,311,663 548,920Florida ................................. 15,369,609 1,085.0 15,368,741 998,235 14,370,506 868 10,364,497 567,236Georgia................................ 5,621,662 780.7 5,621,662 4,143,355 1,478,307 0 4,064,408 4,124,319
Hawaii ................................. 5,195,820 4,377.3 5,153,627 2,934,965 2,218,662 42,193 4,168,631 2,929,507Idaho .................................... 1,302,540 1,120.0 1,302,540 0 1,302,540 0 160,980 0Illinois .................................. 21,950,300 1,855.5 21,945,537 6,665,289 15,280,248 4,763 7,272,454 6,248,102Indiana ................................ 5,456,751 940.3 5,441,151 0 5,441,151 15,600 1,991,622 0Iowa ..................................... 2,110,974 742.8 2,093,912 0 2,093,912 17,062 765,527 0
Kansas................................. 1,145,493 446.6 1,142,792 0 1,142,792 2,701 1,112,133 0Kentucky ............................. 7,097,496 1,838.7 7,097,496 0 7,097,496 0 4,623,652 -6,081Louisiana ............................ 8,520,442 1,962.3 8,459,444 3,053,141 5,406,303 60,998 3,381,173 2,659,236Maine ................................... 3,041,348 2,450.7 3,041,348 516,060 2,525,288 0 628,279 515,041Maryland ............................ 9,438,060 1,871.9 9,438,060 2,623,864 6,814,196 0 4,487,193 2,611,894
Massachusetts.................... 27,734,128 4,566.0 27,406,958 12,301,001 15,105,957 327,170 13,074,362 12,026,127Michigan ............................. 12,535,217 1,312.7 12,530,413 1,841,400 10,689,013 4,804 4,321,526 1,841,400Minnesota ........................... 4,494,029 974.8 4,494,029 1,853,255 2,640,774 0 1,995,632 1,558,481Mississippi .......................... 1,924,051 713.4 1,924,051 1,042,193 881,858 0 1,081,513 1,037,302Missouri .............................. 6,714,353 1,261.1 6,664,343 933,745 5,730,598 50,010 1,189,565 840,198
Montana .............................. 2,209,910 2,540.1 2,202,017 253,211 1,948,806 7,893 474,633 244,615Nebraska............................. 1,367,815 835.6 1,367,297 0 1,367,297 518 185,917 0Nevada ................................. 1,996,136 1,304.7 1,993,873 1,138,811 855,062 2,263 1,307,969 1,103,307New Hampshire.................. 5,781,281 5,036.0 5,781,281 800,133 4,981,148 0 976,845 609,350New Jersey .......................... 24,357,951 3,065.8 24,351,158 3,646,891 20,704,267 6,793 12,179,329 3,646,891
New Mexico ........................ 1,824,098 1,082.6 1,813,690 222,385 1,591,305 10,408 656,649 222,385New York ............................. 68,465,667 3,775.1 68,041,352 10,397,992 57,643,360 424,315 34,429,355 8,789,647North Carolina ................... 4,547,541 632.0 4,547,541 1,025,167 3,522,374 0 1,547,203 1,023,966North Dakota ...................... 855,350 1,334.4 855,350 0 855,350 0 34,459 0Ohio ..................................... 12,295,305 1,102.6 12,172,212 3,070,025 9,102,187 123,093 6,050,151 2,930,175
Oklahoma ........................... 3,735,682 1,139.6 3,735,576 344,455 3,391,121 106 2,404,304 344,455Oregon ................................. 5,481,572 1,745.2 5,481,572 4,239,160 1,242,412 0 2,487,014 2,121,400Pennsylvania....................... 14,294,000 1,184.1 13,665,003 5,023,014 8,641,989 628,997 7,300,859 5,021,953Rhode Island ...................... 5,515,554 5,571.3 5,487,019 1,271,415 4,215,604 28,535 2,315,121 1,271,415South Carolina ................... 5,019,617 1,366.6 4,900,917 897,784 4,003,133 118,700 3,523,482 897,784
South Dakota...................... 1,663,499 2,281.9 1,663,020 0 1,663,020 479 222,479 0Tennessee............................ 2,821,948 536.9 2,687,648 820,087 1,867,561 134,300 1,038,100 815,526Texas .................................... 9,921,999 529.9 9,921,556 5,426,821 4,494,735 443 6,589,749 3,435,392Utah ..................................... 2,061,145 1,056.5 2,047,307 430,555 1,616,752 13,838 601,664 409,071Vermont ............................... 1,667,649 2,850.7 1,667,374 536,625 1,130,749 275 584,219 536,625
Virginia ............................... 8,716,051 1,317.0 8,716,051 475,434 8,240,617 0 1,967,359 475,434Washington ......................... 8,820,118 1,624.0 8,819,431 5,650,741 3,168,690 687 5,790,987 5,603,851West Virginia ...................... 2,585,972 1,414.6 2,585,972 233,170 2,352,802 0 1,200,434 228,224Wisconsin............................ 8,235,991 1,607.7 8,235,991 2,987,710 5,248,281 0 3,171,554 2,987,710Wyoming ............................. 788,132 1,641.9 788,132 0 788,132 0 100,996 0
Source: U.S. Department of Commerce, Bureau of the Census.Note: Detail may not add to totals due to rounding.(a) Long-term debt outstanding minus long-term debt offsets.

REVENUE AND EXPENDITURE
262 The Book of the States 1998-99
Table 6.18STATE DEBT OUTSTANDING AT END OF FISCAL YEAR, BY STATE: 1996(Amounts in thousands. Per capita amounts in dollars)
Long-term Net long-term (a)
Full faith Full faithState Total Per capita Total and credit Nonguaranteed Short-term Total and credit
United States............. $447,338,625 $1,689.7 $441,489,253 $118,548,901 $322,940,352 $5,849,372 $219,392,199 $108,955,012
Alabama .......................... 3,645,292 853.1 3,645,072 974,664 2,670,408 220 1,819,828 910,070Alaska .............................. 3,176,601 5,233.2 3,176,601 377,896 2,798,705 0 808,150 377,295Arizona ............................ 2,936,004 663.0 2,936,004 301,425 2,634,579 0 2,602,831 301,425Arkansas ......................... 2,142,271 853.6 2,142,206 255,095 1,887,111 65 608,042 255,095California ........................ 45,859,003 1,438.6 45,783,280 15,393,644 30,389,636 75,723 26,682,703 15,340,475
Colorado ......................... 3,576,722 935.7 3,576,676 5,051 3,571,625 46 338,497 5,051Connecticut..................... 16,415,336 5,013.5 16,415,336 10,347,478 6,067,858 0 9,402,136 8,929,660Delaware ......................... 4,278,539 5,902.7 4,274,006 577,409 3,696,597 4,533 1,337,946 560,431Florida ............................. 15,514,762 1,077.4 15,514,181 932,425 14,581,756 581 10,094,494 542,039Georgia ............................ 6,199,913 843.2 6,199,913 4,748,370 1,451,543 0 4,632,758 4,729,340
Hawaii ............................. 5,116,982 4,322.8 5,077,089 2,869,639 2,207,450 39,893 4,075,220 2,861,770Idaho ................................ 1,453,555 1,222.2 1,453,460 0 1,453,460 95 177,026 0Illinois .............................. 22,676,430 1,914.2 22,672,238 6,978,280 15,693,958 4,192 7,891,502 6,449,531Indiana ............................ 6,116,873 1,047.3 6,066,498 0 6,066,498 50,375 2,329,174 0Iowa ................................. 2,064,507 723.9 2,044,997 0 2,044,997 19,510 778,979 0
Kansas............................. 1,161,470 451.6 1,148,738 0 1,148,738 12,732 1,130,313 0Kentucky ......................... 7,030,482 1,810.2 7,030,482 0 7,030,482 0 4,478,448 -17,717Louisiana ........................ 7,452,387 1,713.0 7,433,803 2,713,146 4,720,657 18,584 3,062,684 2,312,999Maine ............................... 3,159,694 2,541.3 3,159,694 515,690 2,644,004 0 608,680 489,360Maryland ........................ 9,690,915 1,910.8 9,690,915 2,864,730 6,826,185 0 4,632,740 2,851,104
Massachusetts................ 29,294,682 4,808.4 28,452,415 13,177,261 15,275,154 842,267 13,936,021 12,861,213Michigan ......................... 13,667,509 1,424.5 13,657,460 1,806,000 11,851,460 10,049 4,281,976 1,806,000Minnesota ....................... 4,858,281 1,043.1 4,858,281 2,118,665 2,739,616 0 2,249,560 1,820,241Mississippi ...................... 2,232,015 821.8 2,232,015 1,260,659 971,356 0 1,292,712 1,252,110Missouri .......................... 7,128,377 1,330.2 7,122,297 896,935 6,225,362 6,080 1,158,766 804,766
Montana .......................... 2,244,202 2,552.1 2,135,755 206,500 1,929,255 108,447 448,325 203,174Nebraska......................... 1,401,777 848.5 1,401,269 0 1,401,269 508 150,016 0Nevada ............................. 2,258,523 1,408.8 2,253,291 1,311,776 941,515 5,232 1,481,938 1,288,571New Hampshire.............. 5,832,969 5,017.7 5,832,969 793,259 5,039,710 0 978,031 619,016New Jersey ...................... 25,601,576 3,205.0 25,595,465 3,688,361 21,907,104 6,111 17,686,694 3,688,361
New Mexico .................... 2,146,696 1,252.9 2,119,569 208,379 1,911,190 27,127 735,028 208,379New York ......................... 73,121,852 4,021.0 72,649,281 10,541,391 62,107,890 472,571 36,459,165 8,851,728North Carolina ............... 4,513,348 616.3 4,513,348 951,082 3,562,266 0 1,491,789 951,082North Dakota .................. 819,003 1,272.7 818,053 0 818,053 950 28,881 0Ohio ................................. 12,627,741 1,130.2 12,496,508 3,078,675 9,417,833 131,233 6,458,883 2,932,896
Oklahoma ....................... 3,889,324 1,178.3 3,889,240 334,655 3,554,585 84 2,510,000 334,655Oregon ............................. 6,086,273 1,899.7 6,086,273 3,718,583 2,367,690 0 2,762,087 1,925,979Pennsylvania................... 15,045,892 1,248.0 14,545,182 5,039,631 9,505,551 500,710 7,404,328 5,038,570Rhode Island .................. 5,505,683 5,560.0 5,482,148 1,119,523 4,362,625 23,535 2,227,797 1,119,523South Carolina ............... 5,324,200 1,439.5 5,086,880 1,006,371 4,080,509 237,320 3,690,007 1,006,371
South Dakota.................. 1,704,133 2,326.8 1,703,675 0 1,703,675 458 244,681 0Tennessee........................ 3,069,027 576.9 2,917,332 908,729 2,008,603 151,695 1,112,870 906,681Texas ................................ 14,575,675 762.0 11,653,429 6,002,761 5,650,668 2,922,246 8,366,820 3,995,087Utah ................................. 2,464,177 1,231.8 2,446,787 413,185 2,033,602 17,390 712,463 386,558Vermont ........................... 1,717,898 2,918.3 1,716,588 479,245 1,237,343 1,310 528,080 479,245
Virginia ........................... 8,792,968 1,317.2 8,792,968 523,177 8,269,791 0 2,135,897 523,177Washington ..................... 8,991,106 1,625.0 8,990,439 5,831,123 3,159,316 667 5,979,681 5,780,901West Virginia .................. 2,830,217 1,550.2 2,823,384 190,115 2,633,269 6,833 1,324,261 184,882Wisconsin........................ 9,126,746 1,768.8 8,976,746 3,087,918 5,888,828 150,000 3,965,155 3,087,918Wyoming ......................... 799,017 1,659.8 799,017 0 799,017 0 98,136 0
Source: U.S. Department of Commerce, Bureau of the Census.Note: Detail may not add to totals due to rounding.(a) Long-term debt outstanding minus long-term debt offsets.

TAXES
The Council of State Governments 263
Table 6.19AGENCIES ADMINISTERING MAJOR STATE TAXES(As of January 1998)
State or otherjurisdiction Income Sales Gasoline Motor vehicle
Alabama ...................... Dept. of Revenue Dept. of Revenue Dept. of Revenue Dept. of RevenueAlaska .......................... Dept. of Revenue . . . Dept. of Revenue Dept. of Public SafetyArizona ........................ Dept. of Revenue Dept. of Revenue Dept. of Transportation Dept. of TransportationArkansas ..................... Dept. of Fin. & Admin. Dept. of Fin. & Admin. Dept. of Fin. & Admin. Dept. of Fin. & Admin.California .................... Franchise Tax Bd. Bd. of Equalization Bd. of Equalization Dept. of Motor Vehicles
Colorado ..................... Dept. of Revenue Dept. of Revenue Dept. of Revenue Dept. of RevenueConnecticut................. Dept. of Revenue Serv. Dept. of Revenue Serv. Dept. of Revenue Serv. Dept. of Motor VehiclesDelaware ..................... Div. of Revenue . . . Dept. of Public Safety Dept. of Public SafetyFlorida ......................... Dept. of Revenue Dept. of Revenue Dept. of Revenue Dept. of Motor VehiclesGeorgia........................ Dept. of Revenue Dept. of Revenue Dept. of Revenue Dept. of Revenue
Hawaii ......................... Dept. of Taxation Dept. of Taxation Dept. of Taxation County TreasurerIdaho ............................ Dept. of Revenue & Tax. Dept. of Revenue & Tax. Dept. of Revenue & Tax. Dept. of TransportationIllinois .......................... Dept. of Revenue Dept. of Revenue Dept. of Revenue Secretary of StateIndiana ........................ Dept. of Revenue Dept. of Revenue Dept. of Revenue Bur. of Motor VehiclesIowa ............................. Dept. of Revenue & Finance Dept. of Revenue & Finance Dept. of Revenue & Finance Local (a)
Kansas......................... Dept. of Revenue Dept. of Revenue Dept. of Revenue Local (a)Kentucky ..................... Revenue Cabinet Revenue Cabinet Revenue Cabinet Transportation CabinetLouisiana .................... Dept. of Revenue & Tax. Dept. of Revenue & Tax. Dept. of Revenue & Tax. Dept. of Public SafetyMaine ........................... Bur. of Taxation Bur. of Taxation Bur. of Taxation Secretary of StateMaryland .................... Comptroller Comptroller Comptroller Dept. of Transportation
Massachusetts............ Dept. of Revenue Dept. of Revenue Dept. of Revenue Reg. of Motor VehiclesMichigan ..................... Dept. of Treasury Dept. of Treasury Dept. of Treasury Secretary of StateMinnesota ................... Dept. of Revenue Dept. of Revenue Dept. of Revenue Dept. of Public SafetyMississippi .................. Tax Comm. Tax Comm. Tax Comm. Tax Comm.Missouri ...................... Dept. of Revenue Dept. of Revenue Dept. of Revenue Dept. of Revenue
Montana ...................... Dept. of Revenue . . . Dept. of Revenue Local (a)Nebraska..................... Dept. of Revenue Dept. of Revenue Dept. of Revenue Dept. of Motor VehiclesNevada ......................... . . . Dept. of Taxation Dept. of Taxation Dept. of Motor VehiclesNew Hampshire.......... Dept. of Revenue Admin. . . . Dept. of Safety Dept. of SafetyNew Jersey .................. Dept. of Treasury Dept. of Treasury Dept. of Treasury Dept. of Law & Public Safety
New Mexico ................ Tax & Revenue Dept. Tax & Revenue Dept. Tax & Revenue Dept. Tax & Revenue Dept.New York ..................... Dept. of Tax. & Finance Dept. of Tax. & Finance Dept. of Tax. & Finance Dept. of Motor VehiclesNorth Carolina ........... Dept. of Revenue Dept. of Revenue Dept. of Revenue Dept. of TransportationNorth Dakota .............. Tax. Commr. Tax Commr. Tax Commr. Dept. of TransportationOhio ............................. Dept. of Taxation State Treasurer Dept. of Taxation Bur. of Motor Vehicles
Oklahoma ................... Tax Comm. Tax Comm. Tax Comm. Tax Comm.Oregon ......................... Dept. of Revenue . . . Dept. of Transportation Dept. of TransportationPennsylvania............... Dept. of Revenue Dept. of Revenue Dept. of Revenue Dept. of TransportationRhode Island .............. Dept. of Administration Dept. of Administration Dept. of Administration Dept. of TransportationSouth Carolina ........... Dept. of Revenue Dept. of Revenue Dept. of Revenue Dept. of Revenue
South Dakota.............. . . . Dept. of Revenue Dept. of Revenue Dept. of Motor VehiclesTennessee.................... Dept. of Revenue Dept. of Revenue Dept. of Revenue Dept. of RevenueTexas ............................ . . . Comptroller Comptroller Dept. of Hwys. & Public Trans.Utah ............................. Tax Comm. Tax Comm. Tax Comm. Tax Comm.Vermont ....................... Commr. of Taxes Commr. of Taxes Commr. of Motor Vehicles Commr. of Motor Vehicles
Virginia ....................... Dept. of Taxation Dept. of Taxation Dept. of Motor Vehicles Dept. of Motor VehiclesWashington ................. . . . Dept. of Revenue Dept. of Licensing Dept. of LicensingWest Virginia .............. Dept. of Tax & Revenue Dept. of Tax & Revenue Dept. of Tax & Revenue Dept. of Motor VehiclesWisconsin.................... Dept. of Revenue Dept. of Revenue Dept. of Revenue Dept. of TransportationWyoming ..................... . . . Dept. of Revenue Dept. of Revenue Dept. of Revenue
Dist. of Columbia ....... Dept. of Fin. & Revenue Dept. of Fin. & Revenue Dept. of Fin. & Revenue Dept. of Fin. & Revenue
See footnotes at end of table.
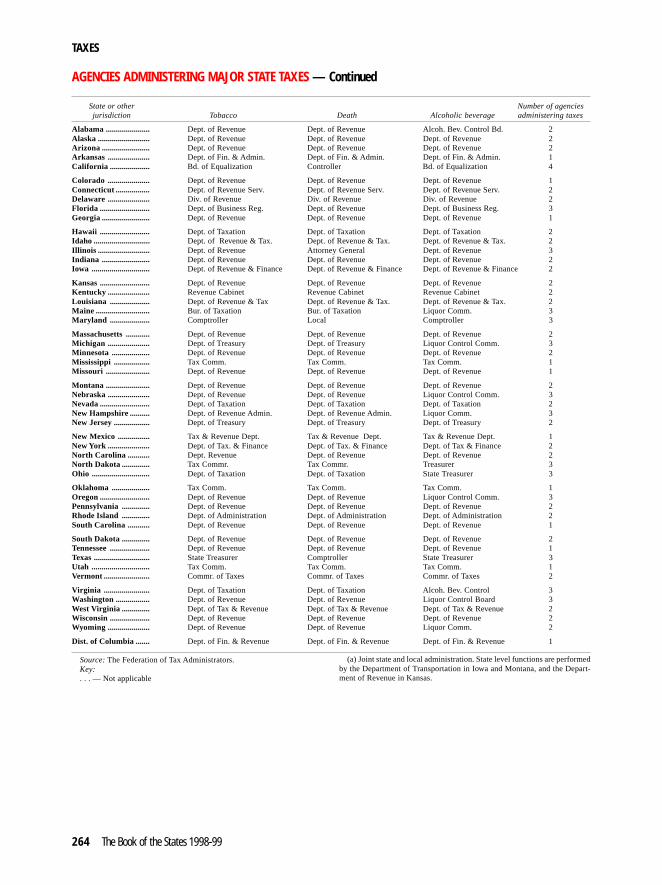
TAXES
264 The Book of the States 1998-99
AGENCIES ADMINISTERING MAJOR STATE TAXES — Continued
State or other Number of agenciesjurisdiction Tobacco Death Alcoholic beverage administering taxes
Alabama ...................... Dept. of Revenue Dept. of Revenue Alcoh. Bev. Control Bd. 2Alaska .......................... Dept. of Revenue Dept. of Revenue Dept. of Revenue 2Arizona ........................ Dept. of Revenue Dept. of Revenue Dept. of Revenue 2Arkansas ..................... Dept. of Fin. & Admin. Dept. of Fin. & Admin. Dept. of Fin. & Admin. 1California .................... Bd. of Equalization Controller Bd. of Equalization 4
Colorado ..................... Dept. of Revenue Dept. of Revenue Dept. of Revenue 1Connecticut................. Dept. of Revenue Serv. Dept. of Revenue Serv. Dept. of Revenue Serv. 2Delaware ..................... Div. of Revenue Div. of Revenue Div. of Revenue 2Florida ......................... Dept. of Business Reg. Dept. of Revenue Dept. of Business Reg. 3Georgia........................ Dept. of Revenue Dept. of Revenue Dept. of Revenue 1
Hawaii ......................... Dept. of Taxation Dept. of Taxation Dept. of Taxation 2Idaho ............................ Dept. of Revenue & Tax. Dept. of Revenue & Tax. Dept. of Revenue & Tax. 2Illinois .......................... Dept. of Revenue Attorney General Dept. of Revenue 3Indiana ........................ Dept. of Revenue Dept. of Revenue Dept. of Revenue 2Iowa ............................. Dept. of Revenue & Finance Dept. of Revenue & Finance Dept. of Revenue & Finance 2
Kansas......................... Dept. of Revenue Dept. of Revenue Dept. of Revenue 2Kentucky ..................... Revenue Cabinet Revenue Cabinet Revenue Cabinet 2Louisiana .................... Dept. of Revenue & Tax Dept. of Revenue & Tax. Dept. of Revenue & Tax. 2Maine ........................... Bur. of Taxation Bur. of Taxation Liquor Comm. 3Maryland .................... Comptroller Local Comptroller 3
Massachusetts............ Dept. of Revenue Dept. of Revenue Dept. of Revenue 2Michigan ..................... Dept. of Treasury Dept. of Treasury Liquor Control Comm. 3Minnesota ................... Dept. of Revenue Dept. of Revenue Dept. of Revenue 2Mississippi .................. Tax Comm. Tax Comm. Tax Comm. 1Missouri ...................... Dept. of Revenue Dept. of Revenue Dept. of Revenue 1
Montana ...................... Dept. of Revenue Dept. of Revenue Dept. of Revenue 2Nebraska..................... Dept. of Revenue Dept. of Revenue Liquor Control Comm. 3Nevada......................... Dept. of Taxation Dept. of Taxation Dept. of Taxation 2New Hampshire.......... Dept. of Revenue Admin. Dept. of Revenue Admin. Liquor Comm. 3New Jersey.................. Dept. of Treasury Dept. of Treasury Dept. of Treasury 2
New Mexico ................ Tax & Revenue Dept. Tax & Revenue Dept. Tax & Revenue Dept. 1New York ..................... Dept. of Tax. & Finance Dept. of Tax. & Finance Dept. of Tax & Finance 2North Carolina ........... Dept. Revenue Dept. of Revenue Dept. of Revenue 2North Dakota .............. Tax Commr. Tax Commr. Treasurer 3Ohio ............................. Dept. of Taxation Dept. of Taxation State Treasurer 3
Oklahoma ................... Tax Comm. Tax Comm. Tax Comm. 1Oregon ......................... Dept. of Revenue Dept. of Revenue Liquor Control Comm. 3Pennsylvania .............. Dept. of Revenue Dept. of Revenue Dept. of Revenue 2Rhode Island .............. Dept. of Administration Dept. of Administration Dept. of Administration 2South Carolina ........... Dept. of Revenue Dept. of Revenue Dept. of Revenue 1
South Dakota.............. Dept. of Revenue Dept. of Revenue Dept. of Revenue 2Tennessee.................... Dept. of Revenue Dept. of Revenue Dept. of Revenue 1Texas ............................ State Treasurer Comptroller State Treasurer 3Utah ............................. Tax Comm. Tax Comm. Tax Comm. 1Vermont ....................... Commr. of Taxes Commr. of Taxes Commr. of Taxes 2
Virginia ....................... Dept. of Taxation Dept. of Taxation Alcoh. Bev. Control 3Washington ................. Dept. of Revenue Dept. of Revenue Liquor Control Board 3West Virginia .............. Dept. of Tax & Revenue Dept. of Tax & Revenue Dept. of Tax & Revenue 2Wisconsin .................... Dept. of Revenue Dept. of Revenue Dept. of Revenue 2Wyoming ..................... Dept. of Revenue Dept. of Revenue Liquor Comm. 2
Dist. of Columbia ....... Dept. of Fin. & Revenue Dept. of Fin. & Revenue Dept. of Fin. & Revenue 1
Source: The Federation of Tax Administrators.Key:. . . — Not applicable
(a) Joint state and local administration. State level functions are performedby the Department of Transportation in Iowa and Montana, and the Depart-ment of Revenue in Kansas.

TAXES
The Council of State Governments 265
Table 6.20STATE TAX AMNESTY PROGRAMSNovember 22, 1982 - Present
Major Accounts InstallmentState or other Legislative taxes receivable Collections arrangementsjurisdiction Amnesty period authorization covered included ($ millions) (a) permitted (b)
Alabama .............................. 01/20/84 - 04/01/84 No (c) All No 3.2 No
Arizona ................................ 11/22/82 - 01/20/83 No (c) All No 6.0 Yes
Arkansas ............................. 09/01/87 - 11/30/87 Yes All No 1.7 Yes
California ............................ 12/10/84 - 03/15/85 Yes Individual income Yes 154.0 Yes.............................................. Yes Sales No 43.0 Yes
Colorado ............................. 09/16/85 - 11/15/85 Yes All No 6.4 Yes
Connecticut......................... 09/01/90 - 11/30/90 Yes All Yes 54.0 Yes..............................................09/01/95 - 11/30/95 Yes All Yes 46.2 Yes
Florida ................................. 01/01/87 - 06/30/87 Yes Intangibles No 13.0 No..............................................01/01/88 - 06/30/88 Yes (d) All No 8.4 (d) No
Georgia................................ 10/01/92 - 12/05/92 Yes All Yes 51.3 No
Idaho .................................... 05/20/83 - 08/30/83 No (c) Individual income No 0.3 No
Illinois .................................. 10/01/84 - 11/30/84 Yes All Yes 160.5 No
Iowa .....................................09/02/86 - 10/31/86 Yes All Yes 35.1 N.A.
Kansas................................. 07/01/84 - 09/30/84 Yes All No 0.6 No
Kentucky ............................. 09/15/88 - 09/30/88 Yes (c) All No 61.1 No
Louisiana ............................ 10/01/85 - 12/31/85 Yes All No 1.2 Yes (e)..............................................10/01/87 - 12/15/87 Yes All No 0.3 Yes (e)
Maine ................................... 11/01/90 - 12/31/90 Yes All Yes 29.0 Yes
Maryland ............................ 09/01/87 - 11/02/87 Yes All Yes 34.6 (f) No
Massachusetts.................... 10/17/83 - 01/17/84 Yes All Yes 86.5 Yes (g)
Michigan ............................. 05/12/86 - 06/30/86 Yes All Yes 109.8 No
Minnesota ........................... 08/01/84 - 10/31/84 Yes All Yes 12.1 No
Mississippi .......................... 09/01/86 - 11/30/86 Yes All No 1.0 No
Missouri .............................. 09/01/83 - 10/31/83 No (c) All No 0.9 No
New Jersey ..........................09/10/87 - 12/08/87 Yes All Yes 186.5 Yesnow is..............................................03/15/96 - 06/01/96 Yes All Yes 359.0 No
New Mexico ........................ 08/15/85 - 11/13/85 Yes (j) All (h) No 13.6 Yes
New York ............................. 11/01/85 - 01/31/86 Yes (j) All (i) Yes 401.3 YesNow is 11/01/96 - 01/31/97 Yes All Yes N.A. Yes(j)
North Carolina ................... 09/01/89 - 12/01/89 Yes (k) All (k) Yes 37.6 No
North Dakota ...................... 09/01/83 - 11/30/83 No (c) All No 0.2 Yes
Oklahoma ........................... 07/01/84 - 12/31/84 Yes Income, Sales Yes 13.9 No (l)
Pennsylvania....................... 10/13/95 - 01/10/96 Yes All Yes N.A. No
Rhode Island ...................... 10/15/86 - 01/12/87 Yes All No 0.7 Yesnow is 04/15/96 - 06/28/96 Yes All Yes 7.9 Yes
South Carolina ................... 09/01/85 - 11/30/85 Yes All Yes 7.1 Yes
Texas ....................................02/01/84 - 02/29/84 No (c) (m) All (m) No 0.5 No
Vermont ............................... 05/15/90 - 06/25/90 Yes All Yes 1.0 (n) No
Virginia ............................... 02/01/90 - 03/31/90 Yes All Yes 32.2 No
West Virginia ...................... 10/01/86 - 12/31/86 Yes All Yes 15.9 Yes
Wisconsin............................ 09/15/85 - 11/22/85 Yes All Yes (o) 27.3 Yes
Dist. of Columbia ............... 07/01/87 - 09/30/87 Yes All Yes 24.3 Yes..............................................07/10/95 - 08/31/95 Yes All N.A. 19.5 No (p)
Source: The Federation of Tax Administrators, January 1997.Key:N.A. — Not available(a) Where applicable, figure indicates local portions of certain taxes col-
lected under the state tax amnesty program.(b) “No” indicates requirement of full payment by the expiration of the
amnesty period. “Yes” indicates allowance of full payment after the expira-tion of the amnesty period.
(c) Authority for amnesty derived from pre-existing statutory powers per-mitting the waiver of tax penalties.
(d) Does not include intangibles tax and drug taxes. Gross collections to-taled $22.1 million, with $13.7 million in penalties withdrawn.
(e) Amnesty taxpayers were billed for the interest owed, with payment duewithin 30 days of notification.
(f) Figure includes $1.1 million for the separate program conducted by theDepartment of Natural Resources for the boat excise tax.
(g) The amnesty statute was construed to extend the amnesty to those whoapplied to the department before the end of the amnesty period, and permittedthem to file overdue returns and pay back taxes and interest at a later date.

TAXES
266 The Book of the States 1998-99
(h) The severance taxes, including the six oil and gas severance taxes, theresources excise tax, the corporate franchise tax, and the special fuels taxwere not subject to amnesty.
(i) Availability of amnesty for the corporation tax, the oil company taxes,the transporation and transmissions companies tax, the gross receipts oil taxand the unincorporated business tax restricted to entities with 500 orfeweremployees in the United States on the date of application. In addition, atax payer principally engaged in aviation, or a utility subject to the supervi-sion of the State Department of Public Service was also ineligible.
(j) Installment arrangements were permitted if applicant demonstrated thatpayment would present a severe financial hardship.
STATE TAX AMNESTY PROGRAMS — Continued
(k) Local taxes and real property taxes were not included.(l) Full payment of tax liability required before the end of the amnesty
period to avoid civil penalties.(m) Texas does not impose a corporate or individual income tax. In practi-
cal effect, the amnesty was limited to the sales tax and other excises.(n) Preliminary figure.(o) Waiver terms varied depending upon the date the tax liability was ac-
cessed.(p) Does not include real property taxes. All interest was waived on tax
payments made before July 31, 1995. After this date, only 50% of the interestwas waived..

TAXES
The Council of State Governments 267
Table 6.21STATE EXCISE TAX RATES(As of January 1, 1998)
General sales Cigarettes (a) DistilledState or other and gross receipts tax (cents per spirits (b)
jurisdiction (percent) pack of 20) ($ per gallon) Gasoline Diesel
Alabama .............................. 4 16.5 . . . 16 17Alaska .................................. . . . 100 5.60 (d) 8 8Arizona ............................... 5 58 3.00 18 18Arkansas ............................. 4.625 31.5 2.50 (e) 18.5 18.5California ............................ 6 (f) 37 3.30 (g) 18 18
Colorado ............................. 3 20 2.28 22 20.5Connecticut ........................ 6 50 4.50 (h) 36 18Delaware ............................ . . . 24 3.75 (i) 23 (j) 22 (j)Florida ................................. 6 33.9 6.50 (k) 4 (l) 4 (l)Georgia ............................... 4 12 3.79 (m) 7.5 7.5
Hawaii ................................. 4 100 5.92 16 16Idaho .................................... 5 28 . . . 25 (n) 25Illinois .................................. 6.25 (o) 58 2.00 (p) 19 21.5Indiana ................................. 5 15.5 2.68 (q) 15 16Iowa ..................................... 5 36 . . . 20 22.5
Kansas ................................. 4.9 24 2.50 (r) 18 20Kentucky ............................. 6 3 (s) 1.92 (t) 15 (u) 12Louisiana ............................. 4 20 2.50 (v) 20 20Maine ................................... 6 74 . . . 19 20Maryland ............................ 5 36 1.50 23.5 24.25
Massachusetts.................... 5 76 4.05 (w) 21 (x) 21Michigan ............................. 6 75 . . . 19 15Minnesota ........................... 6.5 (o) 48 5.03 (y) 20 20Mississippi ........................... 7 18 . . . 18 18Missouri .............................. 4.225 17 2.00 17 17
Montana .............................. . . . 18 . . . 27 27.75Nebraska............................. 5 34 3.00 24.6 (j) 24.6 (j)Nevada ................................ 6.5 35 2.05 (z) 23 27New Hampshire ................. . . . 37 . . . 18 18New Jersey......................... 6 80 4.40 10.5 13.5
New Mexico ....................... 5 21 6.06 17 18New York ............................ 4 56 6.44 (aa) 8 8North Carolina .................. 4 5 . . . 22.6 22.6North Dakota ..................... 5 44 2.50 (bb) 20 20Ohio ...................................... 5 24 . . . 22 22
Oklahoma ............................ 4.5 23 5.56 (cc) 16 13Oregon ............................... . . . 68 . . . 24 24Pennsylvania ....................... 6 31 . . . 12 12Rhode Island ....................... 7 71 3.75 28 (dd) 28South Carolina ................... 5 7 2.72 (ee) 16 16
South Dakota ...................... 4 33 3.93 (ff) 21 21Tennessee............................ 6 13 (gg) 4.00 (hh) 20 17Texas .................................... 6.25 41 2.40 (ii) 20 20Utah ..................................... 4.75 51.5 . . . 24.5 24.5Vermont .............................. 5 44 . . . 19 (jj) 16 (jj)
Virginia ............................... 3.5 2.5 . . . 17.5 (kk) 16 (kk)Washington .......................... 6.5 82.5 . . . 23 23West Virginia ...................... 6 17 . . . 20.5 20.5Wisconsin ............................ 5 59 3.25 24.8 (j) 24.8Wyoming ............................. 4 (ll) 12 . . . 8 8
Dist. of Columbia ............... 5.75 65 1.50 (mm) 20 20
Motor fuel (c)(cents per gallon)

TAXES
268 The Book of the States 1998-99
Source: The Federation of Tax Administrators.Key:. . . — Tax is not applicable.(a) Counties and cities may impose an additional tax on a pack of cigarettes
in the following states: Alabama, 1 to 6 cents; Illinois, 10 to 15 cents; Mis-souri, 4 to 7 cents; Tennessee, 1 cent; and Virginia 2 to 15 cents.
(b) Eighteen states have liquor monopoly systems. In Alabama, Idaho,Iowa, Maine, Michigan, Mississippi, Montana, New Hampshire, Ohio,Oregon, Pennsylvania, Utah, Vermont, Virginia, Washington, West Virginiaand Wyoming, the state operates retail/wholesale liquor outlets. In North Caro-lina, liquor stores are operated by county boards. Tax rates in these statescannot be compared to others, since revenue is generated from various taxes,fees and net liquor profits. Only gallonage taxes imposed by states with alicense system are reported in the table.
(c) Tax rates do not include the following local option taxes: Alabama 1to 3 cents; California, 1 cent; Hawaii, 8 to 11.5 cents; Illinois, 5 cents inChicago and 6 cents in Cook County (gasoline only); Nevada, 1 to 10 cents;Oregon, 1 to 2 cents; South Dakota, 1 cent; Tennessee, 1 cent; and Virginia,2 percent. In the following states, carriers pay an additional surcharge:Arizona, 8 cents; Illinois, 6.3 cents (gasoline) and 6 cents (diesel); Indiana,11 cents; Kentucky, 2 percent (gasoline) and 4.7 percent (diesel); New York,22.21 cents (gasoline) and 23.21 cents (diesel); and Pennsylvania, 6 cents.
(d) Under 21%, $0.85/gallon(e) Under 5%, $0.50/gallon; under 21%, $1.00 gallon. Additional 20 cents
per case and 3% off-premise or 14% on-premise sales taxes are imposed.(f) Includes a 0.5% temporary tax pending a judicial ruling on school
finance.(g) Over 50%, $6.60/gallon.(h) Under 7%, $2.05/gallon.(i) Under 25%, $2.50/gallon.(j) Portion of the rate is adjustable based on maintenance costs, sales vol-
ume, or cost of fuel to state government.(k) Under 17.259%, $2.25/gallon; over 55.78%, $9.53/gallon. An addi-
tional 10-cents-per ounce on-premise tax is imposed.(l) An additional tax is imposed equal to two-thirds of the local rate for
gasoline and 50% for diesel. Local rates vary from 1 to 7 cents.(m) Local tax of $0.83/gallon.(n) Tax rate is reduced by the percentage of ethanol used in blending
(reported rate assumes the maximum 10% ethanol).(o) 1.25% of the tax in Illinois and 0.5% in Minnesota are distributed to
local governments.
STATE EXCISE TAX RATES — Continued
(p) Under 14%, $0.23/gallon. An additional $0.50/gallon in Chicago and$2.00/gallon in Cook County.
(q) Under 15%, $0.47/gallon.(r) Additional 8 percent off-premise or 10% on-premise retail tax is im-
posed.(s) Dealers pay an additional enforcement and administrative fee of 0.1
cent per pack.(t) Under 6%, $0.25/gallon. Additional 5 cents per case and 9% wholesale
taxes are imposed.(u) Tax rate is based on the average wholesale price and is adjusted quar-
terly. The actual rate is 9%.(v) Under 6%, $0.32/gallon.(w) Under 15%, $1.10/gallon; over 50% alcohol, $4.05/proof/gallon. An
additional 0.57% on private club sales.(x) Tax rate is based on the average wholesale price and is adjusted quar-
terly. The actual rate is 19.1%.(y) An additional one cent per bottle tax is imposed on all liquor except
miniatures.(z) Under 14%, $0.40/gallon; and under 21%, $0.75/gallon.(aa) Under 24%, $2.54/gallon. An additional $1.00/gallon in New York
City.(bb) 7% state sales tax.(cc) Additional $1.00 per bottle and 12% gross receipts taxes are imposed
on all on-premise sales.(dd) Tax rate is based on the average wholesale price and is adjusted
quarterly. The actual rate is 13%.(ee) Additional $5.36 per case tax and a 9% surtax are imposed on all
liquor sales.(ff) Under 14%, $0.93/gallon. An additional 2% wholesale tax is imposed.(gg) Dealers pay an additional enforcement and administrative fee of 0.05
cents per pack.(hh) Under 7%, $1.10/gallon. Additional 15 cents per case and 15 percent
(on-premise sales) taxes are imposed.(ii) Additional 14% (on-premise sales) and 5 cents per drink (airline sales)
taxes are imposed.(jj) Large trucks pay a higher tax, totaling 25 cents per gallon.(kk) Large trucks pay an additional 3.5 cents per gallon.(ll) Tax rate may be adjusted annually according to a formula based on
balances in the unappropriated general fund and the school foundation fund.(mm) An additional 8% off-premise or 9% on-premise sales tax is im-
posed.

TAXES
The Council of State Governments 269
Table 6.22FOOD AND DRUG SALES TAX EXEMPTIONS(As of January 1, 1998)
ExemptionsState or other Tax rate
jurisdiction (percentage) Food (a) Prescription drugs Nonprescription drugs
Alabama .............................. 4 . . . ★ . . .Alaska .................................. none . . . . . . . . .Arizona ............................... 5 ★ ★ . . .Arkansas ............................. 4.625 . . . ★ . . .California ............................ 6 (b) ★ ★ . . .
Colorado ............................. 3 ★ ★ . . .Connecticut ........................ 6 ★ ★ . . .Delaware ............................ none . . . . . . . . .Florida ................................. 6 ★ ★ ★Georgia ............................... 4 (c) ★ . . .
Hawaii ................................. 4 . . . ★ . . .Idaho .................................... 5 . . . ★ . . .Illinois .................................. 6.25 (d) (e) (e) (e)Indiana ................................. 5 ★ ★ . . .Iowa ..................................... 5 ★ ★ . . .
Kansas ................................. 4.9 . . . ★ . . .Kentucky ............................. 6 ★ ★ . . .Louisiana ............................. 4 (f) ★ . . .Maine ................................... 6 ★ ★ . . .Maryland ............................ 5 ★ ★ ★
Massachusetts.................... 5 ★ ★ . . .Michigan ............................. 6 ★ ★ . . .Minnesota ........................... 6.5 (d) ★ ★ ★Mississippi ........................... 7 . . . ★ . . .Missouri .............................. 4.225 (g) ★ . . .
Montana .............................. none . . . . . . . . .Nebraska............................. 5 ★ ★ . . .Nevada ................................ 6.5 ★ ★ . . .New Hampshire ................. none . . . . . . . . .New Jersey......................... 6 ★ ★ ★
New Mexico ....................... 5 . . . . . . . . .New York ............................ 4 ★ ★ ★North Carolina .................. 4 . . . ★ . . .North Dakota ..................... 5 ★ ★ . . .Ohio ...................................... 5 ★ ★ . . .
Oklahoma ............................ 4.5 . . . ★ . . .Oregon ................................ none . . . . . . . . .Pennsylvania ....................... 6 ★ ★ ★Rhode Island ....................... 7 ★ ★ ★South Carolina ................... 5 . . . ★ . . .
South Dakota ...................... 4 . . . ★ . . .Tennessee............................ 6 . . . ★ . . .Texas .................................... 6.25 ★ ★ . . .Utah ..................................... 4.75 . . . ★ . . .Vermont .............................. 5 ★ ★ . . .
Virginia ............................... 3.5 . . . ★ ★Washington .......................... 6.5 ★ ★ . . .West Virginia ...................... 6 . . . ★ . . .Wisconsin ............................ 5 ★ ★ . . .Wyoming ............................. 4 (h) . . . ★ . . .
Dist. of Columbia ............... 5.75 ★ ★ ★
Source: The Federation of Tax Administrators.Key:★ — Yes. . . — No(a) Some states tax food, but allow an (income) tax credit to compensate
poor households. They are: Hawaii, Idaho, Kansas, South Dakota, Vermontand Wyoming.
(b) Includes a 0.5 percent temporary tax pending a judicial ruling on schoolfinance.
(c) Food sales will be fully exempt, effective October 1, 1998. Currentlytaxable at 1 percent.
(d) 1.25 percent of the tax in Illinois and 0.5 percent in Minnesota is dis-tributed to local governments.
(e) Taxable at 1 percent.(f) Taxable at 3 percent.(g) Effective October 1, 1997 to September 30, 1998, the state tax rate on
all retail food is reduced to 1.225 percent.(h) The tax rate may be adjusted annually based on a formula using bal-
ances in the unappropriated general funds and the school foundation fund.

TAXES
270 The Book of the States 1998-99
Table 6.23STATE INDIVIDUAL INCOME TAXES(As of January 1, 1998)
Number FederalState or other of income taxjurisdiction Low High brackets Lowest Highest Single Married Dependents deductible
Alabama ...................... 2.0 - 5.0 3 500 (a) - 3,000 (a) 1,500 3,000 300 ★Alaska .......................... ----------------------------------------------------------------------(b)----------------------------------------------------------------------Arizona ........................ 2.9 - 5.2 5 10,000 (a) - 150,001 (a) 2,100 4,200 2,300Arkansas ..................... 1.0 - 7.0 (c) 6 2,999 - 25,000 20 (d) 40 (d) 20 (d)California (e) .............. 1.0 - 9.3 6 5,016 (a) - 32,916 (a) 68 (d) 136 (d) 68 (d)
Colorado ..................... 5.0 1 ------------Flat rate------------ ------------------------None------------------------Connecticut................. 3.0 - 4.5 2 6,250 (a) - 6,250 (a) 12,000 (f) 24,000 (f) 0Delaware ..................... 3.1 - 6.9 6 2,001 - 30,000 100 (d) 200 (d) 100 (d)Florida ......................... ----------------------------------------------------------------------(b)----------------------------------------------------------------------Georgia ........................ 1.0 - 6.0 6 750 (g) - 7,000 (g) 1,500 3,000 1,500
Hawaii ......................... 2.0 - 10.0 8 1,500 (a) - 20,500 (a) 1,040 2,080 1,040Idaho ............................ 2.0 - 8.2 8 1,000 (h) - 20,000 (h) 2,700 (i) 5,400 (i) 2,700 (i)Illinois .......................... 3.0 1 ------------Flat rate------------ 1,000 2,000 1,000Indiana ........................ 3.4 1 ------------Flat rate------------ 1,000 2,000 1,000Iowa (e) ........................ 0.36 - 8.98 9 1,136 - 51,120 20 (d) 40 (d) 40 (d) ★
Kansas......................... 3.5 - 7.75 3 15,000 (j) - 30,000 (j) 2,000 4,000 2,000Kentucky ..................... 2.0 - 6.0 5 3,000 - 8,000 20 (d) 40 (d) 20 (d)Louisiana .................... 2.0 - 6.0 3 10,000 (a) - 50,000 (a) 4,500 (k) 9,000 (k) 1,000 (k) ★Maine (e) ..................... 2.0 - 8.5 4 4,150 (a) - 16,500 (a) 2,150 4,300 2,150Maryland .................... 2.0 - 4.95 4 1,000 - 3,000 1,200 2,400 1,200
Massachusetts............ 5.95 (l) 1 ------------Flat rate------------ 2,200 4,400 1,000Michigan (e) ............... 4.4 1 ------------Flat rate------------ 2,700 5,400 2,700Minnesota (e).............. 6.0 - 8.5 3 16,960 (m) - 55,730 (m) 2,700 (i) 5,400 (i) 2,700 (i)Mississippi .................. 3.0 - 5.0 3 5,000 - 10,000 6,000 10,000 1,500Missouri ...................... 1.5 - 6.0 10 1,000 - 9,000 1,200 2,400 400 (n) ★ (n)
Montana (e) ................ 2.0 - 11.0 10 1,900 - 67.900 1,550 3,100 1,550 ★Nebraska (e)............... 2.51 - 6.68 4 2,400 (o) - 26,500 (o) 88 (d) 176 (d) 88 (d)Nevada ......................... ----------------------------------------------------------------------(b)----------------------------------------------------------------------New Hampshire.......... ----------------------------------------------------------------------(p)----------------------------------------------------------------------New Jersey .................. 1.4 - 6.37 6 20,000 (q) - 75,000 (q) 1,000 2,000 1,500
New Mexico ................ 1.7 - 8.5 7 5,500 (r) - 65,000 (r) 2,700 (i) 5,400 (i) 2,700 (i)New York ..................... 4.0 - 7.125 5 5,500 (a) - 13,000 (a) 0 0 1,000North Carolina ........... 6.0 - 7.75 3 12,750 (s) - 60,000 (s) 2,700 (i) 5,400 (i) 2,700 (i)North Dakota .............. 2.67 - 12.0 (t) 8 3,000 - 50,000 2,700 (i) 5,400 (i) 2,700 (i) (u) ★ (t)Ohio ............................. 0.713 - 7.201 9 5,000 - 200,000 950 (u) 1,900 (u) 950 (u)
Oklahoma ................... 0.5 - 7.0 (v) 8 1,000 - 10,000 1,000 2,000 1,000 (w) ★ (v)Oregon (e) ................... 5.0 - 9.0 3 2,250 (a) - 5,700 (a) 124 (d) 248 (d) 124 (d) (x) ★ (w)Pennsylvania............... 2.8 1 ------------Flat rate------------ ------------------------None------------------------Rhode Island .............. ----------------------------------------------------------------------(x)----------------------------------------------------------------------
South Carolina (e) ..... 2.5 - 7.0 6 2,280 - 11,400 2,700 (i) 5,400 (i) 2,700 (i)
South Dakota.............. ----------------------------------------------------------------------(b)----------------------------------------------------------------------Tennessee.................... ----------------------------------------------------------------------(p)----------------------------------------------------------------------Texas ............................ ----------------------------------------------------------------------(b)----------------------------------------------------------------------Utah ............................. 2.3 - 7.0 6 750 (a) - 3,750 (a) 2,025 (i) 4,050 (i) 2,025 (i) (y) ★ (y)Vermont ....................... -----------------------------------------------------------------------(z)---------------------------------------------------------------------
Virginia ....................... 2.0 - 5.75 4 3,000 - 17,000 800 1,600 800Washington ................. ----------------------------------------------------------------------(b)----------------------------------------------------------------------West Virginia .............. 3.0 - 6.5 5 10,000 (a) - 60,000 (a) 2,000 4,000 2,000Wisconsin.................... 4.9 - 6.93 (aa) 3 7,500 - 15,001 0 0 50 (d)Wyoming ..................... ----------------------------------------------------------------------(b)----------------------------------------------------------------------
Dist. of Columbia ....... 6.0 - 9.5 3 10,000 - 20,000 1,370 2,740 1,370
See footnotes at end of table.
Tax rate range(in percents) Income brackets Personal exemptions

TAXES
The Council of State Governments 271
Source: The Federation of Tax Administrators.(a) For joint returns, the tax is twice the tax imposed on half the income.(b) No state income tax.(c) A special tax table is available for low income taxpayers reducing their
tax payments.(d) Tax credits.(e) Eight states have statutory provision for automatic adjustment of tax
brackets, personal exemption or standard deductions to the rate of inflation.Nebraska indexes the personal exemption amounts only.
(f) Combined personal exemptions and standard deduction. An additionaltax credit is allowed ranging from 75 percent to 0 percent based on stateadjusted gross income. Exemption amounts are phased out for higher incometaxpayers until they are eliminated for households earning over $78,500.
(g) The tax brackets reported are for single individuals. For married house-holds filing separately, the same rates apply to income brackets ranging from$500 to $5,000.
(h) For joint returns, the tax is twice the tax imposed on half the income. A$10 filing fee is charged for each return and a $15 credit is allowed for eachexemption.
(i) These states allow personal exemption or standard deductions as pro-vided in the Internal Revenue Code. Utah allows a personal exemption equalto three-fourths the federal exemptions. Amounts reported include the 1998index adjustment.
(j) The tax brackets reported are for single individuals and married house-holds filing separately. For married households filing jointly, the rates rangefrom 3.5 percent for income under $30,000 to 6.45 percent for income over$60,000. Tax rates for single and married (filing separately) households arescheduled to decrease in tax years 1999 and 2000.
(k) Combined personal exemption and standard deduction.(l) A 12 percent tax rate applies to interest, dividends and capital gains.(m) The tax brackets reported are for single individuals and married tax-
payers filing separately. For married taxpayers filing jointly, the same ratesapply to income brackets ranging from $24,800 to $98,540. An additional 0.5percent tax is applied to certain income levels.
STATE INDIVIDUAL INCOME TAXES — Continued
(n) Limited to $10,000 for joint returns and $5,000 for individuals.(o) The tax brackets reported are for single individuals. For married couples,
the same rates apply for income under $4,000 to over $46,750.(p) State income tax is limited to dividends and interest income only.(q) The tax brackets reported are for single individuals. A separate sched-
ule is provided for married households filing jointly which ranges from 1.4percent under $20,000 to 6.37 percent for incomes over $150,000.
(r) The tax brackets reported are for single individuals. For married indi-viduals, the rate ranges from 1.7 percent under $8,000 to 8.5 percent over$100,000. Married households filing separately pay twice the tax imposed onhalf the income.
(s) The tax brackets reported are for single individuals. For married tax-payers, the same rates apply to income brackets ranging from $21,250 to$100,000. An additional middle income tax credit is allowed.
(t) Taxpayers have the option of paying 14 percent of the adjusted federalincome tax liability, without a deduction of federal taxes. An additional $300personal exemption is allowed for joint returns or unmarried heads of house-holds.
(u) Plus an additional $20 per exemption tax credit. In tax year 1999, thepersonal exemption amounts will increase to $1,050.
(v) The rate range reported is for single persons not deducting federal in-come tax. For married persons filing jointly, the same rates apply to incomebrackets ranging from $2,000 to $21,000. Separate schedules, with rates rang-ing from 0.5 percent to 10 percent, apply to taxpayers deducting federal in-come taxes.
(w) Limited to $3,000.(x) 27.0 percent federal tax liability.(y) One half of the federal income taxes are deductible.(z) 25 percent federal tax liability. If Vermont tax liability for any taxable
year exceeds the tax liability determinable under federal tax law in effect onDecember 31, 1995, the taxpayer will be entitled to a credit of 106 percent ofthe excess tax.
(aa) The tax brackets reported are for single individuals. For married tax-payers, the same rates apply to income brackets ranging from $10,000 to$20,001.

TAXES
272 The Book of the States 1998-99
Table 6.24STATE PERSONAL INCOME TAXES: FEDERAL STARTING POINTS
State or other Relation to jurisdiction Internal Revenue Code Tax base
Alabama .............................. . . . . . .Alaska .................................. (a) . . .Arizona ................................ 01/01/97 Federal adjusted gross incomeArkansas ............................. . . . . . .California ............................ 01/01/97 Federal adjusted gross income
Colorado ............................. Current Federal taxable incomeConnecticut......................... Current Federal adjusted gross incomeDelaware ............................. Current Federal adjusted gross incomeFlorida ................................. (a) . . .Georgia ................................ 01/01/97 Federal adjusted gross income
Hawaii ................................. 12/31/96 Federal taxable incomeIdaho .................................... 01/01/97 Federal taxable incomeIllinois .................................. Current Federal adjusted gross incomeIndiana ................................ 01/01/97 Federal adjusted gross incomeIowa ..................................... 03/20/96 Federal adjusted gross income
Kansas................................. Current Federal adjusted gross incomeKentucky ............................. 12/31/95 Federal adjusted gross incomeLouisiana ............................ Current Federal adjusted gross incomeMaine ................................... 12/31/96 Federal adjusted gross incomeMaryland ............................ Current Federal adjusted gross income
Massachusetts.................... Current Federal adjusted gross incomeMichigan ............................. (b) Current (b) Federal adjusted gross incomeMinnesota ........................... 12/31/96 Federal taxable incomeMississippi .......................... . . . . . .Missouri .............................. Current Federal adjusted gross income
Montana .............................. Current Federal adjusted gross incomeNebraska............................. Current Federal adjusted gross incomeNevada ................................. (a) . . .New Hampshire.................. (c) . . .New Jersey .......................... . . . . . .
New Mexico ........................ Current Federal adjusted gross incomeNew York ............................. Current Federal adjusted gross incomeNorth Carolina ................... 03/20/97 Federal taxable incomeNorth Dakota ...................... Current Federal liability (d)Ohio ..................................... Current Federal adjusted gross income
Oklahoma ........................... Current Federal adjusted gross incomeOregon ................................. Current (e) Federal taxable incomePennsylvania....................... . . . . . .Rhode Island ...................... Current Federal liabilitySouth Carolina ................... 12/31/96 Federal taxable income
South Dakota...................... (a) . . .Tennessee............................ (c) . . .Texas .................................... (a) . . .Utah ..................................... Current Federal taxable incomeVermont ............................... (e) Current (f) Federal liability
Virginia ............................... Current Federal adjusted gross incomeWashington ......................... (a) . . .West Virginia ...................... 01/01/97 Federal adjusted gross incomeWisconsin............................ 12/31/96 Federal adjusted gross incomeWyoming ............................. (a) . . .
Dist. of Columbia ............... 04/11/95 Federal adjusted gross income
Source: The Federation of Tax Administrators.Key:. . . — State does not employ a federal starting point.Current — State has adopted Internal Revenue Code as currently in effect.
Dates indicate state has adopted IRC as amended to that date.(a) No state income tax.
(b) Or 1/1/96, taxpayer’s option.(c) On interest and dividends only.(d) Or federal taxable income based on current Internal Revenue Code.(e) Certain sections conform to the Internal Revenue Code as of 12/31/96.(f) Not to exceed tax computed using Internal Revenue Code as of 12/31/95.
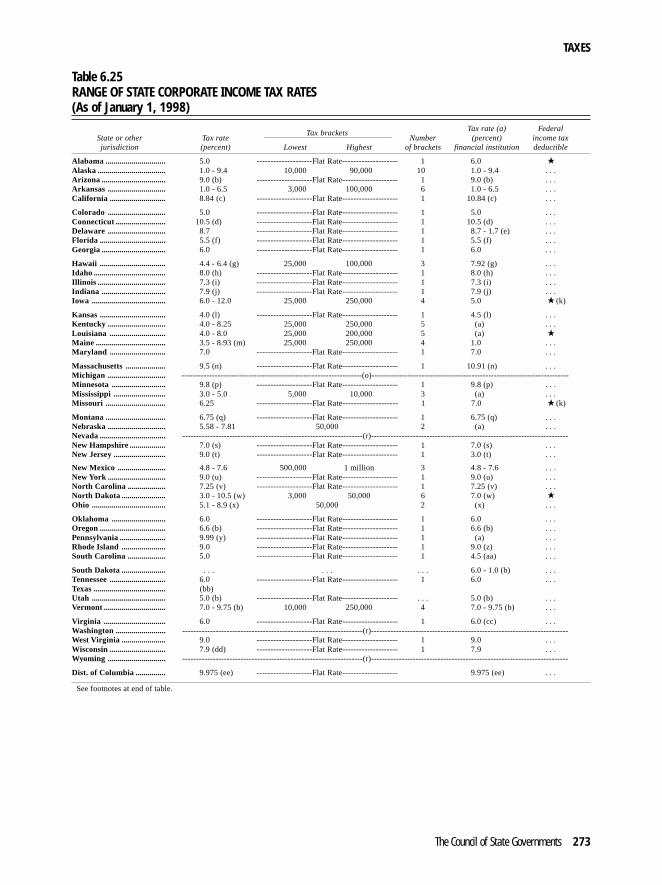
TAXES
The Council of State Governments 273
Table 6.25RANGE OF STATE CORPORATE INCOME TAX RATES(As of January 1, 1998)
Tax rate (a) FederalState or other Tax rate Number (percent) income taxjurisdiction (percent) Lowest Highest of brackets financial institution deductible
Alabama .............................. 5.0 --------------------Flat Rate-------------------- 1 6.0 ★Alaska .................................. 1.0 - 9.4 10,000 90,000 10 1.0 - 9.4 . . .Arizona ................................ 9.0 (b) --------------------Flat Rate-------------------- 1 9.0 (b) . . .Arkansas ............................. 1.0 - 6.5 3,000 100,000 6 1.0 - 6.5 . . .California ............................ 8.84 (c) --------------------Flat Rate-------------------- 1 10.84 (c) . . .
Colorado ............................. 5.0 --------------------Flat Rate-------------------- 1 5.0 . . .Connecticut......................... 10.5 (d) --------------------Flat Rate-------------------- 1 10.5 (d) . . .Delaware ............................. 8.7 --------------------Flat Rate-------------------- 1 8.7 - 1.7 (e) . . .Florida ................................. 5.5 (f) --------------------Flat Rate-------------------- 1 5.5 (f) . . .Georgia................................ 6.0 --------------------Flat Rate-------------------- 1 6.0 . . .
Hawaii ................................. 4.4 - 6.4 (g) 25,000 100,000 3 7.92 (g) . . .Idaho .................................... 8.0 (h) --------------------Flat Rate-------------------- 1 8.0 (h) . . .Illinois .................................. 7.3 (i) --------------------Flat Rate-------------------- 1 7.3 (i) . . .Indiana ................................ 7.9 (j) --------------------Flat Rate-------------------- 1 7.9 (j) . . .Iowa ..................................... 6.0 - 12.0 25,000 250,000 4 5.0 (k) ★ (k)
Kansas................................. 4.0 (l) --------------------Flat Rate-------------------- 1 4.5 (l) . . .Kentucky ............................. 4.0 - 8.25 25,000 250,000 5 (a) . . .Louisiana ............................ 4.0 - 8.0 25,000 200,000 5 (a) ★Maine ................................... 3.5 - 8.93 (m) 25,000 250,000 4 1.0 . . .Maryland ............................ 7.0 --------------------Flat Rate-------------------- 1 7.0 . . .
Massachusetts.................... 9.5 (n) --------------------Flat Rate-------------------- 1 10.91 (n) . . .Michigan ............................. -----------------------------------------------------------------(o)-----------------------------------------------------------------------Minnesota ........................... 9.8 (p) --------------------Flat Rate-------------------- 1 9.8 (p) . . .Mississippi .......................... 3.0 - 5.0 5,000 10,000 3 (a) . . .Missouri .............................. 6.25 --------------------Flat Rate-------------------- 1 7.0 (k) ★ (k)
Montana .............................. 6.75 (q) --------------------Flat Rate-------------------- 1 6.75 (q) . . .Nebraska............................. 5.58 - 7.81 50,000 2 (a) . . .Nevada ................................. -----------------------------------------------------------------(r)-----------------------------------------------------------------------New Hampshire.................. 7.0 (s) --------------------Flat Rate-------------------- 1 7.0 (s) . . .New Jersey .......................... 9.0 (t) --------------------Flat Rate-------------------- 1 3.0 (t) . . .
New Mexico ........................ 4.8 - 7.6 500,000 1 million 3 4.8 - 7.6 . . .New York ............................. 9.0 (u) --------------------Flat Rate-------------------- 1 9.0 (u) . . .North Carolina ................... 7.25 (v) --------------------Flat Rate-------------------- 1 7.25 (v) . . .North Dakota ...................... 3.0 - 10.5 (w) 3,000 50,000 6 7.0 (w) ★Ohio ..................................... 5.1 - 8.9 (x) 50,000 2 (x) . . .
Oklahoma ........................... 6.0 --------------------Flat Rate-------------------- 1 6.0 . . .Oregon ................................. 6.6 (b) --------------------Flat Rate-------------------- 1 6.6 (b) . . .Pennsylvania....................... 9.99 (y) --------------------Flat Rate-------------------- 1 (a) . . .Rhode Island ...................... 9.0 --------------------Flat Rate-------------------- 1 9.0 (z) . . .South Carolina ................... 5.0 --------------------Flat Rate-------------------- 1 4.5 (aa) . . .
South Dakota...................... . . . . . . . . . 6.0 - 1.0 (b) . . .Tennessee............................ 6.0 --------------------Flat Rate-------------------- 1 6.0 . . .Texas .................................... (bb)Utah ..................................... 5.0 (b) --------------------Flat Rate-------------------- . . . 5.0 (b) . . .Vermont ............................... 7.0 - 9.75 (b) 10,000 250,000 4 7.0 - 9.75 (b) . . .
Virginia ............................... 6.0 --------------------Flat Rate-------------------- 1 6.0 (cc) . . .Washington ......................... -----------------------------------------------------------------(r)-----------------------------------------------------------------------West Virginia ...................... 9.0 --------------------Flat Rate-------------------- 1 9.0 . . .Wisconsin............................ 7.9 (dd) --------------------Flat Rate-------------------- 1 7.9 . . .Wyoming ............................. -----------------------------------------------------------------(r)-----------------------------------------------------------------------
Dist. of Columbia ............... 9.975 (ee) --------------------Flat Rate-------------------- 9.975 (ee) . . .
Tax brackets
See footnotes at end of table.
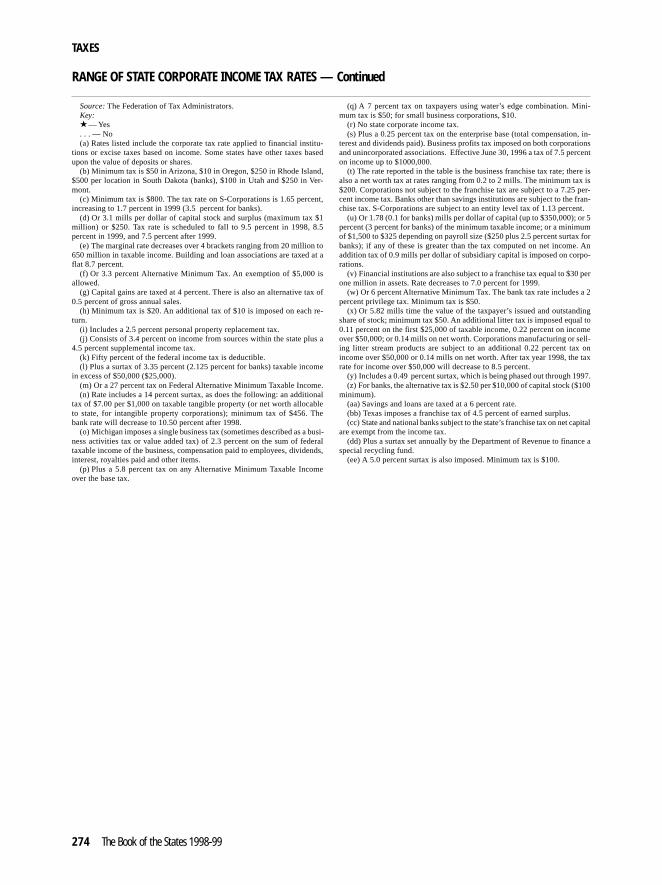
TAXES
274 The Book of the States 1998-99
RANGE OF STATE CORPORATE INCOME TAX RATES — Continued
Source: The Federation of Tax Administrators.Key:★ — Yes. . . — No(a) Rates listed include the corporate tax rate applied to financial institu-
tions or excise taxes based on income. Some states have other taxes basedupon the value of deposits or shares.
(b) Minimum tax is $50 in Arizona, $10 in Oregon, $250 in Rhode Island,$500 per location in South Dakota (banks), $100 in Utah and $250 in Ver-mont.
(c) Minimum tax is $800. The tax rate on S-Corporations is 1.65 percent,increasing to 1.7 percent in 1999 (3.5 percent for banks).
(d) Or 3.1 mills per dollar of capital stock and surplus (maximum tax $1million) or $250. Tax rate is scheduled to fall to 9.5 percent in 1998, 8.5percent in 1999, and 7.5 percent after 1999.
(e) The marginal rate decreases over 4 brackets ranging from 20 million to650 million in taxable income. Building and loan associations are taxed at aflat 8.7 percent.
(f) Or 3.3 percent Alternative Minimum Tax. An exemption of $5,000 isallowed.
(g) Capital gains are taxed at 4 percent. There is also an alternative tax of0.5 percent of gross annual sales.
(h) Minimum tax is $20. An additional tax of $10 is imposed on each re-turn.
(i) Includes a 2.5 percent personal property replacement tax.(j) Consists of 3.4 percent on income from sources within the state plus a
4.5 percent supplemental income tax.(k) Fifty percent of the federal income tax is deductible.(l) Plus a surtax of 3.35 percent (2.125 percent for banks) taxable income
in excess of $50,000 ($25,000).(m) Or a 27 percent tax on Federal Alternative Minimum Taxable Income.(n) Rate includes a 14 percent surtax, as does the following: an additional
tax of $7.00 per $1,000 on taxable tangible property (or net worth allocableto state, for intangible property corporations); minimum tax of $456. Thebank rate will decrease to 10.50 percent after 1998.
(o) Michigan imposes a single business tax (sometimes described as a busi-ness activities tax or value added tax) of 2.3 percent on the sum of federaltaxable income of the business, compensation paid to employees, dividends,interest, royalties paid and other items.
(p) Plus a 5.8 percent tax on any Alternative Minimum Taxable Incomeover the base tax.
(q) A 7 percent tax on taxpayers using water’s edge combination. Mini-mum tax is $50; for small business corporations, $10.
(r) No state corporate income tax.(s) Plus a 0.25 percent tax on the enterprise base (total compensation, in-
terest and dividends paid). Business profits tax imposed on both corporationsand unincorporated associations. Effective June 30, 1996 a tax of 7.5 percenton income up to $1000,000.
(t) The rate reported in the table is the business franchise tax rate; there isalso a net worth tax at rates ranging from 0.2 to 2 mills. The minimum tax is$200. Corporations not subject to the franchise tax are subject to a 7.25 per-cent income tax. Banks other than savings institutions are subject to the fran-chise tax. S-Corporations are subject to an entity level tax of 1.13 percent.
(u) Or 1.78 (0.1 for banks) mills per dollar of capital (up to $350,000); or 5percent (3 percent for banks) of the minimum taxable income; or a minimumof $1,500 to $325 depending on payroll size ($250 plus 2.5 percent surtax forbanks); if any of these is greater than the tax computed on net income. Anaddition tax of 0.9 mills per dollar of subsidiary capital is imposed on corpo-rations.
(v) Financial institutions are also subject to a franchise tax equal to $30 perone million in assets. Rate decreases to 7.0 percent for 1999.
(w) Or 6 percent Alternative Minimum Tax. The bank tax rate includes a 2percent privilege tax. Minimum tax is $50.
(x) Or 5.82 mills time the value of the taxpayer’s issued and outstandingshare of stock; minimum tax $50. An additional litter tax is imposed equal to0.11 percent on the first $25,000 of taxable income, 0.22 percent on incomeover $50,000; or 0.14 mills on net worth. Corporations manufacturing or sell-ing litter stream products are subject to an additional 0.22 percent tax onincome over $50,000 or 0.14 mills on net worth. After tax year 1998, the taxrate for income over $50,000 will decrease to 8.5 percent.
(y) Includes a 0.49 percent surtax, which is being phased out through 1997.(z) For banks, the alternative tax is $2.50 per $10,000 of capital stock ($100
minimum).(aa) Savings and loans are taxed at a 6 percent rate.(bb) Texas imposes a franchise tax of 4.5 percent of earned surplus.(cc) State and national banks subject to the state’s franchise tax on net capital
are exempt from the income tax.(dd) Plus a surtax set annually by the Department of Revenue to finance a
special recycling fund.(ee) A 5.0 percent surtax is also imposed. Minimum tax is $100.
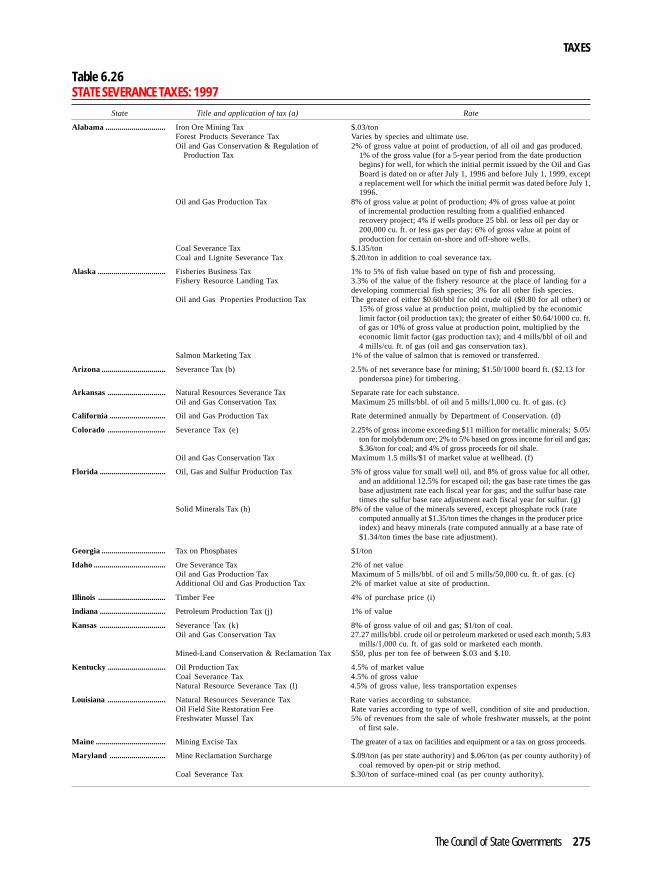
TAXES
The Council of State Governments 275
Table 6.26STATE SEVERANCE TAXES: 1997
State Title and application of tax (a) Rate
Alabama .............................. Iron Ore Mining Tax $.03/tonForest Products Severance Tax Varies by species and ultimate use.Oil and Gas Conservation & Regulation of 2% of gross value at point of production, of all oil and gas produced.
Production Tax 1% of the gross value (for a 5-year period from the date productionbegins) for well, for which the initial permit issued by the Oil and GasBoard is dated on or after July 1, 1996 and before July 1, 1999, excepta replacement well for which the initial permit was dated before July 1,1996.
Oil and Gas Production Tax 8% of gross value at point of production; 4% of gross value at pointof incremental production resulting from a qualified enhancedrecovery project; 4% if wells produce 25 bbl. or less oil per day or200,000 cu. ft. or less gas per day; 6% of gross value at point ofproduction for certain on-shore and off-shore wells.
Coal Severance Tax $.135/tonCoal and Lignite Severance Tax $.20/ton in addition to coal severance tax.
Alaska .................................. Fisheries Business Tax 1% to 5% of fish value based on type of fish and processing.Fishery Resource Landing Tax 3.3% of the value of the fishery resource at the place of landing for a
developing commercial fish species; 3% for all other fish species.Oil and Gas Properties Production Tax The greater of either $0.60/bbl for old crude oil ($0.80 for all other) or
15% of gross value at production point, multiplied by the economiclimit factor (oil production tax); the greater of either $0.64/1000 cu. ft.of gas or 10% of gross value at production point, multiplied by theeconomic limit factor (gas production tax); and 4 mills/bbl of oil and4 mills/cu. ft. of gas (oil and gas conservation tax).
Salmon Marketing Tax 1% of the value of salmon that is removed or transferred.
Arizona ................................ Severance Tax (b) 2.5% of net severance base for mining; $1.50/1000 board ft. ($2.13 for.............................................. pondersoa pine) for timbering.
Arkansas ............................. Natural Resources Severance Tax Separate rate for each substance...............................................Oil and Gas Conservation Tax Maximum 25 mills/bbl. of oil and 5 mills/1,000 cu. ft. of gas. (c)
California ............................ Oil and Gas Production Tax Rate determined annually by Department of Conservation. (d)
Colorado ............................. Severance Tax (e) 2.25% of gross income exceeding $11 million for metallic minerals; $.05/.............................................. ton for molybdenum ore; 2% to 5% based on gross income for oil and gas;.............................................. $.36/ton for coal; and 4% of gross proceeds for oil shale...............................................Oil and Gas Conservation Tax Maximum 1.5 mills/$1 of market value at wellhead. (f)
Florida ................................. Oil, Gas and Sulfur Production Tax 5% of gross value for small well oil, and 8% of gross value for all other,and an additional 12.5% for escaped oil; the gas base rate times the gasbase adjustment rate each fiscal year for gas; and the sulfur base ratetimes the sulfur base rate adjustment each fiscal year for sulfur. (g)
Solid Minerals Tax (h) 8% of the value of the minerals severed, except phosphate rock (ratecomputed annually at $1.35/ton times the changes in the producer priceindex) and heavy minerals (rate computed annually at a base rate of$1.34/ton times the base rate adjustment).
Georgia................................ Tax on Phosphates $1/ton
Idaho .................................... Ore Severance Tax 2% of net valueOil and Gas Production Tax Maximum of 5 mills/bbl. of oil and 5 mills/50,000 cu. ft. of gas. (c)Additional Oil and Gas Production Tax 2% of market value at site of production.
Illinois .................................. Timber Fee 4% of purchase price (i)
Indiana ................................. Petroleum Production Tax (j) 1% of value
Kansas .................................Severance Tax (k) 8% of gross value of oil and gas; $1/ton of coal.Oil and Gas Conservation Tax 27.27 mills/bbl. crude oil or petroleum marketed or used each month; 5.83
mills/1,000 cu. ft. of gas sold or marketed each month.Mined-Land Conservation & Reclamation Tax $50, plus per ton fee of between $.03 and $.10.
Kentucky ............................. Oil Production Tax 4.5% of market valueCoal Severance Tax 4.5% of gross valueNatural Resource Severance Tax (l) 4.5% of gross value, less transportation expenses
Louisiana ............................. Natural Resources Severance Tax Rate varies according to substance...............................................Oil Field Site Restoration Fee Rate varies according to type of well, condition of site and production...............................................Freshwater Mussel Tax 5% of revenues from the sale of whole freshwater mussels, at the point.............................................. of first sale.
Maine ................................... Mining Excise Tax The greater of a tax on facilities and equipment or a tax on gross proceeds.
Maryland ............................ Mine Reclamation Surcharge $.09/ton (as per state authority) and $.06/ton (as per county authority) ofcoal removed by open-pit or strip method.
Coal Severance Tax $.30/ton of surface-mined coal (as per county authority).

TAXES
276 The Book of the States 1998-99
STATE SEVERANCE TAXES — Continued
State Title and application of tax (a) Rate
Michigan ............................. Gas and Oil Severance Tax 5% (gas), 6.6% (oil) and 4% (oil from stripper wells and marginalproperties) of gross cash market value of the total production.Maximum additional fee of 1% of gross cash market value on all oiland gas produced in state in previous year.
Minnesota ........................... Taconite, Iron Sulphides and Agglomerate Taxes $2.141/ton ($.05/ton for agglomerates)Semi-Taconite Tax $.10/ton ($.05/ton if agglomerated or sintered in state), plus $.001/ton
for each 1% of iron content in excess of 55%.(m)
Mississippi ........................... Oil and Gas Severance Tax 6% of value at point of gas production; 3.5% of gross value of occludednatural gas from coal seams at point of production for well’s first fiveyears; also, maximum 35 mills/bbl. oil or 4 mills/1,000 cu. ft. gas(Oil and Gas Board maintenance tax). 6% of value at point of oilproduction; 3% of value at production when enhanced oil recoverymethod used.
Timber Severance Tax Varies depending on type of wood and ultimate use.Salt Severance Tax 3% of value of entire production in state.
Missouri .............................. Assessment on Surface Coal Mining Permittees $.45/ton for first 50,000 tons sold, shipped or otherwise disposed of incalendar year, and $.30/ton for next 50,000 tons. Whenever Coal MineLand Reclamation Fund balance is less than $7 million, $.25/ton forfirst 50,000 tons and $.15/ton for second 50,000 tons. Whenever Fundis less than $2 million, $.30/ton for first 50,000 tons and $.20 for thesecond 50,000 tons.
Montana .............................. Coal Severance Tax Varies by quality of coal and type of mine.Metalliferous Mines License Tax (n) Progressive rate, taxed on amounts in excess of $250,000. For
concentrate shipped to smelter, mill or reduction work, 1.81%. Gold,silver or any platinum group metal shipped to refinery, 1.6%.
Oil or Gas Conservation Tax Maximum 0.3% on the market value of each barrel of crude petroleumoil or 10,000 cu. ft. of natural gas produced, saved and marketed orstored within or exported from the state. (o) (o)O(o)il and Natural Gas
Pro Oil and Natural Gas Production Tax Varies according to the type of well and type of production.Micaceous Minerals License Tax $.05/tonCement License Tax (p) $.22/ton of cement, $.05/ton of cement, plaster, gypsum or gypsum products.Mineral Mining Tax $25 plus 0.5% of gross value greater than $5,000. For talc, $25 plus 4%
of gross value greater than $625. For coal, $25 plus 0.40% of gross valuegreater than $6,250. For vermiculite, $25 plus 2% of gross value greaterthan $1,250. For limestone, $25 plus 10% of gross value greater than$250. For industrial garnets, $25 plus 1% of gross value greater than$2,500.
Nebraska............................. Oil and Gas Severance Tax 3% of value of nonstripper oil and natural gas; 2% of value of stripperoil.
Oil and Gas Conservation Tax Maximum 5 mills/$1 of value at wellhead. (c)Uranium Tax 2% of gross value over $5 million.
Nevada ................................ Minerals Extraction Tax Between 2% and 5% of net proceeds of each geographically separate.............................................. extractive operation, based on ratio of net proceeds to gross
proceeds of whole operation.Oil and Gas Conservation Tax $50/mills/bbl. of oil and 50 mills/50,000 cu. ft. of gas.
New Hampshire ................. Refined Petroleum Products Tax 0.1% of fair market value
New Mexico ....................... Resources Excise Tax (q) Varies according to substance.Severance Tax (q) Varies according to substance.Oil and Gas Severance Tax 3.75% of value of oil, other liquid hydrocarbons, natural gas and carbon
dioxide. 1.875% of value of oil and other liquid hydrocarbons producedfrom a qualified enhanced recovery project.
Oil and Gas Privilege Tax 3.15% of value of oil, other liquid hydrocarbons and carbon dioxide. 4%of value of natural gas.
Natural Gas Processor’s Tax 0.45% of value of products.Oil and Gas Ad Valorem Production Tax Varies, based on property tax in district of production.Oil and Gas Conservation Tax (r) 0.19% of value.
North Carolina .................. Oil and Gas Conservation Tax Maximum 5 mills/bbl. of oil and 0.5 mill/1,000 cu. ft. of gas.Primary Forest Product Assessment Tax Varies according to species.
North Dakota ..................... Oil and Gas Gross Production Tax 5% of gross value at well.Coal Severance Tax $.75/ton plus $.02/ton. (s)Oil Extraction Tax 6.5% of gross value at well (with exceptions due to price and date of well
completion).
Ohio ..................................... Resource Severance Tax $.10/bbl. of oil; $.025/1,000 cu. ft. of natural gas; $.04/ton of salt; $.02/.............................................. ton of sand, gravel, limestone and dolomite; $.07/ton of coal; and $0.01/.............................................. ton of clay, sandstone or conglomerate, shale, gypsum or quartzite.
See footnotes at end of table.

TAXES
The Council of State Governments 277
STATE SEVERANCE TAXES — Continued
State Title and application of tax (a) Rate
Oklahoma ........................... Oil, Gas and Mineral Gross Production Tax 0.75% on the gross value of asphalt and metals. 7% on petroleum andand Petroleum Excise Tax (t) other crude or mineral oils, natural gas and casinghead gas, plus 0.095%
(0.085% beginning July 1, 2001) of the gross value of each barrel ofpetroleum oil or natural and casinghead gas produced in the state.
Oregon ................................ Forest Products Harvest Tax $.05/1,000 board ft. (privilege tax); $.50/1,000 board ft. (harvest tax).
Oil and Gas Production Tax 6% of gross value at well.Privilege Tax on Eastern Oregon Timber 1.8% of immediate harvest value on reforestation land; 1.8% from
privately owned land.Privilege Tax on Western Oregon Timber 3.2% of stumpage value on reforested land; 3.2% from privately owned
land.
South Dakota ...................... Precious Metals Severance Tax $4 per ounce of gold severed plus additional tax depending on price ofgold; 10% on net profits or royalties from sale of precious metals, and8% of royalty value.
Energy Minerals Severance Tax (u) 4.5% of taxable value of any energy minerals.Conservation Tax 2.4 mills of taxable value of any energy minerals.
Tennessee............................ Oil and Gas Severance Tax 3% of sales priceCoal Severance Tax $.20/ton(v)
Texas ....................................Gas Production Tax 7.5% of market value.Oil Production Tax The greater of 4.6% of market value or $.046/bbl. 2.3% of market value
for oil produced from qualified enhanced recovery projects.Sulphur Production Tax $1.03/long ton or fraction thereof.Cement Production Tax $.0275/100 lbs. or fraction thereof.Oil-Field Cleanup Regulatory Fees 5/16 of $.01/barrel; 1/30 of $.01/1000 cubic feet of gas. (w)
Utah ..................................... Metalliferous Minerals Tax 2.6% of taxable value for metals.Oil and Gas Tax 3% of value for the first $13 per barrel of oil, 5% from
$13.01 and above; 3% of value for first $1.50/mcf, 5%from $1.51 and above; and 4% of taxable value of natural gas liquids.
Oil and Gas Conservation Tax $.02 of market value at wellhead.
Virginia ............................... Forest Products Tax Varies by species and ultimate use.Coal Surface Mining Reclamation Tax Varies depending on balance of Coal Surface Mining Reclamation Fund.Varies(x)depending
Washington .......................... Uranium and Thorium Milling Tax $.05/lb...............................................Enhanced Food Fish Tax 0.08% to 5.25% of value (depending on species) at point of landing.
West Virginia ...................... Natural Resource Severance Taxes Coal, 5% of gross value, plus 0.35% for counties and municipalities............................................... Limestone or sandstone quarried or mined, 5% of gross value. Oil,
5% of gross value. Natural gas, 5% of gross value. Timber, 3.22% of gross value. Other natural resources, 5% of gross value.
Wisconsin ............................ Mining Net Proceeds Tax Progressive net proceeds tax ranging from 3% to 15%...............................................Oil and Gas Severance 7% of market value.
Wyoming ............................. Oil and Gas Production Tax Maximum 0.8 mill/$1 of value at wellhead. (c,y)Mining Excise and Severance Taxes Varies by substance from 1.5% to 3.75% of value; some additional excise
taxes of 2% to 3%.
Source: Commerce Clearing House Inc., All States Tax Guide.(a) Application of tax is same as that of title unless otherwise indicated by
a footnote.(b) Timber, metalliferous minerals.(c) Actual rate set by administrative actions.(d) For 1997, $.0355296/bbl of oil per 10,000 cu. ft. of natural gas.(e) Metallic minerals, molybdenum ore, coal, oil shale, oil and gas.(f) As of January 1997, set at 1.4 mills.(g) Through June 30, 1997, the gas production tax was $.106/mcf of gas
and the sulfur production tax was $2.72/long ton of sulfur.(h) Clay, gravel, phosphate rock, lime, shells, stone, sand, heavy minerals
and rare earths.(i) Buyer deducts amount from payment to grower; amount forwarded to
Department of Conservation.(j) Petroleum, oil, gas and other hydrocarbons.(k) Coal, salt, oil and gas.(l) Coal and oil excepted.(m) State also has two related taxes; Mining Occupation Tax and Net Pro-
ceeds Tax. Also selected counties must impose an Aggregate Materials Taxof $.10/cubic yard or $.07/ton on materials produced in the county.(n) Metals, precious and semi-precious stones and gems.(o) Currently, the tax is levied at the rate of 0.3%.
(p) Cement and gypsum or allied products.(q) Natural resources except oil, natural gas, liquid hydrocarbons or carbon
dioxide.(r) Oil, coal, gas, liquid hydrocarbons, geothermal energy, carbon dioxide
and uranium.(s) Rate reduced by 50 percent if burned in cogeneration facility using
renewable resources as fuel to generate at least 10 percent of its energyoutput. Between June 30, 1995 and July 1, 2000, the rate is reduced by 50%for coal mined for out-of-state shipment.
(t) Asphalt and ores bearing lead, zinc, jack, gold, silver, copper or petro-leum or other crude oil or other mineral oil, natural gas or casinghead gas anduranium ore.
(u) Any mineral fuel used in the production of energy, including coal, lig-nite, petroleum, oil, natural gas, uranium and thorium.
(v) Counties and municipalities also authorized to levy severance taxes onsand, gravel, sandstone, chert and limestone and a privilege tax on nuclearmaterials.
(w) Fees will not be collected when Oil-Field Cleanup Fund reaches $10million, but will again be collected when fund falls below $6 million.
(x) Until 2003, any county and city may adopt a license tax at a rate notover 1% of gross receipts on persons engaged in the business of severing coalor gases.
(y) Currently, rate is .7 mills/$1.

TAXES
278 The Book of the States 1998-99
Percent change year-to-year
Table 6.27NATIONAL SUMMARY OF STATE GOVERNMENT TAX REVENUE,BY TYPE OF TAX: 1994 to 1996
Percent1995 to 1994 to distribution, Per capita, 1996
Tax source 1996 1995 1994 1996 1995 1996 (in dollars)
Total Collections....................... $418,970,791 $399,147,521 $373,826,669 5.0 6.8 100.0 $1,582.6
Sales & gross receipts tax.............. 205,687,307 196,850,966 185,852,578 4.5 5.9 49.1 776.9 General.......................................... 139,278,702 132,236,159 123,297,594 5.3 7.2 33.2 526.1 Selective........................................ 66,408,605 64,614,807 62,554,984 2.8 3.3 15.9 250.8 Motor fuels sales........................ 25,981,234 25,439,721 24,520,347 2.1 3.7 6.2 98.1 Insurance premium..................... 9,057,273 8,587,209 8,610,074 5.5 -0.3 2.2 34.2 Public utilities............................ 8,600,938 8,061,693 8,509,861 6.7 -5.3 2.1 32.5 Tobacco products........................ 7,337,848 7,347,647 6,605,100 -0.1 11.2 1.8 27.7 Alcoholic beverage sales............ 3,666,690 3,597,128 3,614,874 1.9 -0.5 0.9 13.9 Amusement................................. 1,862,391 1,619,630 1,251,841 15.0 29.4 0.4 7.0 Parimutuels................................. 458,866 505,813 543,612 -9.3 -7.0 0.1 1.7 Other selective sales................... 9,443,365 9,455,966 8,899,275 -0.1 6.3 2.3 35.7
Licenses.......................................... 27,036,285 26,082,996 24,203,421 3.7 7.8 6.5 102.1 Motor vehicle............................... 12,740,349 12,414,315 11,946,281 2.6 3.9 3.0 48.1 Occupation and business, NEC ... 5,610,852 5,297,020 4,490,442 5.9 18.0 1.3 21.2 Corporation in general................. 5,158,425 5,013,615 4,504,882 2.9 11.3 1.2 19.5 Motor vehicle operators............... 1,166,843 1,144,927 1,053,435 1.9 8.7 0.3 4.4 Hunting and fishing...................... 989,955 955,419 945,431 3.6 1.1 0.2 3.7 Public utility ................................. 372,725 368,381 362,225 1.2 1.7 0.1 1.4 Alcoholic beverage....................... 307,061 288,436 299,087 6.5 -3.6 0.1 1.2 Amusement................................... 240,872 247,895 239,217 -2.8 3.6 0.1 0.9 Other ............................................. 449,203 352,988 362,421 27.3 -2.6 0.1 1.7
Individual income........................... 134,683,257 125,610,125 117,727,000 7.2 6.7 32.1 508.7
Corporation net income.................. 29,315,684 29,075,019 25,499,727 0.8 14.0 7.0 110.7
Property........................................... 9,973,524 9,518,305 8,386,108 1.0 1.1 2.4 37.7
Death and gift................................. 5,320,098 4,904,482 5,042,437 8.5 -2.7 1.3 20.1
Documentary and stock transfer.... 2,559,338 2,339,934 2,538,708 9.4 -7.8 0.6 9.7
Severance........................................ 4,112,485 4,467,629 4,298,003 -7.9 3.9 1.0 15.5
Other ............................................... 282,813 298,065 278,687 -5.1 7.0 0.1 1.1
Amount (in thousands of dollars)
Source: U.S. Department of Commerce, Bureau of the Census.Note: Because of rounding, detail may not add to totals. Population figures
as of July 1, 1994 were used to calculate per capita amounts; see Table 6.32.

TAXES
The Council of State Governments 279
Table 6.28SUMMARY OF STATE GOVERNMENT TAX REVENUE, BY STATE:1994 TO 1996
Amount (in thousands of dollars) Percent change year-to-year
1995 to 1994 to Per capita, 1996State 1996 1995 1994 1996 1995 (in dollars)
United States................. $418,970,791 $399,147,521 $373,826,669 5.0 6.8 $1,582.6
Alabama .............................. 5,257,771 5,077,827 4,767,108 3.5 6.5 1,230.4Alaska .................................. 1,519,082 1,922,463 1,240,275 -21.0 55.0 2,502.6Arizona ................................ 6,409,395 6,223,489 5,656,858 3.0 10.0 1,447.4Arkansas ............................. 3,708,744 3,391,785 3,175,976 9.3 6.8 1,477.7California ............................ 57,746,664 53,269,075 49,695,396 8.4 7.2 1,811.5
Colorado ............................. 4,820,163 4,531,366 4,154,450 6.4 9.1 1,260.9Connecticut......................... 7,830,171 7,474,119 6,788,492 4.8 10.1 2,391.4Delaware ............................. 1,688,349 1,594,818 1,444,083 5.9 10.4 2,329.3Florida ................................. 19,699,255 18,564,650 17,808,222 6.1 4.2 1,368.0Georgia................................ 10,292,371 9,486,639 8,784,065 8.5 8.0 1,399.7
Hawaii ................................. 3,079,404 2,874,496 2,993,378 7.1 -4.0 2,601.5Idaho .................................... 1,857,006 1,733,120 1,619,602 7.1 7.0 1,561.5Illinois .................................. 17,277,319 16,589,789 15,471,781 4.1 7.2 1,458.4Indiana ................................ 8,437,031 8,045,753 7,283,449 4.9 10.5 1,444.6Iowa ..................................... 4,440,540 4,403,428 4,130,450 0.8 6.6 1,557.1
Kansas................................. 3,978,761 3,765,488 3,674,816 5.7 2.5 1,546.9Kentucky ............................. 6,489,256 6,284,623 5,692,730 3.3 10.4 1,670.9Louisiana ............................ 4,906,283 4,676,969 4,382,693 4.9 6.7 1,127.7Maine ................................... 1,896,564 1,812,574 1,764,588 4.6 2.7 1,525.4Maryland ............................ 8,166,692 8,060,982 7,582,734 1.3 6.3 1,610.3
Massachusetts.................... 12,455,370 11,601,135 11,016,505 7.4 5.3 2,044.4Michigan ............................. 19,128,687 17,723,494 15,419,391 7.9 14.9 1,993.7Minnesota ........................... 10,242,646 9,327,886 8,650,998 9.8 7.8 2,199.1Mississippi .......................... 3,860,523 3,599,244 3,325,387 7.3 8.2 1,421.3Missouri .............................. 7,210,351 6,751,959 5,909,982 6.8 14.2 1,345.5
Montana .............................. 1,256,416 1,214,152 1,160,867 3.5 4.6 1,428.8Nebraska............................. 2,369,462 2,219,725 2,143,628 6.7 3.5 1,434.2Nevada ................................. 2,889,254 2,698,343 2,380,709 7.1 13.3 1,802.2New Hampshire.................. 837,092 918,461 837,002 -8.9 9.7 720.1New Jersey .......................... 14,384,897 13,606,950 13,494,043 5.7 0.8 1,800.8
New Mexico ........................ 3,060,637 2,844,484 3,020,921 7.6 -5.8 1,786.3New York ............................. 34,150,039 34,294,492 32,816,619 -0.4 4.5 1,877.9North Carolina ................... 11,882,318 11,425,714 10,518,600 4.0 8.6 1,622.6North Dakota ...................... 985,327 958,725 884,714 2.8 8.4 1,531.1Ohio ..................................... 15,649,492 15,186,174 14,188,451 3.1 7.0 1,400.7
Oklahoma ........................... 4,617,688 4,416,463 4,262,983 4.6 3.6 1,398.9Oregon ................................. 4,415,725 4,286,038 4,039,416 3.0 6.1 1,378.3Pennsylvania....................... 18,295,012 18,262,139 17,141,998 0.2 6.5 1,517.5Rhode Island ...................... 1,549,195 1,490,340 1,436,125 3.9 3.8 1,564.5South Carolina ................... 5,113,034 4,763,097 4,501,767 7.3 5.8 1,382.4
South Dakota...................... 730,251 694,037 659,225 5.2 5.3 997.1Tennessee............................ 6,184,562 5,907,721 5,733,262 4.7 3.0 1,162.6Texas .................................... 21,270,839 20,288,774 19,465,331 4.8 4.2 1,112.0Utah ..................................... 2,913,960 2,675,502 2,415,880 8.9 10.7 1,456.6Vermont ............................... 841,029 801,376 832,515 4.9 -3.7 1,428.7
Virginia ............................... 8,900,413 8,783,939 8,037,069 1.3 9.3 1,333.3Washington ......................... 10,586,463 10,195,584 9,700,847 3.8 5.1 1,913.4West Virginia ...................... 2,770,888 2,731,907 2,554,198 1.4 7.0 1,517.7Wisconsin............................ 10,292,434 9,029,488 8,427,695 14.0 7.1 1,994.7Wyoming ............................. 625,966 666,725 739,395 -6.1 -9.8 1,300.3
Source: U.S. Department of Commerce, Bureau of the Census.

280The Book of the States 1998-99
TAXES
Table 6.29STATE GOVERNMENT TAX REVENUE, BY TYPE OF TAX: 1996(In thousands of dollars)
Sales and Individual Corporation Documentary andState Total gross receipts Licenses income net income Severance Property Death and gift stock transfer Other
United States................. $418,970,791 $205,687,307 $27,036,285 $134,683,257 $29,315,684 $4,112,485 $9,973,524 $5,320,098 $2,559,338 $282,813
Alabama .............................. 5,257,771 2,773,974 422,841 1,577,914 217,616 78,557 134,252 32,407 20,210 0Alaska .................................. 1,519,082 99,124 78,896 0 326,270 956,961 56,168 1,658 0 5Arizona ................................ 6,409,395 3,658,165 391,385 1,494,282 448,040 0 363,315 54,208 0 0Arkansas ............................. 3,708,744 1,939,666 216,315 1,162,401 228,801 13,396 7,363 117,253 13,686 9,863California ............................ 57,746,664 24,092,750 3,034,776 20,760,385 5,831,072 38,184 3,375,264 614,233 0 0
Colorado ............................. 4,820,163 2,037,377 255,753 2,274,185 205,700 14,839 0 32,126 0 183Connecticut......................... 7,830,171 3,932,290 330,986 2,614,481 641,389 0 38 245,908 65,079 0Delaware ............................. 1,688,349 252,744 533,401 631,598 166,021 0 0 22,394 80,600 1,591Florida ................................. 19,699,255 15,240,513 1,315,384 0 1,007,556 65,432 754,482 406,611 909,277 0Georgia ................................ 10,292,371 4,785,987 420,202 4,244,096 719,400 0 35,651 66,538 159 20,338
Hawaii ................................. 3,079,404 1,904,683 85,456 999,976 65,547 0 0 17,540 6,202 0Idaho .................................... 1,857,006 851,793 155,992 655,050 152,735 2,978 0 6,102 0 32,356Illinois .................................. 17,277,319 8,485,929 951,871 5,781,239 1,621,276 0 212,144 187,341 37,519 0Indiana ................................ 8,437,031 3,761,281 201,776 3,477,970 894,403 574 2,876 98,151 0 0Iowa ..................................... 4,440,540 2,147,520 414,215 1,588,052 202,929 0 0 79,885 7,939 0
Kansas................................. 3,978,761 1,930,900 203,098 1,377,253 254,873 73,571 40,362 98,704 0 0Kentucky ............................. 6,489,256 3,065,661 381,299 2,074,572 284,733 186,125 411,635 81,441 3,790 0Louisiana ............................ 4,906,283 2,558,812 418,327 1,160,262 327,543 362,728 20,304 58,307 0 0Maine ................................... 1,896,564 935,796 114,473 709,491 71,062 0 43,467 12,380 9,895 0Maryland ............................ 8,166,692 3,554,952 357,725 3,484,896 330,553 0 226,767 109,320 66,047 36,432
Massachusetts.................... 12,455,370 3,887,937 397,522 6,706,870 1,227,861 0 102 188,021 47,057 0Michigan ............................. 19,128,687 8,324,240 982,069 5,868,406 2,189,742 36,776 1,640,411 87,043 0 0Minnesota ........................... 10,242,646 4,492,395 769,236 4,135,548 703,099 3,198 8,288 42,898 87,984 0Mississippi .......................... 3,860,523 2,602,402 247,462 742,157 201,742 28,222 23,733 14,805 0 0Missouri .............................. 7,210,351 3,451,466 516,491 2,740,707 425,542 12 14,626 55,887 0 5,620
Montana .............................. 1,256,416 269,478 147,824 383,092 75,762 88,303 229,692 15,404 0 46,861Nebraska............................. 2,369,462 1,224,525 158,146 840,210 126,801 1,492 4,114 9,461 4,713 0Nevada ................................. 2,889,254 2,434,901 312,972 0 0 46,589 55,094 37,562 2,136 0New Hampshire.................. 837,092 428,740 108,038 51,857 179,652 0 424 37,949 30,432 0New Jersey .......................... 14,384,897 7,363,746 752,861 4,733,786 1,155,270 0 2,770 310,656 65,808 0
New Mexico ........................ 3,060,637 1,735,760 164,818 642,800 163,402 307,231 36,560 10,066 0 0New York ............................. 34,150,039 11,913,517 973,607 17,398,595 2,729,835 0 0 799,326 335,159 0North Carolina ................... 11,882,318 5,143,859 732,907 4,929,008 939,278 1,869 11,448 123,949 0 0North Dakota ...................... 985,327 559,751 77,715 151,592 74,299 115,470 2,079 4,421 0 0Ohio ..................................... 15,649,492 7,604,288 1,218,717 5,902,884 807,435 8,990 17,227 89,951 0 0

The Council of State Governments
281
TAXES
STATE GOVERNMENT TAX REVENUE, BY TYPE OF TAX: 1996 — Continued
Sales and Individual Corporation Documentary andState Total gross receipts Licenses income net income Severance Property Death and gift stock transfer Other
Oklahoma ........................... 4,617,688 1,870,060 658,486 1,512,410 163,734 319,904 0 67,882 6,604 18,608Oregon ................................. 4,415,725 591,357 580,688 2,823,073 300,459 64,409 91 41,305 14,343 0Pennsylvania....................... 18,295,012 8,757,711 1,809,068 5,214,021 1,504,010 0 221,469 553,477 210,821 24,435Rhode Island ...................... 1,549,195 778,189 80,448 580,628 86,973 0 9,125 8,920 4,851 61South Carolina ................... 5,113,034 2,603,702 389,432 1,813,461 250,867 0 11,892 21,005 22,675 0
South Dakota...................... 730,251 572,364 90,336 0 38,099 7,087 0 22,236 129 0Tennessee............................ 6,184,562 4,744,381 609,567 114,434 533,862 989 0 69,626 86,976 24,727Texas .................................... 21,270,839 17,235,431 3,047,806 0 0 827,459 0 160,143 0 0Utah ..................................... 2,913,960 1,470,506 98,909 1,139,080 176,781 20,358 0 8,326 0 0Vermont ............................... 841,029 403,847 71,538 280,918 44,818 0 10,562 5,918 12,291 11,137
Virginia ............................... 8,900,413 3,588,976 418,817 4,300,918 362,830 1,653 18,808 69,398 94,826 44,187Washington ......................... 10,586,463 7,867,511 492,932 0 0 88,348 1,800,457 61,414 275,801 0West Virginia ...................... 2,770,888 1,452,499 155,827 750,889 235,123 158,932 2,416 10,267 4,935 0Wisconsin............................ 10,292,434 4,029,634 613,632 4,857,810 620,889 2,627 84,437 45,602 31,394 6,409Wyoming ............................. 625,966 274,217 74,243 0 0 189,222 83,611 4,673 0 0
Source: U.S. Department of Commerce, Bureau of the Census.

282The Book of the States 1998-99
TAXES
Table 6.30STATE GOVERNMENT SALES AND GROSS RECEIPTS TAX REVENUE: 1996(In thousands of dollars)
General salesor Motor Public Tobacco Alcoholic
State Total gross receipts Total fuels utilities products Insurance beverages Parimutuels Amusements Other
United States............... $205,687,307 $139,278,702 $66,408,605 $25,981,234 $8,600,938 $7,337,848 $9,057,273 $3,666,690 $458,866 $1,862,391 $9,443,365
Alabama .......................... 2,773,974 1,439,145 1,334,829 462,197 403,569 70,320 159,955 115,177 4,506 105 119,000Alaska .............................. 99,124 0 99,124 37,740 2,541 16,766 28,184 11,985 0 1,908 0Arizona ............................ 3,658,165 2,720,378 937,787 497,856 82,952 170,852 132,248 44,635 8,452 792 0Arkansas ......................... 1,939,666 1,375,906 563,760 329,908 0 95,336 61,022 26,278 7,658 713 42,845California ........................ 24,092,750 18,980,224 5,112,526 2,722,191 41,086 658,083 1,251,490 269,127 105,215 0 65,334
Colorado ......................... 2,037,377 1,321,500 715,877 445,152 7,137 66,105 112,827 24,789 8,031 913 50,923Connecticut ..................... 3,932,290 2,444,896 1,487,394 498,126 191,872 124,919 163,286 40,385 11,414 159,650 297,742Delaware ......................... 252,744 0 252,744 94,381 25,175 21,733 50,855 12,228 184 0 48,188Florida ............................. 15,240,513 11,428,999 3,811,514 1,337,982 542,993 458,234 482,053 542,130 81,638 599 365,885Georgia ............................ 4,785,987 3,823,895 962,092 547,641 0 87,241 205,159 122,051 0 0 0
Hawaii ............................. 1,904,683 1,431,802 472,881 77,356 104,131 39,572 86,491 37,811 0 0 127,520Idaho ................................ 851,793 600,112 251,681 159,238 2,890 32,605 51,755 5,193 0 0 0Illinois .............................. 8,485,929 5,057,457 3,428,472 1,190,886 848,553 421,647 144,404 58,304 41,537 309,300 413,841Indiana ............................ 3,761,281 2,867,644 893,637 613,035 4,774 87,206 135,125 32,299 3,275 0 17,923Iowa ................................. 2,147,520 1,456,221 691,299 367,154 0 99,404 104,287 12,550 4,432 103,472 0
Kansas............................. 1,930,900 1,401,023 529,877 295,872 865 55,284 97,403 61,004 5,232 1,053 13,164Kentucky ......................... 3,065,661 1,784,031 1,281,630 401,327 0 18,844 266,986 60,592 21,288 258 512,335Louisiana ........................ 2,558,812 1,621,872 936,940 502,015 19,635 87,936 238,144 52,956 4,199 1,501 30,554Maine ............................... 935,796 657,955 277,841 156,448 523 44,989 38,736 34,211 2,934 0 0Maryland ........................ 3,554,952 2,000,298 1,554,654 606,406 136,679 132,288 165,786 23,327 3,026 5,239 481,903
Massachusetts................ 3,887,937 2,610,094 1,277,843 598,773 0 232,845 294,139 60,266 11,377 7,586 72,857Michigan ......................... 8,324,240 6,586,563 1,737,677 783,358 0 590,900 209,588 119,275 8,682 0 25,874Minnesota ....................... 4,492,395 2,900,125 1,592,270 519,713 53 180,419 164,480 55,488 1,524 66,168 604,425Mississippi ...................... 2,602,402 1,831,963 770,439 354,682 0 56,411 104,662 38,528 0 216,156 0Missouri .......................... 3,451,466 2,465,479 985,987 565,564 300 115,954 180,525 23,409 0 100,235 0
Montana .......................... 269,478 0 269,478 176,047 12,756 14,549 36,388 18,234 176 0 11,328Nebraska......................... 1,224,525 814,748 409,777 269,114 2,505 47,805 38,200 15,772 644 9,455 26,282Nevada ............................. 2,434,901 1,571,703 863,198 196,116 5,669 53,781 95,459 13,256 0 488,307 10,610New Hampshire.............. 428,740 0 428,740 107,300 52,944 44,497 47,054 10,893 5,093 1,933 159,026New Jersey ...................... 7,363,746 4,318,373 3,045,373 461,045 1,435,103 251,500 300,401 75,158 2,257 306,183 213,726
New Mexico .................... 1,735,760 1,283,843 451,917 225,631 10,365 25,988 59,264 35,350 903 1,119 93,297New York ......................... 11,913,517 6,963,058 4,950,459 504,373 1,666,959 690,568 735,582 197,798 45,111 492 1,109,576North Carolina ............... 5,143,859 2,970,566 2,173,293 951,595 299,145 46,698 231,046 164,894 0 0 479,915North Dakota .................. 559,751 282,131 277,620 95,420 27,634 24,403 19,578 5,177 0 11,745 93,663Ohio ................................. 7,604,288 4,991,363 2,612,925 1,201,612 680,095 297,866 337,539 78,650 12,002 0 5,161
Selective sales and gross receipts

The Council of State G
overnments
283
TAXES
STATE GOVERNMENT SALES AND GROSS RECEIPTS TAX REVENUE: 1996 � Continued
General salesor Motor Public Tobacco Alcoholic
State Total gross receipts Total fuels utilities products Insurance beverages Parimutuels Amusements Other
Oklahoma ....................... 1,870,060 1,210,391 659,669 341,744 14,372 77,957 141,153 57,866 3,378 13,556 9,643Oregon ............................. 591,357 0 591,357 380,024 8,466 120,185 69,616 11,228 1,724 114 0Pennsylvania................... 8,757,711 5,701,275 3,056,436 759,649 665,606 341,641 400,227 149,546 21,223 500 718,044Rhode Island .................. 778,189 465,133 313,056 125,651 65,258 53,769 33,645 8,578 6,029 0 20,126South Carolina ............... 2,603,702 1,919,340 684,362 321,641 31,441 26,098 75,803 115,809 0 27,612 85,958
South Dakota.................. 572,364 383,423 188,941 89,565 1,536 21,792 31,487 9,993 371 34 34,163Tennessee........................ 4,744,381 3,537,315 1,207,066 715,111 5,528 83,898 221,805 66,206 0 0 114,518Texas ................................ 17,235,431 10,811,287 6,424,144 2,322,645 336,730 566,769 589,809 418,719 11,767 25,067 2,152,638Utah ................................. 1,470,506 1,170,120 300,386 206,904 0 28,694 42,139 22,649 0 0 0Vermont ........................... 403,847 182,528 221,319 58,570 7,776 14,015 18,099 13,346 29 0 109,484
Virginia ........................... 3,588,976 1,995,787 1,593,189 706,823 114,872 16,112 218,046 108,767 0 62 428,507Washington ..................... 7,867,511 6,182,443 1,685,068 676,716 238,843 278,315 202,679 135,874 3,131 22 149,488West Virginia .................. 1,452,499 797,289 655,210 206,139 203,140 33,652 71,377 7,827 5,176 0 127,899Wisconsin........................ 4,029,634 2,708,052 1,321,582 673,525 298,467 205,350 98,678 40,000 5,020 542 0Wyoming ......................... 274,217 210,952 63,265 43,273 0 6,053 12,609 1,102 228 0 0
Selective sales and gross receipts
Source: U.S. Department of Commerce, Bureau of the Census.

284The Book of the States 19998-99
TAXES
Table 6.31STATE GOVERNMENT LICENSE TAX REVENUE: 1996(In thousands of dollars)
State or other Motor Motor vehicle Corporations Occupations and Hunting and Alcoholic Publicjurisdiction Total vehicle operators in general businesses, n.e.c. fishing beverages utilities Amusements Other
United States................ $27,036,285 $12,740,349 $1,166,843 $5,158,425 $5,610,852 $989,955 $307,061 $372,725 $240,872 $449,203
Alabama .............................. 422,841 169,735 18,018 111,172 95,538 17,963 2,431 7,984 0 0Alaska .................................. 78,896 29,926 0 1,361 27,429 18,360 1,298 286 90 146Arizona ................................ 391,385 288,376 11,646 5,145 44,642 15,599 4,038 0 19 21,920Arkansas ............................. 216,315 98,297 14,218 9,655 59,502 18,582 1,560 9,790 295 4,416California ............................ 3,034,776 1,517,816 110,753 23,393 1,189,820 74,157 40,712 70,727 181 7,217
Colorado ............................. 255,753 131,550 12,172 3,966 40,439 55,027 3,669 0 2,106 6,824Connecticut......................... 330,986 204,651 27,055 11,589 73,144 3,334 6,647 0 333 4,233Delaware ............................. 533,401 32,802 161 350,035 144,764 899 591 2,388 65 1,696Florida ................................. 1,315,384 786,039 93,887 123,420 222,771 14,007 31,599 25,661 8,041 9,959Georgia ................................ 420,202 208,092 33,997 31,229 63,496 19,794 4,471 0 0 59,123
Hawaii ................................. 85,456 60,310 560 1,704 14,712 227 0 7,586 0 357Idaho .................................... 155,992 59,759 5,507 803 35,034 23,567 1,112 27,574 0 2,636Illinois .................................. 951,871 712,097 46,196 102,261 60,975 22,243 3,924 0 932 3,243Indiana ................................ 201,776 124,178 0 4,348 47,215 13,577 7,301 0 4,652 505Iowa ..................................... 414,215 271,076 15,125 27,146 62,467 16,995 8,545 7,835 3,264 1,762
Kansas................................. 203,098 125,309 9,530 19,603 29,041 11,384 2,021 3,946 164 2,100Kentucky ............................. 381,299 167,911 9,269 91,200 85,573 17,238 2,277 4,691 410 2,730Louisiana ............................ 418,327 96,808 9,326 237,170 49,145 16,673 2,060 5,773 0 1,372Maine ................................... 114,473 56,287 9,234 2,610 31,135 11,092 2,871 0 583 661Maryland ............................ 357,725 196,519 17,104 14,775 114,891 10,929 503 0 13 2,991
Massachusetts.................... 397,522 219,512 55,635 18,872 59,298 5,001 1,172 0 558 37,474Michigan ............................. 982,069 624,169 40,570 9,922 212,293 41,429 10,125 17,121 710 25,730Minnesota ........................... 769,236 484,007 26,191 3,246 204,659 36,611 828 0 350 13,344Mississippi .......................... 247,462 108,891 16,991 68,339 37,442 11,496 3,144 0 1,108 51Missouri .............................. 516,491 234,112 17,902 82,344 126,016 22,614 3,469 16,604 856 12,574
Montana .............................. 147,824 47,097 4,525 1,050 26,822 30,045 1,526 10 35,848 901Nebraska............................. 158,146 71,856 6,604 5,517 48,457 9,653 246 0 0 15,813Nevada ................................. 312,972 91,944 10,645 14,252 114,648 495 0 0 77,174 3,814New Hampshire.................. 108,038 52,548 7,609 4,017 27,639 6,041 3,077 4,001 497 2,609New Jersey .......................... 752,861 394,350 28,751 129,468 123,395 11,782 5,503 3,463 52,941 3,208
New Mexico ........................ 164,818 119,127 6,214 2,347 18,824 13,835 3,659 38 170 604New York ............................. 973,607 622,500 90,334 31,357 90,620 45,572 30,976 58,790 35 3,423North Carolina ................... 732,907 337,461 69,018 198,197 96,653 15,515 5,856 0 7,248 2,959North Dakota ...................... 77,715 38,095 3,177 0 28,930 7,022 243 0 248 0Ohio ..................................... 1,218,717 509,418 34,572 372,387 241,498 29,850 24,990 854 0 5,148
.

The Council of State G
overnments
285
TAXES
STATE GOVERNMENT LICENSE TAX REVENUE: 1996 � Continued
State or other Motor Motor vehicle Corporations Occupations and Hunting and Alcoholic Publicjurisdiction Total vehicle operators in general businesses, n.e.c. fishing beverages utilities Amusements Other
Oklahoma ........................... 658,486 520,164 5,721 37,893 73,864 11,061 4,667 7 4,799 310Oregon ................................. 580,688 338,603 17,182 5,317 180,308 25,502 1,815 7,098 2,540 2,323Pennsylvania....................... 1,809,068 491,377 52,370 892,264 263,430 44,188 14,188 43,286 104 7,861Rhode Island ...................... 80,448 53,599 350 9,992 14,717 1,356 64 0 239 131South Carolina ................... 389,432 96,260 17,364 34,037 94,284 13,083 10,473 0 25,932 97,999
South Dakota...................... 90,336 30,387 2,043 1,032 38,172 12,634 256 0 213 5,599Tennessee............................ 609,567 202,772 37,652 272,582 69,994 17,949 1,642 5,234 0 1,742Texas .................................... 3,047,806 765,392 82,899 1,667,996 418,093 47,913 24,499 15,291 7,670 18,053Utah ..................................... 98,909 46,964 8,918 3,413 15,334 13,443 785 0 0 10,052Vermont ............................... 71,538 44,047 3,995 1,132 14,742 4,747 451 0 134 2,290
Virginia ............................... 418,817 257,941 24,074 25,607 82,461 18,026 6,580 0 0 4,128Washington ......................... 492,932 237,888 23,354 10,659 141,537 29,273 9,125 12,543 142 28,411West Virginia ...................... 155,827 89,063 4,254 6,367 20,431 13,711 9,560 12,104 0 337Wisconsin............................ 613,632 230,934 21,350 71,067 231,663 49,902 505 0 208 8,003Wyoming ............................. 74,243 42,333 2,821 5,167 2,895 18,559 7 2,040 0 421
Source: U.S. Department of Commerce, Bureau of the Census.

TAXES
286 The Book of the States 1998-99
Table 6.32FISCAL YEAR, POPULATION AND PERSONAL INCOME, BY STATE
Date of close of Amount Per capitaState fiscal year in 1996 July 1, 1996 July 1, 1995 July 1, 1994 (in millions) (in dollars)
United States...................... … 264,741 262,335 259,804 $6,079,436 $23,208
Alabama .............................. September 30 4,273 4,246 4,215 81,578 19,181Alaska .................................. June 30 607 603 601 14,488 24,002Arizona ................................ June 30 4,428 4,305 4,092 86,420 20,489Arkansas ............................. June 30 2,510 2,485 2,455 44,958 18,101California ............................ June 30 31,878 31,565 31,362 760,431 24,073
Colorado ............................. June 30 3,823 3,748 3,663 89,771 23,961Connecticut......................... June 30 3,274 3,271 3,273 104,056 31,776Delaware ............................. June 30 725 717 708 18,843 26,273Florida ................................. June 30 14,400 14,184 13,965 326,668 23,061Georgia ................................ June 30 7,353 7,209 7,063 156,555 21,741
Hawaii ................................. June 30 1,184 1,179 1,173 29,184 24,590Idaho .................................... June 30 1,189 1,166 1,136 21,993 18,906Illinois .................................. June 30 11,847 11,790 11,734 298,413 25,225Indiana ................................ June 30 5,841 5,797 5,750 124,384 21,433Iowa ..................................... June 30 2,852 2,843 2,832 59,453 20,921
Kansas................................. June 30 2,572 2,564 2,550 56,028 21,841Kentucky ............................. June 30 3,884 3,857 3,826 72,762 18,849Louisiana ............................ June 30 4,351 4,338 4,315 82,422 18,981Maine ................................... June 30 1,243 1,239 1,238 24,957 20,105Maryland ............................ June 30 5,072 5,039 5,000 132,784 26,333
Massachusetts.................... June 30 6,092 6,071 6,042 170,185 28,021Michigan ............................. September 30 9,594 9,538 9,486 228,369 23,915Minnesota ........................... June 30 4,658 4,615 4,572 110,494 23,971Mississippi .......................... June 30 2,716 2,696 2,668 44,998 16,683Missouri .............................. June 30 5,359 5,319 5,275 116,154 21,819
Montana .............................. June 30 879 870 857 16,052 18,445Nebraska............................. June 30 1,652 1,639 1,626 35,161 21,477Nevada ................................. June 30 1,603 1,533 1,464 37,319 24,390New Hampshire.................. June 30 1,162 1,148 1,135 29,381 25,587New Jersey .......................... June 30 7,988 7,950 7,906 237,155 29,848
New Mexico ........................ June 30 1,713 1,690 1,659 30,685 18,206New York ............................. March 31 18,185 18,191 18,197 501,965 27,678North Carolina ................... June 30 7,323 7,202 7,079 151,841 21,103North Dakota ...................... June 30 644 642 640 11,945 18,625Ohio ..................................... June 30 11,173 11,134 11,097 251,037 22,514
Oklahoma ........................... June 30 3,301 3,275 3,254 60,901 18,580Oregon ................................. June 30 3,204 3,149 3,094 67,870 21,611Pennsylvania....................... June 30 12,056 12,060 12,058 284,386 23,558Rhode Island ...................... June 30 990 992 996 23,601 23,844South Carolina ................... June 30 3,699 3,667 3,643 69,786 18,998
South Dakota...................... June 30 732 730 724 14,272 19,576Tennessee............................ June 30 5,320 5,247 5,175 110,579 21,038Texas .................................... August 31 19,128 18,801 18,434 397,067 21,206Utah ..................................... June 30 2,000 1,958 1,910 35,577 18,232Vermont ............................... June 30 589 585 581 12,415 21,231
Virginia ............................... June 30 6,675 6,615 6,550 158,669 23,974Washington ......................... June 30 5,533 5,448 5,351 129,117 23,774West Virginia ...................... June 30 1,826 1,825 1,822 32,333 17,687Wisconsin............................ June 30 5,160 5,122 5,084 114,042 22,261Wyoming ............................. June 30 481 479 476 9,932 20,684
Total population Personal income, calendar (excluding armed forces overseas) year 1995
(in thousands)
Source: U.S. Department of Commerce, Bureau of the Census. Key: … — Not applicable

FEDERAL EXPENDITURES
The Council of State Governments 287
Table 6.33SUMMARY DISTRIBUTION OF FEDERAL FUNDS, BY STATE AND TERRITORY:FISCAL YEAR 1996(In millions of dollars)
State or other Grants to state Salaries Direct payments Otherjurisdiction Total and local governments and wages for individuals Procurement programs
United States................. $1,394,057 $227,542 $169,731 $749,273 $200,543 $46,968
Alabama .............................. 23,409 3,325 2,898 13,616 2,937 634Alaska .................................. 4,341 1,051 1,327 1,021 804 138Arizona ................................ 21,819 3,095 2,523 12,269 3,485 446Arkansas ............................. 12,076 2,131 1,037 7,984 453 470California ............................ 157,446 26,413 18,038 80,432 27,724 4,839
Colorado ............................. 20,009 2,410 3,235 8,814 4,656 894Connecticut......................... 17,915 3,080 1,418 9,692 3,123 602Delaware ............................. 3,363 600 411 2,096 154 102Florida ................................. 79,166 8,442 7,660 53,349 8,126 1,589Georgia ................................ 34,731 5,359 5,904 17,933 4,741 794
Hawaii ................................. 8,016 1,126 2,409 3,238 1,027 217Idaho .................................... 5,476 887 630 2,865 945 149Illinois .................................. 51,229 9,229 5,440 31,744 3,165 1,652Indiana ................................ 24,215 3,657 1,970 15,096 2,090 1,402Iowa ..................................... 13,408 2,030 944 7,687 778 1,970
Kansas................................. 12,347 1,700 1,700 7,054 1,110 784Kentucky ............................. 19,618 3,355 2,442 11,289 2,005 528Louisiana ............................ 22,117 4,734 2,084 12,575 2,086 638Maine ................................... 6,808 1,389 722 3,654 907 135Maryland ............................ 37,040 3,544 7,324 14,491 8,522 3,160
Massachusetts.................... 36,456 6,813 2,857 18,731 6,081 1,975Michigan ............................. 39,286 7,194 2,778 26,183 2,189 941Minnesota ........................... 18,857 3,535 1,655 10,694 1,535 1,439Mississippi .......................... 15,184 2,754 1,571 8,191 2,326 342Missouri .............................. 35,094 4,091 3,185 15,667 10,594 1,558
Montana .............................. 4,973 964 632 2,416 263 698Nebraska............................. 7,595 1,232 1,031 4,216 585 531Nevada ................................. 7,428 876 850 4,201 1,407 94New Hampshire.................. 5,001 890 448 2,842 672 149New Jersey .......................... 38,346 6,506 3,556 23,889 3,750 645
New Mexico ........................ 12,073 1,942 1,686 4,429 3,676 340New York ............................. 94,667 24,560 7,157 54,035 6,320 2,596North Carolina ................... 32,771 5,227 4,898 19,453 2,293 900North Dakota ...................... 3,570 734 644 1,656 210 326Ohio ..................................... 50,143 8,776 4,612 31,166 4,583 1,005
Oklahoma ........................... 16,685 2,435 2,721 9,880 1,205 444Oregon ................................. 14,173 2,797 1,410 8,798 610 557Pennsylvania....................... 64,166 10,117 5,625 40,973 5,531 1,920Rhode Island ...................... 5,658 1,176 634 3,266 423 159South Carolina ................... 18,401 3,032 2,203 10,336 2,505 325
South Dakota...................... 3,872 867 534 1,971 249 252Tennessee............................ 27,557 4,476 2,702 15,497 4,317 565Texas .................................... 86,493 13,297 11,249 45,723 13,840 2,385Utah ..................................... 8,193 1,446 1,478 3,919 1,072 278Vermont ............................... 2,775 641 270 1,485 295 84
Virginia ............................... 50,301 3,403 12,322 18,562 14,529 1,486Washington ......................... 29,246 4,152 4,574 14,838 4,603 1,079West Virginia ...................... 10,059 2,088 815 6,407 514 235Wisconsin............................ 19,958 3,679 1,377 12,925 1,162 816Wyoming ............................. 2,515 708 395 1,195 153 63
Dist. of Columbia ............... 22,475 2,578 11,304 2,596 4,580 1,417American Samoa................ 108 71 2 26 4 4Guam ................................... 827 134 384 177 112 20No. Mariana Islands.......... 44 31 2 6 1 4Puerto Rico ......................... 10,304 3,387 713 5,627 405 173U.S. Virgin Islands ............. 563 373 42 109 22 17
U.S. undistributed.............. 23,688 3,009 1,297 290 19,090 2
Source: U.S. Department of Commerce, Bureau of the Census.Note: Detail may not add to totals due to rounding. For additional informationon categories and distributions shown, see footnotes to Tables 6.34 through 6.38.
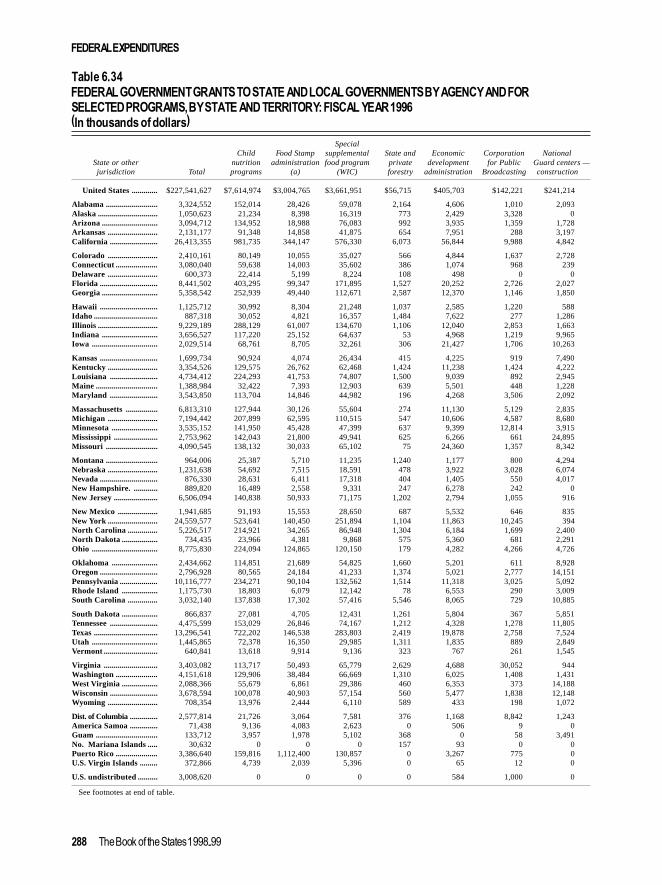
FEDERAL EXPENDITURES
288 The Book of the States 1998-99
Table 6.34FEDERAL GOVERNMENT GRANTS TO STATE AND LOCAL GOVERNMENTS BY AGENCY AND FORSELECTED PROGRAMS, BY STATE AND TERRITORY: FISCAL YEAR 1996(In thousands of dollars)
SpecialChild Food Stamp supplemental State and Economic Corporation National
State or other nutrition administration food program private development for Public Guard centers —jurisdiction Total programs (a) (WIC) forestry administration Broadcasting construction
United States............. $227,541,627 $7,614,974 $3,004,765 $3,661,951 $56,715 $405,703 $142,221 $241,214
Alabama .......................... 3,324,552 152,014 28,426 59,078 2,164 4,606 1,010 2,093Alaska .............................. 1,050,623 21,234 8,398 16,319 773 2,429 3,328 0Arizona ............................ 3,094,712 134,952 18,988 76,083 992 3,935 1,359 1,728Arkansas ......................... 2,131,177 91,348 14,858 41,875 654 7,951 288 3,197California ........................ 26,413,355 981,735 344,147 576,330 6,073 56,844 9,988 4,842
Colorado ......................... 2,410,161 80,149 10,055 35,027 566 4,844 1,637 2,728Connecticut ..................... 3,080,040 59,638 14,003 35,602 386 1,074 968 239Delaware ......................... 600,373 22,414 5,199 8,224 108 498 0 0Florida ............................. 8,441,502 403,295 99,347 171,895 1,527 20,252 2,726 2,027Georgia ............................ 5,358,542 252,939 49,440 112,671 2,587 12,370 1,146 1,850
Hawaii ............................. 1,125,712 30,992 8,304 21,248 1,037 2,585 1,220 588Idaho ................................ 887,318 30,052 4,821 16,357 1,484 7,622 277 1,286Illinois .............................. 9,229,189 288,129 61,007 134,670 1,106 12,040 2,853 1,663Indiana ............................ 3,656,527 117,220 25,152 64,637 53 4,968 1,219 9,965Iowa ................................. 2,029,514 68,761 8,705 32,261 306 21,427 1,706 10,263
Kansas............................. 1,699,734 90,924 4,074 26,434 415 4,225 919 7,490Kentucky ......................... 3,354,526 129,575 26,762 62,468 1,424 11,238 1,424 4,222Louisiana ........................ 4,734,412 224,293 41,753 74,807 1,500 9,039 892 2,945Maine ............................... 1,388,984 32,422 7,393 12,903 639 5,501 448 1,228Maryland ........................ 3,543,850 113,704 14,846 44,982 196 4,268 3,506 2,092
Massachusetts................ 6,813,310 127,944 30,126 55,604 274 11,130 5,129 2,835Michigan ......................... 7,194,442 207,899 62,595 110,515 547 10,606 4,587 8,680Minnesota ....................... 3,535,152 141,950 45,428 47,399 637 9,399 12,814 3,915Mississippi ...................... 2,753,962 142,043 21,800 49,941 625 6,266 661 24,895Missouri .......................... 4,090,545 138,132 30,033 65,102 75 24,360 1,357 8,342
Montana .......................... 964,006 25,387 5,710 11,235 1,240 1,177 800 4,294Nebraska......................... 1,231,638 54,692 7,515 18,591 478 3,922 3,028 6,074Nevada ............................. 876,330 28,631 6,411 17,318 404 1,405 550 4,017New Hampshire. ............ 889,820 16,489 2,558 9,331 247 6,278 242 0New Jersey ...................... 6,506,094 140,838 50,933 71,175 1,202 2,794 1,055 916
New Mexico .................... 1,941,685 91,193 15,553 28,650 687 5,532 646 835New York ......................... 24,559,577 523,641 140,450 251,894 1,104 11,863 10,245 394North Carolina ............... 5,226,517 214,921 34,265 86,948 1,304 6,184 1,699 2,400North Dakota .................. 734,435 23,966 4,381 9,868 575 5,360 681 2,291Ohio ................................. 8,775,830 224,094 124,865 120,150 179 4,282 4,266 4,726
Oklahoma ....................... 2,434,662 114,851 21,689 54,825 1,660 5,201 611 8,928Oregon ............................. 2,796,928 80,565 24,184 41,233 1,374 5,021 2,777 14,151Pennsylvania................... 10,116,777 234,271 90,104 132,562 1,514 11,318 3,025 5,092Rhode Island .................. 1,175,730 18,803 6,079 12,142 78 6,553 290 3,009South Carolina ............... 3,032,140 137,838 17,302 57,416 5,546 8,065 729 10,885
South Dakota.................. 866,837 27,081 4,705 12,431 1,261 5,804 367 5,851Tennessee........................ 4,475,599 153,029 26,846 74,167 1,212 4,328 1,278 11,805Texas ................................ 13,296,541 722,202 146,538 283,803 2,419 19,878 2,758 7,524Utah ................................. 1,445,865 72,378 16,350 29,985 1,311 1,835 889 2,849Vermont ........................... 640,841 13,618 9,914 9,136 323 767 261 1,545
Virginia ........................... 3,403,082 113,717 50,493 65,779 2,629 4,688 30,052 944Washington ..................... 4,151,618 129,906 38,484 66,669 1,310 6,025 1,408 1,431West Virginia .................. 2,088,366 55,679 6,861 29,386 460 6,353 373 14,188Wisconsin........................ 3,678,594 100,078 40,903 57,154 560 5,477 1,838 12,148Wyoming ......................... 708,354 13,976 2,444 6,110 589 433 198 1,072
Dist. of Columbia .............. 2,577,814 21,726 3,064 7,581 376 1,168 8,842 1,243America Samoa.............. 71,438 9,136 4,083 2,623 0 506 9 0Guam ............................... 133,712 3,957 1,978 5,102 368 0 58 3,491No. Mariana Islands..... 30,632 0 0 0 157 93 0 0Puerto Rico ..................... 3,386,640 159,816 1,112,400 130,857 0 3,267 775 0U.S. Virgin Islands ......... 372,866 4,739 2,039 5,396 0 65 12 0
U.S. undistributed.......... 3,008,620 0 0 0 0 584 1,000 0
See footnotes at end of table.
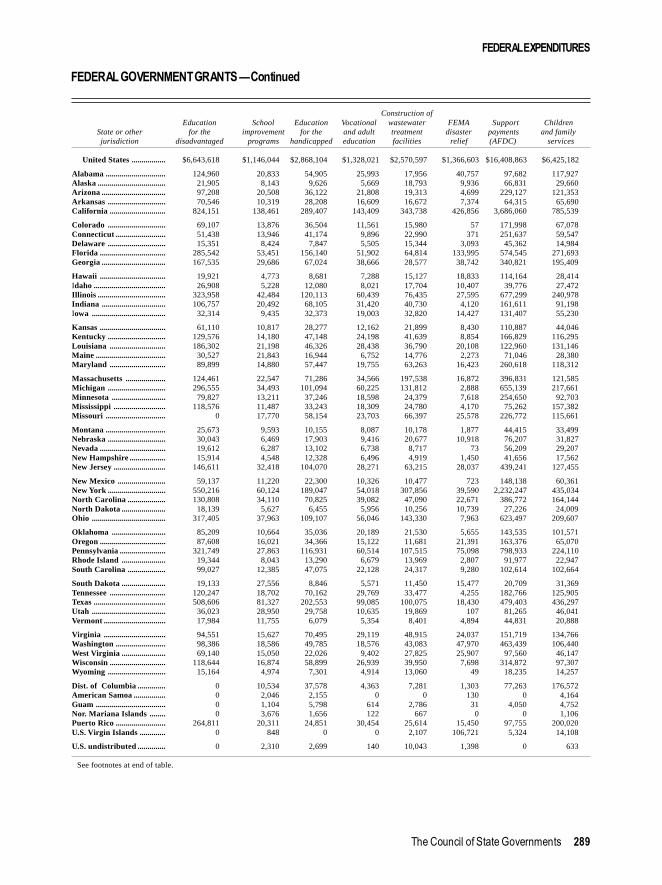
FEDERAL EXPENDITURES
The Council of State Governments 289
FEDERAL GOVERNMENT GRANTS � Continued
Construction ofEducation School Education Vocational wastewater FEMA Support Children
State or other for the improvement for the and adult treatment disaster payments and familyjurisdiction disadvantaged programs handicapped education facilities relief (AFDC) services
United States................. $6,643,618 $1,146,044 $2,868,104 $1,328,021 $2,570,597 $1,366,603 $16,408,863 $6,425,182
Alabama .............................. 124,960 20,833 54,905 25,993 17,956 40,757 97,682 117,927Alaska .................................. 21,905 8,143 9,626 5,669 18,793 9,936 66,831 29,660Arizona ................................ 97,208 20,508 36,122 21,808 19,313 4,699 229,127 121,353Arkansas ............................. 70,546 10,319 28,208 16,609 16,672 7,374 64,315 65,690California ............................ 824,151 138,461 289,407 143,409 343,738 426,856 3,686,060 785,539
Colorado ............................. 69,107 13,876 36,504 11,561 15,980 57 171,998 67,078Connecticut......................... 51,438 13,946 41,174 9,896 22,990 371 251,637 59,547Delaware ............................. 15,351 8,424 7,847 5,505 15,344 3,093 45,362 14,984Florida ................................. 285,542 53,451 156,140 51,902 64,814 133,995 574,545 271,693Georgia ................................ 167,535 29,686 67,024 38,666 28,577 38,742 340,821 195,409
Hawaii ................................. 19,921 4,773 8,681 7,288 15,127 18,833 114,164 28,414Idaho .................................... 26,908 5,228 12,080 8,021 17,704 10,407 39,776 27,472Illinois .................................. 323,958 42,484 120,113 60,439 76,435 27,595 677,299 240,978Indiana ................................ 106,757 20,492 68,105 31,420 40,730 4,120 161,611 91,198Iowa ..................................... 32,314 9,435 32,373 19,003 32,820 14,427 131,407 55,230
Kansas................................. 61,110 10,817 28,277 12,162 21,899 8,430 110,887 44,046Kentucky ............................. 129,576 14,180 47,148 24,198 41,639 8,854 166,829 116,295Louisiana ............................ 186,302 21,198 46,326 28,438 36,790 20,108 122,960 131,146Maine ................................... 30,527 21,843 16,944 6,752 14,776 2,273 71,046 28,380Maryland ............................ 89,899 14,880 57,447 19,755 63,263 16,423 260,618 118,312
Massachusetts.................... 124,461 22,547 71,286 34,566 197,538 16,872 396,831 121,585Michigan ............................. 296,555 34,493 101,094 60,225 131,812 2,888 655,139 217,661Minnesota ........................... 79,827 13,211 37,246 18,598 24,379 7,618 254,650 92,703Mississippi .......................... 118,576 11,487 33,243 18,309 24,780 4,170 75,262 157,382Missouri .............................. 0 17,770 58,154 23,703 66,397 25,578 226,772 115,661
Montana .............................. 25,673 9,593 10,155 8,087 10,178 1,877 44,415 33,499Nebraska............................. 30,043 6,469 17,903 9,416 20,677 10,918 76,207 31,827Nevada ................................. 19,612 6,287 13,102 6,738 8,717 73 56,209 29,207New Hampshire.................. 15,914 4,548 12,328 6,496 4,919 1,450 41,656 17,562New Jersey .......................... 146,611 32,418 104,070 28,271 63,215 28,037 439,241 127,455
New Mexico ........................ 59,137 11,220 22,300 10,326 10,477 723 148,138 60,361New York ............................. 550,216 60,124 189,047 54,018 307,856 39,590 2,232,247 435,034North Carolina ................... 130,808 34,110 70,825 39,082 47,090 22,671 386,772 164,144North Dakota ...................... 18,139 5,627 6,455 5,956 10,256 10,739 27,226 24,009Ohio ..................................... 317,405 37,963 109,107 56,046 143,330 7,963 623,497 209,607
Oklahoma ........................... 85,209 10,664 35,036 20,189 21,530 5,655 143,535 101,571Oregon ................................. 87,608 16,021 34,366 15,122 11,681 21,391 163,376 65,070Pennsylvania....................... 321,749 27,863 116,931 60,514 107,515 75,098 798,933 224,110Rhode Island ...................... 19,344 8,043 13,290 6,679 13,969 2,807 91,977 22,947South Carolina ................... 99,027 12,385 47,075 22,128 24,317 9,280 102,614 102,664
South Dakota...................... 19,133 27,556 8,846 5,571 11,450 15,477 20,709 31,369Tennessee............................ 120,247 18,702 70,162 29,769 33,477 4,255 182,766 125,905Texas .................................... 508,606 81,327 202,553 99,085 100,075 18,430 479,403 436,297Utah ..................................... 36,023 28,950 29,758 10,635 19,869 107 81,265 46,041Vermont ............................... 17,984 11,755 6,079 5,354 8,401 4,894 44,831 20,888
Virginia ............................... 94,551 15,627 70,495 29,119 48,915 24,037 151,719 134,766Washington ......................... 98,386 18,586 49,785 18,576 43,083 47,970 463,439 106,440West Virginia ...................... 69,140 15,050 22,026 9,402 27,825 25,907 97,560 46,147Wisconsin............................ 118,644 16,874 58,899 26,939 39,950 7,698 314,872 97,307Wyoming ............................. 15,164 4,974 7,301 4,914 13,060 49 18,235 14,257
Dist. of Columbia.............. 0 10,534 37,578 4,363 7,281 1,303 77,263 176,572American Samoa................ 0 2,046 2,155 0 0 130 0 4,164Guam ................................... 0 1,104 5,798 614 2,786 31 4,050 4,752Nor. Mariana Islands ........ 0 3,676 1,656 122 667 0 0 1,106Puerto Rico ......................... 264,811 20,311 24,851 30,454 25,614 15,450 97,755 200,020U.S. Virgin Islands ............. 0 848 0 0 2,107 106,721 5,324 14,108
U.S. undistributed.............. 0 2,310 2,699 140 10,043 1,398 0 633
See footnotes at end of table.

FEDERAL EXPENDITURES
290 The Book of the States 1998-99
FEDERAL GOVERNMENT GRANTS � Continued
Section 8 Office of JusticeLow income Centers for Substance Supplemental housing Public Assistance-
State or other home energy Disease abuse and Security assistance housing Justicejurisdiction assistance Medicaid Control mental health Income grants (b) grants programs
United States............. $1,185,591 $91,990,238 $629,280 $1,495,756 $29,903 $8,998,759 $3,468,089 $1,790,538
Alabama .......................... 9,930 1,454,922 8,272 20,901 623 53,193 77,348 29,575Alaska .............................. 6,455 198,744 448 2,071 181 21,566 21,378 5,539Arizona ............................ 5,234 1,174,075 9,900 21,565 334 39,994 80,091 53,120Arkansas ......................... 6,604 956,235 6,601 10,735 75 36,108 76,180 17,661California ........................ 40,180 9,021,388 73,875 203,269 1,905 1,334,654 79,930 212,711
Colorado ......................... 20,339 777,351 7,046 21,068 90 126,719 75,455 23,448Connecticut ..................... 19,973 1,429,283 6,226 17,143 198 84,417 80,186 18,493Delaware ......................... 2,547 215,151 1,590 4,091 49 14,169 3 7,527Florida ............................. 15,395 3,382,113 28,511 61,542 915 279,683 82,637 98,794Georgia ............................ 9,420 2,276,128 17,713 33,423 148 240,803 78,384 39,098
Hawaii ............................. 1,133 356,647 4,181 7,139 4 77,116 0 4,750Idaho ................................ 6,866 268,283 2,978 5,274 145 21,774 34,898 8,143Illinois .............................. 169,788 3,279,669 23,025 63,389 2,472 732,299 113,306 89,285Indiana ............................ 34,277 1,654,212 9,204 34,748 735 104,817 75,688 28,231Iowa ................................. 20,674 771,117 5,675 13,608 129 47,902 74,745 14,300
Kansas............................. 7,303 587,594 6,367 11,799 340 32,105 65,997 11,878Kentucky ......................... 18,025 1,540,731 9,078 18,525 646 86,260 75,508 19,793Louisiana ........................ 3,867 2,587,713 14,828 24,166 382 91,352 78,049 28,426Maine ............................... 15,665 642,230 3,885 5,934 184 48,524 75,071 6,365Maryland ........................ 18,155 1,303,195 12,090 30,686 665 173,731 75,457 27,305
Massachusetts................ 47,904 2,545,758 13,719 35,932 691 603,868 84,040 51,112Michigan ......................... 40,379 3,119,024 26,034 61,060 1,282 199,743 82,446 56,196Minnesota ....................... 46,135 1,579,616 7,826 22,822 1,103 100,733 76,032 25,899Mississippi ...................... 5,994 1,264,118 8,717 12,554 384 61,848 77,335 18,425Missouri .......................... 30,235 1,821,506 11,311 24,835 606 198,904 82,678 50,239
Montana .......................... 7,028 291,058 2,823 4,153 76 16,810 10,210 6,021Nebraska......................... 13,418 448,756 5,623 6,685 87 28,481 34,342 10,941Nevada ............................. 2,333 263,661 4,634 7,576 108 15,768 54,994 7,741New Hampshire.............. 9,663 391,481 4,350 5,462 113 29,524 60,069 6,238New Jersey ...................... 41,140 2,782,369 11,776 44,620 547 364,200 94,483 74,061
New Mexico .................... 4,092 708,604 6,661 7,403 301 22,585 54,096 18,700New York ......................... 161,117 12,875,197 61,111 100,400 3,065 1,147,751 93,738 138,411North Carolina ............... 15,783 2,590,935 17,055 33,019 731 110,190 77,925 33,930North Dakota .................. 9,585 219,842 2,210 2,875 15 16,945 23,298 8,138Ohio ................................. 53,911 3,971,182 17,523 69,782 2,048 272,339 89,155 67,436
Oklahoma ....................... 8,520 882,003 8,966 16,003 237 53,764 78,616 19,055Oregon ............................. 12,773 986,854 6,820 15,975 260 76,521 75,366 16,823Pennsylvania................... 70,267 4,332,858 22,533 63,246 1,505 537,367 103,759 53,198Rhode Island .................. 6,029 469,083 2,711 5,292 56 80,427 75,415 7,287South Carolina ............... 6,790 1,481,609 7,777 18,291 428 77,094 75,916 24,963
South Dakota.................. 7,044 227,333 1,897 2,712 137 17,415 27,353 7,442Tennessee........................ 15,753 2,202,454 9,322 24,240 1,044 109,278 80,162 40,165Texas ................................ 23,184 6,030,532 51,581 95,039 2,328 546,667 81,511 114,777Utah ................................. 6,678 469,963 4,194 10,919 155 21,834 43,977 19,487Vermont ........................... 4,765 236,373 1,703 2,981 159 20,244 25,145 3,845
Virginia ........................... 21,367 1,137,095 7,934 34,282 812 141,129 79,839 44,501Washington ..................... 23,253 1,639,650 10,467 31,999 368 104,812 76,589 41,727West Virginia .................. 10,226 940,799 5,551 9,310 380 38,468 75,590 11,895Wisconsin........................ 42,752 1,544,993 10,593 26,228 589 107,104 75,856 28,806Wyoming ......................... 2,087 114,486 2,020 1,777 20 6,406 14,101 2,756
Dist. of Columbia ........... 3,099 390,166 4,508 3,992 48 91,521 85,201 5,146American Samoa............ 19 3,075 617 255 0 0 0 879Guam ............................... 34 4,729 1,593 712 0 1,529 0 1,946No. Mariana Islands...... 22 1,423 448 240 0 864 0 479Puerto Rico ..................... 319 132,536 12,981 18,831 0 129,441 78,542 24,616U.S. Virgin Islands ......... 66 4,148 985 544 0 0 0 2,821
U.S. undistributed.......... 0 8,187 1,212 62,634 0 0 0 0
See footnotes at end of table.

FEDERAL EXPENDITURES
The Council of State Governments 291
FEDERAL GOVERNMENT GRANTS � Continued
StateJob Training unemployment State FAA- Federal
State or other Partnership insurance justice Highway airport transit All otherjurisdiction Act & services institute grants trust fund trust fund administration grants
United States................. $3,230,777 $3,180,636 $8,216 $19,543,853 $1,654,552 $4,884,945 $31,565,919
Alabama .............................. 47,867 39,727 53 256,509 19,872 15,023 540,333Alaska .................................. 9,570 31,415 22 230,704 68,970 7,291 223,225Arizona ................................ 58,996 37,548 111 229,680 32,337 22,330 541,222Arkansas ............................. 25,653 26,265 3 204,206 29,289 9,130 286,528California ............................ 580,631 496,657 238 1,522,629 96,282 754,587 3,376,839
Colorado ............................. 34,062 44,597 325 275,404 61,504 22,298 399,288Connecticut......................... 37,640 67,283 0 311,301 8,170 64,927 371,891Delaware ............................. 6,595 9,226 8 73,769 727 13,056 99,512Florida ................................. 168,327 119,188 134 610,261 71,861 139,880 1,089,110Georgia ................................ 58,780 63,716 142 406,359 30,370 99,600 664,995
Hawaii ................................. 14,792 16,110 7 177,069 10,970 16,120 156,499Idaho .................................... 9,293 24,140 3 121,747 9,411 4,833 160,035Illinois .................................. 143,099 143,454 49 600,928 86,607 337,551 1,373,499Indiana ................................ 46,235 45,398 10 325,210 31,647 34,479 483,989Iowa ..................................... 20,689 26,221 142 230,463 14,237 16,072 303,102
Kansas................................. 16,710 24,242 11 208,125 19,244 6,582 269,328Kentucky ............................. 38,324 33,986 40 191,734 42,074 15,719 478,251Louisiana ............................ 63,400 34,320 177 255,926 47,731 31,157 524,421Maine ................................... 17,112 19,354 40 86,363 9,568 6,577 199,037Maryland ............................ 39,481 63,655 329 314,577 13,517 116,662 530,154
Massachusetts.................... 70,648 87,030 74 1,004,610 24,714 339,846 684,636Michigan ............................. 97,735 134,035 213 441,308 55,953 68,512 905,226Minnesota ........................... 33,561 54,584 13 241,577 45,864 24,375 485,238Mississippi .......................... 35,963 23,259 3 182,468 11,543 5,952 355,959Missouri .............................. 52,146 59,139 57 324,473 39,997 51,503 541,480
Montana .............................. 12,336 13,656 3 178,138 12,689 2,689 212,996Nebraska............................. 9,367 16,817 31 143,394 15,674 4,809 195,453Nevada ................................. 17,587 25,176 106 105,844 7,859 12,876 151,386New Hampshire.................. 11,829 13,328 94 78,012 11,841 3,978 123,820New Jersey .......................... 99,797 108,410 13 514,497 26,299 360,308 745,343
New Mexico ........................ 22,420 18,421 33 166,619 15,735 8,774 421,463New York ............................. 233,242 221,688 309 980,079 76,800 879,219 2,779,727North Carolina ................... 54,258 64,384 68 264,854 32,459 29,713 657,990North Dakota ...................... 7,096 14,048 2 93,712 7,286 1,720 172,134Ohio ..................................... 117,759 115,288 109 687,271 35,548 102,457 1,186,542
Oklahoma ........................... 43,421 27,698 1 211,053 9,772 13,670 430,729Oregon ................................. 45,396 40,649 135 213,796 18,442 172,889 530,289Pennsylvania....................... 139,073 162,935 29 686,335 49,164 284,161 1,399,748Rhode Island ...................... 15,922 20,259 1 117,037 18,539 14,252 117,410South Carolina ................... 42,900 35,242 157 206,882 45,013 18,349 333,458
South Dakota...................... 8,018 10,115 0 137,701 8,321 1,926 211,812Tennessee............................ 41,097 38,622 138 348,479 34,004 26,448 646,445Texas .................................... 210,298 171,389 31 1,074,400 182,434 210,452 1,391,020Utah ..................................... 11,693 36,269 15 142,590 12,457 28,408 258,981Vermont ............................... 7,916 9,944 93 81,224 913 4,279 85,507
Virginia ............................... 52,072 53,997 137 339,569 54,849 38,883 559,085Washington ......................... 74,041 90,219 19 332,340 39,465 34,936 560,235West Virginia ...................... 42,364 19,338 3 156,020 6,151 7,697 338,217Wisconsin............................ 33,533 68,689 40 282,900 17,933 47,360 491,877Wyoming ............................. 7,298 10,302 1 123,309 9,907 1,420 309,688
Dist. of Columbia ............... 23,097 15,828 0 62,977 116 329,427 1,203,794American Samoa................ 488 0 0 2,686 1,708 84 36,775Guam ................................... 1,915 459 0 8,513 4,378 304 73,511No. Mariana Islands.......... 74 0 0 0 4,719 0 14,886Puerto Rico ......................... 112,961 28,265 2 84,635 10,557 13,539 653,034U.S. Virgin Islands ............. 2,060 4,646 0 21,320 150 4,961 189,806
U.S. undistributed.............. 2,139 0 4,442 2,870,267 910 897 39,125
Source: U.S. Department of Commerce, Bureau of the Census.Note: Detail may not add to totals due to rounding. All amounts in this
table represent actual expenditures of the federal government during the fis-cal year.
(a) For Puerto Rico, amounts shown is for nutritional assistance grant pro-gram. All other amounts are grant payments for food stamp administration.
(b)Section 8 payments to public agencies; Section 8 payments to non-pub-lic agencies included in Table 6.36.

FEDERAL EXPENDITURES
292 The Book of the States 1998-99
Table 6.35FEDERAL GOVERNMENT EXPENDITURES FOR SALARIES AND WAGES,BY STATE AND TERRITORY: FISCAL YEAR 1996(In thousands of dollars)
Department of Defense
MilitaryAll other
State or other Postal federaljurisdiction Total Total Total Active Inactive Civilian service agencies
United States................. $169,731,101 $72,955,074 $43,138,019 $38,685,092 $4,452,927 $29,817,055 $42,675,500 $54,100,527
Alabama .............................. 2,897,623 1,484,140 696,278 523,820 172,458 787,862 530,110 883,373Alaska .................................. 1,327,453 793,945 620,966 605,440 15,526 172,979 117,071 416,437Arizona ................................ 2,523,183 1,091,725 775,018 719,643 55,375 316,707 590,648 840,810Arkansas ............................. 1,037,424 367,739 252,659 184,566 68,093 115,080 347,852 321,833California ............................ 18,037,723 9,188,974 5,259,817 4,952,715 307,102 3,929,157 4,668,468 4,180,281
Colorado ............................. 3,234,543 1,318,474 927,340 834,590 92,750 391,134 716,650 1,199,419Connecticut......................... 1,417,972 473,173 287,107 254,212 32,895 186,066 622,920 321,879Delaware ............................. 411,168 233,822 180,923 149,915 31,008 52,899 114,309 63,037Florida ................................. 7,660,372 3,685,000 2,529,704 2,379,839 149,865 1,155,296 2,202,063 1,773,309Georgia ................................ 5,904,188 3,321,599 2,180,884 1,988,127 192,757 1,140,715 1,038,951 1,543,638
Hawaii ................................. 2,408,570 2,085,399 1,382,388 1,338,345 44,043 703,011 146,028 177,143Idaho .................................... 630,057 200,587 155,847 130,509 25,338 44,740 143,358 286,112Illinois .................................. 5,440,017 1,589,596 1,007,612 873,397 134,215 581,984 2,251,414 1,599,007Indiana ................................ 1,969,919 690,013 198,611 46,315 152,296 491,402 845,920 433,986Iowa ..................................... 944,096 123,983 76,354 13,527 62,827 47,629 550,320 269,793
Kansas................................. 1,700,085 786,825 604,614 543,881 60,733 182,211 467,731 445,529Kentucky ............................. 2,441,966 1,356,251 1,033,814 974,595 59,219 322,437 513,307 572,408Louisiana ............................ 2,083,585 911,300 641,071 532,259 108,812 270,229 555,338 616,947Maine ................................... 722,301 368,871 134,457 109,056 25,401 234,414 220,837 132,593Maryland ............................ 7,323,944 2,564,522 1,068,880 954,076 114,804 1,495,642 913,824 3,845,598
Massachusetts.................... 2,856,648 585,047 214,953 123,971 90,982 370,094 1,253,758 1,017,843Michigan ............................. 2,778,247 523,045 142,276 50,416 91,860 380,769 1,522,979 732,223Minnesota ........................... 1,654,706 222,399 124,184 29,783 94,401 98,215 881,875 550,432Mississippi .......................... 1,571,452 954,523 597,055 503,396 93,659 357,468 280,823 336,106Missouri .............................. 3,184,746 1,127,239 603,216 444,460 158,756 524,023 1,018,695 1,038,812
Montana .............................. 631,939 195,259 157,727 133,490 24,237 37,532 130,974 305,706Nebraska............................. 1,031,444 517,775 397,606 365,766 31,840 120,169 292,792 220,877Nevada ................................. 849,698 392,286 321,104 304,873 16,231 71,182 203,159 254,253New Hampshire.................. 447,955 97,475 43,536 24,742 18,794 53,939 225,072 125,408New Jersey .......................... 3,556,418 1,219,763 402,974 318,030 84,944 816,789 1,628,357 708,298
New Mexico ........................ 1,686,422 848,691 555,926 526,874 29,052 292,765 214,024 623,707New York ............................. 7,156,846 1,276,839 806,602 635,461 171,141 470,237 3,410,567 2,469,440North Carolina ................... 4,898,359 3,184,830 2,605,628 2,504,484 101,144 579,202 1,000,833 712,696North Dakota ...................... 643,553 390,637 336,195 311,020 25,175 54,442 109,199 143,717Ohio ..................................... 4,611,998 1,844,683 532,177 407,404 124,773 1,312,506 1,780,737 986,578
Oklahoma ........................... 2,720,513 1,696,554 1,033,623 957,126 76,497 662,931 461,009 562,950Oregon ................................. 1,409,950 191,654 92,783 35,730 57,053 98,871 464,830 753,466Pennsylvania....................... 5,625,127 1,796,636 311,384 125,959 185,425 1,485,252 2,207,956 1,620,535Rhode Island ...................... 633,646 339,765 151,474 132,192 19,282 188,291 196,392 97,489South Carolina ................... 2,203,242 1,484,975 1,099,145 1,003,978 95,167 385,830 400,702 317,565
South Dakota...................... 534,450 182,982 143,759 120,517 23,242 39,223 117,669 233,799Tennessee............................ 2,702,165 494,489 279,920 181,744 98,176 214,569 811,071 1,396,605Texas .................................... 11,248,970 5,679,824 3,943,817 3,675,335 268,482 1,736,007 2,615,425 2,953,721Utah ..................................... 1,477,902 760,514 245,475 184,119 61,356 515,039 257,068 460,320Vermont ............................... 269,784 46,956 27,619 5,986 21,633 19,337 115,137 107,691
Virginia ............................... 12,321,991 9,158,394 4,992,720 4,885,942 106,778 4,165,674 1,111,965 2,051,632Washington ......................... 4,573,911 2,773,126 1,717,571 1,608,031 109,540 1,055,555 758,865 1,041,920West Virginia ...................... 814,784 117,067 61,200 18,084 43,116 55,867 277,140 420,577Wisconsin............................ 1,377,481 208,643 110,662 23,834 86,828 97,981 745,054 423,784Wyoming ............................. 395,364 170,645 139,621 125,468 14,153 31,024 67,628 157,091
Dist. of Columbia ............... 11,304,118 1,194,336 540,529 512,417 28,112 653,807 370,916 9,738,866American Samoa................ 2,360 29 0 0 0 29 0 2,331Guam ................................... 384,105 369,890 222,535 219,738 2,797 147,355 0 14,215No. Mariana Islands.......... 1,730 21 0 0 0 21 598 1,111Puerto Rico ......................... 713,229 268,323 168,213 75,712 92,501 100,110 170,795 274,111U.S. Virgin Islands ............. 42,451 3,812 466 183 283 3,346 14,317 24,322
U.S. undistributed.............. 1,297,198 0 0 0 0 0 0 1,297,198
Source: U.S. Department of Commerce, Bureau of the Census. Note: Detail may not add to totals due to rounding. U.S. total includes$20.4 million undistributed monies for all other federal agencies.

FEDERAL EXPENDITURES
The Council of State Governments 293
Table 6.36FEDERAL GOVERNMENT DIRECT PAYMENTS FOR INDIVIDUALS BY PROGRAM,STATE AND TERRITORY: FISCAL YEAR 1996(In thousands of dollars)
Social Security Medicare
SupplementaryRetirement Survivors Disability Hospital medical Payments for
State or other insurance insurance insurance insurance insurance unemploymentjurisdiction Total payments payments payments payments payments Civilian Military compensation
United States......... $749,273,054 $231,262,789 $69,107,641 $44,709,125 $125,011,091 $69,382,227 $40,666,779 $27,922,898 $25,302,217
Alabama ...................... 13,616,219 3,429,919 1,341,781 986,564 2,341,708 1,128,356 964,437 724,278 247,836Alaska .......................... 1,020,822 213,583 75,057 58,168 104,472 48,359 119,160 87,234 135,454Arizona ........................ 12,269,323 4,028,496 988,795 727,480 1,804,510 1,127,836 779,449 777,137 184,391Arkansas ..................... 7,983,806 2,244,254 768,988 668,160 1,249,073 635,285 397,545 350,666 246,151California .................... 80,432,241 22,455,503 6,029,440 4,028,651 13,682,402 8,560,775 3,929,878 3,444,074 3,513,344
Colorado ..................... 8,813,778 2,541,701 761,883 588,838 1,248,298 710,578 732,764 752,741 224,011Connecticut................. 9,692,116 3,672,711 845,892 488,485 1,813,086 990,022 260,176 156,707 478,105Delaware ..................... 2,096,438 703,756 191,926 118,984 318,091 177,077 101,726 94,158 111,229Florida ......................... 53,348,971 17,412,711 4,138,187 2,466,242 9,442,700 6,421,658 2,796,189 2,981,955 841,265Georgia ........................ 17,932,813 4,673,219 1,643,012 1,327,543 2,913,133 1,519,436 1,204,892 1,041,260 346,806
Hawaii ......................... 3,237,545 990,991 204,825 111,242 370,145 241,131 420,703 234,275 215,444Idaho ............................ 2,865,190 948,883 265,972 171,804 360,182 199,578 186,733 139,348 124,759Illinois .......................... 31,743,580 10,593,896 3,216,411 1,744,593 5,684,429 2,887,189 1,113,690 438,859 1,468,146Indiana ........................ 15,096,435 5,487,990 1,676,454 1,011,951 2,550,414 1,291,849 573,448 268,692 263,383Iowa ............................. 7,687,032 3,020,741 906,287 419,091 1,098,772 695,536 330,173 117,943 209,890
Kansas......................... 7,053,652 2,475,047 721,625 365,386 1,096,135 649,980 399,109 277,684 155,886Kentucky ..................... 11,288,865 2,941,856 1,195,244 1,101,669 1,810,348 901,830 518,412 309,485 267,161Louisiana .................... 12,574,578 2,853,735 1,401,785 897,588 2,656,211 1,149,518 419,666 401,425 164,098Maine ........................... 3,653,922 1,158,914 330,913 266,856 521,109 273,213 235,429 155,436 137,837Maryland .................... 14,490,748 3,761,216 1,162,487 596,784 2,262,613 1,310,616 2,399,501 705,903 412,831
Massachusetts............ 18,730,842 5,866,820 1,516,901 1,139,654 4,054,922 1,824,454 810,944 279,525 882,199Michigan ..................... 26,182,785 9,056,296 2,846,489 1,796,258 4,473,872 2,702,209 661,809 294,951 990,331Minnesota ................... 10,694,175 3,952,795 1,122,254 584,652 1,638,833 878,136 425,343 175,394 452,870Mississippi .................. 8,190,714 1,952,279 771,153 706,274 1,382,110 637,539 389,829 329,204 154,284Missouri ...................... 15,667,092 5,080,334 1,567,666 1,040,006 2,730,755 1,439,369 845,758 434,837 330,073
Montana ...................... 2,415,872 769,604 238,088 162,882 315,353 178,729 179,407 98,592 70,799Nebraska ..................... 4,215,908 1,550,080 456,304 212,878 573,413 340,910 218,588 188,010 56,315Nevada ......................... 4,201,360 1,353,325 304,814 255,368 588,752 361,884 289,809 374,329 175,200New Hampshire.......... 2,842,205 1,068,378 252,203 192,657 428,826 214,204 204,198 145,798 38,478New Jersey .................. 23,888,653 8,353,731 2,112,128 1,194,981 4,157,356 2,434,900 974,028 310,679 1,749,039
New Mexico ................ 4,429,045 1,202,374 387,808 283,959 520,259 317,229 411,835 310,569 86,034New York ..................... 54,034,608 17,532,335 4,605,915 3,291,781 9,969,610 5,596,940 1,702,822 395,777 2,265,407North Carolina ........... 19,452,896 6,130,712 1,757,210 1,541,383 2,948,587 1,503,423 934,124 1,024,094 465,102North Dakota .............. 1,656,075 567,586 198,983 79,299 250,822 144,426 97,488 44,682 39,106Ohio ............................. 31,166,179 10,156,285 3,539,951 1,911,098 5,232,964 2,853,538 1,269,624 536,932 842,564
Oklahoma ................... 9,880,433 2,862,293 967,157 564,571 1,672,161 757,258 833,605 462,708 122,420Oregon ......................... 8,798,344 3,139,914 794,626 484,499 1,139,789 692,560 529,430 288,122 460,800Pennsylvania............... 40,972,651 13,502,271 4,102,101 1,855,448 7,834,670 4,135,916 1,863,846 614,645 1,853,780Rhode Island .............. 3,265,834 1,100,353 247,444 189,613 567,625 280,186 170,080 91,572 221,143South Carolina ........... 10,336,292 2,986,914 931,473 840,686 1,441,140 780,064 642,041 755,558 233,131
South Dakota.............. 1,971,008 662,477 212,145 103,103 275,599 153,057 142,912 71,861 16,563Tennessee.................... 15,496,939 4,315,313 1,496,172 1,199,326 2,886,956 1,220,114 761,074 605,614 375,804Texas ............................ 45,722,511 12,168,202 4,515,326 2,341,353 7,865,923 3,817,972 2,473,886 2,618,063 1,145,036Utah ............................. 3,918,917 1,223,276 344,504 200,772 491,831 251,441 586,447 171,978 79,174Vermont ....................... 1,485,432 523,016 146,051 104,914 223,145 107,168 64,342 43,366 57,274
Virginia ....................... 18,561,615 4,746,456 1,508,363 1,071,149 2,298,641 1,291,779 2,426,489 2,217,749 226,368Washington ................. 14,838,432 4,653,233 1,198,874 793,112 1,839,088 1,101,103 1,064,232 1,042,655 1,013,748West Virginia .............. 6,407,476 1,719,788 756,093 566,661 976,137 505,713 237,731 121,214 171,160Wisconsin.................... 12,924,869 5,097,062 1,396,959 782,449 1,916,883 1,084,937 399,905 190,333 510,511Wyoming ..................... 1,194,507 386,636 114,837 71,849 162,727 83,564 87,536 58,978 36,154
Dist. of Columbia ....... 2,596,008 350,752 113,224 74,333 347,431 197,975 886,657 60,087 112,835American Samoa........ 26,346 6,344 6,287 5,266 0 0 45 2,994 0Guam ........................... 177,396 32,789 16,351 5,884 663 347 46,052 25,972 0No. Mariana Islands .. 5,747 604 462 142 0 0 42 1,003 0Puerto Rico ................. 5,626,618 1,546,002 682,418 907,106 464,766 567,130 138,328 71,749 308,671U.S. Virgin Islands ..... 109,079 37,038 11,943 7,680 11,651 6,231 11,408 4,044 11,817
U.S. undistributed...... 290,117 0 0 0 0 0 2,005 0 0
Federal retirement& disability payments
See footnotes at end of table.
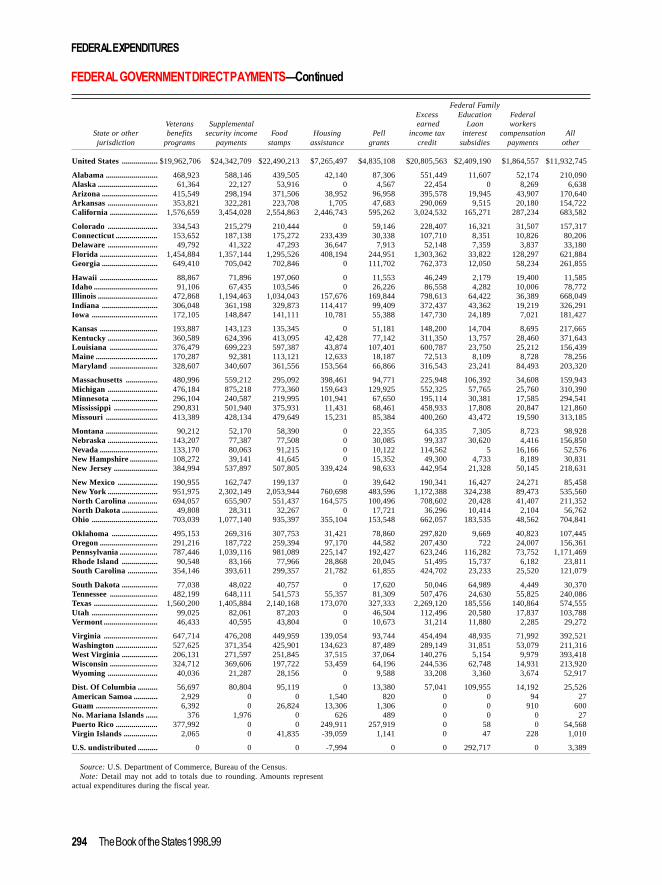
FEDERAL EXPENDITURES
294 The Book of the States 1998-99
FEDERAL GOVERNMENT DIRECT PAYMENTS�Continued
Federal FamilyExcess Education Federal
Veterans Supplemental earned Laon workersState or other benefits security income Food Housing Pell income tax interest compensation Alljurisdiction programs payments stamps assistance grants credit subsidies payments other
United States..................$19,962,706 $24,342,709 $22,490,213 $7,265,497 $4,835,108 $20,805,563 $2,409,190 $1,864,557 $11,932,745
Alabama .......................... 468,923 588,146 439,505 42,140 87,306 551,449 11,607 52,174 210,090Alaska .............................. 61,364 22,127 53,916 0 4,567 22,454 0 8,269 6,638Arizona ............................ 415,549 298,194 371,506 38,952 96,958 395,578 19,945 43,907 170,640Arkansas ......................... 353,821 322,281 223,708 1,705 47,683 290,069 9,515 20,180 154,722California ........................ 1,576,659 3,454,028 2,554,863 2,446,743 595,262 3,024,532 165,271 287,234 683,582
Colorado ......................... 334,543 215,279 210,444 0 59,146 228,407 16,321 31,507 157,317Connecticut ..................... 153,652 187,138 175,272 233,439 30,338 107,710 8,351 10,826 80,206Delaware ......................... 49,792 41,322 47,293 36,647 7,913 52,148 7,359 3,837 33,180Florida ............................. 1,454,884 1,357,144 1,295,526 408,194 244,951 1,303,362 33,822 128,297 621,884Georgia ............................ 649,410 705,042 702,846 0 111,702 762,373 12,050 58,234 261,855
Hawaii ............................. 88,867 71,896 197,060 0 11,553 46,249 2,179 19,400 11,585Idaho ................................ 91,106 67,435 103,546 0 26,226 86,558 4,282 10,006 78,772Illinois .............................. 472,868 1,194,463 1,034,043 157,676 169,844 798,613 64,422 36,389 668,049Indiana ............................ 306,048 361,198 329,873 114,417 99,409 372,437 43,362 19,219 326,291Iowa ................................. 172,105 148,847 141,111 10,781 55,388 147,730 24,189 7,021 181,427
Kansas............................. 193,887 143,123 135,345 0 51,181 148,200 14,704 8,695 217,665Kentucky ......................... 360,589 624,396 413,095 42,428 77,142 311,350 13,757 28,460 371,643Louisiana ........................ 376,479 699,223 597,387 43,874 107,401 600,787 23,750 25,212 156,439Maine ............................... 170,287 92,381 113,121 12,633 18,187 72,513 8,109 8,728 78,256Maryland ........................ 328,607 340,607 361,556 153,564 66,866 316,543 23,241 84,493 203,320
Massachusetts................ 480,996 559,212 295,092 398,461 94,771 225,948 106,392 34,608 159,943Michigan ......................... 476,184 875,218 773,360 159,643 129,925 552,325 57,765 25,760 310,390Minnesota ....................... 296,104 240,587 219,995 101,941 67,650 195,114 30,381 17,585 294,541Mississippi ...................... 290,831 501,940 375,931 11,431 68,461 458,933 17,808 20,847 121,860Missouri .......................... 413,389 428,134 479,649 15,231 85,384 400,260 43,472 19,590 313,185
Montana .......................... 90,212 52,170 58,390 0 22,355 64,335 7,305 8,723 98,928Nebraska......................... 143,207 77,387 77,508 0 30,085 99,337 30,620 4,416 156,850Nevada ............................. 133,170 80,063 91,215 0 10,122 114,562 5 16,166 52,576New Hampshire.............. 108,272 39,141 41,645 0 15,352 49,300 4,733 8,189 30,831New Jersey ...................... 384,994 537,897 507,805 339,424 98,633 442,954 21,328 50,145 218,631
New Mexico .................... 190,955 162,747 199,137 0 39,642 190,341 16,427 24,271 85,458New York ......................... 951,975 2,302,149 2,053,944 760,698 483,596 1,172,388 324,238 89,473 535,560North Carolina ............... 694,057 655,907 551,437 164,575 100,496 708,602 20,428 41,407 211,352North Dakota .................. 49,808 28,311 32,267 0 17,721 36,296 10,414 2,104 56,762Ohio ................................. 703,039 1,077,140 935,397 355,104 153,548 662,057 183,535 48,562 704,841
Oklahoma ....................... 495,153 269,316 307,753 31,421 78,860 297,820 9,669 40,823 107,445Oregon ............................. 291,216 187,722 259,394 97,170 44,582 207,430 722 24,007 156,361Pennsylvania................... 787,446 1,039,116 981,089 225,147 192,427 623,246 116,282 73,752 1,171,469Rhode Island .................. 90,548 83,166 77,966 28,868 20,045 51,495 15,737 6,182 23,811South Carolina ............... 354,146 393,611 299,357 21,782 61,855 424,702 23,233 25,520 121,079
South Dakota.................. 77,038 48,022 40,757 0 17,620 50,046 64,989 4,449 30,370Tennessee........................ 482,199 648,111 541,573 55,357 81,309 507,476 24,630 55,825 240,086Texas ................................1,560,200 1,405,884 2,140,168 173,070 327,333 2,269,120 185,556 140,864 574,555Utah ................................. 99,025 82,061 87,203 0 46,504 112,496 20,580 17,837 103,788Vermont ........................... 46,433 40,595 43,804 0 10,673 31,214 11,880 2,285 29,272
Virginia ........................... 647,714 476,208 449,959 139,054 93,744 454,494 48,935 71,992 392,521Washington ..................... 527,625 371,354 425,901 134,623 87,489 289,149 31,851 53,079 211,316West Virginia .................. 206,131 271,597 251,845 37,515 37,064 140,276 5,154 9,979 393,418Wisconsin........................ 324,712 369,606 197,722 53,459 64,196 244,536 62,748 14,931 213,920Wyoming ......................... 40,036 21,287 28,156 0 9,588 33,208 3,360 3,674 52,917
Dist. Of Columbia .......... 56,697 80,804 95,119 0 13,380 57,041 109,955 14,192 25,526American Samoa............ 2,929 0 0 1,540 820 0 0 94 27Guam ............................... 6,392 0 26,824 13,306 1,306 0 0 910 600No. Mariana Islands...... 376 1,976 0 626 489 0 0 0 27Puerto Rico ..................... 377,992 0 0 249,911 257,919 0 58 0 54,568Virgin Islands ................. 2,065 0 41,835 -39,059 1,141 0 47 228 1,010
U.S. undistributed.......... 0 0 0 -7,994 0 0 292,717 0 3,389
Source: U.S. Department of Commerce, Bureau of the Census.Note: Detail may not add to totals due to rounding. Amounts represent
actual expenditures during the fiscal year.

FEDERAL EXPENDITURES
The Council of State Governments 295
Table 6.37FEDERAL GOVERNMENT PROCUREMENT CONTRACTS�VALUE OF AWARDS,BY STATE AND TERRITORY: FISCAL YEAR 1995(In thousands of dollars)
State or other Department Postal All otherjurisdiction Total of Defense service federal agencies
United States..................... $202,209,187 $126,003,863 $8,798,898 $67,406,426
Alabama .................................. 3,059,430 1,881,624 106,990 1,070,816Alaska ...................................... 708,461 553,998 24,065 130,398Arizona .................................... 3,097,967 2,433,313 117,549 547,105Arkansas ................................. 420,563 222,881 72,337 125,345California ................................ 26,537,278 18,399,047 981,138 7,157,093
Colorado ................................. 4,160,224 2,103,499 148,480 1,908,245Connecticut............................. 3,158,931 2,815,674 129,615 213,642Delaware ................................. 189,849 120,637 42,173 27,039Florida ..................................... 8,697,586 6,230,833 453,529 2,013,224Georgia .................................... 4,314,721 3,513,236 215,883 585,602
Hawaii ..................................... 777,265 653,393 30,637 93,235Idaho ........................................ 975,795 97,880 27,380 850,535Illinois ...................................... 3,255,409 1,129,884 485,502 1,640,023Indiana .................................... 1,678,352 1,223,331 174,335 280,686Iowa ......................................... 809,237 439,302 108,533 261,402
Kansas..................................... 1,204,032 881,567 92,102 230,363Kentucky ................................. 2,768,726 538,936 94,659 2,135,131Louisiana ................................ 2,098,108 1,046,728 108,798 942,582Maine ....................................... 807,509 713,301 44,521 49,687Maryland ................................ 9,108,881 4,461,760 186,609 4,460,512
Massachusetts........................ 6,193,046 4,942,367 260,622 990,057Michigan ................................. 2,014,285 1,249,569 321,584 443,132Minnesota ............................... 1,594,573 1,109,220 175,907 309,446Mississippi .............................. 1,935,998 1,582,335 57,354 296,309Missouri .................................. 7,239,749 5,854,274 210,485 1,174,990
Montana .................................. 335,560 133,725 26,934 174,901Nebraska................................. 517,300 282,481 59,059 175,760Nevada..................................... 917,315 218,890 41,282 657,143New Hampshire...................... 667,530 579,604 48,139 39,787New Jersey .............................. 4,263,074 2,970,923 337,448 954,703
New Mexico ............................ 3,689,872 653,835 44,607 2,991,430New York ................................. 6,083,109 3,531,924 712,162 1,839,023North Carolina ....................... 2,009,164 1,352,804 210,011 446,349North Dakota .......................... 231,318 127,579 22,701 81,038Ohio ......................................... 4,475,318 2,630,805 359,988 1,484,525
Oklahoma ............................... 1,151,774 730,888 95,303 325,583Oregon ..................................... 629,542 133,878 90,520 405,144Pennsylvania........................... 5,360,408 2,986,169 455,925 1,918,314Rhode Island .......................... 464,034 377,699 42,589 43,746South Carolina ....................... 2,779,417 998,486 81,864 1,699,067
South Dakota.......................... 261,835 129,090 24,103 108,642Tennessee................................ 4,032,481 1,071,392 158,349 2,802,740Texas ........................................ 13,769,174 9,296,614 537,174 3,935,386Utah ......................................... 1,625,394 495,771 53,632 1,075,991Vermont ................................... 259,499 207,402 23,269 28,828
Virginia ................................... 16,598,065 12,119,771 228,365 4,249,929Washington ............................. 4,760,423 2,297,754 157,354 2,305,315West Virginia .......................... 707,507 203,305 54,655 449,547Wisconsin................................ 1,109,696 506,628 148,499 454,569Wyoming ................................. 164,348 91,854 14,130 58,364
Dist. of Columbia ................... 4,092,937 897,129 59,371 3,136,437American Samoa.................... 17,626 4,129 123 13,374Guam. ...................................... 124,753 120,872 1,477 2,404No. Marianas Islands............ 1,567 698 123 746Puerto Rico ............................. 365,553 252,316 35,846 77,391U.S. Virgin Islands................. 33,616 27,119 3,106 3,391
Undistributed (a) ................... 23,904,000 16,373,740 - 7,530,260
Source: U.S. Department of Commerce, Bureau of the Census.Note: Amounts shown for U.S. Postal Service represent actual outlays for
contractual commitments, while all other amounts shown represent the valueof contract actions, and do not reflect Federal Government expenditures.Nonpostal data generally involve only current year contract actions; however,multiple-year obligations may be reflected for contract actions of less than 3
years duration. Foreign procurement contract awards are excluded from UnitedStates totals.
Foreign award total equals $7,523,052,000, including $6,081,301,000 forthe Department of Defenseand $1,441,751,000 for all other Federal agencies.
(a) Includes awards under $25,000 and classified location awards (Depart-ment of Defense).

FEDERAL PROCUREMENT
296 The Book of the States 1998-99
Table 6.38FEDERAL GOVERNMENT PROCUREMENT CONTRACTS�VALUE OF AWARDS, BY STATE AND TERRITORY: FISCAL YEAR 1996(In thousands of dollars)
State or other jurisdiction Total Department of Defense Postal Service All other
United States.................................... $200,543,115 $128,628,822 $10,436,999 $61,477,294
Alabama ............................................... 2,936,599 1,838,999 129,647 967,953Alaska ................................................... 803,901 565,149 28,632 210,120Arizona ................................................. 3,485,395 2,921,102 144,453 419,840Arkansas .............................................. 453,019 249,336 85,073 118,610California ............................................. 27,723,583 19,971,914 1,141,751 6,609,918
Colorado .............................................. 4,656,320 3,010,286 175,269 1,470,765Connecticut.......................................... 3,122,527 2,684,617 152,345 285,565Delaware .............................................. 153,775 101,565 27,956 24,254Florida .................................................. 8,125,596 5,880,491 538,551 1,706,554Georgia ................................................. 4,741,012 3,981,794 254,093 505,125
Hawaii .................................................. 1,027,398 907,306 35,713 84,379Idaho ..................................................... 945,045 131,993 35,060 777,992Illinois ................................................... 3,165,199 1,184,500 550,621 1,430,078Indiana ................................................. 2,090,255 1,574,180 206,884 309,191Iowa ...................................................... 777,558 371,832 134,590 271,136
Kansas.................................................. 1,109,643 779,583 114,391 215,669Kentucky .............................................. 2,004,606 858,782 125,538 1,020,286Louisiana ............................................. 2,086,487 1,076,852 135,817 873,818Maine .................................................... 907,359 791,913 54,009 61,437Maryland ............................................. 8,521,750 4,090,160 223,491 4,208,099
Massachusetts..................................... 6,080,621 4,696,131 306,627 1,077,863Michigan .............................................. 2,188,854 1,249,599 372,470 566,785Minnesota ............................................ 1,534,730 963,700 215,677 355,353Mississippi ........................................... 2,326,200 1,962,533 68,680 294,987Missouri ............................................... 10,593,615 9,218,323 249,139 1,126,153
Montana ............................................... 262,931 89,622 32,032 141,277Nebraska.............................................. 584,873 366,759 71,607 146,507Nevada .................................................. 1,406,672 290,489 49,686 1,066,497New Hampshire................................... 671,585 566,876 55,045 49,664New Jersey ........................................... 3,750,337 2,577,472 398,242 774,623
New Mexico ......................................... 3,676,231 679,539 52,343 2,944,349New York .............................................. 6,319,855 3,558,545 834,111 1,927,199North Carolina .................................... 2,293,304 1,655,034 244,770 393,500North Dakota ....................................... 209,820 106,140 26,706 76,974Ohio ...................................................... 4,583,274 2,735,950 435,509 1,411,815
Oklahoma ............................................ 1,205,250 776,660 112,747 315,843Oregon .................................................. 610,417 201,403 113,682 295,332Pennsylvania........................................ 5,530,752 3,772,681 539,992 1,218,079Rhode Island ....................................... 422,850 328,714 48,031 46,105South Carolina .................................... 2,504,519 1,016,216 97,998 1,390,305
South Dakota....................................... 248,588 109,537 28,778 110,273Tennessee............................................. 4,317,302 1,131,991 198,361 2,986,950Texas ..................................................... 13,840,351 9,073,887 639,645 4,126,819Utah ...................................................... 1,072,486 393,157 62,870 616,459Vermont ................................................ 295,096 225,427 28,159 41,510
Virginia ................................................ 14,528,576 10,345,629 271,949 3,910,998Washington .......................................... 4,603,131 2,380,798 185,593 2,036,740West Virginia ....................................... 513,725 203,059 67,779 242,887Wisconsin............................................. 1,161,640 555,972 182,215 423,453Wyoming .............................................. 153,196 91,558 16,539 45,099
District of Columbia ........................... 4,579,905 1,197,256 90,714 3,291,935American Samoa................................. 4,161 3,014 0 1,147Guam .................................................... 112,399 109,817 0 2,582No. Marianas Islands......................... 1,471 579 146 746Puerto Rico .......................................... 404,700 267,117 41,771 95,812U.S. Virgin Islands .............................. 22,287 13,658 3,502 5,127
Undistributed (a) ................................ 19,090,384 12,741,626 0 6,348,758
Source: U.S. Department of Commerce, Bureau of the Census.Note: Amounts shown for U.S. Postal Service represent actual outlays for
contractual commitments, while all other amounts shown represent the valueof contract actions, and do not reflect Federal Government expenditures.Nonpostal data generally involve only current year contract actions; however,multiple-year obligations may be reflected for contract actions of less than 3
years duration. Foreign procurement contract awards are excluded from UnitedStates totals.
Foreign award total equals $7,499,710,000, including $6,367,932,000 forthe Department of Defenseand $1,131,778,000 for all other Federal agencies.
(a) Includes awards under $25,000 and classified location awards (Depart-ment of Defense).

FEDERAL EXPENDITURES
The Council of State Governments 297
Table 6.39FEDERAL GOVERNMENT EXPENDITURES FOR OTHER PROGRAMS,BY STATE AND TERRITORY: FISCAL YEAR 1995(In thousands of dollars)
Grants
Department NASA-space Corporationof Health & National program for National
State or other Human Service Science research and Community All otherjurisdiction Total Total research grants Foundation grants Arts Humanities Service (a) programs
National Endowmentfor the Arts
United States............. $47,058,020 $21,220,340 $9,344,302 $1,416,211 $797,618 $160,051 $147,816 $423,792 $8,930,550
Alabama .......................... 621,836 353,391 144,939 8,299 36,095 1,286 845 5,164 156,763Alaska .............................. 87,187 72,305 6,674 7,634 2,676 978 700 1,849 51,794Arizona ............................ 476,393 321,987 78,263 114,785 14,029 2,412 1,782 7,143 103,573Arkansas ......................... 593,386 109,234 22,857 3,261 1,581 807 846 7,021 72,861California ........................ 4,867,984 2,948,099 1,342,502 208,863 202,572 16,725 8,069 30,206 1,139,162
Colorado ......................... 823,289 379,389 159,771 22,061 21,258 1,340 1,291 6,137 167,531Connecticut ..................... 542,071 361,287 202,204 22,649 3,849 2,200 5,495 5,221 119,669Delaware ......................... 114,212 83,945 5,389 10,689 1,568 1,465 1,058 1,546 62,230Florida ............................. 1,195,434 493,665 143,082 51,022 22,097 2,430 2,540 15,339 257,155Georgia ............................ 775,141 364,433 139,607 34,040 20,313 3,251 4,053 8,394 154,775
Hawaii ............................. 169,492 112,135 32,884 160 4,583 1,046 1,440 1,560 70,462Idaho ................................ 214,552 64,112 3,249 4,036 536 748 706 1,557 53,280Illinois .............................. 1,607,389 692,233 303,698 73,851 13,843 5,055 8,285 11,899 275,602Indiana. ........................... 1,228,198 249,306 89,850 30,036 7,125 1,035 2,208 4,971 114,081Iowa ................................. 1,432,381 181,754 80,750 17,661 4,561 1,064 927 4,893 71,898
Kansas............................. 769,286 127,683 44,535 4,583 2,493 878 1,193 6,794 67,207Kentucky ......................... 542,929 169,896 39,742 11,195 1,468 2,052 883 5,207 109,349Louisiana ........................ 1,154,274 214,965 64,595 8,656 5,700 1,027 1,115 5,448 128,424Maine ............................... 151,142 86,171 30,264 2,682 1,641 993 1,347 3,994 45,250Maryland ........................ 3,163,592 917,836 597,815 42,614 41,501 3,280 3,821 14,959 213,846
Massachusetts................ 1,858,293 1,476,851 936,404 52,643 45,460 6,730 12,934 17,166 405,514Michigan ......................... 1,069,098 659,662 265,638 81,516 19,087 1,605 4,219 7,411 280,186Minnesota ....................... 1,323,788 411,980 198,319 2,985 3,476 7,252 2,720 5,932 191,296Mississippi ...................... 346,691 120,892 13,696 8,577 3,195 932 959 3,314 90,219Missouri .......................... 1,579,584 348,315 219,680 17,886 5,767 2,802 2,061 7,997 92,122
Montana .......................... 575,139 79,346 9,642 10,002 1,532 988 780 5,423 50,979Nebraska......................... 658,573 86,653 29,079 12,118 1,852 958 858 2,071 39,717Nevada ............................. 187,896 142,263 9,067 2,962 1,082 897 789 1,715 125,751New Hampshire.............. 157,314 100,902 38,670 10,395 8,279 963 1,706 2,924 37,965New Jersey ...................... 689,579 428,320 120,017 52,740 8,552 3,071 3,347 11,090 229,503
New Mexico .................... 37,929 185,960 42,238 13,128 8,893 2,447 1,733 4,615 112,906New York ......................... 2,486,079 1,575,368 890,102 117,248 25,979 35,209 21,102 33,266 452,462North Carolina ............... 848,002 620,272 369,971 20,047 10,263 2,581 3,885 9,584 203,941North Dakota .................. 530,342 80,151 6,289 1,790 708 580 473 821 69,490Ohio ................................. 1,063,225 558,145 277,114 15,759 37,870 5,009 4,144 9,970 208,279
Oklahoma ....................... 537,150 135,834 33,830 6,427 1,690 1,120 567 3,529 88,671Oregon ............................. 504,821 306,890 105,480 26,729 5,325 2,422 1,564 3,587 161,783Pennsylvania................... 1,911,486 1,117,979 542,937 68,254 16,789 4,700 5,630 16,944 462,725Rhode Island .................. 158,273 104,567 42,532 14,461 3,926 987 1,621 4,055 36,985South Carolina ............... 337,993 191,877 40,246 9,034 2,689 1,149 816 3,268 134,675
South Dakota.................. 311,158 44,128 7,477 2,086 989 737 592 1,287 30,960Tennessee........................ 544,759 306,682 156,001 14,173 8,249 1,930 1,673 6,271 118,385Texas ................................ 2,770,501 1,083,736 476,520 38,098 59,599 5,678 4,875 31,484 467,482Utah ................................. 346,361 173,997 76,536 3,090 8,654 981 918 2,090 81,728Vermont ........................... 79,048 58,740 27,952 506 291 1,238 1,051 2,041 25,661
Virginia ........................... 1,488,725 496,754 167,780 30,243 29,120 1,454 4,660 7,753 255,744Washington ..................... 1,073,969 603,123 324,178 48,593 10,823 3,136 2,152 14,122 200,119West Virginia .................. 195,274 140,795 15,205 35,440 24,026 941 588 2,822 61,773Wisconsin........................ 785,646 342,651 174,810 4,111 11,349 1,558 2,923 4,291 143,609Wyoming ......................... 85,188 36,648 2,855 130 906 1,118 710 1,710 29,219
Dist. of Columbia ........... 1,456,066 761,965 158,143 7,717 17,718 6,869 5,454 40,222 525,842American Samoa............ 3,740 3,692 382 0 0 276 221 136 2,677Guam ............................... 20,408 6,415 819 536 0 211 259 607 3,983No. Marianas Islands.... 3,306 3,278 220 0 0 236 252 60 2,510Puerto Rico ..................... 191,162 111,874 30,292 7,997 3,992 957 728 4,231 63,677U.S. Virgin Islands ......... 1,447 9,958 1,540 8 0 281 283 689 7,157
See footnotes at end of table.

FEDERAL EXPENDITURES
298 The Book of the States 1998-99
FEDERAL GOVERNMENT EXPENDITURES FOR OTHER PROGRAMS�Continued
Direct payments – other than for individuals
Department of Agriculture
Feed grain Crop Wheatproduction Conservation insurance production Other
State or other stabilization Reserve claims & stabilization agricultural All otherjurisdiction Total payments Program payments paymemts programs programs
United States................. $25,837,680 $2,217,369 $1,733,120 $1,436,209 $985,928 $2,071,229 $17,393,825
Alabama .............................. 268,445 2,336 23,550 1,860 2,357 21,682 216,660Alaska .................................. 14,882 103 893 11 0 4,401 9,474Arizona ................................ 154,406 1,586 1 1,041 2,912 3,729 145,137Arkansas. ............................ 484,152 4,172 11,958 12,604 16,108 348,925 90,385California ............................ 1,919,885 8,420 8,597 11,041 17,354 233,606 1,640,867
Colorado ............................. 443,900 32,742 79,021 4,047 38,852 39,765 249,473Connecticut......................... 180,784 489 0 25,309 0 1,362 153,624Delaware ............................. 30,267 1,679 61 215 276 742 27,294Florida ................................. 701,769 1,149 5,354 2,401 339 51,047 641,479Georgia ................................ 410,708 6,022 26,300 16,120 6,479 26,722 329,065
Hawaii ................................. 57,357 0 7 0 0 1,093 56,257Idaho .................................... 150,440 15,392 38,330 2,963 37,815 21,943 33,997Illinois .................................. 915,156 318,331 60,809 16,253 16,316 32,869 470,578Indiana ................................ 978,892 139,506 33,520 6,314 7,809 7,911 783,832Iowa ..................................... 1,250,627 420,400 180,900 525,260 148 15,782 108,137
Kansas................................. 641,603 106,782 151,919 108,197 171,071 22,835 80,799Kentucky ............................. 373,033 23,578 25,790 3,679 4,443 6,345 309,198Louisiana ............................ 939,309 2,746 6,394 5,545 2,897 158,744 762,983Maine ................................... 64,971 512 1,769 1,236 1 12,071 49,382Maryland ............................ 2,245,756 7,107 1,418 1,020 1,301 2,787 2,232,123
Massachusetts.................... 381,442 317 1 396 0 1,555 379,173Michigan ............................. 409,436 61,997 19,604 6,695 9,045 37,275 274,820Minnesota ........................... 911,808 197,078 101,407 274,446 44,815 71,975 222,087Mississippi .......................... 225,799 2,345 34,851 8,505 3,861 89,652 86,585Missouri .............................. 1,231,269 58,507 107,222 9,409 20,605 64,043 971,483
Montana .............................. 495,793 30,680 104,382 224,406 77,545 19,712 39,068Nebraska............................. 571,920 270,866 76,432 5,874 36,809 29,071 152,868Nevada ................................. 45,633 150 113 199 444 4,659 40,068New Hampshire.................. 56,412 179 0 10 0 909 55,314New Jersey. ......................... 261,259 1,591 36 198 229 2,572 256,633
New Mexico ........................ 151,969 5,897 18,240 1,722 5,101 24,660 96,349New York ............................. 910,711 18,456 3,272 2,724 2,158 6,884 877,217North Carolina ................... 227,730 13,001 6,431 7,475 3,682 13,969 183,172North Dakota ...................... 450,191 64,760 111,111 50,142 145,766 50,978 27,434Ohio ..................................... 505,080 86,499 25,770 7,096 14,639 12,213 358,863
Oklahoma ........................... 401,316 6,735 48,985 7,889 90,095 56,290 191,322Oregon ................................. 197,931 3,749 25,549 813 22,073 13,445 132,302Pennsylvania....................... 793,507 11,722 5,933 1,049 683 20,388 753,732Rhode Island ...................... 53,706 3 0 14 0 615 53,074South Carolina ................... 146,116 7,134 11,225 3,453 4,562 9,662 110,080
South Dakota...................... 267,030 78,533 70,189 3,162 43,723 48,923 22,500Tennessee............................ 238,077 8,958 23,341 5,923 4,468 8,859 186,528Texas.................................... 1,686,765 89,101 159,116 18,974 60,903 312,838 1,045,833Utah ..................................... 172,364 2,161 8,992 307 3,021 14,653 143,230Vermont ............................... 20,308 578 12 135 1 2,203 17,379
Virginia ............................... 991,971 6,917 3,898 964 2,225 15,599 962,368Washington ......................... 470,846 14,808 52,270 2,246 58,677 47,791 295,054West Virginia ...................... 54,479 1,036 29 113 49 5,157 48,095Wisconsin............................ 442,995 78,172 47,607 46,230 1,226 15,770 253,990Wyoming ............................. 48,540 2,388 9,663 337 3,046 18,738 14,368
Dist. of Columbia ............... 694,101 0 820 0 0 34,453 658,828American Samoa................ 48 0 0 0 0 20 28Guam. .................................. 13,993 0 0 0 0 17 13,976No. Marianas Islands........ 28 0 0 0 0 0 28Puerto Rico ......................... 79,288 0 29 190 0 1,227 77,842U.S. Virgin Islands ............. 1,489 0 0 0 0 84 1,405
See footnotes at end of table.

FEDERAL EXPENDITURES
The Council of State Governments 299
FEDERAL GOVERNMENT EXPENDITURES FOR OTHER PROGRAMS�Continued
Federal employees National floodState or other life and health Legal service insurancejurisdiction insurance program Postal service corportion grants claims payments Other
United States............... $10,731,577 $2,008,898 $389,920 $1,022,285 $3,241,145
Alabama ............................. 169,884 24,427 7,565 811 13,973Alaska. ................................ 1,655 5,494 1,714 251 360Arizona ............................... 107,994 26,838 9,572 526 207Arkansas ............................ 49,981 16,515 4,626 113 19,150California ........................... 898,764 224,006 45,634 110,092 362,371
Colorado ............................ 160,441 33,900 4,487 169 50,476Connecticut........................ 79,687 29,593 2,775 797 40,772Delaware ............................ 14,606 9,629 761 35 2,263Florida ................................ 430,736 103,546 17,393 28,359 61,445Georgia ............................... 219,547 49,289 9,807 14,978 35,444
Hawaii ................................ 46,522 6,995 1,425 1,007 308Idaho ................................... 19,137 6,251 1,739 13 6,857Illinois. ................................ 197,679 110,846 15,089 4,249 142,715Indiana ............................... 98,504 39,803 6,577 222 638,726Iowa .................................... 44,421 24,779 3,239 104 35,594
Kansas................................ 53,939 21,028 2,840 1,346 1,646Kentucky ............................ 250,120 21,612 6,934 574 29,958Louisiana ........................... 85,696 24,840 9,773 554,705 87,969Maine .................................. 5,692 10,165 1,788 70 11,667Maryland ........................... 2,157,300 42,605 4,322 459 27,437
Massachusetts................... 178,783 59,503 8,513 495 131,879Michigan ............................ 122,958 73,422 12,882 68 65,490Minnesota .......................... 116,143 40,162 5,126 47 60,609Mississippi ......................... 48,889 13,095 7,027 16,117 1,457Missouri ............................. 863,249 48,056 6,759 17,273 36,146
Montana ............................. 17,116 6,149 1,556 7 14,240Nebraska............................ 32,874 13,484 1,869 135 104,506Nevada ................................ 29,151 9,425 1,379 101 12New Hampshire................. 34,073 10,991 948 8 9,294New Jersey ......................... 124,213 77,044 7,446 2,540 45,390
New Mexico ....................... 65,440 10,184 3,517 24 17,184New York ............................ 384,599 162,596 26,611 2,699 300,712North Carolina .................. 107,917 47,948 9,668 8,405 9,234North Dakota ..................... 14,379 5,183 1,157 214 6,501Ohio .................................... 199,461 82,190 13,932 3,259 60,021
Oklahoma .......................... 123,627 21,759 5,582 5,768 34,586Oregon ................................ 86,132 20,667 4,160 48 21,295Pennsylvania...................... 467,728 104,093 13,741 2,190 165,980Rhode Island ..................... 30,880 9,724 1,044 143 11,283South Carolina .................. 72,402 18,691 5,506 6,375 7,106
South Dakota ..................... 7,744 5,503 2,199 120 6,934Tennessee........................... 93,973 36,153 7,993 1,038 47,371Texas ................................... 414,489 122,643 32,359 229,485 246,857Utah .................................... 107,813 12,245 2,076 0 21,096Vermont .............................. 5,114 5,313 811 207 5,934
Virginia .............................. 863,354 52,139 6,765 4,191 35,919Washington ........................ 199,658 35,926 6,204 669 52,597West Virginia ..................... 30,403 12,478 3,549 1,402 263Wisconsin........................... 67,892 33,904 5,366 217 146,611Wyoming ............................ 10,303 3,226 796 17 26
Dist. of Columbia .............. 636,852 13,555 3,806 0 4,615American Samoa............... 28 0 0 0Guam .................................. 13,452 337 187 0 0No. Mariana Islands......... 28 0 0 0Puerto Rico ........................ 48,210 8,184 20,865 144 439U.S. Virgin Islands ............ 709 461 0 235
Source: U.S. Department of Commerce, Bureau of the Census.Note: Because of rounding, detail may not add to totals. Amounts repre-
sent a mix of value of awards and actual expenditures during the fiscal year.Grant amounts are other than those for State and local governments whichare shown in table 2. See text for additional information.
(a) Corporation for National and Community Service grants include thefollowing federal domestic assistance programs; the Foster Grandparent Pro-gram; Retired Senior Volunteer Program; Volunteer Demonstration Program;Literacy Corps (VISTA); Learn and Serve America; Americorps; Planningand Program Development; Training and Technical Assistance; and Points ofLight Foundation.
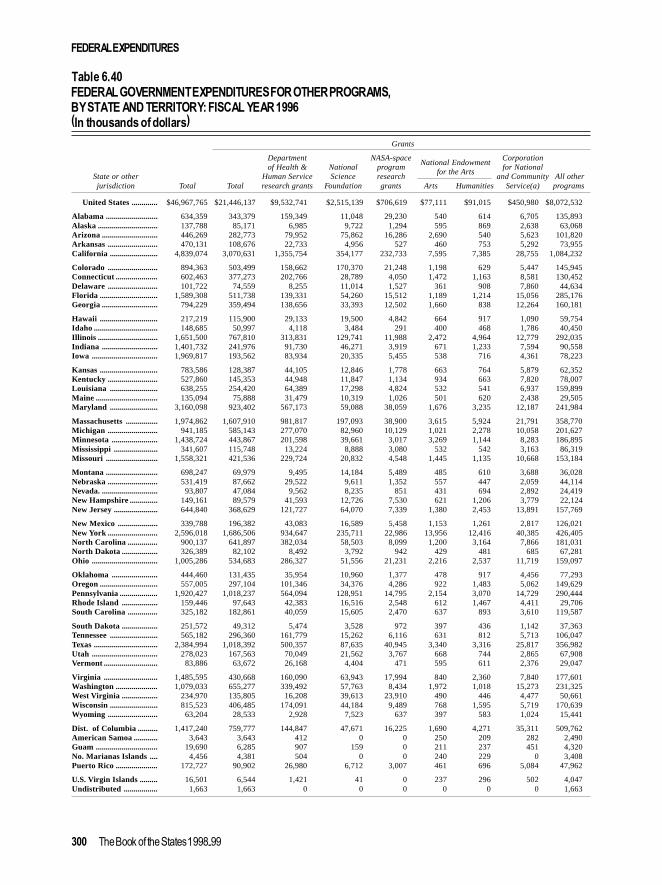
FEDERAL EXPENDITURES
300 The Book of the States 1998-99
United States............. $46,967,765 $21,446,137 $9,532,741 $2,515,139 $706,619 $77,111 $91,015 $450,980 $8,072,532
Alabama .......................... 634,359 343,379 159,349 11,048 29,230 540 614 6,705 135,893Alaska .............................. 137,788 85,171 6,985 9,722 1,294 595 869 2,638 63,068Arizona ............................ 446,269 282,773 79,952 75,862 16,286 2,690 540 5,623 101,820Arkansas ......................... 470,131 108,676 22,733 4,956 527 460 753 5,292 73,955California ........................ 4,839,074 3,070,631 1,355,754 354,177 232,733 7,595 7,385 28,755 1,084,232
Colorado ......................... 894,363 503,499 158,662 170,370 21,248 1,198 629 5,447 145,945Connecticut ..................... 602,463 377,273 202,766 28,789 4,050 1,472 1,163 8,581 130,452Delaware ......................... 101,722 74,559 8,255 11,014 1,527 361 908 7,860 44,634Florida ............................. 1,589,308 511,738 139,331 54,260 15,512 1,189 1,214 15,056 285,176Georgia ............................ 794,229 359,494 138,656 33,393 12,502 1,660 838 12,264 160,181
Hawaii ............................. 217,219 115,900 29,133 19,500 4,842 664 917 1,090 59,754Idaho ................................ 148,685 50,997 4,118 3,484 291 400 468 1,786 40,450Illinois .............................. 1,651,500 767,810 313,831 129,741 11,988 2,472 4,964 12,779 292,035Indiana ............................ 1,401,732 241,976 91,730 46,271 3,919 671 1,233 7,594 90,558Iowa ................................. 1,969,817 193,562 83,934 20,335 5,455 538 716 4,361 78,223
Kansas............................. 783,586 128,387 44,105 12,846 1,778 663 764 5,879 62,352Kentucky ......................... 527,860 145,353 44,948 11,847 1,134 934 663 7,820 78,007Louisiana ........................ 638,255 254,420 64,389 17,298 4,824 532 541 6,937 159,899Maine ............................... 135,094 75,888 31,479 10,319 1,026 501 620 2,438 29,505Maryland ........................ 3,160,098 923,402 567,173 59,088 38,059 1,676 3,235 12,187 241,984
Massachusetts................ 1,974,862 1,607,910 981,817 197,093 38,900 3,615 5,924 21,791 358,770Michigan ......................... 941,185 585,143 277,070 82,960 10,129 1,021 2,278 10,058 201,627Minnesota ....................... 1,438,724 443,867 201,598 39,661 3,017 3,269 1,144 8,283 186,895Mississippi ...................... 341,607 115,748 13,224 8,888 3,080 532 542 3,163 86,319Missouri .......................... 1,558,321 421,536 229,724 20,832 4,548 1,445 1,135 10,668 153,184
Montana .......................... 698,247 69,979 9,495 14,184 5,489 485 610 3,688 36,028Nebraska......................... 531,419 87,662 29,522 9,611 1,352 557 447 2,059 44,114Nevada............................. 93,807 47,084 9,562 8,235 851 431 694 2,892 24,419New Hampshire.............. 149,161 89,579 41,593 12,726 7,530 621 1,206 3,779 22,124New Jersey ...................... 644,840 368,629 121,727 64,070 7,339 1,380 2,453 13,891 157,769
New Mexico .................... 339,788 196,382 43,083 16,589 5,458 1,153 1,261 2,817 126,021New York ......................... 2,596,018 1,686,506 934,647 235,711 22,986 13,956 12,416 40,385 426,405North Carolina ............... 900,137 641,897 382,034 58,503 8,099 1,200 3,164 7,866 181,031North Dakota .................. 326,389 82,102 8,492 3,792 942 429 481 685 67,281Ohio ................................. 1,005,286 534,683 286,327 51,556 21,231 2,216 2,537 11,719 159,097
Oklahoma ....................... 444,460 131,435 35,954 10,960 1,377 478 917 4,456 77,293Oregon ............................. 557,005 297,104 101,346 34,376 4,286 922 1,483 5,062 149,629Pennsylvania................... 1,920,427 1,018,237 564,094 128,951 14,795 2,154 3,070 14,729 290,444Rhode Island .................. 159,446 97,643 42,383 16,516 2,548 612 1,467 4,411 29,706South Carolina ............... 325,182 182,861 40,059 15,605 2,470 637 893 3,610 119,587
South Dakota.................. 251,572 49,312 5,474 3,528 972 397 436 1,142 37,363Tennessee........................ 565,182 296,360 161,779 15,262 6,116 631 812 5,713 106,047Texas ................................ 2,384,994 1,018,392 500,357 87,635 40,945 3,340 3,316 25,817 356,982Utah ................................. 278,023 167,563 70,049 21,562 3,767 668 744 2,865 67,908Vermont ........................... 83,886 63,672 26,168 4,404 471 595 611 2,376 29,047
Virginia ........................... 1,485,595 430,668 160,090 63,943 17,994 840 2,360 7,840 177,601Washington ..................... 1,079,033 655,277 339,492 57,763 8,434 1,972 1,018 15,273 231,325West Virginia .................. 234,970 135,805 16,208 39,613 23,910 490 446 4,477 50,661Wisconsin........................ 815,523 406,485 174,091 44,184 9,489 768 1,595 5,719 170,639Wyoming ......................... 63,204 28,533 2,928 7,523 637 397 583 1,024 15,441
Dist. of Columbia.......... 1,417,240 759,777 144,847 47,671 16,225 1,690 4,271 35,311 509,762American Samoa............ 3,643 3,643 412 0 0 250 209 282 2,490Guam ............................... 19,690 6,285 907 159 0 211 237 451 4,320No. Marianas Islands.... 4,456 4,381 504 0 0 240 229 0 3,408Puerto Rico ..................... 172,727 90,902 26,980 6,712 3,007 461 696 5,084 47,962
U.S. Virgin Islands ......... 16,501 6,544 1,421 41 0 237 296 502 4,047Undistributed ................. 1,663 1,663 0 0 0 0 0 0 1,663
Table 6.40FEDERAL GOVERNMENT EXPENDITURES FOR OTHER PROGRAMS,BY STATE AND TERRITORY: FISCAL YEAR 1996(In thousands of dollars)
Grants
Department NASA-space Corporationof Health & National program for National
State or other Human Service Science research and Community All otherjurisdiction Total Total research grants Foundation grants Arts Humanities Service(a) programs
National Endowmentfor the Arts

FEDERAL EXPENDITURES
The Council of State Governments 301
FEDERAL GOVERNMENT EXPENDITURES FOR OTHER PROGRAMS�Continued
Direct payments – other than for individuals
Department of Agriculture
Feed grain Crop Wheatproduction Conservation insurance production Other
State or other stabilization Reserve claims & stabilization agricultural All otherjurisdiction Total payments Program payments paymemts programs programs
Source: U.S. Department of Commerce, Bureau of the Census(a) Corporation for National and Commnity Service grants include the fol-
lowing federal domestic assistance programs: the Foster Grandparent Pro-gram; Retired Senior Volunteer Program; Volunteers in Service to America;
United States................. $25,521,628 $1,748,043 $1,728,686 $3,001,403 $353,529 $1,315,736 $17,374,231
Alabama .............................. 290,980 2,804 23,485 5,570 2,492 22,288 234,341Alaska .................................. 52,617 16 892 22 0 43,425 8,262Arizona ................................ 163,496 1,228 1 1,726 2,073 16,853 141,615Arkansas ............................. 361,455 5,627 11,966 23,046 7,884 216,234 96,698California ............................ 1,768,443 5,333 8,642 36,336 8,961 146,689 1,562,482
Colorado ............................. 390,864 24,098 78,885 7,629 14,034 20,753 245,465Connecticut......................... 225,190 514 0 86,204 0 856 137,616Delaware ............................. 27,163 1,816 62 587 378 321 23,999Florida ................................. 1,077,570 1,286 5,425 7,882 396 35,139 1,027,442Georgia ................................ 434,735 8,339 26,337 39,234 5,616 27,785 327,424
Hawaii ................................. 101,319 0 7 66 0 558 100,688Idaho .................................... 97,688 3,411 38,489 4,736 13,724 4,803 32,525Illinois .................................. 883,690 253,750 60,354 50,811 9,745 35,535 473,495Indiana ................................ 1,159,756 119,062 33,299 9,445 5,215 4,541 988,194Iowa ..................................... 1,776,255 326,135 179,027 1,151,295 634 5,783 113,381
Kansas................................. 655,199 93,321 151,777 272,837 46,706 10,810 79,748Kentucky ............................. 382,507 21,947 25,324 12,936 2,358 4,908 315,034Louisiana ............................ 383,835 4,201 6,362 8,804 2,731 118,420 243,317Maine ................................... 59,206 397 1,734 981 2 1,686 54,406Maryland ............................ 2,236,696 6,586 1,379 1,446 882 1,392 2,225,011
Massachusetts.................... 366,952 311 1 678 1 1,288 364,673Michigan ............................. 356,042 47,703 19,553 9,011 4,027 6,079 269,669Minnesota ........................... 994,857 150,593 100,710 472,201 11,268 12,287 247,798Mississippi .......................... 225,859 3,212 34,945 15,454 4,049 92,006 76,193Missouri .............................. 1,136,785 53,078 107,061 21,526 12,836 48,720 893,564
Montana .............................. 628,268 7,778 103,493 449,750 19,353 7,145 40,749Nebraska............................. 443,757 212,574 76,384 10,041 7,813 10,128 126,817Nevada ................................. 46,723 127 113 315 236 989 44,943New Hampshire.................. 59,582 210 0 128 0 443 58,801New Jersey .......................... 276,211 1,327 37 1,412 149 1,035 272,251
New Mexico ........................ 143,406 5,224 18,060 4,613 3,326 16,293 95,890New York ............................. 909,512 15,639 3,168 4,168 1,167 8,158 877,212North Carolina ................... 258,240 15,477 6,481 14,332 3,751 18,116 200,083North Dakota ...................... 244,287 20,980 110,011 50,742 22,250 6,245 34,059Ohio ..................................... 470,603 71,129 25,640 11,282 7,769 3,355 351,428
Oklahoma ........................... 313,025 6,459 48,992 22,596 39,216 10,885 184,877Oregon ................................. 259,901 1,650 25,526 1,622 7,922 10,612 212,569Pennsylvania....................... 902,190 11,062 5,905 2,963 628 11,620 870,012Rhode Island ...................... 61,803 5 0 18 0 631 61,149South Carolina ................... 142,321 6,521 11,267 5,646 2,689 8,594 107,604
South Dakota...................... 202,260 63,453 71,949 11,580 21,349 8,496 25,433Tennessee............................ 268,822 9,077 23,191 12,335 2,815 25,499 195,905Texas .................................... 1,366,602 80,944 158,691 59,884 38,253 208,231 820,599Utah ..................................... 110,460 1,076 9,009 1,062 1,562 4,030 93,721Vermont ............................... 20,214 595 12 215 2 1,607 17,783
Virginia ............................... 1,054,927 6,891 3,887 2,889 1,598 11,900 1,027,762Washington ......................... 423,756 5,363 52,186 4,604 13,671 15,948 331,984West Virginia ...................... 99,165 972 29 429 68 1,675 95,992Wisconsin............................ 409,038 67,163 47,373 81,158 1,084 4,010 208,250Wyoming ............................. 34,671 1,579 9,769 526 846 6,609 15,342
Dist. of Columbia ............... 657,463 0 1,767 0 0 32,444 623,252American Samoa................ 0 0 0 0 0 0 0Guam ................................... 13,405 0 0 0 0 2 13,403No. Marianas Islands........ 75 0 0 0 0 49 26Puerto Rico ......................... 81,825 0 29 6,630 0 1,661 73,505
U.S. Virgin Islands ............. 9,957 0 0 0 0 167 9,790Undistributed ..................... 0 0 0 0 0 0 0
Senior Companion Program; Volunteer Demonstration Program; LiteracyCorps (VISTA); Learn and Serve America; Americorps; Planning and Pro-gram Development; Training and Technical Assistance: and Points of LightFoundation.

FEDERAL EXPENDITURES
302 The Book of the States 1998-99
Table 6.41FEDERAL GOVERNMENT LOAN AND INSURANCE PROGRAMS�VOLUME OFASSISTANCE PROVIDED, BY STATE AND TERRITORY: FISCAL YEAR 1995(In thousands of dollars)
Direct loans
Farmers HomeAdministration Federal Housing for the
State or other Commodity loans- rural housing Direct student elderly or Otherjurisdiction Total price supports loans loans handicapped direct loans
United States................. $ 25,923,086 $ 9,432,577 $ 3,506,983 $ 5,160,728 $ 534,435 $ 7,288,363
Alabama .............................. 303,586 22,258 71,276 143,164 7,184 59,704Alaska .................................. 18,898 30 15,389 0 833 2,646Arizona ................................ 102,382 2,450 53,856 13,315 2,945 29,816Arkansas ............................. 759,706 526,893 79,834 115,296 4,088 33,595California ............................ 6,272,223 576,292 203,730 385,913 72,285 5,034,003
Colorado ............................. 320,084 53,730 37,702 201,345 1,475 25,832Connecticut......................... 51,322 223 15,073 16,504 9,177 10,345Delaware ............................. 23,201 1,912 9,296 9,354 244 2,395Florida ................................. 550,815 146,787 121,516 168,221 34,999 79,292Georgia ................................ 732,883 118,814 128,191 173,805 13,341 298,732
Hawaii ................................. 48,367 0 35,016 84 8,012 5,255Idaho. ................................... 166,944 28,924 48,169 79,358 781 9,712Illinois .................................. 1,247,473 782,046 87,586 253,249 20,002 104,590Indiana ................................ 664,168 383,693 99,073 132,742 6,411 42,249Iowa ..................................... 1,767,262 1,410,984 90,371 204,016 7,541 54,350
Kansas................................. 215,386 128,644 50,140 17,709 1,002 17,891Kentucky ............................. 353,840 151,016 71,063 83,344 3,164 45,253Louisiana ............................ 452,750 189,713 81,472 21,711 19,826 140,028Maine ................................... 97,944 66 58,389 7,351 0 32,138Maryland ............................ 164,370 15,118 45,676 75,412 13,223 14,941
Massachusetts.................... 328,769 140 43,831 221,900 26,264 36,634Michigan ............................. 720,928 132,657 126,141 406,026 19,528 36,576Minnesota ........................... 1,428,411 1,143,180 134,841 85,647 9,029 55,714Mississippi .......................... 675,823 547,040 74,640 6,303 277 47,563Missouri .............................. 517,764 180,158 87,962 143,858 12,390 93,396
Montana .............................. 128,412 68,449 25,375 25,231 0 9,357Nebraska............................. 730,688 657,816 52,340 5,883 32 14,617Nevada ................................. 36,943 11 14,411 11,510 0 11,011New Hampshire.................. 36,300 0 23,923 1,458 2,227 8,692New Jersey .......................... 246,371 4,146 23,891 188,472 10,104 19,758
New Mexico ........................ 74,621 4,034 28,425 38,452 374 3,336New York ............................. 588,299 35,974 84,620 346,811 77,177 43,717North Carolina ................... 446,034 144,739 138,370 88,510 7,614 66,801North Dakota ...................... 318,600 257,208 38,877 3,438 0 19,077Ohio ..................................... 696,153 211,143 102,159 293,495 44,924 44,432
Oklahoma ........................... 167,322 13,600 63,455 48,070 4,512 37,685Oregon ................................. 242,732 7,057 49,545 119,715 6,672 59,743Pennsylvania....................... 283,705 19,058 137,664 45,952 24,898 56,133Rhode Island ...................... 73,262 0 7,365 58,567 5,966 1,364South Carolina ................... 158,247 12,264 55,185 49,602 2,696 38,500
South Dakota...................... 356,021 289,041 42,883 703 700 22,694Tennessee............................ 348,377 131,840 111,646 51,702 9,080 44,109Texas .................................... 1,030,549 501,858 217,425 65,015 8,829 237,422Utah ..................................... 318,206 293,614 17,645 280 1,274 5,393Vermont ............................... 53,529 109 17,661 23,676 0 12,083
Virginia ............................... 469,875 50,296 76,018 277,084 8,347 58,130Washington ......................... 275,751 31,129 58,003 139,719 6,125 40,775West Virginia ...................... 166,017 1,131 38,510 101,066 2,207 23,103Wisconsin............................ 350,874 153,293 84,335 83,031 2,170 28,045Wyoming ............................. 26,059 2,003 19,434 262 0 4,360
Dist. of Columbia ............... 99,571 0 0 66,044 11,475 22,052American Samoa................ 49 0 0 0 0 49Guam ................................... 5,536 0 3,702 3 0 1,831No. Marianas Islands........ 3,283 0 254 0 0 3,029Puerto Rico ......................... 197,003 0 97,035 61,174 3,012 35,782U.S. Virgin Islands ............. 9,414 0 6,593 174 0 2,647

FEDERAL EXPENDITURES
The Council of State Governments 303
FEDERAL GOVERNMENT LOAN AND INSURANCE PROGRAMS � Continued
Guaranteed loans
Veteranshousing
Mortgage Guaranteed guaranteed Mortgage Farmers Home Small OtherState or other insurance student & insured insurance Administration business guaranteed Totaljurisdiction Total for homes loans loans (a) condominiums programs loans loans insurance
Source: U.S. Department of Commerce, Bureau of the Census.Note: Detail may not add to totals due to rounding. Amounts represent
dollar volume of direct loans made and loans guaranteed, or the face value ofinsurance coverage provided during the fiscal year.
(a) Represents only the federal government’s contingent liability which isthe lesser of $36,000 or 40 percent of the loan (minimum $22,500). Amountshown does not represent the full value of closed loans, as shown in the fed-eral budget.
United States............. $101,694,615 $41,816,652 $20,558,468 $8,384,304 $3,267,915 $3,234,008 $10,446,052 $13,987,216 $359,558,418
Alabama .......................... 1,033,550 444,492 52,251 125,804 8,181 30,272 164,239 208,311 2,560,529Alaska .............................. 479,695 256,611 0 87,791 13,555 6,092 70,273 45,373 194,388Arizona ............................ 1,831,512 1,171,324 0 222,297 36,910 5,896 155,043 240,042 2,205,601Arkansas ......................... 878,205 368,799 120,264 67,638 2,376 80,160 103,908 135,060 881,569California ........................ 12,943,948 6,778,521 1,170,294 865,323 689,637 81,173 1,676,196 1,682,804 29,393,531
Colorado ......................... 2,772,984 1,260,425 262,795 287,220 176,759 67,162 294,188 424,435 1,700,360Connecticut ..................... 1,125,160 486,848 177,627 53,369 75,188 17,123 169,124 145,881 2,969,244Delaware ......................... 234,501 138,684 22,116 34,203 544 4,994 27,308 6,652 1,400,633Florida ............................. 4,520,974 2,471,755 500,185 585,986 162,460 30,768 375,813 394,007 148,169,231Georgia ............................ 2,798,051 1,284,435 253,319 372,097 44,136 104,739 369,728 369,597 5,719,821
Hawaii ............................. 254,829 52,592 0 22,386 118,747 18,510 21,645 20,949 4,543,360Idaho ................................ 542,886 265,923 0 58,933 3,145 56,004 99,926 58,955 455,456Illinois .............................. 3,895,860 1,932,402 575,336 187,853 266,085 119,701 347,007 467,476 5,039,948Indiana ............................ 6,714,712 856,986 5,270,473 141,994 12,945 70,368 107,775 254,171 2,017,281Iowa ................................. 878,432 110,100 214,155 27,198 3,614 207,201 163,060 153,104 2,612,882
Kansas............................. 731,900 279,222 0 67,628 3,359 101,350 166,275 114,066 1,343,693Kentucky ......................... 905,177 334,661 230,836 86,907 10,207 45,187 73,332 124,047 1,113,782Louisiana ........................ 1,215,136 412,554 185,783 100,099 4,662 211,453 167,500 133,085 25,460,384Maine ............................... 366,704 84,450 119,921 32,671 1,616 16,539 69,986 41,521 561,047Maryland ........................ 3,187,892 1,844,953 86,338 370,573 307,099 7,911 120,759 450,259 3,758,159
Massachusetts................ 2,272,507 388,415 906,472 92,906 31,799 12,997 192,573 647,345 4,079,797Michigan ......................... 2,103,301 947,821 334,617 152,471 32,664 90,159 212,212 333,357 1,832,883Minnesota ....................... 2,981,565 1,200,700 707,886 140,734 110,526 166,462 218,845 436,412 2,015,958Mississippi ...................... 735,318 319,352 0 59,167 352 104,271 149,922 102,254 2,933,937Missouri .......................... 1,713,029 653,670 239,455 123,381 14,916 95,262 260,793 325,552 1,767,346
Montana .......................... 590,818 169,572 89,420 24,819 3,692 32,398 146,181 124,736 460,468Nebraska......................... 1,073,409 238,204 351,092 59,569 812 141,684 64,434 217,614 1,909,375Nevada ............................. 1,140,334 699,311 0 155,910 64,763 9,673 60,437 150,240 969,424New Hampshire.............. 452,030 134,424 76,167 42,436 13,192 1,026 123,589 61,196 299,394New Jersey ...................... 2,242,821 1,135,094 287,991 145,245 123,601 6,474 210,311 334,105 16,739,851
New Mexico .................... 605,545 258,420 84,934 86,341 4,904 25,474 91,052 54,420 572,088New York ......................... 6,435,882 1,861,804 1,553,863 140,600 12,421 62,597 513,364 2,291,233 12,433,493North Carolina ............... 1,920,236 786,588 149,559 455,294 42,079 91,956 136,778 257,982 7,373,715North Dakota .................. 370,531 107,542 70,248 15,046 3,529 68,369 62,985 42,812 1,002,131Ohio ................................. 2,579,068 1,252,185 360,113 222,593 108,001 51,892 259,741 324,543 2,266,233
Oklahoma ....................... 1,196,018 432,218 266,605 117,216 5,752 123,195 104,539 146,493 1,225,994Oregon ............................. 917,629 395,403 114,889 80,359 9,372 18,199 143,578 155,829 1,229,705Pennsylvania................... 3,502,114 918,757 1,808,746 159,404 39,135 49,471 279,207 247,394 4,307,039Rhode Island .................. 467,836 137,443 132,384 23,614 9,050 1,674 63,313 100,358 1,031,451South Carolina ............... 900,221 253,147 195,931 108,846 7,409 35,153 89,954 209,781 11,200,345
South Dakota.................. 409,962 78,615 107,485 21,092 315 94,520 74,758 33,177 643,297Tennessee........................ 2,072,181 1,241,887 296,997 175,703 34,522 46,306 138,467 138,299 1,009,394Texas ................................ 6,245,547 2,657,136 1,155,771 644,779 45,325 291,775 856,846 593,915 27,662,831Utah ................................. 1,270,254 648,356 189,563 71,699 56,118 10,075 127,269 167,174 126,564Vermont ........................... 245,138 14,150 96,497 9,632 1,619 27,267 88,339 7,634 156,535
Virginia ........................... 3,319,227 1,664,147 292,629 681,750 287,843 15,256 137,147 240,455 6,227,214Washington ..................... 2,305,672 911,858 376,489 402,512 82,885 39,676 305,905 186,347 1,929,199West Virginia .................. 183,479 65,556 0 21,343 54 42,606 41,059 12,861 706,276Wisconsin........................ 1,955,964 116,366 1,070,695 87,198 2,414 155,026 309,462 214,803 1,243,137Wyoming ......................... 255,163 113,284 0 17,229 1,896 29,146 51,974 41,634 157,906
Dist. of Columbia.......... 397,161 85,421 0 11,940 17,170 0 13,688 268,942 324,593American Samoa............ 0 0 0 0 0 0 0 0 1,761Guam ............................... 4,043 0 0 1,044 0 0 1,607 1,392 13,932No. Marianas Islands.... 90 0 0 0 0 0 90 0 0Puerto Rico ..................... 1,502,030 1,088,052 0 33,594 157,363 11,370 166,092 45,559 1,358,570U.S. Virgin Islands ......... 16,404 6,018 278 873 1,196 0 6,460 1,579 245,679

FEDERAL EXPENDITURES
304 The Book of the States 1998-99
Table 6.42FEDERAL GOVERNMENT LOAN AND INSURANCE PROGRAMS�VOLUME OFASSISTANCE PROVIDED, BY STATE AND TERRITORY: FISCAL YEAR 1996(In thousands of dollars)
Direct loans
Farmers HomeAdministration Federal Housing for the
State or other Commodity loans- rural housing Direct student elderly or Otherjurisdiction Total price supports loans loans handicapped direct loans
United States................. $ 20,342,044 $ 5,062,034 $ 3,711,824 $ 8,430,200 $ 536,149 $ 2,601,837
Alabama .............................. 350,689 5,773 76,122 222,700 7,135 38,959Alaska. ................................. 30,390 48 16,041 200 522 13,579Arizona ................................ 269,014 1,852 73,848 174,400 4,631 14,283Arkansas ............................. 366,532 223,923 90,676 18,900 3,417 29,616California ............................ 2,016,871 391,476 228,379 762,900 65,231 568,885
Colorado ............................. 489,938 185,127 45,736 235,900 11,353 11,822Connecticut......................... 68,145 232 11,672 38,300 12,897 5,044Delaware ............................. 47,941 811 8,029 35,500 50 3,551Florida ................................. 612,373 106,679 132,142 210,100 27,461 135,991Georgia ................................ 819,812 297,819 122,048 341,200 8,534 50,211
Hawaii ................................. 55,459 0 43,577 400 3,465 8,017Idaho .................................... 188,185 16,737 49,923 103,400 2,143 15,982Illinois .................................. 1,000,852 270,202 88,753 477,600 25,581 138,716Indiana ................................ 492,227 173,218 91,228 200,800 1,875 25,106Iowa ..................................... 874,398 466,632 80,776 287,200 3,524 36,266
Kansas................................. 171,429 30,969 64,055 45,800 0 30,605Kentucky ............................. 292,479 30,803 92,670 123,000 2,610 43,396Louisiana ............................ 330,751 155,574 76,501 54,700 18,479 25,497Maine ................................... 107,210 30 68,856 23,300 92 14,932Maryland ............................ 234,145 8,050 61,663 139,700 5,322 19,410
Massachusetts.................... 570,946 109 48,563 488,500 25,004 8,770Michigan ............................. 852,487 121,381 124,282 546,700 12,649 47,475Minnesota ........................... 986,588 651,874 136,615 159,100 2,746 36,253Mississippi .......................... 537,854 403,094 89,769 13,800 2,592 28,599Missouri .............................. 406,653 60,027 98,320 201,900 13,323 33,083
Montana .............................. 122,806 36,317 43,644 32,100 0 10,745Nebraska............................. 240,592 170,433 50,336 12,100 433 7,290Nevada ................................. 50,190 7 18,599 24,300 0 7,284New Hampshire.................. 35,320 0 23,493 4,700 2,288 4,839New Jersey .......................... 342,519 2,441 33,320 278,100 14,936 13,722
New Mexico ........................ 109,485 2,208 30,539 66,100 441 10,197New York ............................. 978,361 25,917 95,656 705,000 90,849 60,939North Carolina ................... 402,809 42,131 148,225 147,600 8,327 56,526North Dakota ...................... 163,415 89,522 52,999 4,400 0 16,494Ohio ..................................... 751,387 95,045 105,971 447,300 61,849 41,222
Oklahoma ........................... 151,626 6,057 68,976 53,100 1,745 21,748Oregon ................................. 365,857 4,193 56,557 191,700 5,449 107,958Pennsylvania....................... 375,583 9,813 126,756 84,000 27,339 127,675Rhode Island ...................... 100,575 0 7,103 80,200 11,731 1,541South Carolina ................... 157,498 4,578 62,362 67,100 25 23,433
South Dakota...................... 175,209 103,575 40,275 2,600 575 28,184Tennessee............................ 320,477 88,524 102,654 86,400 8,027 34,872Texas .................................... 929,986 403,394 206,341 114,800 14,070 191,381Utah ..................................... 262,142 233,285 22,622 1,400 2,258 2,577Vermont ............................... 77,019 133 18,210 53,000 0 5,676
Virginia ............................... 596,329 59,188 80,143 411,000 1,512 44,486Washington ......................... 412,298 18,759 96,845 190,700 10,372 95,622West Virginia ...................... 199,680 1,127 32,530 120,700 598 44,725Wisconsin............................ 299,727 62,145 83,025 132,400 7,429 14,728Wyoming ............................. 23,859 802 19,846 600 0 2,611
Dist. of Columbia ............... 127,989 0 0 125,100 2,629 260American Samoa................ 0 0 0 0 0 0Guam ................................... 4,687 0 3,257 700 0 730No. Marianas Islands........ 152 0 0 0 0 152Puerto Rico ......................... 185,357 0 55,307 86,100 2,143 41,807U.S. Virgin Islands ............. 205,742 0 5,989 900 488 198,365

FEDERAL EXPENDITURES
The Council of State Governments 305
FEDERAL GOVERNMENT LOAN AND INSURANCE PROGRAMS � Continued
Guaranteed loans
Veteranshousing
Mortgage Guaranteed guaranteed Mortgage Farmers Home Small OtherState or other insurance student & insured insurance Administration business guaranteed Totaljurisdiction Total for homes loans loans (a) condominiums programs loans loans insurance
Source: U.S. Department of Commerce, Bureau of the Census.Note: Detail may not add to totals due to rounding. Amounts represent
dollar volume of direct loans made and loans guaranteed, or the face value ofinsurance coverage provided during the fiscal year.
(a) Represents only the federal government’s contingent liability which isthe lesser of $36,000 or 40 percent of the loan (minimum $22,500). Amountshown does not represent the full value of closed loans, as shown in the fed-eral budget.
United States............. $119,089,074 $59,799,909 $19,698,826 $10,529,236 $4,722,658 $2,545,181 $7,202,530 $14,590,734 $409,406,498
Alabama .......................... 1,100,650 578,181 0 164,560 11,670 16,804 64,827 264,608 2,879,986Alaska .............................. 521,632 343,557 0 80,470 17,789 7,859 30,506 41,451 222,922Arizona ............................ 2,650,786 1,815,470 0 321,897 44,722 17,194 203,023 248,480 2,099,082Arkansas ......................... 956,154 480,699 140,203 90,987 3,962 82,982 52,545 104,776 1,031,310California ........................ 17,536,267 9,996,115 1,409,594 1,294,325 1,099,502 88,229 1,253,528 2,394,974 31,529,298
Colorado ......................... 3,771,900 2,274,603 257,660 374,645 308,649 52,281 195,340 308,722 2,344,644Connecticut ..................... 1,269,016 656,909 160,893 55,214 102,827 8,105 135,982 149,086 3,449,920Delaware ......................... 212,479 143,209 5,199 34,613 640 8,303 13,217 7,298 1,550,793Florida ............................. 5,703,160 3,190,928 524,394 816,181 223,982 42,056 306,633 598,986 170,236,670Georgia ............................ 3,331,554 1,956,276 177,377 466,345 64,605 86,426 221,697 358,828 6,666,290
Hawaii ............................. 322,492 115,357 0 26,620 126,126 4,407 14,760 35,222 5,265,612Idaho ................................ 604,447 380,153 0 69,461 3,922 27,324 70,208 53,379 493,510Illinois .............................. 4,738,130 2,939,146 494,363 229,366 379,236 92,425 232,704 370,890 6,151,653Indiana ............................ 6,996,770 1,211,641 5,293,075 191,993 21,319 49,446 67,740 161,556 2,496,190Iowa ................................. 683,587 185,999 163,128 38,547 10,570 112,194 86,368 86,781 4,100,384
Kansas............................. 736,560 353,257 0 85,965 3,442 73,485 95,315 125,096 1,884,175Kentucky ......................... 1,101,845 478,890 248,282 111,404 14,204 62,226 59,325 127,514 1,321,890Louisiana ........................ 1,271,983 623,696 194,573 121,580 6,714 110,774 100,926 113,720 28,254,520Maine ............................... 379,661 118,606 128,268 40,813 3,230 16,309 35,979 36,456 625,813Maryland ........................ 4,161,747 2,809,378 0 458,395 446,750 12,231 98,061 336,932 4,162,544
Massachusetts................ 2,070,182 693,855 706,922 107,434 53,928 14,398 141,831 351,814 4,250,328Michigan ......................... 2,938,888 1,401,378 271,404 192,961 45,976 70,612 152,224 804,333 2,337,662Minnesota ....................... 3,536,818 1,818,946 692,232 178,916 200,997 105,358 154,764 385,605 2,859,109Mississippi ...................... 709,668 429,165 0 66,124 367 54,579 56,816 102,617 3,308,758Missouri .......................... 2,119,341 1,155,093 195,794 163,226 25,447 92,853 154,976 331,952 2,202,693
Montana .......................... 542,159 199,169 87,141 32,949 6,463 55,034 76,656 84,747 630,103Nebraska......................... 881,846 291,974 313,344 86,765 969 104,681 42,374 41,739 3,406,107Nevada ............................. 1,491,285 1,032,343 0 211,062 85,156 15,450 43,541 103,733 1,165,260New Hampshire.............. 576,334 202,233 133,898 48,837 21,028 5,149 59,734 105,455 353,941New Jersey ...................... 2,665,466 1,534,242 214,229 136,539 154,463 13,071 202,890 410,032 18,144,136
New Mexico .................... 674,145 357,690 71,803 97,411 6,093 24,193 57,170 59,785 704,718New York ......................... 5,858,235 2,432,228 1,404,308 149,833 14,250 66,039 331,545 1,460,032 11,209,063North Carolina ............... 2,328,622 1,081,465 203,328 464,155 56,128 85,782 108,950 328,814 8,597,182North Dakota .................. 408,142 139,843 58,864 20,306 3,644 70,944 38,900 75,641 1,571,994Ohio ................................. 2,616,812 1,540,858 8,872 303,851 101,095 43,289 188,598 430,249 2,622,464
Oklahoma ....................... 1,323,979 595,297 286,786 152,070 8,706 65,445 69,492 146,183 1,339,208Oregon ............................. 1,036,892 572,535 74,732 98,292 14,258 25,266 83,343 168,466 1,784,799Pennsylvania................... 4,274,086 1,477,958 1,777,342 198,088 57,796 39,465 187,859 535,578 5,195,867Rhode Island .................. 546,395 229,379 119,197 26,480 11,270 6,060 67,481 86,528 1,121,699South Carolina ............... 1,008,112 350,807 202,958 151,034 10,588 32,477 66,080 194,168 12,728,942
South Dakota.................. 408,345 100,025 107,890 23,063 177 60,926 37,792 78,472 1,064,367Tennessee........................ 2,597,394 1,672,799 311,252 236,276 46,961 28,820 104,198 197,088 1,170,329Texas ................................ 7,692,561 3,850,832 1,270,650 813,070 59,117 218,562 668,909 811,421 30,232,627Utah ................................. 1,757,479 1,156,226 176,683 88,849 76,368 8,525 76,838 173,990 172,944Vermont ........................... 187,032 22,378 90,759 10,602 2,121 16,840 37,925 6,407 179,686
Virginia ........................... 4,100,354 2,324,534 183,506 745,281 440,505 23,146 93,632 289,750 6,917,430Washington ..................... 2,810,358 1,283,525 365,275 427,211 140,015 31,125 205,094 358,113 2,422,258West Virginia .................. 176,426 69,696 0 24,297 192 35,296 26,941 20,004 862,217Wisconsin........................ 2,022,394 223,772 1,172,648 138,884 3,104 111,651 176,638 195,697 1,370,475Wyoming ......................... 243,019 124,775 0 25,222 439 15,846 27,332 49,405 179,328
Dist. of Columbia ........... 371,898 115,892 0 11,053 21,143 0 12,596 211,214 239,646American Samoa............ 40 0 0 0 0 0 40 0 4,070Guam ............................... 3,856 1,407 0 1,050 0 0 779 620 16,986No. Marianas Islands.... 0 0 0 0 0 0 0 0 0Puerto Rico ..................... 1,013,641 662,172 0 24,075 159,718 33,239 107,597 26,840 2,039,272U.S. Virgin Islands ......... 46,050 3,348 0 589 315 0 2,311 39,487 233,624

306The Book of the States 1998-99
STATE PAGES
Table 6.43STATE GAMING
Lottery Games Parimutuel Wagering
Video Instant Inter- OffState or other Charitable Charitable Card Gaming Sports Indian Indian lottery (& pull tab) Jai Quarter Thorough- track track Telephonejurisdiction bingo games rooms Casinos devices wagering casinos bingo terminals Keno games Lotto Numbers Greyhound Alai Harness horse bred wagering betting betting
Alabama ........... ③ ③ ③ ⑨ ♦ ♦ ③Alaska ............... ③ ③ ③Arizona ............. ③ ③ ③ ③ ③ ③ ③ ③ ③ ③ ③Arkansas ........... ③ ⑨ ③ ③California .......... ③ ③ ③ ★ ③ ✝✝ ③ ③ ③ ③ ③ ③ ③ ③
Colorado ........... ③ ③ ③ ③ ③ ③ ③ ③ ③ ③ ③ ③ ③ ③ ③Connecticut ...... ③ ③ ③ ③ ③ ③ ③ ③ ③ ⑨ ⑨ ⑨ ③ ③ ③Delaware ........... ③ ③ ③ ③ ③ ③ ③ ③ ③ ③Florida .............. ③ ③ ❧ ③ ③ ③ ③ ③ ③ ③ ③ ♦ ③ ③Georgia ............. ③ ③ ③ ③ ③
Hawaii ...............Idaho ................. ③ ③ ★ ③ ③ ③ ♦ ③ ③ ③Illinois ............... ③ ③ ③ ③ ③ ③ ③ ③ ③ ③ ③ ③Indiana .............. ③ ③ ③ ③ ③ ③ ③ ③ ⑨ ③ ③ ③Iowa .................. ③ ③ ③ ③ ③ ③ ③ ③ ③ ③ ③ ③ ③ ③
Kansas .............. ③ ③ ③ ③ ③ ③ ③ ③ ③ ♦ ③ ③ ③Kentucky .......... ③ ③ ③ ③ ③ ③ ③ ③ ③ ③ ③Louisiana .......... ③ ③ ③ ③ ③ ③ ③ ③ ③ ♦ ③ ③ ③ ③Maine ................ ③ ③ ③ ③ ③ ③ ③ ♦ ③ ③Maryland .......... ③ ③ ③ ③ ③ ③ ③ ③ ③ ③ ③ ⑨
Massachusetts .. ③ ③ ③ ③ ③ ③ ③ ③ ♦ ③ ③Michigan ........... ③ ③ ⑨ ⑨ ③ ③ ③ ③ ③ ③ ③ ③ ③ ③Minnesota ......... ③ ③ ③ ③ ③ ③ ③ ③ ③ ③ ③Mississippi ........ ③ ③ ③ ③ ③ ③Missouri ............ ③ ③ ③ ③ ③ ③ ③ ③ ♦ ♦ ♦ ⑨ ⑨
Montana ........... ③ ③ ③ ✝ ✝ ③ ③ ③ ③ ③ ⑨ ③ ③ ③ ③Nebraska ........... ③ ③ ❣ ③ ③ ③ ③ ♦ ③ ③Nevada .............. ③ ③ ③ ③ ③ ③ ③ ♦ ♦ ♦ ③ ③ ③ ③New Hampshire ③ ③ ③ ③ ③ ③ ③ ③ ③New Jersey ........ ③ ③ ③ ③ ③ ③ ③ ③ ③ ③ ③ ③
New Mexico ...... ③ ③ ⑨ ③ ③ ③ ❧ ③ ③ ③New York .......... ③ ③ ❣ ③ ③ ③ ③ ③ ③ ♦ ③ ③ ③ ③North Carolina . ③ ③ ③North Dakota ... ③ ③ ③ ③ ③ ③ ♦ ③ ③ ③ ③Ohio .................. ③ ③ ③ ③ ③ ③ ③ ③ ③ ⑨ ③
Oklahoma ......... ③ ③ ★ ③ ⑨ ③ ③ ③ ③Oregon .............. ③ ③ ③ ③ ③ ③ ③ ③ ③ ③ ③ ③ ③ ③ ③ ③Pennsylvania .... ③ ③ ③ ③ ③ ③ ③ ♦ ③ ③ ③ ③Rhode Island .... ③ ③ ③ ③ ③ ③ ③ ③ ③ ♦ ♦ ③South Carolina . ③ ✝ ✝

The Council of State G
overnments
307
STATE PAGES
STATE GAMING � Continued
Lottery Games Parimutuel Wagering
Video Instant Inter- OffState or other Charitable Charitable Card Gaming Sports Indian Indian lottery (& pull tab) Jai Quarter Thorough- track track Telephonejurisdiction bingo games rooms Casinos devices wagering Casinos Bingo terminals Keno games Lotto Numbers Greyhound Alai Harness horse bred wagering betting betting
South Dakota ........... ③ ③ ③ ③ ③ ③ ③ ③ ③ ③ ③ ♦ ③ ③ ♦ ③Tennessee ................. ⑨ ⑨ ⑨ ⑨ ⑨Texas ........................ ③ ③ ③ ③ ③ ③ ③ ③ ③ ③Utah ......................... ■Vermont ................... ③ ③ ③ ③ ③ ♦ ③ ♦ ⑨
Virginia .................... ③ ③ ③ ③ ③ ⑨ ⑨ ⑨ ⑨ ③Washington .............. ③ ③ ③ ✝ ✝ ❣ ③ ③ ③ ③ ③ ♦ ③ ③ ③ ③West Virginia ........... ③ ③ ③ ③ ③ ③ ③ ③ ⑨ ♦ ③ ③Wisconsin ................ ③ ③ ③ ③ ③ ③ ③ ③ ⑨ ⑨ ⑨ ③Wyoming .................. ③ ③ ③ ⑨ ③ ③ ③ ③
Dist. of Columbia .... ③ ③ ③ ③ ③Puerto Rico .............. ③ ③ ③ ③ ③ ③ ③ ③U.S. Virgin Islands .. ⑨ ⑨ ③ ③ ③
Source: International Gaming & Wagering Business, September 1997.Key:③ — Legal and operative.© — Implemented since June 1996.⑨ — Authorized but not yet implemented.♦ — Permitted by law and previously operative.■ — Operative but no parimutuel wagering.✝ — Commerical bingo, keno or pull tabs only.✝✝ — Previously operative but now not permitted.★ — Compacts signed for non-casino gaming, such as parimutuel wagering and lottery; however, casino games may be operating.❣ — Table games only (no slots).