Embed Size (px)
Citation preview

Borough of Arima
Local Area Economic Profile
(Final Report)

Borough of Arima Local Area Economic Profile
(Final Report)
Submitted to:
Permanent Secretary
Ministry of Rural Development and Local Government
Kent House, Maraval, Trinidad and Tobago
Submitted by:
Kairi Consultants Limited 14 Cochrane Street, Tunapuna,
TRINIDAD AND TOBAGO Tel: 1 868 663 2677; Fax: 1 868 663 1442
Email: [email protected]

Eco-Cultural City of
Trinidad and Tobago
ii
Table of Contents
List of Figures ......................................................................................................................................... v
List of Tables ........................................................................................................................................ vii
Acronyms and Abbreviations................................................................................................................. ix
Chapter 1 Introduction .......................................................................................................................... 12
1.1 Limitations of the Study ........................................................................................................ 13
1.2 Content of the Arima Local Area Economic Profile .............................................................. 13
Chapter 2 Area Information and Demography ..................................................................................... 14
2.1 Location ................................................................................................................................ 14
2.2 Geography ............................................................................................................................ 14
2.3 Population and Demography ................................................................................................ 16
2.3.1 Population and Household Size ..................................................................................... 16
2.3.2 Population Density .......................................................................................................... 16
2.3.3 Age Profile and Dependency .......................................................................................... 17
2.3.4 Ethnicity .......................................................................................................................... 18
2.3.5 Religious Affiliation ......................................................................................................... 19
2.4 Educational Attainment ......................................................................................................... 20
2.5 Living Conditions in Arima .................................................................................................... 22
2.6 Crime ..................................................................................................................................... 26
Chapter 3 Arima’s Natural Resources ................................................................................................. 28
3.1 Land Use and Resources ..................................................................................................... 28
3.2 Fresh Water Resources ........................................................................................................ 29
Chapter 4 Arima’s Physical and Local Assets ..................................................................................... 30
4.1 Physical Infrastructure .......................................................................................................... 30
4.1.1 Transportation................................................................................................................. 30
4.1.2 Water Supply Distribution ............................................................................................... 30
4.1.3 Wastewater and Solid Waste Management ................................................................... 30
4.1.4 Information and Communications Technology ............................................................... 30

iii
4.2 Social/Cultural Infrastructure ................................................................................................ 31
4.3 Industrial Development ......................................................................................................... 31
4.4 Social Facilities ..................................................................................................................... 31
4.4.1 Health ............................................................................................................................. 31
4.4.2 Education ........................................................................................................................ 31
4.4.3 Disaster Management .................................................................................................... 31
4.4.4 Social Services and Community Development .............................................................. 31
4.4.5 Recreation, Sports and Entertainment ........................................................................... 31
Chapter 5 The Municipal Economy ...................................................................................................... 32
5.1 Gross Domestic Product of Trinidad and Tobago ................................................................ 32
5.2 The Area Economy ............................................................................................................... 33
5.2.1 Key Economic Drivers (Activities) .................................................................................. 33
5.2.2 Employment and Unemployment Trends ....................................................................... 35
5.2.3 Occupational Groups ...................................................................................................... 36
5.2.4 Income ............................................................................................................................ 37
Chapter 6 Profiling the Borough of Arima’s MSME Sector .................................................................. 38
6.1 Introduction ........................................................................................................................... 38
6.2 Legislative, Policy and Institutional Framework for MSME Development ............................ 40
6.2.1 Legislative and Policy Framework .................................................................................. 40
6.2.2 Institutions and Public Programmes ............................................................................... 42
6.3 Entrepreneurial Development in Trinidad and Tobago ........................................................ 47
6.4 The Arima MSME Sector (MSMEs Survey, 2015) ............................................................... 49
6.4.1 General Characteristics .................................................................................................. 49
6.4.2 Size of Enterprise ........................................................................................................... 50
6.4.3 Legal Status .................................................................................................................... 52
6.4.4 Primary Business Activities ............................................................................................ 55
6.4.5 Employment .................................................................................................................... 58
6.4.6 Markets and Annual Sales ............................................................................................. 58
6.4.7 Financing and Investment .............................................................................................. 59
6.4.8 Use of Internet ................................................................................................................ 60
6.4.9 Technical Support ........................................................................................................... 61
6.4.10 Key Issues Faced by MSMEs ........................................................................................ 62
6.5 Challenges and Opportunities Facing MSMEs .................................................................... 63
Chapter 7 Local Governance in the Borough of Arima ........................................................................ 67
7.1 The Prevailing Local Government System ........................................................................... 67

iv
7.2 Local Government Reform.................................................................................................... 68
7.3 Local Economic Development and Local Government ........................................................ 70
7.4 Caribbean Local Economic Development Programme ........................................................ 71
Chapter 8 Recommendations for Local Economic Development ........................................................ 73
8.1 Targeted Sectors .................................................................................................................. 73
8.1.1 Food Sustainability ......................................................................................................... 74
8.1.2 Eco-culltural Tourism ...................................................................................................... 74
8.1.3 Cultural Expression ........................................................................................................ 75
8.1.4 Commerce and Distribution ............................................................................................ 75
8.2 Proposed Projects and Implementation Plan ....................................................................... 76
8.3 Arima LED Implementation Plan .......................................................................................... 82
8.4 Conclusion ............................................................................................................................ 89

v
List of Figures
Figure 2.1: Location of the Municipality of Arima illustrating the distribution of Communities ............ 15
Figure 2.2: Age/Sex Composition of the Population of Borough of Arima, 2000, 2011 ...................... 18
Figure 2.3: : Ethnic Composition of Arima’s Population ....................................................................... 19
Figure 2.4: Six Top Religious Affiliations Arima, 2011 ......................................................................... 20
Figure 2.5: Non-Institutional Population of Arima by Educational Attainment ..................................... 21
Figure 2.6: National Human development Index 2008/2009 by Administrative Regions .................... 23
Figure 2.7: Inequality-adjusted National Human development Index 2008/2009 by Administrative
Regions................................................................................................................................................. 24
Figure 2.8: Police Divisions of Trinidad and Tobago ........................................................................... 26
Figure 2.9: Share of Serious Crimes by the Type of Crime in the Northern Police Division, 2010 ..... 27
Figure 5.1: Registered Business by Community .................................................................................. 35
Figure 5.2: Employment of Household Heads ..................................................................................... 36
Figure 5.3: Distribution of Household Heads by Main Occupational Group ........................................ 36
Figure 5.4: Distribution of Household Heads by Gross Monthly Income from Main Job ..................... 37
Figure 6.1: Changes in the Number of MSMEs, 2001 to 2007 ............................................................ 39
Figure 6.2: Distribution of MSMEs by Firm Size, 2007 ........................................................................ 40
Figure 6.3: Proportion of MSMEs by Size of Enterprise ..................................................................... 40
Figure 6.4: Age Breakdown of the Arima MSME Operators ................................................................ 50
Figure 6.5: Sze Breakdown of MSMEs by Sex of the Operators ......................................................... 51
Figure 6.6: Ethnic Breakdown of MSME Operators ............................................................................. 51
Figure 6.7: Ethnic Composition of MSME Operators Compared to the National Population .............. 52
Figure 6.8: Length of Time in Operation .............................................................................................. 52
Figure 6.9: Proportion of Registered MSME Businesses by Size of Enterprise .................................. 53
Figure 6.10: Proportion of Registered MSME Businesses by Length of Time in Operation ............... 54
Figure 6.11: Distribution of MSMEs by Primary Business Activity ....................................................... 56
Figure 6.12: Key Business Activities for MSMEs in Arima by Size of Enterprise ................................ 57
Figure 6.13: Average Annual Sales (in TT$) for MSMEs in Arima ...................................................... 59

vi
Figure 6.14: Distribution of Financing Received by MSMEs ............................................................... 60
Figure 6.15: Routine Use of the Internet by Sex of Enterprise Operator and Size of Enterprise ........ 61
Figure 6.16: Types of Technical Support Received by MSMEs in Arima ............................................ 62
Figure 6.17: Issues Rating of Key Issues to MSME Development in Arima ........................................ 63

vii
List of Tables
Table 2.1: Changes in Non-institutional Population and Household Characteristics .......................... 16
in Trinidad and Tobago, 2000-2011 ..................................................................................................... 16
Table 2.2: Population Density of the Borough of Arima, 1990, 2000 and 2011 .................................. 17
Table 2.3: Percentage Distribution of Total Population of Arima by Ethnic Group, 2011 ................... 19
Table 2.4: Percentage Distribution of Arima’s Total Population by Religious Affiliation, 2011 ........... 20
Table 2.5: Non-Institutional Population of Arima by Age Group and Educational Attainment ............ 21
Table 2.6: Non-Institutional Population of Arima by Age Group and Highest Educational Attainment
.............................................................................................................................................................. 22
Table 2.7: Various Statistics on Living Conditions in Arima................................................................. 25
Table 5.1: Trinidad and Tobago Selected Economic Indicators .......................................................... 33
Table 5.2: Distribution of Registered Businesses by Sector and Size ................................................ 34
Table 5.3: Businesses in Operation by Municipality ............................................................................ 34
Table 6.1: Domestic Definition of Micro, Small and Medium-sized Enterprises .................................. 39
Table 6.2: Criteria Used to Define Mini-Micro, Micro and Small-sized Businesses ............................ 40
Table 6.3: Ratings for the Main Indicators for Entrepreneurship Framework Conditions ................... 48
Table 6.4: Age Breakdown of Operators by Sex ................................................................................. 50
Table 6.5: Length of Time in Business by Size of Enterprise .............................................................. 52
Table 6.6: Length of Time in Business by Sex ..................................................................................... 53
Table 6.7: Registration Status of Enterprises by Size of Enterprise .................................................... 53
Table 6.8: Length of Time in Operation by Registration Status of the Enterprise ............................... 54
Table 6.9: Legal Status of MSMEs by Sex of Operator ....................................................................... 55
Table 6.10: Legal Status of MSMEs by Size of Enterprise .................................................................. 55
Table 6.11: Primary Business Activity of MSMEs by Sex of Operators .............................................. 56
Table 6.12: Primary MSME Business Activity by Size of Enterprise ................................................... 57
Table 6.13: Employment in MSMEs by Size of Enterprise .................................................................. 58
Table 6.14: Educational Level of MSME Employees by Size of Enterprise ........................................ 58
Table 6.15: Primary Markets for Goods and Services by Sex of Enterprise Operator ........................ 58

viii
Table 6.16: Average Annual Sales by Sex of Enterprise Operator ..................................................... 59
Table 6.17: Key Suppliers of Financing to MSMEs in Arima ............................................................... 60
Table 6.18: Internet Users (per 100 people) in Trinidad and Tobago, 2010-2014 .............................. 61
Table 6.19: Key Sources of Technical Support by Sex of Enterprise Operator .................................. 61

ix
Acronyms and Abbreviations
CAPA Crime and Problem Analysis Unit
CAPE Caribbean Advanced Proficiency Examinations
CARILED Caribbean Local Economic Development
CBIs Community-based incubators
CBO(s) Community-based Organisation(s)
CBTT Central Bank
CDF Community Development Fund
CEO Chief Executive Officer
COSTAATT College of Science, Technology and Applied Arts of Trinidad and Tobago
CSEC Caribbean Secondary Education Certificate
CSO Central Statistical Office
ECA Employers’ Consultative Association of Trinidad and Tobago
EDB Economic Development Board of Trinidad and Tobago
EDD Enterprise Development Division
EIF Enterprise Investment Fund
EMA Environmental Management Authority
ETIIC Entrepreneurial Training Institute and Incubation Centre
FAO Food and Agriculture Organisation
GCE General Certificate of Education
GEF Global Environment Facility
GEM Global Entrepreneurial Monitoring
GORTT Government (of the Republic) of Trinidad and Tobago
HDI Human Development Index
i2i Innovations and Inventions
IBIS National Integrated Business Incubator System
ICT Information and Communications Technology
ICT Information Technology
IDB Inter-American Development Bank
IFF Innovation Financing Facility

x
INHDI Inequality-adjusted National Human Development Index
LAEP Local Area Economic Profile
LARPDU Local Area and Regional Planning and Development Unit
LED Local Economic Development
LEDO Local Economic Development Officer
LEDU Local Economic Development Units
LSA Land Settlement Agency
MCD Ministry of Community Development, Culture and the Arts
MDP Municipal Development Plan
MEL Micro Enterprise Loan
MIC The Metal Industries Company
MOLSED Ministry of Labour and Small Enterprise Development
MOUs Memorandum of Understanding
MPI Multidimensional Poverty Index
MSE Micro and Small Enterprise
MSMEs Micro-, Small- and Medium-Sized Enterprises
MTI Ministry of Trade and Industry
MTPF National Medium Term Policy Framework
MuST Multi Sector Skills Training
MW Megawatt
NEDCO National Entrepreneurship Development Company Limited
NHDI National Human Development Index
NSDS National Spatial Development Strategy for Trinidad and Tobago
PPP Public Private Partnership
R&D Research and Development
RDF Research and Development Fund
SAC Stakeholder Advisory Council
SMEs Small and Medium Enterprises
TCPD Town and Country Planning Division
TEA Total Early Stage Entrepreneurial Activity
THA Tobago House of Assembly
TTD Trinidad and Tobago Dollars
TTMF Trinidad and Tobago Manufacturers Association
TVET Technical-Vocational Education and Training
UNDP United Nations Development Programme
USD United States Dollars
UTT University of Trinidad and Tobago

xi
UWI The University of the West Indies
WASA Water and Sewerage Authority
YBI Youth Business International
YBTT Youth Business Trinidad and Tobago

12
Chapter 1 Introduction
The Local Area Economic Profile (LAEP) for the Borough of Arima1 was developed with a view to
build on the existing Municipal Development Plan and to introduce the Arima Borough Corporation2
to the Local Economic Development (LED) approach. The LED approach was introduced to Trinidad
and Tobago by the Federation of Canadian Municipalities through its Caribbean Local Economic
Development (CARILED) programme in collaboration with the Caribbean Forum of Local
Government Ministers, the Caribbean Association of Local Government Authorities and the
Commonwealth Local Government Forum.
The LED approach aims not only to enhance the economic capacity of a local area for the purpose
of improving living conditions but also strives to develop a business-friendly environment in which
micro-, small- and medium-sized enterprises (MSMEs) could prosper. This approach has been
advocated by the Local Area and Regional Planning and Development Unit (LARPDU) since it
creates a framework through which local government, the not-for-profit sectors, the private sector
and the local community could work together to improve the local economy. It also provides
opportunities for enhancing local competitiveness and encouraging a growth that is sustainable and
inclusive.3
The preparation of the Arima LAEP is the step leading to the development of the Arima LED
Strategy and the implementation of activities geared towards sustainable local economic
development. The profile is meant to provide a baseline of local conditions and an understanding of
the external and national context for economic development of the area and its people.
The profile for the Borough of Arima was developed with the aid of quantitative and qualitative
methodologies utilised in the LED approach, which captured information from a range of
stakeholders in the Municipality. The methodologies consisted of the following:
A review of secondary data for the Municipality including its Municipal Development Plan, the
Municipal Investment Plan and the National Medium Term Policy Framework 2011-2014;
1 Borough of Arima refers to the geographic area (whose boundaries are applied under Section 4 of the Municipal Corporation Act (Act No. 21 of 1990).
2 Arima Borough Corporation means the body corporate constituted by the Mayor, Aldermen, Councilors and electors of Borough of Arima to which the Municipal Corporation Act (Act No. 21 of 1990) applies.
3 http://web.worldbank.org/WBSITE/EXTERNAL/TOPICS/EXTURBANDEVELOPMENT/EXTLED/0,,menuPK:341145~ pagePK:149018~piPK:149093~theSitePK:341139,00.html

13
Capacity Workshops to train and sensitise the Local Economic Development Officer (LEDO)
about the approach to preparing a LAEP;
The conduct of a survey of MSMEs (120 enterprises);
The conduct of discussions with the Chairman and the Municipal Council to glean useful
insights into opportunities for LED within the communities of Arima;
The conduct of focus group discussions with micro, small and medium entrepreneurs;
The conduct of interviews with the State Agencies, Private Sector Agencies and NGOs;
An analysis of collected data including identification of strengths, weaknesses, opportunities
and threats to overall socioeconomic development and MSME development in the
Municipality; and
Preparation of a local economic profile for Arima.
1.1 Limitations of the Study
The political climate due mainly to the upcoming General Election limited that the conduct of the
study particularly interaction with stakeholders and the conduct of the survey.
1.2 Content of the Arima Local Area Economic Profile
The Report consists of the following chapters:
1. Chapter One: Introduction
2. Chapter Two: Area Information and Demographics
3. Chapter Three: Municipal Natural Resources
4. Chapter Four: Physical and Social Assets
5. Chapter Five: The Area Economy
6. Chapter Six: Profiling MSME Sector of Arima
7. Chapter Seven: Local Governance in Arima
8. Chapter Eight: Conclusion and Recommendations

14
Chapter 2 Area Information and Demography
2.1 Location
The Borough of Arima is situated in north-central Trinidad and is surrounded by the
Tunapuna/Piarco Municipality. It is situated 26 kilometres from Port of Spain and just 8 kilometres
from Piarco International Airport. Figure 2.1 indicates the location and boundaries of Arima. The
Borough covers approximately 1115.4 hectares or 11.2 square kilometres and has a roughly
rectangular shape with an average north-south length of 5 kilometres and an average east-west
width of 2.2 kilometres. This highly urban and compact municipality comprises eight communities.
2.2 Geography
The topography of the area is generally flat to gently sloping and by far most of the land lies between
30 metres and 90 metres above mean sea level. The region is drained by the Arima and Mausica
Rivers. Arima is very vulnerable to flash flooding and landslides. Areas along the Mausica and Arima
Rivers are most prone to flooding, while landslide damage has occurred in Jonestown/ Mausica
Lands, Mount Pleasant and elsewhere in the Borough.
Trinidad has two easily distinguishable seasons; a dry and wet season. Because the climate of
Trinidad does not vary much spatially, the Borough of Arima also has a tropical climate with two
distinct seasons due to its proximity to the equator. However, being located at the foothills of a spur
of the Northern Range, the town tends to receive a higher rainfall than is the case of the settlements
in the central plains of the island. The dry season, the period from January to May, is characterised
by a tropical maritime climate with moderate to strong low-level winds, warm days, cool nights and
showers due to daytime convection. A modified moist equatorial climate characterized by low wind
speeds, hot humid days and nights, a marked increase in rainfall which results mostly from migrating
and latitudinal shifting equatorial weather systems, symbolizes the wet season during June to
December. Trinidad’s geographical location puts it on the southern periphery of the North Atlantic
hurricane basin.

15
Figure 2.1: Location of the Municipality of Arima illustrating the distribution of Communities

16
Although the wet season is generally warmer than the dry season, Trinidad and Tobago's daily
temperature cycle is more pronounced than its seasonal cycle. The long term mean (1971 - 2000)
annual maximum and minimum temperatures are 31.3 ℃ and 22.7 ℃ respectively with a mean daily
temperature of 26.5 ℃. Trinidad’s rainfall pattern displays a distinct bi-modal behaviour with June
and November rainfall season maxima. Trinidad's primary rainfall mode occurs in June.
2.3 Population and Demography
2.3.1 Population and Household Size
According to the 2011 Population and Housing Census, the population of Arima stood at 33,606
persons, representing some 2.5 percent of the national population of 1,328,019 persons. The
population of Arima grew by 12.8% between 1990 and 2000 and 4.1 percent between 2000 and
2011.
The 2011 census revealed that an average of 3.4 persons lived in the 9,779 recorded private
households in Arima. This showed a decline in the size of the average household since the 2000
Census of 0.4 persons, down from 3.8 persons per household (Table 1). However, the number of
households in Arima increased by 16.4 percent, which was comparable to the increase in the
number of households observed in Trinidad (16.1%).
Table 2.1: Changes in Non-institutional Population and Household Characteristics
in Trinidad and Tobago, 2000-2011
Country/ Region
Non-Institutional Population
Number of Occupied Private
Households
Average Household
Size
Average Annual Rate of
Growth in Population
Average Annual Rate of
Growth In Households
2011 2000 2011 2000 2011 2000 2000-2011 2000-2011
Trinidad and Tobago
1,322,546 1,250,652 401,382 343,180 3.3 3.6 0.5% 1.5%
Trinidad 1,261,812 1,197,426 381,257 328,000 3.3 3.7 0.5% 1.4%
Borough of Arima
33,404 32,114 9,779 8,400 3.4 3.8 0.4% 1.4%
Source: CSO 2011 Population and Housing Census
2.3.2 Population Density
In 2011, the Borough of Arima was the second most densely populated area of Trinidad and Tobago
with a density of 2,801 persons per square kilometre. As its population rose, the population density
of Arima increased correspondingly from 2,384 persons per square kilometre in 1990 to 2,690
persons per square kilometre in 2000 and 2,801 persons per square kilometre in 2011 (Table 2).
Arima rose in rank between 2000 and 2011 in spite of the net outflow of residents between
municipalities, surpassing the City of San Fernando. In 2000 both San Fernando and Port of Spain
were more densely populated than Arima

17
Table 2.2: Population Density of the Borough of Arima, 1990, 2000 and 2011
Year Density
(Per Sq. km) Population
1990 2,384 28,612
2000 2,690 32,278
2011 2,801 33,606
2.3.3 Age Profile and Dependency
Figure 2.2 shows Arima’s age and sex pyramids for 2000 and 2011, reflecting the changing structure
of the population over time. The 2011 pyramids for both the male and female population show
growth in the youngest age group (0-4 years). A similar widening of the older age groups is also
noted and reflects an aging population.
The population of Arima is relatively young, with more than half of the population (52.7%) under 35
years of which 21.5 percent is between 0 and 15 years. The age group between 10 and 19 years,
the majority of whom make up the secondary school age population, accounts for 13.2 percent of
Arima’s population. Persons, 65 years and older, made up 9.9 percent of the total population (Figure
2).
The population of dependent groups (all persons aged 0-14 years and 65+ years) decreased slightly
from 32.1 percent of the total population in 2000 to 30.1 percent in 2011. Conversely, the working-
age population (persons between 15 and 64 years) increased from 67.9 percent in 2000 to 69.9
percent in 2011.

18
Figure 2.2: Age/Sex Composition of the Population of Borough of Arima, 2000, 2011 Source: 2011 Population and Housing Census, Central Statistical Office (CSO)
The age dependency ratio (the ratio of the population between 0 and 14 years and 65+ years to the
working- age population, between 15 and 65 years) for Arima in 2011 stood at 43.1 percent; higher
than the national ratio and this was due primarily to the increased aging population. This ratio for
Arima represents a decrease compared to the 2000 figure of 47.4 percent. The child dependency
ratio in 2011 was estimated at 29 percent, and elderly dependency at 14.1 percent.
2.3.4 Ethnicity
Trinidad and Tobago as a country, is a plural society and as such Arima’s population is
heterogeneous in terms of ethnic composition (Table 3). The ‘Mixed-Other’ group, with 38.3 percent
963
1,129
1,453
1,535
1,272
1,105
954
1,148
949
813
766
558
395
317
275
167
182
974
1,068
1,422
1,529
1,266
1,052
1,115
1,116
992
886
746
548
465
355
281
231
283
2,000 1,500 1,000 500 0 500 1,000 1,500 2,000
0 - 4 Years
5 - 9 Years
10 - 14 Years
15 - 19 Years
20 - 24 Years
25 - 29 Years
30 - 34 Years
35 - 39 Years
40 - 44 Years
45 - 49 Years
50 - 54 Years
55 - 59 Years
60 - 64 Years
65 - 69 Years
70 - 74 Years
75 - 79 Years
80+
2000
Female Male
1,139
1,197
1,092
1,191
1,434
1,490
1,411
1,146
1,031
1,184
1,016
982
780
597
380
228
283
1,187
1,129
1,054
1,081
1,388
1,567
1,358
1,154
1,094
1,213
1,113
998
852
631
455
304
433
2,000 1,500 1,000 500 0 500 1,000 1,500 2,000
0 - 4 Years
5 - 9 Years
10 - 14 Years
15 - 19 Years
20 - 24 Years
25 - 29 Years
30 - 34 Years
35 - 39 Years
40 - 44 Years
45 - 49 Years
50 - 54 Years
55 - 59 Years
60 - 64 Years
65 - 69 Years
70 - 74 Years
75 - 79 Years
80+
2011
Female Male

19
of the total population, are the predominant ethnic group in Arima, followed closely by Africans who
made up 31.57 percent and East Indian, who account for 15.5 percent (Figure 2.3).
Table 2.3: Percentage
Distribution of Total Population
of Arima by Ethnic Group, 2011
Figure 2.3: : Ethnic Composition of Arima’s Population
Ethnic Group Percentage
African 31.57%
Caucasian 0.18%
Chinese 0.35%
East Indian 15.50%
Indigenous 0.29%
Mixed - African/ East Indian
7.11%
Mixed - Other 38.32%
Portuguese 0.05%
Syrian/ Lebanese
0.07%
Other Ethnic group
0.14%
Not stated 6.42% Source: CSO 2011 Population and Housing Census
2.3.5 Religious Affiliation
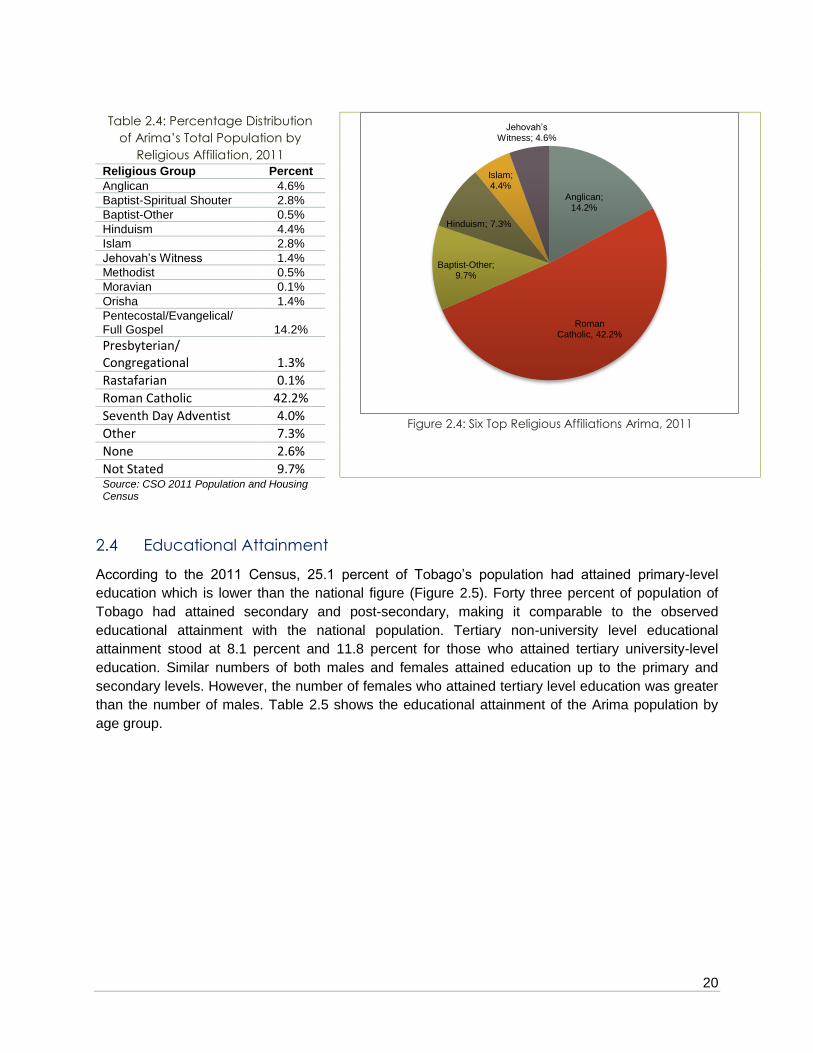
In 2011, Roman Catholicism was the largest single religious grouping in Arima (42.2% of the
population), followed by Pentecostal/Evangelical/Full Gospel (14.2%). Interestingly, the groupings
‘Other’ and ‘Not Stated’ constituted a significant proportion of the population. Table 2.4 gives a
distribution of the population by religious affiliations based on the 2011 Population and Housing
Census, while Figure 2.4 shows the distribution of the population for the five largest religious
affiliations.
African31.57%
Caucasian0.18%
Chinese0.35%
East Indian15.50%
Indigenous0.29%
Mixed -African/East
Indian7.11%
Mixed - Other38.31%
Portuguese0.05%
Syrian/ Lebanese
0.07%
Other Ethnic group0.14%
Not stated6.42%
20
Table 2.4: Percentage Distribution
of Arima’s Total Population by
Religious Affiliation, 2011
Figure 2.4: Six Top Religious Affiliations Arima, 2011
Religious Group Percent
Anglican 4.6%
Baptist-Spiritual Shouter 2.8%
Baptist-Other 0.5%
Hinduism 4.4%
Islam 2.8%
Jehovah’s Witness 1.4%
Methodist 0.5%
Moravian 0.1%
Orisha 1.4%
Pentecostal/Evangelical/ Full Gospel 14.2%
Presbyterian/ Congregational 1.3%
Rastafarian 0.1%
Roman Catholic 42.2%
Seventh Day Adventist 4.0%
Other 7.3%
None 2.6%
Not Stated 9.7%
Source: CSO 2011 Population and Housing Census
2.4 Educational Attainment
According to the 2011 Census, 25.1 percent of Tobago’s population had attained primary-level
education which is lower than the national figure (Figure 2.5). Forty three percent of population of
Tobago had attained secondary and post-secondary, making it comparable to the observed
educational attainment with the national population. Tertiary non-university level educational
attainment stood at 8.1 percent and 11.8 percent for those who attained tertiary university-level
education. Similar numbers of both males and females attained education up to the primary and
secondary levels. However, the number of females who attained tertiary level education was greater
than the number of males. Table 2.5 shows the educational attainment of the Arima population by
age group.
Anglican; 14.2%
Roman Catholic, 42.2%
Baptist-Other; 9.7%
Hinduism; 7.3%
Islam; 4.4%
Jehovah’s Witness; 4.6%

21
Figure 2.5: Non-Institutional Population of Arima by Educational Attainment
Source: CSO Population and Housing Census, 2011
Table 2.5: Non-Institutional Population of Arima by Age Group and Educational Attainment
Age Total
No
ne
Nu
rse
ry/
Kin
de
rga
rten
Pri
ma
ry
Se
co
nd
ary
Po
st-
Se
co
nd
ary
Te
rtia
ry/
No
n
Un
ive
rsit
y
Te
rtia
ry/
Un
ive
rsit
y
Oth
er
No
t
Ap
pli
ca
ble
No
t S
tate
d
Tobago 33,404 329 980 8,382 13,341 1,182 2,698 3,925 459 1,555 554
0 – 4 2,321 - 749 17 - - - - - 1,555 -
5 - 9 2,313 56 175 2,033 - - - - - - 49
10 - 14 2,130 28 23 1,040 991 - - - - - 47
15 - 19 2,260 16 1 90 1,727 102 137 143 16 - 27
20 - 24 2,817 6 5 85 1,397 161 411 670 50 - 33
25 – 29 3,056 10 6 211 1,456 125 460 702 55 - 32
30 – 34 2,765 14 1 229 1,381 138 373 517 69 - 43
35 - 39 2,295 14 3 222 1,199 100 282 402 42 - 31
40 - 44 2,121 10 - 316 1,094 100 245 289 36 - 30
45 - 49 2,394 18 5 512 1,153 107 219 293 39 - 49
50 - 54 2,120 16 2 639 881 91 170 242 42 - 36
55 - 59 1,970 16 2 637 716 80 159 280 32 - 48
60 - 64 1,623 26 - 578 569 84 102 188 34 - 41
65 - 69 1,210 15 1 559 376 52 79 89 18 - 22
70 - 74 813 22 1 466 178 25 33 51 11 - 26
75 -79 527 17 5 322 116 2 13 31 3 - 18
80+ 669 46 1 425 108 14 16 27 10 - 23 Source: CSO Population and Housing Census, 2011
A look at the highest qualification attained by Arima’s population showed that some 42.3 percent of
those 15 years or older had no qualifications. This group would also include some persons who may
not have written examinations to receive certification. Table 2.6 shows that 3.2 percent indicated that
their highest qualification attained was school leaving certificate, with another 1.6 percent reporting
None; 1.0% Nursery Kinder-Garden; 2.9%
Primary; 25.1%
Secondary; 39.9%
Post Secondary; 3.5%
Tertiary/ Non University; 8.1%
Tertiary/ University;
11.8%
Other; 1.4%
Not Applicable; 4.7% Not Stated; 1.7%

22
that they attained Caribbean Secondary Education Certificate (CSEC) Basic as their highest
qualification.
Approximately one fifth of the population (19%) attained General Certificate of Education (GCE)
Ordinary (‘O’) level/CSEC General or Caribbean Advanced Proficiency Examinations (CAPE)/GCE
‘A’ Levels as their highest educational, while 10.5 percent were granted Diplomas, Associate
Degrees or Equivalent Certification. Another 5.9 percent would have achieved either a Bachelor’s
degree, Postgraduate Diploma/ Professional Qualification or a Master’s degree. Some 0.2 percent of
the population 15 years and older earned doctorate degrees. More women attained Bachelors,
Masters and professional certification than their male counterparts. This can be seen in Table 2.6.
Table 2.6: Non-Institutional Population of Arima by Age Group and Highest Educational Attainment
Arima Female Population Male Population
No of Persons
Percentage of Population
No of Persons
Percentage of Population
No of Persons
Percentage of Population
Total 33,404 100.0 16,917 100 16,488 100.0
None 14,130 42% 6,828 40% 7,302 44%
School Leaving Certification
1,072 3% 556 3% 517 3%
CSEC Basic 528 2% 252 1% 277 2%
GCE ‘O’/CSEC Gen/SC 6,047 18% 3,262 19% 2,784 17%
GCE “A”/ CAPE/ HSC 727 2% 395 2% 332 2%
Diploma or Equivalent Certificate of Achievement
2,809 8% 1,500 9% 1,309 8%
Associate Degree Higher Diploma
698 2% 390 2% 307 2%
Bachelor Degree 1,401 4% 780 5% 622 4%
Master Degree 436 1% 246 1% 190 1%
Postgraduate Diploma/ Professional Qualification
149 0% 81 <1% 68 0%
Doctorate 55 0% 27 <1% 27 0%
Other 353 1% 174 1 179 1%
Not Stated 4,998 15% 2,426 14 2,573 16% Source: CSO Population and Housing Census, 2011
About 59 percent of persons in the age groups 20-24 years to 40-44 years had qualifications of
CXC/GCE ‘O’ levels and above. About 63 percent of the population in the 20-24 age grouping had
obtained CXC/GCE “O” level passes, demonstrating higher levels of educational qualification
compared to the older age groups. Further, as much as 29 percent of the population within the age
group of 15-19 years to the 54-59 years reported that they did not have any certification, thereby
placing them in a “low skill trap” where they are not likely to participate in certification programmes
on their own unless motivated to do so.
2.5 Living Conditions in Arima
The United Nations Development Programme (UNDP)/CSO Trinidad and Tobago Human
Development Atlas notes, “Giving people the choice to enjoy a long and healthy life; being educated;
having access to resources that enable one to live in dignity; and being able to participate in
decisions that affect one’s community are core capacities for human development.” The National
Human Development Index (NHDI), developed by CSO is based on Human Development Index

23
(HDI) developed by UNDP and measures the level of human development of Trinidad and Tobago
and its sub-regions, using three basic dimensions of human development – a long and healthy life,
knowledge, and a decent standard of living. Figure 2.6 shows the NHDI for the various regions within
the country. Arima was ranked among the lowest with an NHDI of 0.64. Measurement of the
Inequality-adjusted NHDI (INHDI)4 ranked Arima as the fourth lowest in the country with respect to
human development with a value of 0.573 (Figure 2.7). With regard to the dimensions of health,
education and income for the INHDI, Arima was ranked among the lowest.
Figure 2.6: National Human development Index 2008/2009 by Administrative Regions
Source: Trinidad and Tobago Human Development Profile, 2012
4 Trinidad and Tobago Human Development Profile, 2012. Web site source: http://www.planning.gov.tt/sites/default/files/content/mediacentre/documents/Human_Development_Atlas.pdf.

24
Figure 2.7: Inequality-adjusted National Human development Index 2008/2009 by Administrative Regions
Source: Trinidad and Tobago Human Development Profile, 2012
Table 2.7 presents statistics highlighting living conditions in Arima taken from the Trinidad and
Tobago Human Development Atlas. The Atlas provided information on the NHDI and its dimension
indicators which were disaggregated at the sub-regional level to compare levels and disparities
among different sub-populations within the country. Data from the Atlas highlight the following:
Arima had a slightly lower than average in household income per capita per annum.
Arima, with an education attainment rate of 71.1 percent for both females and males
between the ages of 6 and 16 years, was the second lowest education attainment rate.
However the Borough had one of the highest educational attainment rate (73.6%) for
persons above 17 years and older who have attained secondary level education and higher.
Arima was among the regions that scored the highest in the gender inequality index
indicating that gender inequalities was higher in Arima compared to other regions in the
country.
Arima had a Multidimensional Poverty Index (MPI) comparable to the national MPI.
The Borough was among the regions which had a higher rate of adolescent births.
Arima had a lower female labour force participation rate compared to that for the country
(48%).
Arima recorded a low life expectancy, comparable to the national average of 73.2 years for
both sexes; 70.2 years for males; and 76.5 years for females. However Arima has a
relatively high incidence of chronic diseases of 24.8 percent.

25
Consumption of iodized salt was around average in Arima, indicating that children from the
island were not at risk of iodine deficiency disorder, which in turn can decrease susceptibility
to miscarriages and still births.
The region recorded a lower than average percentage without adequate sanitation facilities,5
with 6.2 percent of its households.6
Table 2.7: Various Statistics on Living Conditions in Arima
Indicators Value
Rank and Rating out of the Country’s 15
Administrative Regions
Total population, 2011 33,606 2nd (low)
National human development index, 2010 0.64 3rd (low)
Population having chronic illnesses7, 2008/2009 (%) 24.8 15th (high)
Primary and secondary educational attainment rate8, 2008/2009 (%) 71.1
14th (high)
Secondary and higher educational attainment rate ages 17 and above, 2008/2009 (%)
73.6 13th (high)
Household income per capita (TTD/USD) 27,636 /5,995 6th (low-medium)
Inequality-adjusted national human development index, 2010 0.573 4th (low-medium)
Gender inequality index, 2010 0.363 11th (medium high)
Adolescent fertility rate9, 2010 59.6 14th (high)
Multidimensional poverty index (MPI), 2006 0.018 9th (medium-high)
Intensity of multidimensional poverty, 2006 (%) 27.8 12th (medium high)
Incidence of multidimensional poverty, 2006 (%) 6.4 9th (medium-high)
Life expectancy at birth, 2010 (years) 73.3 12th (medium-low)
Households in which a child died, 2006 (%) 8.3 13th (medium-high)
Population without electricity, 2006 (%) 0.2 1st (low)
Population access to without clean drinking water, 2006 (%) 0.2 3rd (low)
Population access to without improved sanitation10, 2006 (%) 6.2 10th (medium high)
Households not consuming iodised salt (%) 64.3 9th (medium-high)
Labour force population – male (%) 65.7 15th (high)
Labour force population – female (%) 48 10th (medium-high) Source: Trinidad and Tobago Human Development Profile, 2012
5 Trinidad and Tobago Human Development Profile, 2012. Web site source: http://www.planning.gov.tt/sites/default/files/content/mediacentre/documents/Human_Development_Atlas.pdf. 6 Anecdotal evidence suggests that this situation may have greatly improved over the last eight years. 7 The chronic illnesses include: Heart Disease, Cancer, HIV/AIDS, Lupus, Kidney Disease, Sickle Cell Anemia, Lung Disease, Epilepsy, Neurological Disorder, and Clinical Mental Disease.
8 Primary and secondary educational attainment rate refers to the percentage of children between ages 6-16 who have attained primary or secondary school level of education.
9 Number of birth among women 15-19 years per 1,000 women (CSO: Population, Social and Vital Statistics Division 2010)
10 Population without Access to improved Sanitation Facilities (2006) Population without access to improved sanitation facilities refers to the proportion of the population with sanitation facilities that are not improved or sanitation facilities which are improved but shared with other households (the toilet is shared) (Ministry of Social Development and Family Services, Multiple Indicator Cluster Survey III, 2006). Improved sanitation facilities for excreta disposal are the followings: flush or pour-flush to a piped sewer system, septic tank, or latrine; ventilated improved pit (VIP) latrine and pit latrine with slab.

26
2.6 Crime
The Human Development Atlas acknowledges that “Crime and Violence continues to be one of the
most critical areas that need to be addressed in the context of national development. Economic
growth and meaningful democracy will not be possible unless crime and violence is brought under
control and all citizens can feel safe and secure.”
The Borough of Arima is situated within the Northern Police Division (Figure 2.8). The 2010 Citizen
Security Survey showed that in northern region, compared to all other areas, had the lowest
percentage of victims of crime (28.3%) within the last 10 years and persons reporting that crime was
a problem in their community (52.4%). Twenty two percent of the northern region’s respondents
indicated that there was a gang in their neighbourhood. Residents also did not feel safe and this was
reflected in the survey by a low number of persons who felt very secure (2.6%). However, more than
half of respondents felt fearful in the last year about the possibility of becoming a victim of crime
(59%) and did not have much confidence in the police services for effectively controlling the crime
problem in the country (52.4%).
Figure 2.8: Police Divisions of Trinidad and Tobago
Source: Trinidad and Tobago Human Development Profile, 2012
According to statistics on crime and violence in the various police divisions compiled by the Crime
and Problem Analysis Unit (CAPA) of the Trinidad and Tobago Police Service, the northern police
division had the second highest level of reported serious crime per 100,000 persons in the country. It

27
was less than half the number reported in Port of Spain Division which had the highest reported level
of serious crime (4,800 reports). The serious crimes of major concern included burglaries and break-
ins, general larceny and robberies, with 466.1, 382.1 and 628.9 reported cases per 100,000
persons, respectively (Figure 2.9). With the second highest number of reported cases, it would also
be important to pay particular attention to Larceny- Motor Vehicles (152.8 reported cases).
Figure 2.9: Share of Serious Crimes by the Type of Crime in the Northern Police Division, 2010
Source: Trinidad and Tobago Human Development Profile, 2012
Murder; 2.4%
Woundings and Shootings; 2.4%
Rape Incest, Sexual offences; 2.8%
Serious Indecency; 0.4%
Kidnapping; 0.4%
Burglaries and Breakings; 23.2%
Robberies; 31.3%
Fraud Offences; 0.6%General Larceny; 19.0%Larceny Motor Vehicles, 7.6%
Larceny Dwelling House; 2.9%
Narcotic Offences; 2.9%
Other serious crimes; 4.3%

28
Chapter 3 Arima’s Natural Resources
The Royal chartered Borough of Arima is the only landlocked municipality on the island. Completely
subsumed within the Tunapuna/Piarco Municipality, it is characterised by mostly flat to gently sloping
land.
Flash flooding events have worsened over the years as the built up areas, in and around Arima
proper, densified and expanded. A situation compounded by the impact of flooding in the
surrounding Tunapuna/Piarco region, where hillside development has exacerbated incidences of
erosion and related flooding. In and around the municipality, there is a risk of erosion in areas such
as Calvary Hill, Mount Pleasant, Carib Homes, and Maturita, where Maracas/Matelot series and
Cleaver series are found.
Rich cultural heritage & resources (people & festivals) exist with a small, remaining Carib
community. However, related and necessary tourism assets (accommodation, physical artefacts,
and historical sites) have not been developed within the Borough to support a tourism industry of any
meaningful size. Despite this, the natural resource base of this region’s hinterland holds good
potential for the development of nature and cultural tourism niches.
3.1 Land Use and Resources
Almost all of the land in the municipality is under built development, forest vegetation being confined
largely to the northwestern corner, and agriculture being practised on a small scale in the vicinity of
the Arima River.
The pattern of built development is generally characterised by a concentration of office activities as
well as retail and wholesale trade in the original core; the concentration of industrial activity in the
south western section; the spread of residential development throughout the remainder of the town;
and the scattering of community and institutional uses, protective health and welfare services, and
recreational facilities in the various communities.
Other significant elements of the land use pattern are the location of Princess Royal Park as a major
open space feature in the core of the town; development of commercial strips along certain sections
of O’Meara Road, Tumpuna Road, and Malabar Road; and the prevalence of mixed use sites. Most

29
of the land in the Borough is privately owned, though some squatting is evident with informal
settlements in areas such as Calvary Hill, Jones Town, Malabar, and Printery Ville.11
One of the few municipalities with land holdings, Arima has the potential for very targeted and
directed economic development within its boundaries. In addition, its strategic location in relation to
the airport and ground transportation grid can be harnessed to support greater export business
activity to these neighbouring municipalities.
As a regional centre, there are wholesale and retail establishments, distribution and transportation
services catering to the resident population and the commuter traffic that uses the town as a hub.
Additionally the city centre is used as a transportation hub by the residents and commuters who
pass through the Borough. Many residents and commuters use a park and ride approach to
commuting and park in the limited number of parking spots offered by the Borough while taking the
PTSC buses to go to their destinations12. With such diversified land uses competing for already
constrained land space, very thoughtful and careful decisions must be made with regard to this
limiting but critical resource.
3.2 Fresh Water Resources
The topography of the area is generally flat to gently sloping with most of the land lying between 30
metres and 90 metres above mean sea level. The region is drained by the Arima and Mausica
Rivers. Being bounded entirely by land, the Arima municipality has no coastal or marine resources of
note, although the area itself is naturally well drained by the rivers and their numerous tributaries.
Indiscriminate waste disposal and increased runoff from construction and industrial activities
threaten the quality of these water sources and integrated waste management must be addressed in
a holistic manner to reduce further damage to and strain on them.
Arima is very vulnerable to flash flooding and landslides. Areas along the Mausica and Arima Rivers
are most prone to flooding, while landslide damage has occurred in Jonestown/Mausica Lands,
Mount Pleasant, and elsewhere in the Borough13. Several proposals to address this chronic issue
have been documented in various plans over the years. Lack of dedicated funding, political will and
consistent technical resources have resulted in piece-meal, short-term solutions at best.
11 Arima Municipal Development Plan 2010-2020, MLG 2010.
12 Arima Municipal Investment Plan, MLG 2012.
13 Ibid.

30
Chapter 4 Arima’s Physical and Local Assets
4.1 Physical Infrastructure
4.1.1 Transportation
The town, as a centre for commerce for a number of communities is the confluence at which a
number of roads end. It is also a location along the Eastern Main Road which passes through it, and
the Churchill Roosevelt Highway which traverses its southern boundary and links to communities to
the east. It is also the most eastern point of the Priority Bus Route from Port-of-Spain: the route is a
roadway converted from the abandoned railway line.
The town is fully built out with streets that interlink the various communities of which it is comprised,
and has an identifiable central business district, with a dial which is a major point of reference, along
with the Princess Royal Park which previously hosted a track for horseracing in the town.
4.1.2 Water Supply Distribution
The town is well served with water lines and secures its water supply from the Hollis Reservoir. Most
of the town has access to a potable water supply 24/7 for most of the year. However, many
households maintain water tanks to protect against shortage from intermittence in supply.
4.1.3 Wastewater and Solid Waste Management
A central sewer system provides for wastewater disposal for most of the town, while in other areas,
wastewater is discharged into drains that eventually link to the Arima and Mausica Rivers which are
tributaries of the Caroni River. With the relatively high density of building, and with reasonably high
rainfall, the lower reaches of the town is subject to some flooding and a challenge to storm-water
management.
4.1.4 Information and Communications Technology
As an urban location in developed East-West Corridor of Trinidad, Arima is relatively well served in
respect of telecommunication including radio, internet, cable television and telephone, although
there are pockets with supply deficiencies in the services.

31
4.2 Social/Cultural Infrastructure
4.2.1 Dwelling/Building Stock
The majority of housing units are single-family residences, and some limited flatted accommodation
in the Malabar Housing District. There are a few upper middle-income areas – Sierra Vista, Leotaud
Lands, and Calvary. Nevertheless, there are informal settlements in Jones Town, Malabar and
Printeryville.
The Arima Velodrome, which is a sporting facility, is used also for open-air festival events.
4.3 Industrial Development
The O’Meara Industrial Estate is sited in the south west of the town and consists of 95 hectares, and
is almost fully occupied. The proximity of the estate to the UTT Campus, and the location of Arima
relative to the country’s main airport render it an ideal location for knowledge driven industry with
products that might be readily exported to the rest of the world.
4.4 Social Facilities
4.4.1 Health
There is the Arima District Health Facility at the location where once existed the Arima Hospital. It is
falls under the control of the North Central Health Authority. The residents of the town have been
clamouring for years for a full-fledged hospital.
4.4.2 Education
Facilities for the provision of Primary, Secondary, and Tertiary education are available in the Town.
A campus of the University of Trinidad and Tobago is located in the town and serves a national
clientele.
4.4.3 Disaster Management
As part of its remit, the Arima Borough Council is charged with the responsibility of the development
of a disaster management system for the town guided by the National Disaster Management Policy
and the Ministry of Local Government Disaster Management Policy.
4.4.4 Social Services and Community Development
There is provision for a Regional Social Development Council, which is to serve as an umbrella that
coordinates the delivery of social services being delivered by a number of public agencies and
NGOs in Arima.
4.4.5 Recreation, Sports and Entertainment
Sporting facilities in the area are maintained by the Ministry of Sport and Youth Affairs and facilitated
by its Arima Sub Office. Sporting Facilities in the town include the Arima Velodrome, the Princess
Royal Park and the Larry Gomes Stadium.
32
Chapter 5 The Municipal Economy
This section of the document elaborates on key components of the economy of the Borough of
Arima. The first subsection provides the general review of the economic performance of Trinidad and
Tobago while other subsections highlight the economic drivers in the town and the issues faced in
their performance and operations.
5.1 Gross Domestic Product of Trinidad and Tobago
The economy of Trinidad and Tobago witnessed reduced growth over the period January to
September 2014 of 0.7 percent, which followed on a period of sustained expansion of 2.1 percent in
the fourth quarter of 2013 - see Table 5.1 below. An unanticipated decline in the performance of the
energy sector during the first two quarters of 2014 was the largest factor contributing to the sluggish
growth observed. Nevertheless, this was largely offset by continued growth in the non-energy sector
for the same period. Increased production in petrochemicals and natural gas in the third quarter
resulted in an expansion of the energy sector of 2.8 percent subsequent to the previous two quarters
of decline. This third quarter expansion could be attributed to growth of 3.6 percent observed in
natural gas production when compared with the same period in 2013 when large-scale maintenance
activity occasioned a reduction of 4.6 percent.
The momentum in fourth quarter non-energy sector growth in 2013 of 1.9 percent was sustained into
the first three quarters of 2014 where an average growth rate of 2.2 percent was observed. The
continued growth resulted largely due to strong activity in the finance, distribution and construction
sectors. Substantial increases in local cement sales precipitated average growth rate of 3.1 percent
observed in the construction sector over the first three quarters of 2014.
Robust activity in the construction sector was reflective of numerous continuing large-scale public
sector developments including but not limited to the Port at Point Galeota, the National Aquatic
Centre, the Children’s Hospital, and the Point Fortin Highway. Greater production of materials
required for construction as well as cement caused the growth observed in manufacturing sector
growth of 1.2 percent. New car sales drove the growth observed in the distribution sector while
resilient activity in commercial banking stimulated financial sector growth of 3.2 percent. At the
national level, agriculture grow on average by 3.5 percent for the first three quarters of 2014.
The third quarter of also 2014 witnessed increased inflationary pressures following comparative calm
over the three preceding quarters. Inflationary pressures were propelled largely by prices of food and

33
greater spending by consumers as demonstrated by precipitous growth in new car sales, robust
growth in consumer lending and notable increases in government spending. Headline inflation by the
third quarter of 2014 increased from 3.4 percent for the first two quarters to roughly 8.0 percent by
the end of the third quarter of 2014.
Food price inflation for the third quarter rose to 18.2 percent up from an average of 4.4 percent over
the preceding two quarters of 2014. Increases in the prices of vegetables, fruit and other food
products were the primary contributing factors. Furthermore, the most recent official estimates on the
labour force have indicated that unemployment is at a historic low of 3.1 percent for the first quarter
of 2014. Robust labour force participation and increasing job creation have resulted in the
improvement in the unemployment rate when compared to the rate of 3.7 percent observed in 2013.
Increases in employment were most notable among personal services, social services and
community services. To a lesser extent, increased labour force participation was observed in the
agriculture, water and electricity and manufacturing sectors.
Table 5.1: Trinidad and Tobago Selected Economic Indicators
2009 2010 2011 2012 2013
Jan- Sep-14
Real GDP Growth (%) (2000 = 100)14 -3.4 -0.3 -1.2 0.3 2.1 0.7
Energy Sector 1.3 1.8 -3.7 -1.9 0.2 -1.5
Non-Energy Sector -6.6 -1.8 0.6 1.8 3.5 2.2
Agriculture -0.7 -15.7 1.2 -2.4 0.3 3.5
Manufacturing -6.6 0.8 1.7 -1.3 2.6 1.2
Construction -2.5 -5.8 -2.4 -0.9 3 3.1
Financial Services -1.8 2.5 0.9 2.5 4.8 3.2
Inflation Rate (%)15
(period average) 7 10.5 5.1 9.3 5.2 4.6
(end of period) 1.3 13.4 5.3 7.2 5.6 7.8
Unemployment Rate (%)16 5.3 5.9 4.9 5 3.7 3.117
Sources: Central Bank of Trinidad and Tobago, Central Statistical Office and Ministry of Finance
5.2 The Area Economy
5.2.1 Key Economic Drivers (Activities)
Within the Borough of Arima, a wide assortment of business enterprises exists (Table 5.2).
Consistent with that which is observed nationally, enterprises in the Borough were concentrated
largely in the retail and distribution sector (54.59%) and personal services (15.14%) sectors. Size
based differences were observed among prevalent enterprises in the Borough. While retail and
distribution businesses were indeed the most prevalent in the Borough, enterprises in the assembly
type and related industries (25.00%) and construction (18.75%) which accounted for the largest
proportion of enterprises employing 50 or more persons. Other sectors represented by large
enterprises included food and drink processing (15.63%) and the Printing, Publishing and Paper
14 Growth rates are derived from the Central Bank’s Quarterly Index of Gross Domestic Product
15 Changes in the Index of Retail Prices (RPI), January 2003 = 100
16 This represents the average of the four quarters
17 For the period January – March

34
Converters (3.13%). The activities at the O’Meara Industrial Estate would have been a factor in the
contribution of the various sectors.
Table 5.2: Distribution of Registered Businesses by Sector and Size
Sector
Size of Enterprise Grand Total
Micro (1 to 5)
Small (6 to 25)
Medium (26 to 50)
Large (50 and Over)
Branch
Assembly Type and Related Industries 1.34% 2.76% 5.56% 25.00% 0.00% 2.77%
Chemicals and Non-Metallic Minerals 0.67% 8.97% 5.56% 0.00% 0.00% 2.47%
Construction 3.79% 10.34% 16.67% 18.75% 0.00% 5.97%
Distribution 61.47% 44.83% 27.78% 18.75% 53.49% 54.59%
Educational and Cultural Community Services
3.12% 3.45% 0.00% 0.00% 2.33% 2.91%
Finance, Insurance, Real Estate and Business Services
5.57% 5.52% 5.56% 3.13% 34.88% 7.28%
Food Processors and Drink 1.34% 1.38% 11.11% 15.63% 2.33% 2.33%
Hotels and Guest Houses 0.22% 0.00% 0.00% 0.00% 0.00% 0.15%
Miscellaneous Manufacturing 0.67% 2.76% 5.56% 3.13% 2.33% 1.46%
Personal Services 18.93% 11.72% 0.00% 3.13% 2.33% 15.14%
Petroleum and Other Mining Industries 0.45% 0.69% 0.00% 0.00% 0.00% 0.44%
Printing, Publishing and Paper Converters 0.22% 1.38% 5.56% 6.25% 0.00% 0.87%
Textiles, Garments, Footwear, Headwear 0.22% 1.38% 5.56% 3.13% 0.00% 0.73%
Transportation, Communication and Storage
1.78% 2.07% 0.00% 0.00% 2.33% 1.75%
Wood And Related Products 0.22% 2.76% 11.11% 3.13% 0.00% 1.16%
Grand Total 100.00% 100.00% 100.00% 100.00% 100.00% 100.00% Source: Central Statistical Office Business Register 2008
Of the businesses formally registered in Trinidad and Tobago, those operating in the Borough of
Arima accounted for 3.69 percent (Table 5.3). Enterprises were concentrated largely in the Arima
Proper (67%), but were also located in O’Meara (9%), Malabar (8%),Tumpuna Road (4%), and
Maturita (2%).
Table 5.3: Businesses in Operation by Municipality
Borough Proportion
Arima 3.69%
Chaguanas 5.83%
Couva-Tabaquite-Talparo 11.41%
Diego Martin 8.13%
Mayaro/Rio Claro 2.40%
Penal/Debe 5.64%
Point Fortin 1.61%
Port of Spain 19.42%
Princes Town 4.33%
San Fernando 7.54%
San Juan/Laventille 10.75%
Sangre Grande 3.35%
Siparia 4.20%
Tunapuna/Piarco 11.70%
Total 100.00%
Source: Central Statistical Office Business Register 2008

35
Figure 5.1: Registered Business by Community Source: Central Statistical Office Central Statistical Office Business Register 2008
5.2.2 Employment and Unemployment Trends
Figure 5.2 below illustrates the breakdown of employed household heads by employment category.
The majority of household heads (44.0%) were employed in private enterprises, while 22.0 percent
of household heads formed part of the informal sector working as own account workers.
Interestingly, as much as 18.0 percent of household heads were employed with some Central or
Local Government Agency, while 11.0 percent were employed with State Owned Enterprises.
Arima Proper67%
O' Meara9%
Arima 8%
Malabar8%
Tumpuna Road4%
Maturita2% Mt. Pleasant
1%O'Meara
1%
O'Meara Road0%
Calvary HIll0%
Carib Homes
0%
Maturita Village0%

36
Figure 5.2: Employment of Household Heads Source: Central Statistical Office Continuous Sample Survey of the Population 2014
5.2.3 Occupational Groups
The majority of household heads were employed in service and sales positions, and comprised 19.1
percent of the active labour force (Figure 5.3). Other major occupational groups observed within the
Borough included Craft and related trades workers (17.4%), Professionals (15.5%), Elementary
occupations (14.7%), Technicians and Associate Professionals (10.4%) and Plant/Machine
Operators (11.0%). A minority of household heads were employed in managerial positions (6.56%)
and clerical support (4.0%).
Figure 5.3: Distribution of Household Heads by Main Occupational Group
Source: Central Statistical Office Continuous Sample Survey of the Population 2014
Private Enterprise43.9%
Own Account Worker21.5%
Central and Local Government/THA/St
atutory Board18.4%
State Enterprise
11.4%
Governement Work
Programme3.7%
Paid family worker1.1%
2.09%
4.01%
6.56%
10.09%
10.40%
14.71%
15.50%
17.54%
19.10%
Skilled agricultural, forestry and fishery workers
Clerical support workers
Managers
Plant and machine operators, and assemblers
Technicians and associate professionals
Elementary occupations
Professionals
Craft and related trades workers
Service and sales workers

37
5.2.4 Income
Figure 5.4 below illustrates the income earned by household heads from their main job. As much as
46.72 percent of household heads in the Borough reported a gross monthly income from their main
job of TT$ 5,000 or less. Just over a third of household heads earned monthly income in the TT$
5,001 to TT$ 10,000 range. Only a minority of household heads (17.68%) generated monthly income
over TT$ 10,000 from their primary job.
Figure 5.4: Distribution of Household Heads by Gross Monthly Income from Main Job
Source: Central Statistical Office Continuous Sample Survey of the Population 2014
3.50%
12.17%
17.66%
13.39%
8.45%
10.19%
5.08%
4.79%
7.10%
7.18%
1.17%
3.03%
3.03%
1.89%
1.38%
1000-1999
2000-2999
3000-3999
4000-4999
5000-5999
6000-6999
7000-7999
8000-8999
9000-9999
10000-15999
16000-21999
22000-27999
34000-39999
46000-49999
50000 and Over

38
Chapter 6 Profiling the Borough of Arima’s MSME Sector
6.1 Introduction
The development of a vibrant and competitive MSME sector can serve as a key source of
innovation, diversification, productivity and economic growth in Trinidad and Tobago including in the
Borough of Arima. MSMEs tend to mobilise creative energies and identify opportunities that exist,
but which may be ignored by larger enterprises. They can pinpoint and create possibilities for
pushing outward the production frontier of an economy. The flexibility and resilience of MSMEs in
the face of major changes also allow them to adapt more quickly to emerging trends. The Central
Bank of Trinidad and Tobago in 2008/2009 undertook a comprehensive study of the small and
medium sized business in the country, the results of which were presented in the report entitled,
“Developing Viable Small and Medium-Sized Enterprises in Trinidad and Tobago: Challenges and
Priorities - The Structure, Performance and Networks of SMEs18 in Trinidad and Tobago.”
Internationally, there is considerable variation about what constitutes a micro, small or medium-sized
(MSME) enterprise. There are various definitions in the literature which tend to be largely dependent
on the purpose of the study being undertaken at the time, or the use to which the results are to be
put by the particular author(s) or organisations. At the time of the study sponsored by the Central
Bank, there was no national definition on MSMEs. The study acknowledged that businesses tend to
be lumped either into one grouping called the “SME Sector” or further broken down into the
subcategories of “micro, small and medium-sized” enterprises.
The report revealed that the definition then currently in use by the Central Bank of Trinidad and
Tobago (CBTT), the then Business Development Company (BDC) and the Ministry of Labour and
Small Enterprise Development (MOLSED) was based on the Report of the Cabinet-appointed Task
Force on Small and Medium Enterprise Development (June 1995) and this considered three factors:
number of employees, assets and sales (Table 6.1). Because of the limited information available for
SMEs on sales or assets, the Central Bank’s study employed the approach of using “at least” the
number of employees as a guide for placing a firm into one category or another.
18 Small and medium enterprises

39
Table 6.1: Domestic Definition of Micro, Small and Medium-sized Enterprises
Size No. of Employees
TT$ Assets (Excluding Land and Buildings)
TT$ Sales
Micro 1 – 5 < $250,000 < $250,000
Small 6 – 25 > $250,000 - <$1,500,000 > $250,000 - <$5,000,000
Medium 26 – 50 > $1,500,000 - <$5,000,000 > $5,000,000 - <$10,000,000 Source: The Ministry of Labour and Small Enterprise Development quoted in the Report of the Cabinet Appointed Task Force on Small and Medium Enterprise Development (June 1995) as quoted in the report: Developing Viable Small and Medium-Sized Enterprises in Trinidad and Tobago: Challenges and Priorities – The Structure, Performance and Networks of SMEs in Trinidad and Tobago
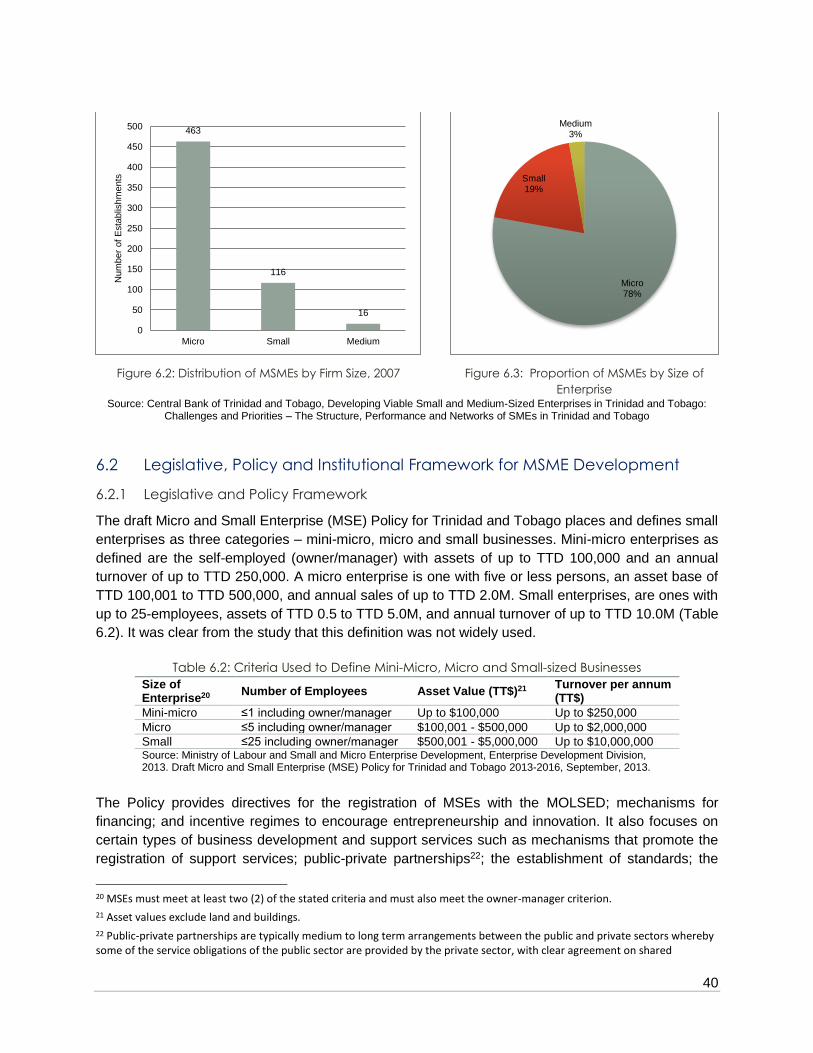
According to the CBTT report, which is based on the CSO’s Business Register, there was a 19.2
percent increase in MSMEs in Arima for the period 2001 to 2007 (Figure 6.1). In 2007, 86 percent of
the businesses were categorised as micro (mini-micro) category (Table 6.2). It is reported that many
of the smaller MSMEs operate in the informal sector.19
Figure 6.1: Changes in the Number of MSMEs, 2001 to 2007 Source: CSO Business Register as quoted in the Central Bank of Trinidad and Tobago Report: Developing Viable Small and Medium-Sized Enterprises in Trinidad and Tobago: Challenges and Priorities – The Structure, Performance and Networks of SMEs in Trinidad and Tobago
19 As quoted in the CBTT SME Report. The 1995 National Baseline Survey defines an informal business as “a small firm with less than five workers (no more than 2 of whom are regular employees), which does not have any licence, permit or certification to operate” (EIM, 1996 p. 89).
0
100
200
300
400
500
600
700
2001 2002 2003 2004 2005 2006 2007
Num
ber
of
MS
ME
s
Year
40
Figure 6.2: Distribution of MSMEs by Firm Size, 2007 Figure 6.3: Proportion of MSMEs by Size of
Enterprise Source: Central Bank of Trinidad and Tobago, Developing Viable Small and Medium-Sized Enterprises in Trinidad and Tobago:
Challenges and Priorities – The Structure, Performance and Networks of SMEs in Trinidad and Tobago
6.2 Legislative, Policy and Institutional Framework for MSME Development
6.2.1 Legislative and Policy Framework
The draft Micro and Small Enterprise (MSE) Policy for Trinidad and Tobago places and defines small
enterprises as three categories – mini-micro, micro and small businesses. Mini-micro enterprises as
defined are the self-employed (owner/manager) with assets of up to TTD 100,000 and an annual
turnover of up to TTD 250,000. A micro enterprise is one with five or less persons, an asset base of
TTD 100,001 to TTD 500,000, and annual sales of up to TTD 2.0M. Small enterprises, are ones with
up to 25-employees, assets of TTD 0.5 to TTD 5.0M, and annual turnover of up to TTD 10.0M (Table
6.2). It was clear from the study that this definition was not widely used.
Table 6.2: Criteria Used to Define Mini-Micro, Micro and Small-sized Businesses
Size of Enterprise20
Number of Employees Asset Value (TT$)21 Turnover per annum (TT$)
Mini-micro ≤1 including owner/manager Up to $100,000 Up to $250,000
Micro ≤5 including owner/manager $100,001 - $500,000 Up to $2,000,000
Small ≤25 including owner/manager $500,001 - $5,000,000 Up to $10,000,000 Source: Ministry of Labour and Small and Micro Enterprise Development, Enterprise Development Division, 2013. Draft Micro and Small Enterprise (MSE) Policy for Trinidad and Tobago 2013-2016, September, 2013.
The Policy provides directives for the registration of MSEs with the MOLSED; mechanisms for
financing; and incentive regimes to encourage entrepreneurship and innovation. It also focuses on
certain types of business development and support services such as mechanisms that promote the
registration of support services; public-private partnerships22; the establishment of standards; the
20 MSEs must meet at least two (2) of the stated criteria and must also meet the owner-manager criterion.
21 Asset values exclude land and buildings.
22 Public-private partnerships are typically medium to long term arrangements between the public and private sectors whereby some of the service obligations of the public sector are provided by the private sector, with clear agreement on shared
463
116
16
0
50
100
150
200
250
300
350
400
450
500
Micro Small Medium
Num
ber
of
Esta
blis
hm
ents
Micro78%
Small19%
Medium3%

41
adoption and development of information and communications technology (ICT) and other
technologies/methods; incorporation of entrepreneurship into curricula of formal education
institutions; and establishment of mentorship networks and the creation of green enterprises. Critical
to these initiatives is having the necessary development of the physical infrastructure to support
growth of the sector.
The Policy also recognises that MSEs and cooperatives can play a major role in social
empowerment, poverty alleviation, and social transformation. To this end, one of the directives of the
Policy is in the area of Social Empowerment and Inclusion which places emphasis on the
participation of women, youth and the disabled in MSE development. The Policy calls for the
creation of women’s business mentoring networks and partnering of MOLSED with ‘groups that
address the particular needs of women entrepreneurs.’ Such networks are seen as a means of
‘measuring the performance of women entrepreneurs and provide a platform for the discussion on
the trends, prospects and challenges encountered by women entrepreneurs in the business
environment.’ Moreover furthering youth enterprise development include actions such as
mainstreaming of youth in the IBIS (National Integrated Business Incubator System), FairShare, and
other existing youth enterprise development programmes and collaborating with existing youth
business stimulation programmes such as Youth Business Trinidad and Tobago (YBTT).
Given Trinidad and Tobago’s drive toward a more sustainable economy, the MOLSED has
developed the Green Enterprise Development Policy for Micro and Small Enterprises and
Cooperatives. One of the strategies recognises and focuses on measures that would create green
MSEs to facilitate and assist greening of specific industries, namely Agriculture, Construction,
Creative Industries and Fashion, Energy, Tourism and Waste management. One of the key
mechanisms proposed in the policy is the establishment of an Enterprise Investment Fund (EIF)
managed by the MOLSED.
There is no small business legislation in Trinidad and Tobago. Instead, MSEs are expected to
register under the Companies Act (Act No. 35 of 1995) and are subjected to its stipulations with
regard to corporate governance and management. However, the MSEs Sector by definition is
comprised of smaller businesses which are more likely to be unincorporated and have a “weak
system of accounting” or an “absence of accounts”. Indeed, informal sector enterprises (which are a
part of the MSE sector) where most women-owned businesses operate are characterised as small
scale in terms of employment, non-registration of enterprises and non-registration of employees.23
objectives for delivery of public infrastructure and/ or public services. Source: The World Bank Group/Public-Private Partnership in Infrastructure Resource Centre, undated. http://ppp.worldbank.org/public-private-partnership/overview/what-are-public-private-partnerships. 23 Non-registration of unincorporated enterprises refers to absence of registration under commercial, tax or social security laws, professional groups' regulatory acts or similar laws or regulations established by national legislative bodies.

42
6.2.2 Institutions and Public Programmes
There is a wide range of State agencies and private sector and non-government organisations which
provide products and services geared to the provision of credit and grant funding of products for
MSME development and expansion; technical and business training, financial literacy training,
mentoring, infrastructural development, information technology (IT), operational support, financing,
and networking to facilitate access to local and foreign market.
While, there are agencies and programmes that focus on MSEs, there are other projects and
programmes with a broader perspective and apply to the wider business community to facilitate
entrepreneurial development.
6.2.2.1 The Ministry of Labour and Small Enterprise Development
The MOLSED oversees the development of the MSE sector through the Enterprise Development
Division (EDD). It is the line Ministry for the National Entrepreneurship Development Company
Limited (NEDCO), which is the main agency for offering training, loans and other business support
for MSEs. Over the past year, through the EDD, the MOLSED has implemented MSE development
programmes and establishing policies to support the sector.
6.2.2.1 Ministry of Trade and Industry
The Ministry of Trade and Industry (MTI) is leading the drive to position Trinidad and Tobago as a
manufacturing base, and the business, trade, and financial hub of the Americas, particularly through
driving the non-energy sectors of the economy. The Ministry focuses on medium and large business
development. The Ministry fulfils this role through the Business Development Directorate aimed at
developing and growing business in Trinidad and Tobago. The Directorate, which comprises three
Units, is responsible for:
Addressing issues that would make the business environment more facilitating and
transparent and oversight for the development of the sectors – Creative Industry, Food and
Beverage, Maritime, Printing and Packaging and Yachting – targeted by Government to
diversify the national economy (the Business Support and Facilitation Unit);
Managing stakeholder relationships and strengthening links with State Agencies which fall
under the purview of the Ministry (the Alliances Unit); and
Issuing licences to the public on items remaining on the import negative list and export
negative list and for implementing import duty concessions through Minister’s licences’ as
well as overseeing suspension of the Common External Tariff and the Safeguard mechanism
under the CARICOM arrangement (the Trade Licence Unit).
6.2.2.3 ExporTT Ltd, Ministry of Trade and Industry
ExporTT limited is the trade policy implementation agency of the MTI. The company was designated
by the Cabinet of the Republic of Trinidad and Tobago to be the sole National Export Facilitation
Organisation of Trinidad and Tobago. Its vision is to be the driving force for the development of an
internationally competitive and vibrant export sector, which contributes significantly to economic
diversification in Trinidad and Tobago. Through its programmes and activities the agency aims to
generate export growth and diversification in the goods and services sectors, to increase in the
43
international competitiveness of local exporters; to develop new exporters across the various sectors
of interest; and to expand to new markets, based on market research.
6.2.2.4 The National Entrepreneurship Development Company Limited
NEDCO was established in 2002 to assist small and micro businesses with regard to the accessing
of loans for business start-up and expansion purposes. Skills, training and financial support for
entrepreneurs are also offered along with business advisory services and information in areas such
as Marketing, Financial Management, Business Planning and Records Management. NEDCO
implements the National Integrated Business Incubation System (IBIS) on behalf of the MOLSED.
There is a NEDCO office located in the Borough. Under its loan portfolio, NEDCO assists a wide
range of businesses and offers loan entry ceiling up to $250,000 for first-time borrowers and up to a
$500,000 for second-time borrowers. However, the loan facility does not make funds available for
primary agriculture, bars, professional services or casinos. NEDCO funding is specifically designed
to assist those who face difficulty in accessing fund from commercial banks or other commercial
lending agencies, and as such, its loan facility is characterised by simple procedures and minimal
collateral requirements.
6.2.2.5 Entrepreneurial Training Institute and Incubation Centre, NEDCO
The Entrepreneurial Training Institute and Incubation Centre (ETIIC) is an institution under NEDCO,
which provides entrepreneurial training, basic support, mentoring, and marketing and distribution
support to MSEs. The institute also offers start-up business support, onsite IT, administrative and
business services as well as office, computer labs and virtual office services. In addition, users can
avail themselves of the reference library services, which have publications covering a range of MSE
development and entrepreneurship topics.
6.2.2.6 Micro-Enterprise Loan Facility, Ministry of Social Development and family Services
The client can also seek the services of the Micro Enterprise Loan (MEL) Facility for accessing
business grants and loans for business starts and expansion. The MEL Facility is a community
empowerment and poverty reduction initiative, which equips Community-based Organisations
(CBOs) to engage actively in promoting sustainable livelihoods among the poor through the
provision of micro loans and support to micro entrepreneurs. A grant is given to CBOs to on-lend to
individuals in their communities. The individuals start new or expand existing micro enterprises and
repay the loans at a minimal interest rate.
This programme aims to contribute to the reduction of poverty by facilitating the creation of
sustainable livelihoods; empower CBOs to discharge micro credit services; and support and promote
entrepreneurship at the community level. This programme is aimed at persons in receipt of public
assistance; persons earning at subsistence level or at the minimum wage; or unemployed persons
who live under impoverished conditions. MEL provides borrowers with community based business
loan services; business training for all interested persons and after-loan services and business
support.

44
6.2.2.7 National Integrated Business Incubation System
Launched in October 2011, the IBIS developed by the MOLSED aims to provide a unique mix of
support mechanisms that assist the growth and success of new and existing MSEs including
technical and business training, mentoring, infrastructural development, IT, operational support,
financing, and networking to facilitate access to local and foreign market. IBIS incubators may be
community-based or commercial. Community-based incubators (CBIs) operate in communities or
regions to address poverty, unemployment and other social concerns. Commercial business
incubators focus upon high-value and/or high volume businesses with export potential. Seven CBIs
have been launched so far out of the 18 incubators planned for the country. Moreover, the
Programme partners with academic and research institutions to develop innovation policies to
proactively attract entrepreneurs to translate their business ideas into reality. A number of business
related entities have signed memorandum of understanding (MOUs) with the IBIS programme
including the Arthur Lok Jack Graduate School of Business (GSB), the University of Trinidad and
Tobago (UTT) and YTPP.
6.2.2.8 Enterprise Investment Fund
The recently established EIF is a project-based mechanism which aims to provide a strengthened
support system for the MSE sector by providing funding to entrepreneurship-support programmes
developed by the private sector, academic institutions and other NGOs so that they can utilise their
expertise to play a greater role in MSE development.
6.2.2.9 Community Development Fund, Ministry of Community Development, Culture and
the Arts
The Community Development Fund (CDF) is a funding source operating out of the Ministry of
Community Development (MCD). The CDF, founded in 1996 by the GORTT under a loan agreement
with the Inter-American Development Bank (IDB), operates as a basket of grant funding products
meant for various forms of poverty alleviation and for promoting community self-sufficiency. Two
products provide funding for projects of three to 18 months’ duration while another seeks partnership
with private sector sponsors. Community business projects are also considered in the CDF model.
Moreover, the model contains a business and social enterprise mentorship element, which has been
able to attract a small pool of approximately 20 mentors.
6.2.2.10 Green Fund, Ministry of Planning and Development
The Green Fund is the National Environmental Fund of Trinidad and Tobago, established under the
Finance Act 2000 through the Miscellaneous Taxes Act. The purpose of the fund is to provide
financial assistance to community groups and organizations to undertake activities and projects
related to reforestation, remediation, environmental education and public awareness of
environmental issues and conservation of the environment. The Green Fund is capitalised through
the Green Fund Levy, which is a tax of 0.01 per cent on the gross sales or receipts of companies
carrying out business in Trinidad and Tobago. The Green Fund Levy is payable quarterly in each
year of income. As at September 30, 2014 the Green Fund stood at $3.57 billion.
6.2.2.11 Innovation Fund, Ministry of Planning and Development
The GORTT has identified a need to provide financial support to entrepreneurs with original
business ideas with the potential to deliver new or improved products and services and address

45
social needs. To this end, the Government has established the Innovation Financing Facility (IFF) to
support investments in projects that have the potential to transform research into economic value. As
part of this initiative, the “Call for Innovations and Inventions” (or i2i) was launched in 2012 as a
competition for innovators and inventors in key economic growth sectors.
6.2.2.12 Research and Development Fund (RDF), ExporTT and Ministry of Trade and Industry
The Research and Development Fund (RDF), managed by ExporTT, is designed to provide support
for research, development and technological innovation at all stages of company development. The
Facility is geared towards enabling companies to progress from undertaking an initial research
project to high-level innovation and Research and Development activity. It serves to encourage the
development of an innovative business culture among local businesses with the aim of increasing
the rate of new product development. As the RDF falls under the purview of the MTI, there is no
specific emphasis on micro and small businesses.
6.2.2.13 FairShare Programme
The FairShare Programme, launched in January 2011 by the MOLSED, is a set-aside programme
that enables SMEs to access opportunities to do work with the Government for contracts valued up
to TTD 1.0M to SMEs. Simultaneously, the FairShare Programme provides some training to MSEs to
improve business management, use of technology and understanding of legal obligations. FairShare
utilises an online platform where Government Ministries post opportunities and where MSEs search
for and bid on those opportunities. However, SMEs can only register with the FairShare programme
for a maximum of six years. The objective of the FairShare Programme is to create independent and
strong MSEs by allowing them to participate in Government spending over a fixed period during
which time they should have increased their capacity, skill, product quality and other capabilities.
Additionally, the FairShare programme:
Is an incentive for formalisation because it is only open to registered MSEs, compliant with
state regulations;
Compiles an online registry of micro and small businesses categorised by economic sector;
Creates a real-time, online listing of all Ministry contracts worth up to a maximum of $1M;
Provides automated notification of opportunities to SMEs for the purpose of bidding
Provides a space for SMEs to market their products and services through online profiles; and
Offers training to SMEs in procurement, business management and other important areas of
relevance to improve their ability to win contracts.
6.2.2.14 Economic Development Board of Trinidad and Tobago, the Ministry of Planning and
Sustainable Development
Established in 2011 and guided by the National Medium Term Policy Framework (MTPF) 2011-2014,
the Economic Development Board of Trinidad and Tobago (EDB) is charged with the responsibility
of developing business clusters and the development of five economic spaces in Trinidad and
Tobago with the aim of achieving economic viability and sustainability in the long term. These
clusters focus on financial services, tourism, food sustainability, downstream energy, creative
industries, maritime and information and communications technology (ICT). It is envisaged that the
development of policy and legislation can occur to structure areas of growth around these identified
clusters. The EDB has also identified five specific economic spaces for kindling economic and social

46
transformation, which are referred to as Growth Poles. The five growth Poles are North East
Tobago, South Western Peninsula, East Port of Spain, North Coast and Central Trinidad.
Concentrating on developing clusters in these areas would lead to rapid growth and development
throughout the country. Growth poles would be the centres of industry investment as well as
enhance job creation opportunities in surrounding communities.
6.2.2.15 Entrepreneurial Training Agencies
Nowadays, having post-secondary and tertiary education is considered essential to improve
entrepreneurship, employability and livelihood opportunities. Many post-secondary and tertiary
institutions such as The University of the West Indies (UWI), the University of Trinidad and Tobago
(UTT), Arthur Lok Jack GSB, UWI-ROYTEC, YTEPP, NEDCO ETIIC, College of Science,
Technology and Applied Arts of Trinidad and Tobago (COSTAATT), etc. all offer various education
and training business programmes provide entrepreneurship education, which focuses mainly on
business development, which generally consists of technical, financial literacy and skills training.
Over the last decade, the Government as well as the private sector and NGO providers have
established a variety of informal and formal technical-vocational education and training (TVET)
programmes aimed at increasing the capacity of the citizenry. The Ministry of Education is the main
Government agency with responsibility for TVET and this responsibility is executed mainly through
YTEPP Limited and Metal Industries Company (MIC) Limited. These programmes also offer some
literacy and life skills training.
Multi Sector Skills Training (MuST) Programme offered by the Ministry is a specialised craft training
Programme designed to develop a cadre of skilled, competent, certified workers in priority sectors of
the economy. The Programme, which uses a “work and learn” model, offers onsite and offsite work-
based Level 1 (six months) and Level 2 (nine months) training in occupational skills, life skills and
functional literacy and numeracy. The programme, which targets 17 to 50 year old citizens, provides
a “second chance” to persons who “missed out” on educational and training earlier in their lives.
6.2.2.16 Private Sector and Non-Government Agencies
Employers’ Consultative Association
This agency seeks to quality representation for employers and to ensure the strength and success of
the Employer Community, which will auger well for the socio-economic well-being of Trinidad and
Tobago. The Employers’ Consultative Association of Trinidad and Tobago (ECA) was formed with
21 firms in 1960 primarily to assist and support Employers in industrial relations matters and to give
them an association that would speak on their behalf on matters of similar interest. Since then, the
ECA has built a strong reputation for handling all issues concerning Employers in Trinidad and
Tobago. Today, the ECA is still a not-for-profit enterprise whose membership grows yearly and
includes companies that belong to a variety of sectors.
Trinidad and Tobago Manufacturers Association
The Trinidad and Tobago Manufacturers Association (TTMF) acts as a representative of the
manufacturing sector in dealing with local and foreign governments and in the monitoring of
legislation affecting manufacturers. Members are provided with information on all local, regional and
international trade related matters of relevance and they act as a liaison between the membership

47
and the Government, specifically the Ministry of Trade, Industry and Investment. Members are
encouraged to maintain and adhere to the required standards and grades of quality in all
manufactured goods and services.
Arima Chamber of Commerce
The Chamber of Commerce’s goal is to further the interests of businesses within the region by
lobbying for favourable policies for their members. Regular dialogues are held with government to
advocate, provide feedback on, and help fine-tune policies and legislation affecting business
practices. Strategic alliances are forged with local and sometimes foreign organisations to establish
and develop mutually beneficial business relationships. The Chamber also provides their members
with efforts to trouble-shoot, address, and solve common problems and issues affecting business
operations. On-going recruitment and sustaining the membership is important to the Chamber’s
growth and development.
Youth Business Trinidad and Tobago
YBTT was established in 2000 and is an accredited member of Youth Business International (YBI),
an international network of youth business programmes. The focus of the NGO is to provide young
persons with opportunities for turning innovative ideas into viable business ventures. YBTT, with the
assistance of the local business community and international donor agencies, provides access to
loans, entrepreneurial training and business mentorship and has provided support for 63
entrepreneurs in 2014 and approximately 500 since its establishment.
Credit Unions and Commercial Banks
Credit unions and commercial banks provide loans, credit and advice to individual MSME operators
who qualify for their facilities.
6.3 Entrepreneurial Development in Trinidad and Tobago
The Annual Global Entrepreneurial Monitoring (GEM) Report for Trinidad and Tobago, prepared by
Arthur Lok Jack GSB, provides information on the perception of the adult general population versus
feedback from support agencies on issues relating to entrepreneurial development in the country.
According to the GEM report for Trinidad and Tobago, the entrepreneurship process begins before
the creation of a business. An individual must recognise an opportunity, assemble the necessary
resources and have positive beliefs about their capability to take advantage of the opportunity and
the likely success of the business. Societal attitudes towards entrepreneurship are considered
important given that negative societal attitudes towards entrepreneurship can result in barriers to
entrepreneurial activity especially during the early stages of entrepreneurship in the areas of social
support, financial and business assistance for entrepreneurs. The Trinidad and Tobago 2014 GEM
Report indicated that the percentage of adults in Trinidad and Tobago who reported being aware of
good opportunities for starting a business in their immediate environment during the next six months
was 58 to 59 percent over the period 2012 to 2014.24 The country ranked fifth highest in Latin
24 Based on the results of the GEM Adult Population Survey (APS).

48
America and the Caribbean and 13th highest out of the 68 economies for which such data were
available.
In addition, perception about ability to operate a business was rated extremely high, while people’s
fear of failure was low when compared with other countries. Data have shown that the percentage of
adults in Trinidad and Tobago who believe that they are capable of operating a business was 75-
76% over the period 2012-2014. The country was rated among the lowest countries with regard to
adult’s perception of Fear of Failure as a deterrent to starting a new business. Trinidad and Tobago
was ranked among the highest countries in the world on the desirability of entrepreneurship as a
career choice (78-80% of the survey respondents for the period 2012-2014).
Despite this positive perspective of the adult population, the 2014 rate of Total Early Stage
Entrepreneurial Activity (TEA)25 for Trinidad and Tobago was 14.6 percent, compared to 19.5
percent in 2013 because of a decline in nascent entrepreneurial activity (from 11.4% in 2013 to 8.5%
in 2014) and a decline in new business ownership (from 8.5% to 7.4%). The results were explained
somewhat by the downward trend in the unemployment rate which fell from 5.0 percent to 3.6
percent over the period 2012 to 2014. This suggests a link between employment/unemployment and
entrepreneurial development and despite the results of the APS, people resort to entrepreneurial
activities when employment opportunities decline. However, the Trinidad and Tobago TEA rate
continues to comprise the highest ratio of opportunity driven activity and the proportion of TEA that is
necessity-driven continues to be among the lowest in Latin America and the Caribbean.26
The survey of the personnel of key support agencies provided expert opinion that can be compared
with the results from the survey of the adult population. Table 6.3 provides their average rating on
key areas, which characterise the entrepreneurial environment in Trinidad and Tobago.
Table 6.3: Ratings for the Main Indicators for Entrepreneurship Framework Conditions
Indicator Rating
(1 in 5 rating)
Finance 2.66
National Policy: General Policy 1.81
National Policy: Regulation 2.38
Government Programmes 2.89
Primary and Secondary Education 1.41
Tertiary Education 3.43
R&D Transfer 2.49
Commercial Infrastructure 3.02
Internal Market Dynamics 2.09
Internal Market Openness 2.40
25 Quoting the Trinidad and Tobago GEM report: In the GEM model, the rate of TEA is a combination of 1) the rate of nascent entrepreneurial activity (entrepreneurs in the process of setting up new businesses), and 2) the rate of new business ownership. In the GEM model a new business is one that is up to three and a half years old.
26 The GEM Report differentiates between people who are pushed into entrepreneurial activity because of unemployment (Necessity-Driven entrepreneurship) and those who enter entrepreneurship by the prospect of opportunity (opportunity driven entrepreneurship).
49
Indicator Rating
(1 in 5 rating)
Physical Infrastructure 3.79
Cultural and Social Norms 2.85
6.4 The Arima MSME Sector (MSMEs Survey, 2015)
The Arima MSME Survey was conducted over the period between April and May 2015 among 120
randomly selected MSMEs operating within the Borough. The definitions used to categorise the size
of the MSMEs were based on the draft Trinidad and Tobago MSE Policy. In conducting the survey,
equal numbers of micro-mini, micro and small entrepreneurs were interviewed. The results of this
survey are presented in the following categories:
General Characteristics;
Size of Enterprise;
Legal Status;
Primary Business Activities;
Employment;
Markets and Annual Sales;
Financing and Investment;
Use of Internet;
Technical Support;
Key Issues Faced MSMEs; and
Impediments to MSME Development.
6.4.1 General Characteristics
Seventy-five female operators and 45 male operators participated in the Arima MSME survey. The
majority of MSME operators were between the age of 35 and 55 years (Figure 6.4), with only 15.8
percent of operators indicating they 35 years old or younger (Table 6.4). There were older male
MSME operators (31.0% over the age of 55 years) compared to their female counterparts (14.5%).
However, there were more young female operators (35 years or less) in Arima (19.4%). The data
suggest a changing age profile, with more women entering the sector.

50
Figure 6.4: Age Breakdown of the Arima MSME Operators
Table 6.4: Age Breakdown of Operators by Sex
Sex
35 Years or Less
36-55 years
More than 55 years
Age not given
Total
%
Female 21.3 52.0 25.3 1.3 100.0
Male 8.9 44.4 46.7 0.0 100.0
Both Sexes 16.7 49.2 33.3 .8 100.0
Globally, there are reportedly more male entrepreneurs compared to female entrepreneurs.
However, this gap is narrowing, with female entrepreneurship becoming increasingly important for
economic growth and poverty alleviation. The trend is similar for Trinidad and Tobago. The Total
TEA rate, which is the percentage of adults (including employed people) who are operating or in the
process of starting a new business, for Trinidad and Tobago show that more men were reported
to be involved than women in early stage entrepreneurship during 2013 to 2010. Compared to
their male counterparts women became business owners at an older age and in many instance it
was usually done as an action of last resort.
6.4.2 Size of Enterprise
Figure 6.5 shows the size breakdown of MSMEs in Arima by sex of the operators. More female
operators can be found in the micro-mini to mini size enterprise category, while the majority of men
operate mini to small businesses.
Less than 35 years16.7%
36-55 years49.2%
More than 55 years33.3%
Age not given0.8%

51
Figure 6.5: Sze Breakdown of MSMEs by Sex of the Operators
The ethnic composition of the MSME community in Arima is less diverse than that of its general
population (Figure 6.6). The majority of MSME operators were of African descent (46.7%), East
Indian (31.7%) and Mixed descent (20.0%) (Figure 6.7). Compared to the general population MSME
operators, there were more operators of African descent.
Figure 6.6: Ethnic Breakdown of MSME Operators
Micro Mini
41.3%
Micro34.7%
Small24.0%
Female Operators
Micro Mini
20.0%
Micro31.1%
Small48.9%
Male Operators
African46.7%
East Indian31.7%
Mixed20.0%
Chinese0.8%
Not stated0.8%

52
Figure 6.7: Ethnic Composition of MSME Operators Compared to the National Population
6.4.3 Legal Status
The survey showed that 45.0 percent of businesses were in early stages of operation, between one
and five years (Figure 6.8), compared to 45.8 percent of all surveyed that were well established (in
operation for more than 10 years) (Table 6.5). There was no appreciable difference in the length of
time the MSMEs were in existence between female operators and male operators (Table 6.6).
Figure 6.8: Length of Time in Operation
Table 6.5: Length of Time in Business by Size of Enterprise
Size of Enterprise
Length of Time in Business
One year or
1-5 years 6-10 years More than 10 years
Not stated Total
African East Indian Mixed ChineseOtherEthnicgroup
Not stated
Borough Population 31.6% 15.5% 45.4% 0.4% 0.7% 6.42%
MSME Operators 46.7% 31.7% 20.0% 0.8% 0.0% 0.8%
0.0%
5.0%
10.0%
15.0%
20.0%
25.0%
30.0%
35.0%
40.0%
45.0%
50.0%
One year or less7.5%
1-5 years45.0%
6-10 years0.0%
More than 10 years45.8%
Not stated1.7%

53
less
%
Micro Mini 7.5 60.0 0.0 32.5 0.0 100.0 Micro 12.5 47.5 0.0 37.5 2.5 100.0 Small 2.5 27.5 0.0 67.5 2.5 100.0 Total 7.5 45.0 0.0 45.8 1.7 100.0
Table 6.6: Length of Time in Business by Sex
Sex
Length of Time in Business
One year or
less 1-5 years 6-10 years
More than 10 years
Not stated Total
%
Male 4.4 40.0 0.0 53.3 2.2 100.0 Female 9.3 48.0 0.0 41.3 1.3 100.0 Total 7.5 45.0 0.0 45.8 1.7 100.0
Registration of businesses is encouraged by support agencies and affords operators the benefit of
State programmes. Non-registration or unincorporated enterprises refers to the absence of
registration under commercial, tax or social security laws, professional groups' regulatory acts or
similar laws or regulations established by national legislative framework. Some 63.3 percent of all
businesses were registered. It should be noted that 40.0 percent of mini-micro-sized enterprises
were registered and therefore operate in the informal sector. While the number of small-sized
enterprises that were registered was more than doubled that of the mini-micro enterprises (85.0%)
(Figure 6.9 and Table 6.7).
Figure 6.9: Proportion of Registered MSME Businesses by Size of Enterprise
Table 6.7: Registration Status of Enterprises by Size of Enterprise
Size of Enterprise
Is Business Registered
Yes No Not stated Total
%
Micro Mini 40.0 52.5 7.5 100.0 Micro 65.0 22.5 12.5 100.0
40.0%
65.0%
85.0%
0.0%
10.0%
20.0%
30.0%
40.0%
50.0%
60.0%
70.0%
80.0%
90.0%
Micro Mini Micro Small

54
Small 85.0 5.0 10.0 100.0 Total 63.3 26.7 10.0 100.0
The data support the findings of the 2007/2008 Central Bank Study on the MSME sector which
noted that the informal sector enterprises (which are a part of the SME sector) are characterised by
their small size (in this case their mini micro size) in terms of employment, non-registration of
enterprises and non-registration of employees, which was said to be substantial.
Figure 6.10 and Table 6.7 show the registration status of the enterprise based on the length of time
that the enterprises were in operation. The older the business, the greater the chance that the
enterprise being registered.
Figure 6.10: Proportion of Registered MSME Businesses by Length of Time in Operation
Table 6.8: Length of Time in Operation by Registration Status of the Enterprise
Length of Time in Operation
Is Business Registered
Yes No Not
stated Total
%
One year or less 33.3 33.3 33.3 100.0 1-5 years 57.4 33.3 9.3 100.0 More than 10 years 74.5 18.2 7.3 100.0 Total 63.3 26.7 10.0 100.0
Though not always conclusive, the following patterns concerning legal status of MSMEs in Arima did
emerge (Tables 6.9 and 6.10):
There was dominance of sole proprietary enterprises in the MSME sector in Arima with 66.7
percent of all businesses in this category. However, the proportion of this type of legal entity
varied depending on the size of enterprise. More micro mini enterprises were operated as
sole proprietors and proportion of businesses in this category decreased as the size of the
enterprise increased.
33.3%
57.4%
74.5%
50.0%
0.0%
10.0%
20.0%
30.0%
40.0%
50.0%
60.0%
70.0%
80.0%
One year or less 1-5 years More than 10 years Not stated

55
A little more than 25 percent and five percent of businesses operated as partnerships and
limited liability company, respectively. More businesses operated as partnerships and limited
liability companies with increased size of enterprise. More than 50 percent of small
enterprises operate as partnerships and 15 percent as limited liability companies.
There did not appear to be any gender difference with regard to legal status of enterprises.
Table 6.9: Legal Status of MSMEs by Sex of Operator
Sex
Legal Status of Business
Sole Proprietor
Partnership Limited Liability
Company Total
%
Male 55.6 35.6 8.9 100.0
Female 73.3 21.3 5.3 100.0
Total 66.7 26.7 6.7 100.0
Table 6.10: Legal Status of MSMEs by Size of Enterprise
Size of Enterprise
Legal Status of Business
Sole Proprietor
Partnership Limited Liability
Company Total
%
Micro Mini 100.0 0.0 0.0 100.0
Micro 67.5 27.5 5.0 100.0
Small 32.5 52.5 15.0 100.0
Total 66.7 26.7 6.7 100.0
6.4.4 Primary Business Activities
The 2007/2008 Central Bank study on MSMEs showed that businesses were operating mainly in the
distribution, construction and finance, insurance and real estate business services sectors, with the
largest number of firms in Distribution. However, in the case of Arima, the survey showed that Non-
retail Services (45.8%) were the primary MSME business activity, followed by Retail and Distribution
(26.7%), and Food and Beverage (20.0%) (Figure 6.11).

56
Figure 6.11: Distribution of MSMEs by Primary Business Activity
The Trinidad and Tobago Central Bank 2009 Study on small and medium enterprises (SMEs)
highlighted the fact that the women business owners usually are usually engaged in business
activities that were more compatible with their domestic and reproductive roles. Consequently, they
choose businesses that are close to home, which allow them to satisfy the competing demand on
their time to engage in housework and childcare.27 The survey results support this general
observation. The findings showed higher proportion of female-owned businesses in the traditional
Food and Beverage sector (24.0%) compared to the male-owned businesses (13.3%). The
proportion of MSMEs by primary business activity is presented in Table 6.11.
Table 6.11: Primary Business Activity of MSMEs by Sex of Operators
Primary Business Activity or Sector
Sex
Female Male Both
Sexes
%
Services (Other than retail)
42.7 51.1 45.8
Retail and Distribution 25.3 28.9 26.7
Food and Beverage 24.0 13.3 20.0
Craft 5.3 2.2 4.2
Primary agriculture 0.0 2.2 .8
Other 1.3 0.0 .8
Not stated 1.3 2.2 1.7
Total 100.0 100.0 100.0
27 Central Bank, 2009. Developing Viable Small and Medium-Sized Enterprises in Trinidad and Tobago: Challenges and Priorities - The Structure, Performance and Networks of SMEs in Trinidad and Tobago. Prepared by Kairi Consultants Limited on behalf of the Central Bank.
Services (Other than retail)45.8%
Retail and Distribution26.7%
Food and Beverage20.0%
Not stated1.7%
Craft4.2%
Primary agriculture0.8%
Other0.8%
Other5.8%

57
The three primary activities remained the same regardless of the size of the enterprise. However,
more the small-sized enterprises were engaged in Retail and Distribution and Food and Beverage
when compared with the micro mini enterprises (Figure 6.12 and Table 6.12).
Figure 6.12: Key Business Activities for MSMEs in Arima by Size of Enterprise
Table 6.12: Primary MSME Business Activity by Size of Enterprise
Primary Business Activity or
Sector
Size Enterprise
Micro Mini Micro Small Total
%
Services (Other than retail) 55.0 45.0 37.5 45.8
Retail and Distribution 22.5 25.0 32.5 26.7
Food and Beverage 12.5 22.5 25.0 20.0
Craft 7.5 2.5 2.5 4.2
Primary agriculture 0.0 2.5 0.0 0.8
Other 0.0 0.0 2.5 0.8
Not stated 2.5 2.5 0.0 1.7
Total 100.0 100.0 100.0 100.0
0.0
10.0
20.0
30.0
40.0
50.0
60.0
Services (Otherthan retail)
Retail andDistribution
Food andBeverage
Craft Primaryagriculture
Other Not stated
Perc
en
tag
e
Micro Mini Micro Small

58
6.4.5 Employment
Table 6.13 shows the average number of persons employed in MSMEs in Arima based on the size
of the enterprise. It was noted that there was no appreciable difference in the number of women
employed by MSMEs compared to men. The average number of persons employed increased with
the size of the enterprise, with small-sized businesses employing three non-family workers on
average. Family labour remained a key source of labour for micro mini and micro enterprises.
Table 6.13: Employment in MSMEs by Size of Enterprise
Size of Enterprise
Micro Mini
Micro Small Total
Mean
No. Female Family Members Employed 1.00 1.10 1.56 1.22
No. Male Family Members Employed 1.00 1.18 1.21 1.17
No. Female Non-family Members Employed - 1.82 3.60 2.87
No. Male Non-family Members Employed - 1.56 3.00 2.72
For most workers, secondary education was their highest educational attainment. However, the
highest educational attainment level of workers increased with the size of the enterprise (Table
6.14). The larger businesses (micro and small enterprises) employed more persons with tertiary level
education. In the case of small enterprises, more than 55 percent of the workers had attained tertiary
level university education.
Table 6.14: Educational Level of MSME Employees by Size of Enterprise
Size of Enterprise
Highest Level Education Attained by Employees Generally
Primary Post
Primary Secondary
Tertiary (non-
university)
Tertiary (university)
Not stated Total
%
Micro Mini 0.0 2.5 0.0 0.0 0.0 97.5 100.0
Micro 5.0 10.0 45.0 2.5 37.5 0.0 100.0
Small 2.5 5.0 32.5 2.5 57.5 0.0 100.0
Total 2.5 5.8 25.8 1.7 31.7 32.5 100.0
6.4.6 Markets and Annual Sales
Most MSMEs (80.8%) produced goods and/or services for the island of Trinidad (Table 6.15). Only a
small percentage operated at a national scale (6.7%). Less than five percent of the respondents
exported their products and services. However, there was some interest in exporting, particularly
among micro and small enterprise operators.
Table 6.15: Primary Markets for Goods and Services by Sex of Enterprise Operator
Size of Enterprise
Primary Market
Local community
Nearest Town/City
All of Trinidad
Trinidad and
Tobago
Not stated
Total
%
Micro Mini 15.0 2.5 80.0 0.0 2.5 100.0
Micro 12.5 2.5 72.5 10.0 2.5 100.0
Small 0.0 0.0 90.0 10.0 0.0 100.0
Total 9.2 1.7 80.8 6.7 1.7 100.0

59
Some 82.5 percent of the total MSMEs surveyed recorded annual sales of less than TT$100,000
(Figure 6.13). On average, more female business operators made less than TT$100,000 than their
male counterparts (Table 6.16).
Figure 6.13: Average Annual Sales (in TT$) for MSMEs in Arima
Table 6.16: Average Annual Sales by Sex of Enterprise Operator
Average Annual Sales of Business
Sex of Operator
Female Male Both
Sexes
%
Less than 100,000 88.0 73.3 82.5
100,001-200,000 4.0 17.8 9.2
200,000-300,000 4.0 4.4 4.2
300,001-400,000 2.7 4.4 3.3
400,000-500,000 1.3 0.0 .8
Total 100.0 100.0 100.0
6.4.7 Financing and Investment
MSMEs require financing for start-up and expansion. The survey indicated most business
enterprises are self-financed or received funding from their families (Table 6.17 and Figure 6.14).
Outside of the family, NEDCO was the next main supplier of financing with 9.2 percent of responses,
followed by credit unions (5.8%). There were no appreciable difference in financing patterns
between businesswomen and businessmen and the scale of business operation.
82.5%
9.2%
4.2%
3.3%
0.8%
0.0% 10.0% 20.0% 30.0% 40.0% 50.0% 60.0% 70.0% 80.0% 90.0%
Less than 100,000
100,001-200,000
200,000-300,000
300,001-400,000
400,000-500,000

60
Figure 6.14: Distribution of Financing Received by MSMEs
Table 6.17: Key Suppliers of Financing to MSMEs in Arima
Source of Funds
Category of Business
Micro Mini Micro Small Total
% % % %
Self/Family 92.5 87.5 82.5 87.5
Credit Union 2.5 5 10 5.8
Commercial Bank 0 0 2.5 0.8
NEDCO 7.5 5 15 9.2
Not stated 0 2.5 5 2.5
Total 100 100 100 100
Interviews with officers from business support agencies have shown that women’s business choices
tended to be in activities that require less experience and require lower start-up capital. This was
supported by the observation that women usually borrow smaller amounts than men do, and while in
some businesses the husbands/male partners represented the “public face” of their businesses, it
was the women who were the actual “business operators.”
Table 6.18 showed the investments in assets made by business operators. One average, 98.3
percent of the respondents invested less than TT$250,000 in their businesses. There were no
appreciable difference in investment patterns between men and women business operators and the
size of operation.
6.4.8 Use of Internet
World Bank statistics showed an internet user28 rate of 65.1 percent for Trinidad and Tobago in
2014. The survey revealed that 19.1 percent of MSMEs in Arima access and use the internet. This
figure is very low and reflects the need for increased training about the importance and use of the
internet in business. There was no appreciable difference in use of the internet between female and
male operators. However, increased use was noted with increased size of business (Figure 6.15).
28 Internet users are people with access to the worldwide network
Self/Family82.7%
Credit Union5.5%
Commercial Bank0.8%
NEDCO8.7%
Not stated2.4%

61
Respondents usually used it to send and receive emails; to access market information and product
information, for social marketing (Facebook) and advertising.
Table 6.18: Internet Users (per 100 people) in Trinidad and Tobago, 2010-2014
Internet Users (per 100 people)
2010 2011 2012 2013 2014
Trinidad and Tobago 48.5 55.2 59.5 63.8 65.1 Source: World Bank IBRD-IDA: http://data.worldbank.org/indicator/IT.NET.USER.P2
Figure 6.15: Routine Use of the Internet by Sex of Enterprise Operator and Size of Enterprise
6.4.9 Technical Support
Technical assistance and training to MSMEs were obtained from a number of sources. However, the
three top sources for MSMEs in Arima were from technical and vocational institutes (16.7%) and the
University (1.7%). The data showed that 40.0 percent of all responses indicated that the
respondents did not receive any technical assistance or training (Table 6.19).
Table 6.19: Key Sources of Technical Support by Sex of Enterprise Operator
Technical Assistance/ Training
Sex
Female Male Both
Sexes
%
University 1.3 2.2 1.7
Technical/Vocational Institute 16.0 17.8 16.7
None 44.0 33.3 40.0
Not Stated 84.0 82.2 83.3
Total 100.0 100.0 100.0
Micro Mini Micro Small Total
Female 6.5% 15.4% 44.4% 18.7%
Male 11.1% 14.3% 27.3% 20.0%
Both Sexes 7.5% 15.0% 35.0% 19.2%
0.0%5.0%
10.0%15.0%20.0%25.0%30.0%35.0%40.0%45.0%50.0%
Female Male Both Sexes

62
Technical assistance and training to MSMEs cover a number of areas (Figure 6.16). The three top
areas that MSMEs had received support were Skills Training (38.8%), Bookkeeping (23.7%), and
Management Training (19.6%).
Figure 6.16: Types of Technical Support Received by MSMEs in Arima
Mentoring is known to play a key role in start-ups and scaling-up existing enterprises. However,
none of the respondents listed mentoring as an area for the support they received.
6.4.10 Key Issues Faced by MSMEs
When MSME respondents were asked to rate the issues they faced (Figure 6.16), the following were
noted:
Access to credit, Market/marketing, Crime, Management Skills and Family Support were the
most challenging issues faced MSMEs in Arima; and
Government Regulations, Business Support Services and Energy Costs were the least
challenging issues.
Skills Training38.8%
Book-Keeping23.7%
Management Training19.6%
Other18.0%

63
Figure 6.17: Issues Rating of Key Issues to MSME Development in Arima
Respondents listed the Environment, Licences and Taxes as the three most critical regulations and
procedures that impede business development.
6.5 Challenges and Opportunities Facing MSMEs
With a view to explore the strengths, weaknesses, challenges and opportunities facing MSMEs,
discussions were held with MSME operators and other sectoral stakeholders. Emerging from these
interactions was the fact that access to finance continues to be one of the most significant
challenges facing MSMEs. Though firms generally thought that there existed sufficient options for
debt and equity financing in the municipality, accessing these financing options was not simple for
MSMEs. Complex procedures, restrictive collateral requirements and high transaction fees generally
acted as a barrier to accessing finance by enterprises of this size. Consequently, entrepreneurs
relied to a substantial extent on personal savings and funds obtained from family members and
friends to establish their businesses. While stakeholders indicated that they had benefitted from the
services offered by NEDCO, the Agricultural Development Bank, and some government ministries,
there was a consensus that greater levels of government incentives and subsidies should be
available for new and growing firms.
Despite FairShare and other public sector programmes that target MSMEs, there remains the belief
that Government policies, particularly those relating to public procurement, consistently favoured
large firms as opposed to micro, small and medium sized firms. It was suggested that the selection
process not only should result in the best firm for the job but also that firms of different sizes should
have equal opportunity in the public procurement process. Stakeholders also believed that policy
should be developed at both the local government and national level to promote and support the
development of micro, small and medium sized enterprises. While taxes and other government
regulations were applied consistently to micro, small, medium and large enterprises, it was generally
0% 10% 20% 30% 40% 50% 60% 70% 80% 90% 100%
Market/Marketing
Crime
Management Skills
Access to Credit
Family Support
Government Regulation
Energy Cost
Business Support Services
Slighty Challenged
Challenged
Very Challenged
Extremely Challenged

64
thought that licensing requirements and government bureaucracy were unduly difficult for growing
and new firms.
In respect of government initiatives to assist MSMEs, it was thought that a wider range of
government programmes should be developed and channeled through a single government
institution. A likely candidate for such an initiative could be NEDCO since it is already well positioned
to provide both financial and technical assistance to new and growing firms. It was also firmly
believed that there should be greater collaboration among public institutions providing services to
MSMEs. Representatives within existing institutions must have relationships with key members of
other institutions to ensure maximisation of the impact of government resources allocated towards
the promotion of the growth and development of MSMEs in the country.
It was accepted that while certain agencies may specialise in the provision of certain services, all
institutions catering to the needs of enterprises of this size must readily be available to assist
MSMEs to find information needed to grow and flourish. The provision of loanable funds was thought
inadequate to contribute to the development and expansion of MSMEs to a stage where they could
indeed be self-sufficient and competitive. Consequently, it was agreed that loans and grants should
be provided along with business support services for firms at this nascent stage of development.
Many MSMEs expressed that finding reliable labour posed a serious challenge to their business.
Even though the national education system ensures free education for persons up to a first degree, it
was firmly believed that teaching at the primary and secondary not only discouraged personal
initiative, self-sufficiency and creativity but also was lacking in explaining the nuances of new firm
creation and entrepreneurship. Entrepreneurs believed that even at the tertiary level, universities,
colleges and technical institutes did not provide sound and adequate preparation for the
establishment and growth of new businesses. Business owners thought that many persons with
degrees may have the knowledge necessary to contribute meaningfully to a business but generally
lacked the soft skills to work well in teams and the practical skills to take what was earned into the
classroom and apply it to their unique working situation.
The national physical infrastructure was thought to be very propitious to the establishment and
growth of new enterprises. Firms were generally satisfied with the state of the roads, utilities,
communications, and waste disposal. For MSMEs, access to communication technology such as the
internet, landlines or cell phones was not deemed to be expensive. Furthermore, there exists ready
access to electricity, fuel and water at very affordable rates to both residents and commercial
enterprises.
Social and cultural norms however were indicated as factors that do have an influence on the size of
the private sector and the profile of enterprises observed throughout the country. While it is believed
that the national culture is indeed supportive of individual success, it is not believed that it places
significant emphasis on personal initiative, autonomy nor self-sufficiency. It is believed the average
person in the country is averse to entrepreneurial risk taking, while the more affluent in society are
encouraged from a very young age to enter into entrepreneurial endeavours.

65
Having the appropriate skills is a valuable tool for MSME start up and development. Stakeholder
agencies noted that often business owners start their businesses with a high level of enthusiasm,
without fully understanding what is required or having the necessary knowledge and skills to
successfully operate a business. There is need for easily comprehensible programmes, which cover
a wide range of topics (e.g. micro and macroeconomics, finance, accounting, marketing, human
resources, etc.) that would make operators competent and give them the confidence to run a
business.
While a range of technical and vocational courses is now widely available to the public stakeholder
agencies spoke about high dropout rates. There has been little research in Trinidad and Tobago to
understand the attitudes of women and men and what motivates them to spend time engaged in
education and training. Moreover, given the high dropout rates observed by some providers, it is
equally important to understand the reasons why participants withdrew from the programmes and
how that influences the entrepreneurial process. Both service providers and stakeholders in low-
income communities spoke of the problem of Illiteracy and innumeracy, which sometimes makes it
difficult for participants to follow and understand the training materials. For some, completing a
business plan can be a futile effort.
MSME owners who have accessed successfully the loans and grants spoke of the need for more
mentoring programmes particularly during the initial start-up period and of having MSME business
networks and fora that they can turn to during difficult times. Such networks are recognised as
critical to businesses operated by women and the vulnerable groups.
Entrepreneurship education should go beyond the business development training now available to
include personal development and entrepreneurial skill development.29 Very few education and
training institutions emphasise or have such programmes available. Beyond the development of the
individual entrepreneur, there is need to focus on the development of society and the “supply side”
for enterprise. It is important to develop awareness and social acceptance of entrepreneurship. The
media can play a crucial role in this regards in delivering positive message about enterprise and
entrepreneurship.
In addition, the Municipal Council should develop programmes and work with schools and
communities in supporting and promoting local economic development and individual, school and
community-led entrepreneurship. The Municipal Council can work directly with business
development institutions (such as YTEPP Ltd, UWI, UTT, Lok Jack Graduate School of Business) in
collaboration with local groups (the Chamber of Commerce, churches, community organisations,
etc.) in developing programmes aimed specially at fostering local entrepreneurial development,
including the development of local entrepreneur networks. It is also important for the Council to set
up areas where reading materials (publications and journals) are available for use to expose locals
to new ideas, materials and methods in their given areas of interest.
29 Personal development involves life skills training to build confidence, motivate progress, strengthen the entrepreneurial mindset and to foster a desire to achieve and inspire action. Entrepreneurial skill development includes training in social skills, networking, creative problem solving, opportunity seeking, selling, interviewing, presentations, group leadership, community co-operation, dealing with bureaucracy, local cultural norms and how they affect business, etc.

66
While the women were aware of some of the agencies involved in supporting business development,
very few during the discussions knew about their various programmes and how to access them. In
few cases, where women did establish businesses, they faced several challenges including the
inability get support in accessing markets and financing. Women spoke of their experience in
preparing business proposals/plans which they felt was a difficult exercise even with the guidance of
a qualified tutor. Though NEDCO has simplified the start-up planning process, this remains an issue
because of lack of awareness and continued poor experiences with the agency. Indeed, some
women acknowledged that they either abandoned the task of opening a business altogether and
opted to start their business without the financing they needed. Another major gap in business
support provisioning identified was the lack of financing facilities for producer cooperatives.

67
Chapter 7 Local Governance in Borough of Arima
7.1 The Prevailing Local Government System
Local government is single-tiered system in both Trinidad and Tobago, with Trinidad divided into 14
municipalities governed city/borough or regional corporations. The Municipal Corporations Act and
the Tobago House of Assembly (THA) Act comprise the principal legislation governing the country’s
local government system. Unlike the THA, the Municipal Corporations in Trinidad is not enshrined in
the Constitution in Trinidad and Tobago. However, the Municipal Corporations Act No. 21 of 1990
provided for the establishment and operation of the Municipal Corporations. Over the years, the Act
has been amended several times, the last amendment being in 2013. This Act, which
granted corporate municipal status to all Local Government bodies in Trinidad, and as amended in
1992 (the Municipal Corporations (Amendment) Act No. 8 of 1992), provided for the two City
Corporations, three Borough Corporations and nine Municipal Corporations. Each Municipal
Corporation is accountable to the Ministry of Local Government which provides oversight and policy
directives.
Under Section 269 of the Municipal Corporations Act 1990, the Minister of Local Government can
give general or specific directions to Municipal Councils in relation to government policy on any
matter. The Minister can also promote effective and equitable partnership between Central and
Local Government in the development of socioeconomic growth, balanced sustainable development
and social welfare; and acts as adjudicator in cases of disputes between Municipal Corporations.
Like the other 13 Municipal Councils in Trinidad, the Act gives powers to the Arima Borough Council,
which acts through the Chief Executive Officer (CEO), Senior Officers and Staff of the Borough
Corporation. The Borough Council, which comprises seven councillors and four aldermen, is
responsible for a range of key functions within its municipal jurisdiction, from the development and
maintenance of selected roads, bridges, footways, drains, public buildings and structures, the
maintenance of markets, slaughterhouses, pastures, commons, recreation grounds or public
cemeteries and recreational grounds; the distribution of truck-borne water; solid waste collection;
public health, to municipal policing.
The Ministry’s key functions as it relates to the Corporations include the oversight of finances from
Central Government; monitoring and evaluation, adjudication; technical services in regards to
engineering and project management; drafting legislation that affects local government; and
developing policy directives. Each year, the Corporation prepares and submits capital expenditure
68
estimates and an income and expenditure budget to the Ministry of Local Government and the
Ministry of Finance for approval.
7.2 Local Government Reform
The Government of the Republic Trinidad and Tobago (GORTT) has promoted in recent years, the
idea of devolution through the development of growth poles and the alignment between national
priorities and regional priorities within the 14 local government jurisdictions and the House of
Assembly in Tobago, as well as with the 585 communities identified throughout Trinidad and
Tobago. In its Medium Term Framework, the Government pledged to transform “Local Government
Services through the devolution of authority from Ministries to ensure increased efficiency.”30
The mission of the 2009 Local Government Reform programme was to facilitate the transformation
and modernisation of local communities by empowering citizens to participate in the decision making
process. To achieve the mission, six key focal areas were identified: Municipal Management,
Economic Development, Social Services, and Environmental Management and Resilient
Communities.
The reformation process called for a number of measures to be implemented including:
1) A new Local Government Legislation that would introduce an Executive Council System and
mechanisms for greater citizen engagement and participation in the decision making process;
2) The rationalisation of Local Government and Central Administrative boundaries through the
reduction of the number of Local Government Bodies, physical alterations to exiting
boundaries and the creation of Central Administrative Districts;
3) Corporate restructuring of the ministry of local government and municipal corporations;
Human resource development and institutional restructuring;
4) Introduction of local area regional planning and development;
5) Improvements in the information communication technology and communications; improved
waste resource management, and disaster preparedness and management;
6) Strengthening of municipal/community policing system; and
7) Development and establishment of standards and monitoring and evaluation mechanisms.
The draft White Paper on Local Government Transformation and Modernisation, prepared in 2013,
identified a number of critical issues and recommendations, similar to the earlier 2009 white paper,
to transform and modernise the Local Government system. The new Local Government system to
be established must exhibit the core features:
It must be people focussed aimed at addressing the needs and aspirations of communities
and ensuring their involvement in policy development, decision making and operations of
their Municipal Corporation.
30 Ministry of Planning and the Economy, 2011, Medium-Term Policy Framework 2011-2014, Government of Trinidad and Tobago, pg. 19.

69
Good Governance systems and structures must be established that would promote
accountability, transparency, responsiveness, equity and value for money expended.
Increased use of Information Communication Technology that would allow residents to
access information and services online.
Participatory planning and development must be institutionalised in order to pursue
development in accordance with the views, aspirations and support of communities.
Emphasis to be placed on municipal policing security and the development of community
capacity for peace, social cohesion and civil existence.
Modern organisational and structures, systems, mechanisms and business processes to be
instituted to improve managerial efficiency and effectiveness.31
In moving forward toward this new local government system, a number of strengths in the current
system have been identified that can be built upon to create better system that improves delivery,
accessibility and sustainability of public goods and services to burgesses. However, several
weaknesses must be addressed to achieve this new local government system (Box 7.1).
Box 7.1: Strengths and Weaknesses in the Current Local Government System
STRENGTHS WEAKNESSES
Local infrastructure and services have been developed over the years and communities have been involved in a number of projects;
Communities have a contact or point person (Councillors and Chairmen) to whom they can voice their concerns;
It brings government closer to the people; Some burdens and responsibilities have been lifted from Central Government, the responsibility for managing affairs and development have been placed at the local level;
Citizens have gained greater access to public goods and services; and
Some level of employment relief has been created at the community level.
The legislative framework is inflexible and not adaptable to change;
Strict bureaucratic structure; no political and administrative authority given to local authorities;
duplication of services; Lack of funding for State mandates and regulations; Inadequate human resource, accounting, auditing, fleet, asset, project and performance management systems;
Non-existent quality control measures; Lack of cohesion, planning and economic development at the local level;
Conflicting goals between national and local needs for budgeting;
Lack of Information Communication Technology platform which hinders effective instantaneous communication;
Community participation and involvement are limited; No sustainability in the delivery and access to public goods and services at the local level;
Officials tend to be part-time and turn over quickly, usually due to a lack of incentives to remain;
Inadequate training; Lack of vision and strategic thinking by councils; Lack of passion by Councillors in fulfilling their mandates; Very slow rates of implementation; Non-existence of LED programmes to facilitate self-sufficiency;
Constant conflict and lack of trust between Council and Administrative Staff; and
Inertia in dealing with customer complaints. Source: Ministry of Local Government, 2013. Draft White Paper on Local Government Transformation and Modernisation
31 Ministry of Local Government, 2013. Draft White Paper on Local Government Transformation and Modernisation; 89pp.

70
7.3 Local Economic Development and Local Government
Local Economic Development is one of the most recent efforts to enhance the developmental role of
Local Governments. It is a critical avenue for empowering local authorities to implement projects
aimed at poverty reduction and increasing individual and household incomes. It provides
opportunities for local governments, the private sector, civil society and communities to establish
partnerships to mobilise and manage locally and externally accessible resources to stimulate the
municipal economy. LED recognises the competitive advantage of a given area and in this case,
Arima.
The 2013 White Paper promotes the LED as a means to facilitate and stimulate economic
development at the community, sub-regional and municipal levels geared at employment generation,
self-employment and MSME creation and the coordination of sectoral development. The
recommendation is for the establishment of Local Economic Development Units (LEDU) within each
Municipal Corporation, led by an Economist. A Municipal Stakeholder Advisory Council (SAC) is
proposed also to guide the work of the Unit. Arima Borough Council is expected to prepare and
implement a three-year Strategic Plan and Action Plan aimed stimulating LED in the municipality.
The Paper also proposes the establishment of a LED fund to facilitate public private partnership
(PPP) ventures.
Local economic development in Arima is closely linked to the proposals and strategies made in its
Municipal Development Plan (MDP). This plan, prepared in 2010 represents the expressed views of
burgesses. An investment plan was prepared in 2011/2012 as a means of implementation of its
MDP. Municipal Councils were expected to choose one or two projects from the MDP and an
investment plan prepared. This investment plan was expected to be revised and updated annually
and financing sought for proposed development projects through the annual budget and other
means.
The Arima Urban Regeneration Action (AURA) Project was chosen by the Arima Borough Council as
the initial project to be implemented. The Project, which sought to upgrade and revitalise the urban
areas of the Arima Borough, would be conducted over a three-year period. First phase of the project
involved the following activities:
1. The identification of privately owned vacant lots and development of off-street car parking lots
by their property owners with the assistance of the Corporation. The objective was to provide
300 car park spaces over a three-year period with an annual target of 100 spaces over the
three years of the project.
2. The establishment of a night market in which registered local food vendors could temporarily
set up food stalls during specific nights and on weekends to sell approved food items.
Appropriate infrastructure and landscaping would be provided including the provision of
lighting, electricity, potable water and garbage disposal for use by the vendors.
3. The provision of an additional public convenience for burgesses and visitors to the Borough.
71
The additional two phases involved the following:
The introduction of measures to reduce traffic in the town centre;
The establishment of Public/Private Partnerships to provide more car parking spaces;
The provision of additional public convenience within the town centre;
Completion of a Queen Street Revitalisation Study and the implementation of a Queen Street
Revitalisation Project;
Completion of the Arima Market Feasibility Study and implementation of a Market Upgrade
project; and
The provision of an around the town bus shuttle service.
This AURA project has not been completed. There has been no review or updating of the MDP and
the investment plan thus far since their initial development.
7.4 Caribbean Local Economic Development Programme
CARILED has been inspired by the experience of the Federation of Canadian Municipalities. The
Federation is the “national voice” representing the vast majority of the municipal population of
Canada. The membership includes Canada’s largest cities, small urban and rural communities and
19 municipal associations and has been functioning since 1901.32 The Federation is thus steeped in
the philosophy of federalism and in the advocacy of deep involvement of people in the planning and
premised on a participatory process involving communities, civil society organisations and the
private sector in partnership with local governance authorities or local government.
CARILED Initiatives in the Caribbean have involved:
1. Helping communities establish and manage committees of government, private sector and
community representatives to lead local economic development.
2. Increasing the capacity of local governments (and decentralised agencies of central
governments) to facilitate private-sector growth in a sustainable and equitable manner.
3. Strengthening the ability of local government officials to engage civil society in local
economic development planning and implementation.
4. Collaborating with business support organisations and educational institutions to provide
training to micro, small- and medium-sized enterprises.
5. Funding pilot LED projects with the potential to show how local governments, the private
sector and communities can work together to create jobs, increase micro-, small- and
medium-sized enterprise revenues, and bring economic and social benefits to communities
6. Working with national governments, local government associations and regional
organisations to replicate good practices and successful LED models, and institute policy
reforms to support LED.
32 http://www.fcm.ca/home.htm

72
The partnerships provide for the harnessing of local resources, encouragement of investment and
the stimulation of local commercial activities including the involvement of micro, small and medium-
sized enterprises. The experience is that local commercial activities contribute to job creation,
business development and improved quality of life for citizens.33
Adoption of CARILED represents signalling of decentralisation and further devolution in economic
planning and more particularly in implementation in the Trinidad and Tobago context, will require
further changes in the existing legislation in the Act establishing the Municipal Council and Regional
Authorities.
33 http://cariled.org/about-led/definitions/

73
Chapter 8 Recommendations for Local Economic Development
8.1 Targeted Sectors
The Medium Term Framework and comparable policy approaches of the political administrations
over the years, support the goal of economic diversification and the principle of social equity across
the various groups that comprise the society. More recently, participatory modes with devolution and
decentralisation of decision-making have been enunciated by the national government, and
commitments expressed to support an expanded role for the Councils of Municipal Corporations in
respect of the development of economy of their respective municipalities. In effect then, the first
order of business is the acceptance by the Borough Council of its development mandate in respect
of enterprise in the Borough. This reorientation of its remit has to be formally recognised in the work
of the Council and in the preparation of its annual budgets and strategic planning process.
Secondly, there is need to coordinate the efforts of the range of agencies that exist and contribute to
the development of enterprise in the country and to the enterprise in the Borough in particular.
Thirdly, there is need to recognise that as a major commercial centre in the east of the island, the
stakeholder enterprises will include organisations that enter the borough to conduct business, as
well as those that develop from among the citizenry of Arima serving particular communities in
Arima, or the wider clientele that seek goods and services in the Borough or are part of the national
or even international market place.
There are possibilities to be realised through initiative of the Borough Council working closely with
the key agencies of the National Government in the promotion of business and enterprise in Arima.
Some of these specialised agencies have been identified in Chapter 6 and include:
MOLSED – NEDCO, ETIIC, IBIS, FairShare, and EIF programmes;
MTI – ExportTT, RDF;
Ministry of the Social Development and Family Services – MEL;
Ministry of Community Development, Culture and the Arts – CDF;
Ministry of the Planning and Development – Green Fund, Innovation Fund;
Arthur Lok Jack Graduate School of Business;
CARIRI; and
Education, Research and Development insitutions – UWI, UTT, MIC, MuST, and YTEPP.

74
There are also private sector agencies and NGOs engaged in the area of promotion of enterprise. All
of these agencies are involved in the provision of assistance to individuals and enterprises, which
comprise MSMEs. A critical component in the development of business and enterprise in the
Borough will involve the training and extension services that are needed by new entrepreneurs and
especially by those who come from a non-business culture, and may also have major educational
deficiencies.
Given the Borough’s credentials as the accepted home base of the First Peoples of Trinidad, and
given its distinction as a Royal Borough established in commemoration of the 50th year of reign of
Queen Victoria, the Council should exploit place name designation for products produced in the
Borough. Its Eco-cultural ascription can be useful in the labelling of products made in Arima. The
Council will need to enlist the collaboration of MSMEs and such institutions as the Arima Chamber of
Commerce as well as the firms on the industrial estate in creating a profile and establishing “Made in
Arima” in product differentiation across the board.
Focused investment around the Spatial Plan for Arima and the Medium Term Framework of the
country can lead to expansion of the economy of the Borough. Some of the specific activities about
which there is convergence between the National Medium Term Framework and the Spatial Plan for
the Borough are identified in what follows.
8.1.1 Food Sustainability
The Borough has very little by way of agricultural potential within its precincts. However, it is a centre
for a number of communities in neighbouring municipalities that are heavily involved in agriculture.
This allows provides the possibility for enterprises that engage in processing of produce. There are
already larger processing operations, for example, National Canners Ltd (NCL). However, there are
much smaller scale operations that might emerge and can be encouraged, assuming that the
required training can be provided to enterprises at this level. The establishment of small scale and
medium scale agro-processing operations in the Borough will allow Arima enterprise to become
interposed in a value chain to final consumers in Trinidad and Tobago and in respect of some
products, consumers in the rest of the world. The Council will need to enlist the services of CARIRI
to ensure that the food processing observe the appropriate standards, thereby guaranteeing
widening of markets.
8.1.2 Eco-culltural Tourism
The place that Arima can occupy in the Eco-cultural tourism market place stems from its own
amenities – home of the First Peoples, but also because it is the gateway to some of the idyllic sites
in the Northern Range of Trinidad. The famous Asa Wright Nature Centre is located to the north of
Arima as well as Brasso Seco and Lalaja, which are sites of beauty and tranquillity. Accommodation
in Arima offers a tourist modern comforts before and after exploring these sites.
There are a number of opportunities that will arise from the promotion of the tourism sector in and in
the environs of the Borough. There are incentives that have been provided by the Government for
the establishment of both small and medium to large guest facilities – from guesthouses and hotels

75
of less than 50 rooms to larger operations of over 50 rooms. The Municipality is likely to enjoy a
respectable niche in international tourism in the years ahead. There are a number of income earning
opportunities that will arise from the tourism sector directly and by way of personal care services.
There are the craft goods of the Carib community in particular. There also restaurants and tour
guiding services.
8.1.3 Cultural Expression
Besides its significance in the mainstream culture of Trinidad and Tobago and the cultural
expression thereof in all of its diversity, Arima is distinctive because of the surviving and reviving
First People’s presence and because of the influence of the Venezuelan peones that came to work
on the cocoa estates in Arima and the surrounding agricultural communities. The former are
celebrated in the Santa Rosa religious festival and the latter in the Parang Competition which marks
a high point of, and is synonymous with Christmas in Trinidad.
The Borough has produced many a Calypsonian, the most venerated being Lord Kitchener, and its
steelbands have been in winners’ row at the major competitions. There is Borough Day and other
festivals which can become, with proper marketing, not only a showcase for talent, but also
opportunities for its artistes to secure a base for sustained income as performers both at home and
abroad.
The cultural tradition and artistic skills of the people will provide considerable material to be reflected
in craft products, as a complement to the tourism industry in the area, and can carry a place name
designation that differentiates it from other craft goods including imported craft products from Asia.
8.1.4 Commerce and Distribution
Commerce and distribution will expand with any heightening of economic activity in the Borough,
given its attractiveness as a commercial centre for expanding communities and housing estates in
the environs of Arima. Commerce and Distribution are sectors, which, because of relative ease of
entry, attract considerable numbers of micro entrepreneurs. The result is often a particular sequel of
excess supply as many seek to copy the success of first entrants.
With oversupply, some find themselves in debt since their businesses which might have appeared
attractive at first blush, end up in many sharing work from among the same level of clients. The
Council is already saddled with the task of securing accommodation for itinerant pedlars, who crowd
the main thoroughfares, and storefront of formal businesses. The allocation of licences to operate
can be the mechanism to prevent oversupply in the respective communities of the borough. One
important subsector of this area is Food and Beverage and local restauranting. With the increase in
visitors to the municipality, there is the possibility for promoting local cuisine.
Support for the development and expansion of commercial and distributional activities will require
interventions on the part of agencies involved in the provision of credit and training in
entrepreneurship, micro and small business development, but will need to be tempered with
constant review of levels of involvement to protect the municipality and some of the potential

76
entrepreneurs from losses because of oversupply in sectors that might appear to be easy in terms of
market entry.
8.2 Proposed Projects and Implementation Plan
Local government reform will require Arima Borough Corporation to play a greater and more
proactive role in securing better economic and social outcomes within the Borough. Leading and
supporting LED in Arima provides a major strategy through which the Corporation can take charge
and influence socioeconomic development within its jurisdiction. Preparation of the Arima LAEP is a
first step in directing investment for business and community development within the Borough.
Further work is now needed to build the appropriate structures and enabling environment and to
undertake initiatives that will provide sustainable local economic growth and development and
support the expansion the local MSME sector.
1. Establishing an Arima Borough Local Economic Development Group - This Group,
which should operate under the auspices of the Arima Borough Corporation, should provide
a municipal platform for facilitating and supporting local economic growth and development.
The following key functions of the Group should be as follows:
a. To listen and interact with stakeholders;
b. To identify and tackle the challenges to local business and economic development;
c. To recommend new initiatives and investments (to be implemented by the Municipal
Corporation, Central Government Agencies and others) that would improve the local
business environment, foster innovation and strengthen the municipal economy; and
d. To provide guidance on the use of Corporation’s resources to achieve the goals of
Municipal LED.
The Group should meet regularly (monthly or at least quarterly) and should comprise of:
Councillors/Aldermen;
Representatives of the private sector (inclusive of a MSME representative); the NGO
and community sector;
Research institutions (such as UWI, UTT, CARIRI, etc.); and
Public sector support agencies relevant to business development (such as NEDCO
and the Cooperative Division), and Evolving TeKnologies and Enterprise
Development Company (e TecK) respect of the O’Meara Industrial Estate.
2. Strengthening the capacity of the Arima Borough Corporation to facilitate local
business and economic development - The aim here is to have an effective and efficient
support mechanism within the Corporation which facilitates in the building of a business
environment within the Borough that actively promotes investment and MSME growth.
This unit should consist of LEDO and an Assistant LEDO. They should be seen as the
nucleus of industrial, commercial and business development within the municipality. The
LEDO should be charged with the following responsibilities to:

77
Facilitate LED planning in order to identify and establish business and development
economic opportunities;
Collaborate with stakeholders inside and outside of the municipality in engaging in
scenario planning and identifying possibilities for local resource use and mobilisation that
might otherwise remain untapped. The LEDO should be instrumental in organising and
recording discussions between the Borough Council and MSME and institutional
stakeholders within their jurisdiction.
Work with local businesses, organisations, schools, and communities in supporting and
promoting LED and individual, school and community-led entrepreneurship;
Identify opportunities that will allow the Corporation and its stakeholders to develop the
local MSME sector, programmes and projects;
Identify and secure funding for MSME and LED initiatives;
Assist local organisations, communities, businesses and individuals to develop project
proposals and business plans for financing; and
Assist with communities and businesses to establish business groups and other support
networks, including working closely with stakeholders in the informal economy in and
around urban areas.
3. Preparing a comprehensive local economic development strategy and action plan –
One of the efforts in supporting municipal LED, is the formulation of an LED strategy and
action plan for the municipality. The preparation of this strategy should be the responsibility
of the LEDO. This strategy and action plan should be tailored to the needs of the Borough
and provide a comprehensive LED agenda which identifies potential areas where the
Corporation and its partners can focus investment to ensure the creation of an appropriate
enabling environment that will support the work of organisations, businesses, communities
and individuals. The strategy should also provide the necessary baseline information to be
used for monitoring and strategic LED decision-making.
4. Developing a database of municipal entrepreneurs (of all sizes) – This should be
developed based on the sector within which they operate. This will serve well not only in
terms of the conduct of research activities but will also be required for collaborative and
promotional partnership activities. The Corporation should actively encourage informal
MSME business owners to register with the Corporation to ensure that all can access
benefits from future business programming. The LEDO should be charged with the
responsibility for developing and regularly updating of the databases, and maintaining
contact with the local MSM businesses.
5. Establishing Strategic Partnerships with the Tunapuna/Piarco Regional Corporation –
Arima is surrounded by Municipality of Tunapuna/Piarco and many burgesses of
Tunapuna/Piarco access services in Arima. In addition, the two municipalities share a
number of common biophysical and socioeconomic attributes. Therefore, it would be
worthwhile for these two Local Governments to pursue a partnership to collaborate in joint
economic opportunities, particularly in the areas of industrial development, with special
regard to the allocation of space for spin-off business start-ups with links to neighbouring
universities.

78
6. Establishing a Municipal Business Support Programme for MSMEs – In order for this
programme to be successful, there must be cooperation between the Corporation and the
various national business support service providers. The approach here is not to duplicate
the efforts of MSME support agencies, but rather to bridge the current gap between existing
and potential business operators and business support service providers. The goal would be
to provide a one-stop-shop platform within the Borough for the services required by existing
and potential operators. This focal point would provide insights into access to finance and
markets, entrepreneurial skill development, training (soft and technical skills), and mentoring
and coaching by liaising closely with the respective service providers and creating an
environment where operators can readily access these services. Through this Programme, a
mechanism must be created for supporting the various sectoral projects to be implemented.
Therefore, given its aim to lead local economic and business development in the Arima, the
Corporation should approach and work with the various service providers to seek their
assistance in establishing this one-stop-shop mechanism. For example, the platform can be:
The main source for accessing information on business support services offered by
the various providers. Several Municipal Corporations should collaborate in
developing an app that would provide information and facilitate clients’ more timely
access to services.
Locate suitable spaces for the conduct of specific business training programmes as
identified in the LAEP study that would facilitate the increase use of the Internet in
business and foster personal growth.
Provide access to mentoring services through the establishment of local business
support networks, business associations and business support cooperatives. A lack
of business mentorship and business advisory programmes was highlighted by
MSMEs as a major barrier to the survival of businesses.
Facilitate business cluster development and establishment industry and marketing
cooperatives as vehicles for achieving critical mass in specific sectors.
Offer business Incubator support services - the MOLSED and NEDCO should use
the Municipal Programme to expand the reach of the IBIS, ETIIC and Women in
Business programmes.
Special attention must be paid to the findings of the study with regards to the challenges
faced by women and youth in setting up and operating their own business. The object would
be to put mechanisms in place that would eliminate any barriers to women’s and youth’s
entrepreneurship.

79
7. The Arima MDP and this study provide proposals for LED in the Borough. Proposed sector
initiatives for local business and economic development that can be further explored
include the following. The strategic planning exercise, the next step in the LED process,
provides an opportunity for identifying and reaching agreement on increasing local economic
development in the regions:
Expanding Arima’s Entrepreneurial Opportunities
With their expanding role to lead the process of LED in Arima, the Borough Corporation
therefore must find ways to expand economic and business opportunity for Arima residents.
Increased business activity in the Borough would create jobs, improve livelihoods; build the
human capital base; enables technology transfer; spur infrastructural development; build
institutional capacity; provide opportunity for inter-firm and inter-sectoral linkages; and
increase government tax revenue. Each of these contributions can have a multiplier effect on
development within Arima.
The approach here should be to develop an inclusive model for the programme that
encourages the participation of Arima residents including the poor, women and youths. The
Corporation in collaboration with the Tunapuna/Piarco Regional Corporation should engage
TVET institutions, tertiary education and research institutions, the Government Ministries
with responsibilities for Small Enterprise Development, Education, and Community
Development, NEDCO, other business support service providers, and local NGOS and
CBOs, in developing two programmes.
Tapping into TVET Skills Banks
Arima residents participate in the many TVET programmes (in hospitality, masonry,
carpentry, plumbing, welding and industrial craft) available in Arima and elsewhere. This
provides an opportunity for the Borough Corporation to collaborate and work with MuST
programme, YTEPP, MIC; NEDCO through its ETIIC and Women in Business programme,
local NGOs and CBOs, and others in identifying interested qualified individuals who are
about to graduate or have recently graduated to enter an enterprise development
programme geared at the development of skilled business operators and businesses. It is
recommended that such a programme, which could span a 12-month to 15 month period,
should provide qualified individuals the opportunity for personnel growth, business training,
financing and targeted business support and resources for start-up and pre-start-up
businesses. The objective at the end of this business training and start-up period is to
graduate both the skilled business operators and their individual businesses. Follow-up
mentorship and other support services should be provided through the Arima Business
Support Programme. There should also be special windows to support women and men
setting up non-traditional and innovative businesses.

80
From Technological Ideas to Businesses
Programmes such as Start-Up Weekend and i2i programme highlight the creativity of
Trinidad and Tobago in generating innovative business ideas. R&D programmes in UWI,
UTT, COSTAATT, CARIRI, IOB and private tertiary education institutions represent a
untapped source for high-tech and innovative business ideas and for technological
advancement of the society.
One way of ensuring that technology created at local institutions is fully explored is to create
the mechanisms to facilitate the commercialisation of technology and to foster the creation of
companies to commercialise them. Arima can benefit from the presence of most of the
country’s tertiary education and research institutions in the neighbouring Municipality of
Tunapuna/Piarco and its own industrial park in O’meara which is close to UTT Arima
Campus. Though Arima is a high-tech area, this represents an opportunity for the Borough
Corporation to link with the UTT campus within its borders and other higher education
institutions in creating a dedicated space within the O’meara Industrial Park geared at the
commercialisation of technology generated from research at the campus. It may be important
to specifically tap into the UTT’s Master of Science Programme in Industrial Innovation,
Entrepreneurship and Management (MSc IIEM).
The Corporation should also tap into i2i programme and Start Up Weekend by working
closely and encouraging new businesses to be located within Arima and offering support
through its Business Support Programme. It would also be important to collaborate with the
Tunapuna/Piarco Regional Corporation and Tamana InTech Park on this venture. When
completed, the InTech Park, as the largest Science and Technology Eco-business Park in
the Caribbean, would be the centre of innovation, technology and global entrepreneurship.
Turning Arima Eco-cultural Resources into Business Opportunities
The Arima MDP proposes a number of projects all geared at taking advantage of the
Borough’s cultural resources, namely:
Re-development of the old textile mill site as a cultural centre for the arts to highlight the
various cultural expressions comprising Arima’s multicultural heritage. The Centre will
also house:
o A public library;
o A Museum of the Living Cultures of Arima highlights the cultural distinctiveness
of Arima;
o A Biological Museum which will document traditional knowledge and practices in
the use of medicinal plants.
An inventory of sites, structures and artefacts of cultural and historical significance as
part of a cultural heritage restoration and preservation project.
The development of 10-hectare First Peoples Village in close proximity to Calvary Hill
which celebrates and highlights their way of life.
The greening and transformation of O’meara Park in an eco-industrial estate.

81
The Corporation must take the lead in bringing together the special interest groups, industry
stakeholders and business support service providers to create organisational mechanisms
that would create spin-off MSMEs that would showcase the historical and cultural resources
of Arima and environs and see the expansion of Arima’s eco-cultural industry.
The following Section is the proposed implementation plan for LED in Borough of Arima.

82
8.3 Arima LED Implementation Plan
Project Activities Implementing Agencies
Collaborating agencies
Time Frame Resources Requirement
Priority Rating (1-2)
Establishment of a Arima Borough Local Economic Development Group
Develop scope, responsibility, function and reporting procedures of the Group.
Identify the prospective agencies/individuals to comprise the Group.
Prepare and issue invitations to prospective Group members/agencies.
Hold inaugural meeting and orientation session.
Hold regular/monthly meetings.
Monitor and provide advice on on-going LED programmes and projects
Arima Borough Corporation (Borough Council) Arima Chamber of Commerce
o Ministry of Agriculture o Ministry of Tourism
Economic Development Board
o NEDCO o TTInvest, o ExporTT Cooperative
Division o Ministry of Local
Government o Local NGO/CBO
representative o CARILED Project o UTT
4 months to establishment and ongoing
Representatives who are decision makers in their organisations
1
Strengthening the capacity of the Arima Borough Corporation to facilitate local business and economic development
Recruit the LEDO
Establish a Chairman’s Advisory Subcommittee to oversee the establishment of the LEDU, comprised of two other Councillors, and the CEO with the LEDO as Secretary.
Prepare requisite documentation for establishing the LEDU - rationale for its establishment, resources requirement (staffing, furniture, equipment, software, training, etc.); and estimated cost.
Obtain the necessary approvals for establishment of the Unit.
Recruit additional staff and procure the necessary resources
Officially establish the LEDU.
Arima Borough Corporation
o Ministry of Local Government
o Ministry of Public Administration
o CARILED Project
12 Months Ministry of Public Administration and Consulting Services to assist the Council in developing a business oriented focus to support the emergence of businesses in the area. Provision for appointment of a LEDO, an Assistant LEDO and supporting staff – Statistical Assistant and Clerk/Typist
1

83
8.3 Arima LED Implementation Plan
Project Activities Implementing Agencies
Collaborating agencies
Time Frame Resources Requirement
Priority Rating (1-2)
Preparing a comprehensive strategy and action plan for the Borough of Arima
Hold Arima LED workshop on way forward and the LED and MSME creation.
Hold consultations with specific industry stakeholders to elaborate strategies and actions agreed on at the workshop
Prepare a local economic development strategy and action plan in collaboration with relevant stakeholders. This plan should include cost estimates, funding sources and mechanism for continuous monitoring and evaluation.
ABC-LEDU Arima Borough Local Economic Development Group
o Chamber of Commerce of Arima
o Local business owners
o Local communities
6 months Consultancy – Arima Borough LED Strategy and Action Plan
Establishing an Arima Business Establishments Database
Hold discussion with the CSO, NEDCO and other relevant agencies on the establishment of the database.
Identify resource requirement for database.
Acquire software and other support tools.
Determine the type of information to be recorded in the database - business owner name and contact details for communications, gender of owner; type of business; years in operation; size of business/number of employees, etc.
Advertise and encourage business owners to register with the Corporation.
Undertake initiatives to actively register businesses.
Develop a profile of local businesses by sector which can
SGRC LEDU/LEDO
o CSO o Chamber of
Commerce of Arima o NEDCO o Ministry of Labour and
Small Enterprise Development
3 months to establish database and ongoing
Computer Spreadsheet or database software Clerk Campaign to encourage business registration
1

84
8.3 Arima LED Implementation Plan
Project Activities Implementing Agencies
Collaborating agencies
Time Frame Resources Requirement
Priority Rating (1-2)
help understand local business owners’ needs.
Update profiles regularly based on additional information received.
Establishing Strategic partnership with the Tunapuna/Piarco Regional Corporation
Hold discussions with Chairman and CEOs of Tunapuna/Piarco Regional Corporation
Identify and reach agreement on areas for collaboration and support and resource requirements
Undertake agreed joint activities
Monitor and evaluate partnerships biyearly
Arima Borough Council
o Tunapuna/Piarco Regional Corporation
6 months and ongoing
Chairmen and CEOs of the Corporations Meeting place
1
Establishing a Municipal Business Support Programme for MSMEs
Hold meetings with key business support service providers to discuss service provisioning and areas of collaboration between ABC and service providers.
Reach agreement on the ABC one-stop service model for MSMEs to be used (e.g. ABC as a MSME information and advisory hub, provide space where service providers offer selected services, etc.).
Develop MSME services app to provide information on service provisioning and places to existing and potential MSME clients.
Launch Arima Borough MSME Support Programme.
ABC-LEDU o Chamber of Commerce of Arima
o Established local businesses
o NEDCO o Ministry of Labour and
Small Enterprise Development including the Cooperative Division
o Ministry with responsibility for development of medium-sized enterprises
o Local Banks o ADB o IOB
9 months to establish and on-going
Cooperation of central government, NGO and private sector service providers For development of the app - Graphic designer Copy writer Software developer Service provision – brochures, factsheet and information on product and services for small businesses
1
TVET Skills to Business
Hold discussion with the Ministry of Education, TVET institutions and business support service providers to discuss programme – assess
ABC-LEDU eTECK
o Ministry of Education o MOLSED o NEDCO o Ministry of Planning
36 months Consultancy – to design and prepare plan of action for the implementation of

85
8.3 Arima LED Implementation Plan
Project Activities Implementing Agencies
Collaborating agencies
Time Frame Resources Requirement
Priority Rating (1-2)
willingness to implement the programme and reach agreement on programme structure, organisation and management.
Hold discussion with local Chamber of Commerce, civil society organisation, and select individuals on the implementation of the programme to build MSM entrepreneurship in Arima
Design programme and prepare an action plan for implementation of the programme in collaboration with industry stakeholders including vision and objectives, key milestones, proposed actions, timelines, responsibilities, mechanism for quality control; cost estimates; skills and human resource requirements, mechanism for regular monitoring and evaluation, etc.
Obtain necessary approval at the Central Government level for implementation of the programme;
Develop a plan how the programme will be marketed.
Develop a financial plan (including the identification of local and external funding sources).
Prepare proposals and applications for external funding of projects.
UTT
and Development o Ministry of Community
Development, Culture and the Arts
o Local NGOs/CBOs o Local businesses
the programme, including marketing and financial plans Training facilities Business training tutors and instructors Business support services
From Technological Ideas to Businesses
Hold discussion with UTT O’meara campus, eTECK, Ministry of Trade and Industry, business support service providers and others to discuss programme – assess
ABC-LEDU TVET institutions
o Ministry of Local Government
o MOLSED o NEDCO o Ministry of Trade and
36 months Consultancy – to design programme and prepare plan of action for the implementation of

86
8.3 Arima LED Implementation Plan
Project Activities Implementing Agencies
Collaborating agencies
Time Frame Resources Requirement
Priority Rating (1-2)
willingness to participate and support programme.
If considered viable and there is willingness to support the programme, reach agreement on programme structure, organisation and management.
Hold discussion with tenants of O’meara Industrial Estate local Chamber of Commerce, civil society organisation, and select individuals on the design and implementation of the programme to build MSM entrepreneurship in Arima
Design and prepare plan of action for implementation of the programme in collaboration with industry stakeholders programmes, objectives and targets, key milestones, proposed actions, timelines, responsibilities, mechanism for quality control; cost estimates; skills and human resource requirements, mechanism for regular monitoring and evaluation, etc.
Obtain necessary approval at the Central Government level;
Develop a plan how the programme will be marketed.
Develop a financial plan (including the identification of local and external funding sources).
Prepare proposals and applications for external funding of projects.
Industry o Ministry of Planning
and Development o Local NGOs/CBOs o Local businesses
the programme, including marketing and financial plans Space in O’meara Industrial Estate Business support services External Funding

87
8.3 Arima LED Implementation Plan
Project Activities Implementing Agencies
Collaborating agencies
Time Frame Resources Requirement
Priority Rating (1-2)
Arima Eco-cultural Industry Business Development
Identify and target eco-industrial stakeholders
Hold discussion with industry stakeholders, special interest groups, Chamber of Commerce, civil society, business support service providers and others to conceptualise how the Eco-cultural industry in Arima should be developed – assess stakeholders’ willingness to be part of such a programme and reach agreement on key concepts, structure, organisation and management.
Hold discussion with business support service providers including public sector agencies, private sector, the banking sector, international development agencies, etc. would support such an initiative in the Borough.
Design and prepare action plan for implementation of the programme for development of the eco-industry in Arima in collaboration with industry stakeholders including vision and objectives, key actions, key milestones, proposed actions, timelines, responsibilities, mechanism for quality control; cost estimates; skills and human resource requirements, mechanism for regular monitoring and evaluation, etc.
Seek necessary approval at the Central Government level;
Develop a plan how the programme
ABC-LEDU
o Santa Rosa First People’s Community
o National Parang Association
o Religious Bodies and Organisations such as – Roman Catholic Church, the Council of Orisha Elders of Trinidad and Tobago, etc.
o Cultural Groups o Ministry of Community
Development, Culture and the Arts
o MOLSED o NEDCO o Ministry of Planning
and Development o Local NGOs/CBOs o Local businesses
36 months Consultancy – to design and prepare plan of action for the implementation of the programme, including marketing and financial plans Training facilities Business training tutors and instructors Business support services

88
8.3 Arima LED Implementation Plan
Project Activities Implementing Agencies
Collaborating agencies
Time Frame Resources Requirement
Priority Rating (1-2)
will be marketed.
Develop a financial plan (including the identification of local and external funding sources).
Prepare proposals and applications for external funding of projects.

89
8.4 Conclusion
Decentralised Governance: The adoption of the CARILED Model involves a widening and
deepening of decentralisation and devolution in the governance structure of the country. The
Municipal Corporations are at the epicentre of this process. The authorities and the elected
representatives of residents in municipalities have to embrace responsibilities that will extend to the
economic development within the municipalities.
Business Facilitation: There is evidence that the country does not lack agencies that are formally
entrusted with the responsibility for the facilitation of business and enterprise and for the provision of
such supports as credit supply and training. However, lack of coordination constrains their
effectiveness. In the context of the CARILED Model, the authorities in Municipal Corporations will
have the responsibility for coordinating and enlisting the services of these agencies, and parlaying
their support for residents in municipalities as they seek to create productive activity within the
economic space of the municipality.
Competitiveness: Economic production except in respect of commerce and distribution at the local
level has to be set in the context of the demand and supply for goods and services in the nation at
large and even in the wider context of regional and international demand.
In other words, entrepreneurs even in micro-enterprises in Arima are players on the world stage.
Their products have to compete in the national economy and, given the elimination of trade barriers
over the years, MSMEs face competition from imports from the rest of the region and the world. A
garment factory in Arima producing school uniforms cannot be oblivious of competitors from near
and far. The development of the competitive mind-set is critical and the Council has to enlist the
support of agencies that can help inculcate the necessary paradigm shift.
Structuring Economic Equity: Social processes in the municipality as in the country at large often
create conditions for differential and segmented participation of the various groups in the area of
business and enterprise. On the grounds of social equity, there will be need to ensure that state
involvement in the provision of support for business and enterprise does not contribute to the
creation of structural barriers and marginalisation of non-traditional participants in business and
enterprise. Imbalances that reflect fault lines of ethnicity or gender need to be monitored to avoid
reinforcement with public funding.
Information, Training and Educational Upgrading: The Census Data and the survey data
collected in the course of this exercise establish the human capital challenge in the municipality. This
imposes a constraint on the capacity of residents in the establishment of viable business and
productive enterprises. There is need to institutionalise a support system that would allow residents
and more so in the poorer communities to embrace technology, access information, and, most
importantly, initiate themselves on the path of lifelong education and upgrading such that they can
correct for previous marginalisation in the education system.
Resuscitation of Industry at the O’Meara Industrial Estate: There is evidence that a number of
the firms on the industrial estate have slipped into retailing and wholesale distribution and away from

90
the production of goods. Given the proximity of the international airport and the presence of a
campus of UTT in close proximity and, as well, the Main Campus of UWI less than half hour away, it
behoves the Council to seek to promote activities at the estate that involve the application of high
level technology and higher level technical personnel in the production of goods for which there
might be demand. The convergence of the proximity of the international airport, of high-level
personnel being trained at UTT and UWI, and an industrial estate represent an opportunity for Arima
to become involved in high quality product development on the basis of which markets in the rest of
the world can be targeted with good returns to the municipality. The enterprises that might be
involved might well be SMEs, with the available tertiary graduates as the key personnel. A
perceptive and entrepreneurial Council will be able to achieve such a breakthrough, thus proving
that as a Council, they can match up with the competing local government agencies in San Jose in
Costa Rica, Tel Aviv in Israel, or in Gauteng in South Africa.
A Borough Council committed to the task of developing the MSMEs of the municipality can
contribute to the economic development of Arima as a dynamic town in Trinidad sensitive of itself as
a special space with an interesting history, and capable of discovering and exploiting markets
abroad based on the ingenuity, knowledge and skills of the people, indirectly correcting for any
remaining effects of the injustice perpetrated in Columbus’s initial contact with the First Peoples
whose descendants are in Arima.