Embed Size (px)
Citation preview
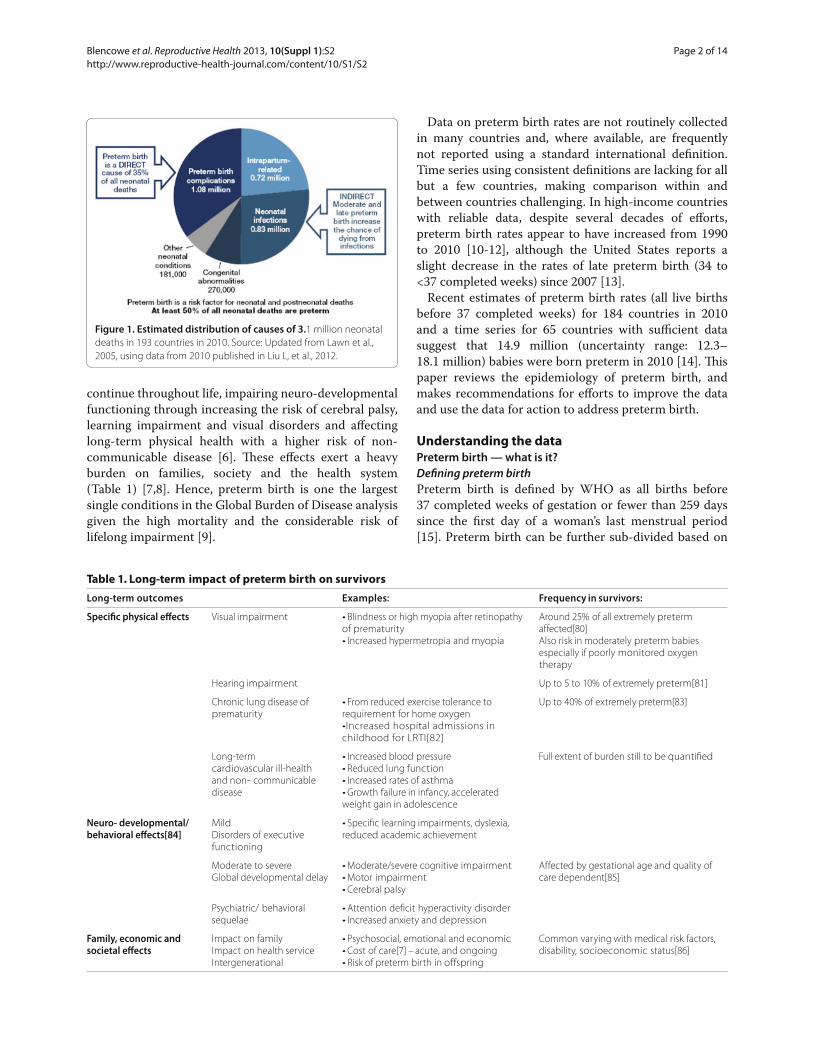
Why focus on preterm birth?Preterm birth is a major cause of death and a signifi cant cause of long-term loss of human potential amongst survivors all around the world. Complications of preterm birth are the single largest direct cause of neonatal deaths, responsible for 35% of the world’s 3.1 million deaths a year, and the second most common cause of
under-5 deaths after pneumonia (Figure 1). In almost all high- and middle-income countries of the world, preterm birth is the leading cause of child death [1]. Being born preterm also increases a baby’s risk of dying due to other causes, especially from neonatal infections [2] with preterm birth estimated to be a risk factor in at least 50% of all neonatal deaths [3].
Addressing preterm birth is essential for accelerating progress towards Millennium Development Goal 4 [4,5]. In addition to its signifi cant contribution to mortality, the eff ect of preterm birth amongst some survivors may
AbstractThis second paper in the Born Too Soon supplement presents a review of the epidemiology of preterm birth, and its burden globally, including priorities for action to improve the data. Worldwide an estimated 11.1% of all livebirths in 2010 were born preterm (14.9 million babies born before 37 weeks of gestation), with preterm birth rates increasing in most countries with reliable trend data. Direct complications of preterm birth account for one million deaths each year, and preterm birth is a risk factor in over 50% of all neonatal deaths. In addition, preterm birth can result in a range of long-term complications in survivors, with the frequency and severity of adverse outcomes rising with decreasing gestational age and decreasing quality of care. The economic costs of preterm birth are large in terms of immediate neonatal intensive care, ongoing long-term complex health needs, as well as lost economic productivity. Preterm birth is a syndrome with a variety of causes and underlying factors usually divided into spontaneous and provider-initiated preterm births. Consistent recording of all pregnancy outcomes, including stillbirths, and standard application of preterm defi nitions is important in all settings to advance both the understanding and the monitoring of trends. Context specifi c innovative solutions to prevent preterm birth and hence reduce preterm birth rates all around the world are urgently needed. Strengthened data systems are required to adequately track trends in preterm birth rates and program eff ectiveness. These eff orts must be coupled with action now to implement improved antenatal, obstetric and newborn care to increase survival and reduce disability amongst those born too soon.
Declaration This article is part of a supplement jointly funded by Save the Children’s Saving Newborn Lives programme through a grant from The Bill & Melinda Gates Foundation and March of Dimes Foundation and published in collaboration with the Partnership for Maternal, Newborn and Child Health and the World Health Organization (WHO). The original article was published in PDF format in the WHO Report “Born Too Soon: the global action report on preterm birth” (ISBN 978 92 4 150343 30), which involved collaboration from more than 50 organizations. The article has been reformatted for journal publication and has undergone peer review according to Reproductive Health’s standard process for supplements and may feature some variations in content when compared to the original report. This co-publication makes the article available to the community in a full-text format.
Keywords Preterm birth, epidemiology, neonatal mortality
Born Too Soon: The global epidemiology of 15 million preterm birthsHannah Blencowe1, Simon Cousens1, Doris Chou2, Mikkel Oestergaard2, Lale Say2, Ann-Beth Moller2, Mary Kinney3 and Joy Lawn1* on behalf of the Born Too Soon Preterm Birth Action Group (see acknowledgement for full list)
R E V I E W Open Access
*Corresponding author: [email protected] School of Hygiene and Tropical Medicine, London, UKFull list of author information is available at the end of the article
© 2013 Blencowe et al; licensee BioMed Central Ltd. This is an Open Access article distributed under the terms of the Creative Commons Attribution License (http://creativecommons.org/licenses/by/2.0), which permits unrestricted use, distribution, and reproduction in any medium, provided the original work is properly cited.
Blencowe et al. Reproductive Health 2013, 10(Suppl 1):S2http://www.reproductive-health-journal.com/content/10/S1/S2
continue throughout life, impairing neuro-developmental functioning through increasing the risk of cerebral palsy, learning impairment and visual disorders and aff ecting long-term physical health with a higher risk of non-communicable disease [6]. Th ese eff ects exert a heavy burden on families, society and the health system (Table 1) [7,8]. Hence, preterm birth is one the largest single conditions in the Global Burden of Disease analysis given the high mortality and the considerable risk of lifelong impairment [9].
Data on preterm birth rates are not routinely collected in many countries and, where available, are frequently not reported using a standard international defi nition. Time series using consistent defi nitions are lacking for all but a few countries, making comparison within and between countries challenging. In high-income countries with reliable data, despite several decades of eff orts, preterm birth rates appear to have increased from 1990 to 2010 [10-12], although the United States reports a slight decrease in the rates of late preterm birth (34 to <37 completed weeks) since 2007 [13].
Recent estimates of preterm birth rates (all live births before 37 completed weeks) for 184 countries in 2010 and a time series for 65 countries with suffi cient data suggest that 14.9 million (uncertainty range: 12.3–18.1 million) babies were born preterm in 2010 [14]. Th is paper reviews the epidemiology of preterm birth, and makes recommendations for eff orts to improve the data and use the data for action to address preterm birth.
Understanding the dataPreterm birth — what is it?Defi ning preterm birthPreterm birth is defi ned by WHO as all births before 37 completed weeks of gestation or fewer than 259 days since the fi rst day of a woman’s last menstrual period [15]. Preterm birth can be further sub-divided based on
Figure 1. Estimated distribution of causes of 3.1 million neonatal deaths in 193 countries in 2010. Source: Updated from Lawn et al., 2005, using data from 2010 published in Liu L, et al., 2012.
Table 1. Long-term impact of preterm birth on survivors
Long-term outcomes Examples: Frequency in survivors:
Specifi c physical eff ects Visual impairment • Blindness or high myopia after retinopathy Around 25% of all extremely preterm of prematurity affected[80] • Increased hypermetropia and myopia Also risk in moderately preterm babies especially if poorly monitored oxygen therapy
Hearing impairment Up to 5 to 10% of extremely preterm[81]
Chronic lung disease of • From reduced exercise tolerance to Up to 40% of extremely preterm[83] prematurity requirement for home oxygen •Increased hospital admissions in childhood for LRTI[82]
Long-term • Increased blood pressure Full extent of burden still to be quantifi ed cardiovascular ill-health • Reduced lung function and non- communicable • Increased rates of asthma disease • Growth failure in infancy, accelerated weight gain in adolescence
Neuro- developmental/ Mild • Specifi c learning impairments, dyslexia, behavioral eff ects[84] Disorders of executive reduced academic achievement functioning
Moderate to severe • Moderate/severe cognitive impairment Affected by gestational age and quality of Global developmental delay • Motor impairment care dependent[85] • Cerebral palsy
Psychiatric/ behavioral • Attention defi cit hyperactivity disorder sequelae • Increased anxiety and depression
Family, economic and Impact on family • Psychosocial, emotional and economic Common varying with medical risk factors, societal eff ects Impact on health service • Cost of care[7] – acute, and ongoing disability, socioeconomic status[86] Intergenerational • Risk of preterm birth in offspring
Blencowe et al. Reproductive Health 2013, 10(Suppl 1):S2http://www.reproductive-health-journal.com/content/10/S1/S2
Page 2 of 14
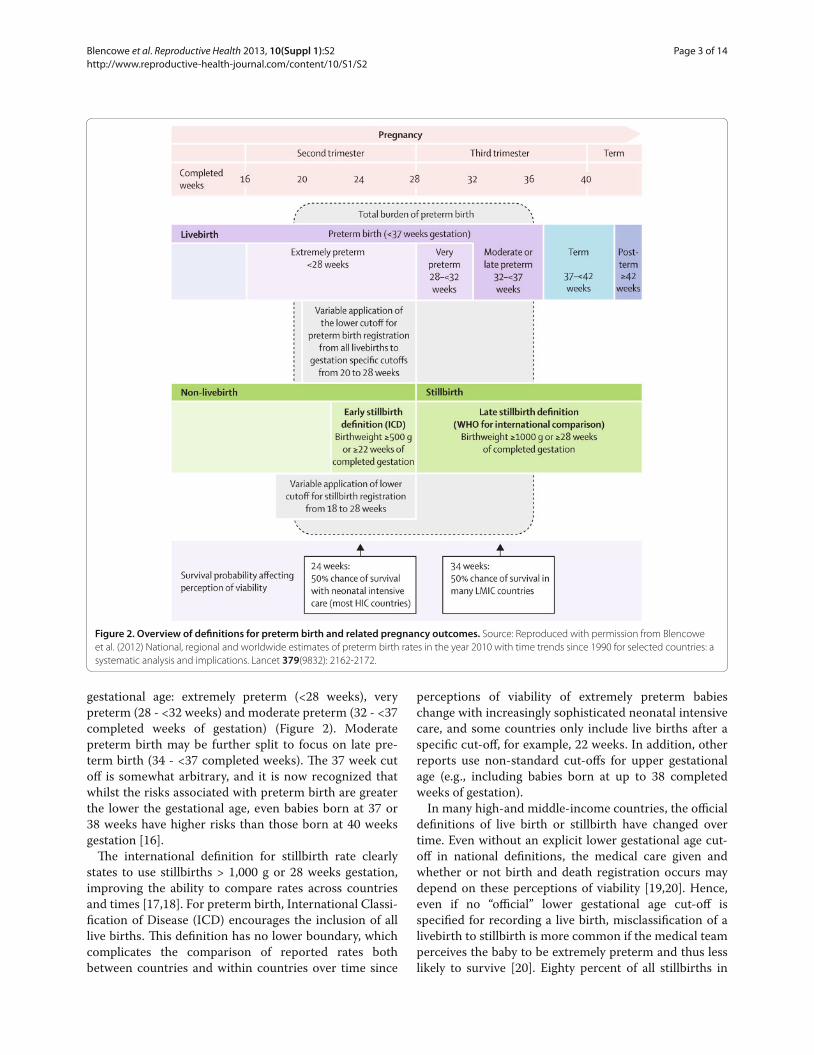
gestational age: extremely preterm (<28 weeks), very preterm (28 - <32 weeks) and moderate preterm (32 - <37 completed weeks of gestation) (Figure 2). Moderate preterm birth may be further split to focus on late pre-term birth (34 - <37 completed weeks). Th e 37 week cut off is somewhat arbitrary, and it is now recognized that whilst the risks associated with preterm birth are greater the lower the gestational age, even babies born at 37 or 38 weeks have higher risks than those born at 40 weeks gestation [16].
Th e international defi nition for stillbirth rate clearly states to use stillbirths > 1,000 g or 28 weeks gestation, improving the ability to compare rates across countries and times [17,18]. For preterm birth, International Classi-fi cation of Disease (ICD) encourages the inclusion of all live births. Th is defi nition has no lower boundary, which complicates the comparison of reported rates both between countries and within countries over time since
perceptions of viability of extremely preterm babies change with increasingly sophisticated neonatal intensive care, and some countries only include live births after a specifi c cut-off , for example, 22 weeks. In addition, other reports use non-standard cut-off s for upper gestational age (e.g., including babies born at up to 38 completed weeks of gestation).
In many high-and middle-income countries, the offi cial defi nitions of live birth or stillbirth have changed over time. Even without an explicit lower gestational age cut-off in national defi nitions, the medical care given and whether or not birth and death registration occurs may depend on these perceptions of viability [19,20]. Hence, even if no “offi cial” lower gestational age cut-off is specifi ed for recording a live birth, misclassifi cation of a livebirth to stillbirth is more common if the medical team perceives the baby to be extremely preterm and thus less likely to survive [20]. Eighty percent of all stillbirths in
Figure 2. Overview of defi nitions for preterm birth and related pregnancy outcomes. Source: Reproduced with permission from Blencowe et al. (2012) National, regional and worldwide estimates of preterm birth rates in the year 2010 with time trends since 1990 for selected countries: a systematic analysis and implications. Lancet 379(9832): 2162-2172.
Blencowe et al. Reproductive Health 2013, 10(Suppl 1):S2http://www.reproductive-health-journal.com/content/10/S1/S2
Page 3 of 14
high-income countries are born preterm, accounting for 5% of all preterm births. Counting only live births underestimates the true burden of preterm birth [21,22].
In addition to the defi nition and perceived viability issue, some reports include only singleton live births, complicating comparison even further. From a public health perspective and for the purposes of policy and planning, the total number of preterm births is the measure of interest.
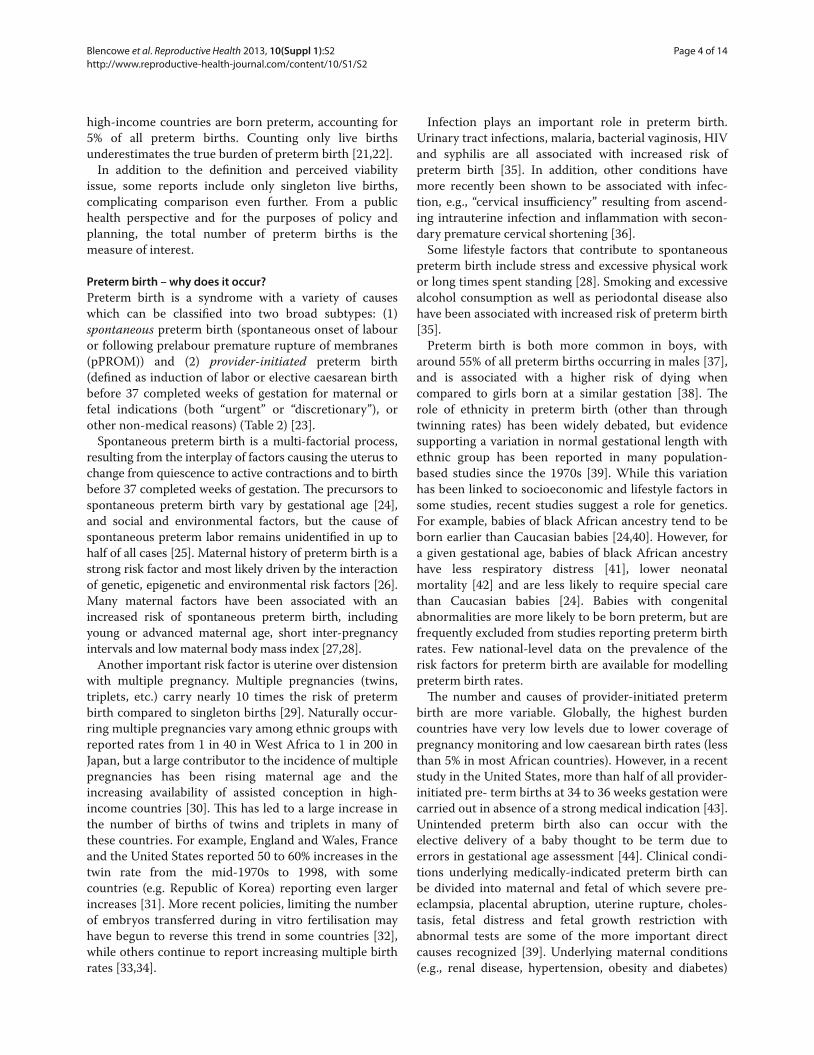
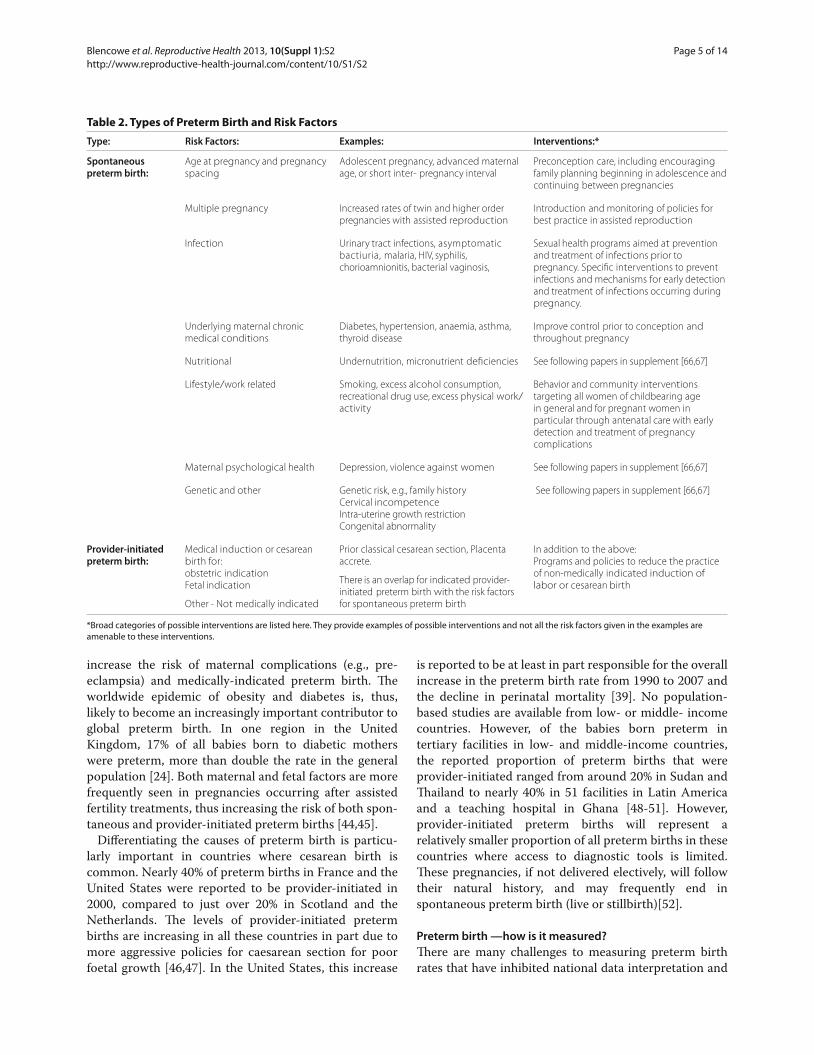
Preterm birth – why does it occur?Preterm birth is a syndrome with a variety of causes which can be classifi ed into two broad subtypes: (1) spontaneous preterm birth (spontaneous onset of labour or following prelabour premature rupture of membranes (pPROM)) and (2) provider-initiated preterm birth (defi ned as induction of labor or elective caesarean birth before 37 completed weeks of gestation for maternal or fetal indications (both “urgent” or “discretionary”), or other non-medical reasons) (Table 2) [23].
Spontaneous preterm birth is a multi-factorial process, resulting from the interplay of factors causing the uterus to change from quiescence to active contractions and to birth before 37 completed weeks of gestation. Th e pre cursors to spontaneous preterm birth vary by gestational age [24], and social and environmental factors, but the cause of spontaneous preterm labor remains unidentifi ed in up to half of all cases [25]. Maternal history of preterm birth is a strong risk factor and most likely driven by the interaction of genetic, epigenetic and environmental risk factors [26]. Many maternal factors have been associated with an increased risk of spontaneous preterm birth, includ ing young or advanced maternal age, short inter-pregnancy intervals and low maternal body mass index [27,28].
Another important risk factor is uterine over distension with multiple pregnancy. Multiple pregnancies (twins, triplets, etc.) carry nearly 10 times the risk of preterm birth compared to singleton births [29]. Naturally occur-ring multiple pregnancies vary among ethnic groups with reported rates from 1 in 40 in West Africa to 1 in 200 in Japan, but a large contributor to the incidence of multiple pregnancies has been rising maternal age and the increasing availability of assisted conception in high-income countries [30]. Th is has led to a large increase in the number of births of twins and triplets in many of these countries. For example, England and Wales, France and the United States reported 50 to 60% increases in the twin rate from the mid-1970s to 1998, with some countries (e.g. Republic of Korea) reporting even larger increases [31]. More recent policies, limiting the number of embryos transferred during in vitro fertilisation may have begun to reverse this trend in some countries [32], while others continue to report increasing multiple birth rates [33,34].
Infection plays an important role in preterm birth. Urinary tract infections, malaria, bacterial vaginosis, HIV and syphilis are all associated with increased risk of preterm birth [35]. In addition, other conditions have more recently been shown to be associated with infec-tion, e.g., “cervical insuffi ciency” resulting from ascend-ing intrauterine infection and infl ammation with secon-dary premature cervical shortening [36].
Some lifestyle factors that contribute to spontaneous preterm birth include stress and excessive physical work or long times spent standing [28]. Smoking and excessive alcohol consumption as well as periodontal disease also have been associated with increased risk of preterm birth [35].
Preterm birth is both more common in boys, with around 55% of all preterm births occurring in males [37], and is associated with a higher risk of dying when compared to girls born at a similar gestation [38]. Th e role of ethnicity in preterm birth (other than through twinning rates) has been widely debated, but evidence supporting a variation in normal gestational length with ethnic group has been reported in many population-based studies since the 1970s [39]. While this variation has been linked to socioeconomic and lifestyle factors in some studies, recent studies suggest a role for genetics. For example, babies of black African ancestry tend to be born earlier than Caucasian babies [24,40]. However, for a given gestational age, babies of black African ancestry have less respiratory distress [41], lower neonatal mortality [42] and are less likely to require special care than Caucasian babies [24]. Babies with congenital abnormalities are more likely to be born preterm, but are frequently excluded from studies reporting preterm birth rates. Few national-level data on the prevalence of the risk factors for preterm birth are available for modelling preterm birth rates.
Th e number and causes of provider-initiated preterm birth are more variable. Globally, the highest burden countries have very low levels due to lower coverage of pregnancy monitoring and low caesarean birth rates (less than 5% in most African countries). However, in a recent study in the United States, more than half of all provider-initiated pre- term births at 34 to 36 weeks gestation were carried out in absence of a strong medical indication [43]. Unintended preterm birth also can occur with the elective delivery of a baby thought to be term due to errors in gestational age assessment [44]. Clinical condi-tions underlying medically-indicated preterm birth can be divided into maternal and fetal of which severe pre-eclampsia, placental abruption, uterine rupture, choles-tasis, fetal distress and fetal growth restriction with abnormal tests are some of the more important direct causes recognized [39]. Underlying maternal conditions (e.g., renal disease, hypertension, obesity and diabetes)
Blencowe et al. Reproductive Health 2013, 10(Suppl 1):S2http://www.reproductive-health-journal.com/content/10/S1/S2
Page 4 of 14
increase the risk of maternal complications (e.g., pre-eclampsia) and medically-indicated preterm birth. Th e worldwide epidemic of obesity and diabetes is, thus, likely to become an increasingly important contributor to global preterm birth. In one region in the United Kingdom, 17% of all babies born to diabetic mothers were preterm, more than double the rate in the general population [24]. Both maternal and fetal factors are more frequently seen in pregnancies occurring after assisted fertility treatments, thus increasing the risk of both spon-taneous and provider-initiated preterm births [44,45].
Diff erentiating the causes of preterm birth is particu-larly important in countries where cesarean birth is common. Nearly 40% of preterm births in France and the United States were reported to be provider-initiated in 2000, compared to just over 20% in Scotland and the Netherlands. Th e levels of provider-initiated preterm births are increasing in all these countries in part due to more aggressive policies for caesarean section for poor foetal growth [46,47]. In the United States, this increase
is reported to be at least in part responsible for the overall increase in the preterm birth rate from 1990 to 2007 and the decline in perinatal mortality [39]. No population-based studies are available from low- or middle- income countries. However, of the babies born preterm in tertiary facilities in low- and middle-income countries, the reported proportion of preterm births that were provider-initiated ranged from around 20% in Sudan and Th ailand to nearly 40% in 51 facilities in Latin America and a teaching hospital in Ghana [48-51]. However, provider-initiated preterm births will represent a relatively smaller proportion of all preterm births in these countries where access to diagnostic tools is limited. Th ese pregnancies, if not delivered electively, will follow their natural history, and may frequently end in spontaneous preterm birth (live or stillbirth)[52].
Preterm birth —how is it measured?Th ere are many challenges to measuring preterm birth rates that have inhibited national data interpretation and
Table 2. Types of Preterm Birth and Risk Factors
Type: Risk Factors: Examples: Interventions:*
Spontaneous preterm birth:
Age at pregnancy and pregnancy spacing
Adolescent pregnancy, advanced maternal age, or short inter- pregnancy interval
Preconception care, including encouraging family planning beginning in adolescence and continuing between pregnancies
Multiple pregnancy Increased rates of twin and higher order pregnancies with assisted reproduction
Introduction and monitoring of policies for best practice in assisted reproduction
Infection Urinary tract infections, asymptomatic bactiuria, malaria, HIV, syphilis, chorioamnionitis, bacterial vaginosis,
Sexual health programs aimed at prevention and treatment of infections prior to pregnancy. Specifi c interventions to prevent infections and mechanisms for early detection and treatment of infections occurring during pregnancy.
Underlying maternal chronic medical conditions
Diabetes, hypertension, anaemia, asthma, thyroid disease
Improve control prior to conception and throughout pregnancy
Nutritional Undernutrition, micronutrient defi ciencies See following papers in supplement [66,67]
Lifestyle/work related Smoking, excess alcohol consumption, recreational drug use, excess physical work/activity
Behavior and community interventions targeting all women of childbearing age in general and for pregnant women in particular through antenatal care with early detection and treatment of pregnancy complications
Maternal psychological health Depression, violence against women See following papers in supplement [66,67]
Genetic and other Genetic risk, e.g., family historyCervical incompetenceIntra-uterine growth restrictionCongenital abnormality
See following papers in supplement [66,67]
Provider-initiated preterm birth:
Medical induction or cesarean birth for:obstetric indicationFetal indication
Other - Not medically indicated
Prior classical cesarean section, Placenta accrete.
There is an overlap for indicated provider-initiated preterm birth with the risk factors for spontaneous preterm birth
In addition to the above:Programs and policies to reduce the practice of non-medically indicated induction of labor or cesarean birth
*Broad categories of possible interventions are listed here. They provide examples of possible interventions and not all the risk factors given in the examples are amenable to these interventions.
Blencowe et al. Reproductive Health 2013, 10(Suppl 1):S2http://www.reproductive-health-journal.com/content/10/S1/S2
Page 5 of 14
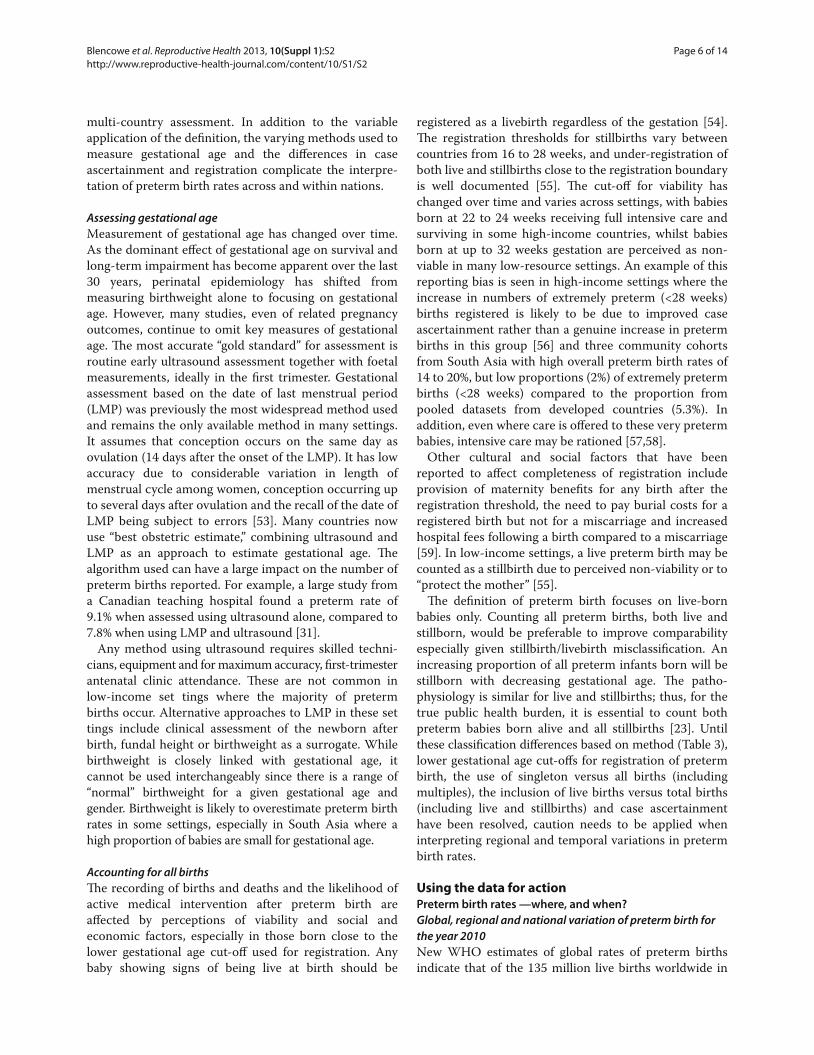
multi-country assessment. In addition to the variable application of the defi nition, the varying methods used to measure gestational age and the diff erences in case ascertainment and registration complicate the inter pre-tation of preterm birth rates across and within nations.
Assessing gestational ageMeasurement of gestational age has changed over time. As the dominant eff ect of gestational age on survival and long-term impairment has become apparent over the last 30 years, perinatal epidemiology has shifted from measur ing birthweight alone to focusing on gestational age. However, many studies, even of related pregnancy outcomes, continue to omit key measures of gestational age. Th e most accurate “gold standard” for assessment is routine early ultrasound assessment together with foetal measurements, ideally in the fi rst trimester. Gestational assessment based on the date of last menstrual period (LMP) was previously the most widespread method used and remains the only available method in many settings. It assumes that conception occurs on the same day as ovulation (14 days after the onset of the LMP). It has low accuracy due to considerable variation in length of menstrual cycle among women, conception occurring up to several days after ovulation and the recall of the date of LMP being subject to errors [53]. Many countries now use “best obstetric estimate,” combining ultrasound and LMP as an approach to estimate gestational age. Th e algorithm used can have a large impact on the number of preterm births reported. For example, a large study from a Canadian teaching hospital found a preterm rate of 9.1% when assessed using ultrasound alone, compared to 7.8% when using LMP and ultrasound [31].
Any method using ultrasound requires skilled tech ni-cians, equipment and for maximum accuracy, fi rst-trimester antenatal clinic attendance. Th ese are not common in low-income set tings where the majority of preterm births occur. Alternative approaches to LMP in these set tings include clinical assessment of the newborn after birth, fundal height or birthweight as a surrogate. While birthweight is closely linked with gestational age, it cannot be used interchangeably since there is a range of “normal” birthweight for a given gestational age and gender. Birthweight is likely to overestimate preterm birth rates in some settings, especially in South Asia where a high proportion of babies are small for gesta tional age.
Accounting for all birthsTh e recording of births and deaths and the likelihood of active medical intervention after preterm birth are aff ected by perceptions of viability and social and economic factors, especially in those born close to the lower gestational age cut-off used for registration. Any baby showing signs of being live at birth should be
registered as a livebirth regardless of the gestation [54]. Th e registration thresholds for stillbirths vary between countries from 16 to 28 weeks, and under-registration of both live and stillbirths close to the registration boundary is well documented [55]. Th e cut-off for viability has changed over time and varies across settings, with babies born at 22 to 24 weeks receiving full intensive care and surviving in some high-income countries, whilst babies born at up to 32 weeks gestation are perceived as non-viable in many low-resource settings. An example of this reporting bias is seen in high-income settings where the increase in numbers of extremely preterm (<28 weeks) births registered is likely to be due to improved case ascertainment rather than a genuine increase in preterm births in this group [56] and three community cohorts from South Asia with high overall preterm birth rates of 14 to 20%, but low proportions (2%) of extremely preterm births (<28 weeks) compared to the proportion from pooled datasets from developed countries (5.3%). In addition, even where care is off ered to these very preterm babies, intensive care may be rationed [57,58].
Other cultural and social factors that have been reported to aff ect completeness of registration include provision of maternity benefi ts for any birth after the registration threshold, the need to pay burial costs for a registered birth but not for a miscarriage and increased hospital fees following a birth compared to a miscarriage [59]. In low-income settings, a live preterm birth may be counted as a stillbirth due to perceived non-viability or to “protect the mother” [55].
Th e defi nition of preterm birth focuses on live-born babies only. Counting all preterm births, both live and stillborn, would be preferable to improve comparability especially given stillbirth/livebirth misclassifi cation. An increasing proportion of all preterm infants born will be stillborn with decreasing gestational age. Th e patho-physiology is similar for live and stillbirths; thus, for the true public health burden, it is essential to count both preterm babies born alive and all stillbirths [23]. Until these classifi cation diff erences based on method (Table 3), lower gestational age cut-off s for registration of preterm birth, the use of singleton versus all births (including multiples), the inclusion of live births versus total births (including live and stillbirths) and case ascertainment have been resolved, caution needs to be applied when interpreting regional and temporal variations in preterm birth rates.
Using the data for actionPreterm birth rates —where, and when?Global, regional and national variation of preterm birth for the year 2010New WHO estimates of global rates of preterm births indicate that of the 135 million live births worldwide in
Blencowe et al. Reproductive Health 2013, 10(Suppl 1):S2http://www.reproductive-health-journal.com/content/10/S1/S2
Page 6 of 14
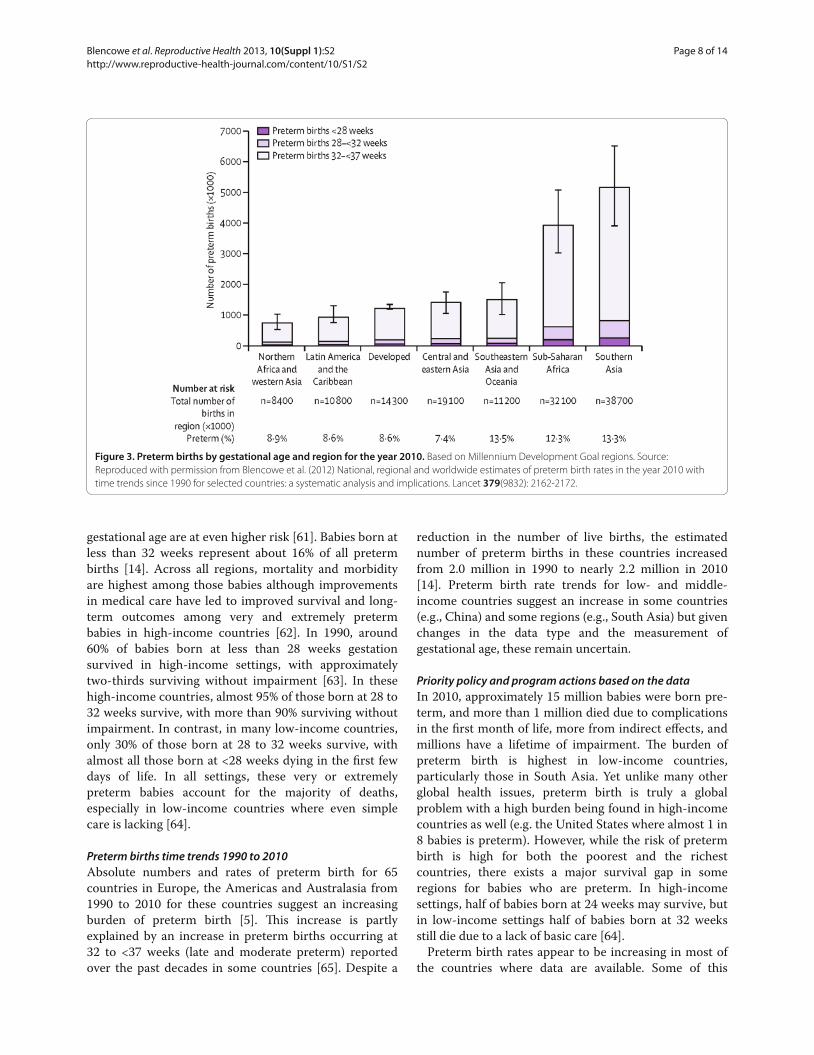
2010, 14.9 million babies were born preterm, representing a preterm birth rate of 11.1% [14]. Over 60% of preterm births occurred in sub-Saharan Africa and South Asia where 9.1 million births (12.8%) annually are estimated to be preterm (Figure 3). Th e high absolute number of preterm births in Africa and Asia are related, in part, to high fertility and the large number of births in those two regions in comparison to other parts of the world.
Th e variation in the rate of preterm birth among regions and countries is substantial and yield a diff erent picture to other conditions in that some high-income countries have very high rates. Rates are highest on average for low-income countries (11.8%), followed by lower middle-income countries (11.3%) and lowest for upper middle- and high-income countries (9.4% and 9.3%). However, relatively high preterm birth rates are seen in many individual high-income countries where they contribute substantially to neonatal mortality and morbidity. Of the 1.2 million preterm births estimated to occur in high-income regions, more than 0.5 million (42%) occur in the United States. Th e highest rates by Millennium Development Goal Regions [60] are found in Southeastern and South Asia where 13.4% of all live births are estimated to be preterm (Figure 3).
Th e uncertainty ranges in Figure 3 are indicative of another problem — the huge data gaps for many regions of the world. Although these data gaps are particularly great for Africa and Asia, there also are gaps in data from high-income countries. While data on preterm birth-associated mortality are lacking in these settings, worldwide there are almost no data currently on acute morbidities or long-term impairment associated with prematurity, thus preventing even the most basic assessments of service needs.
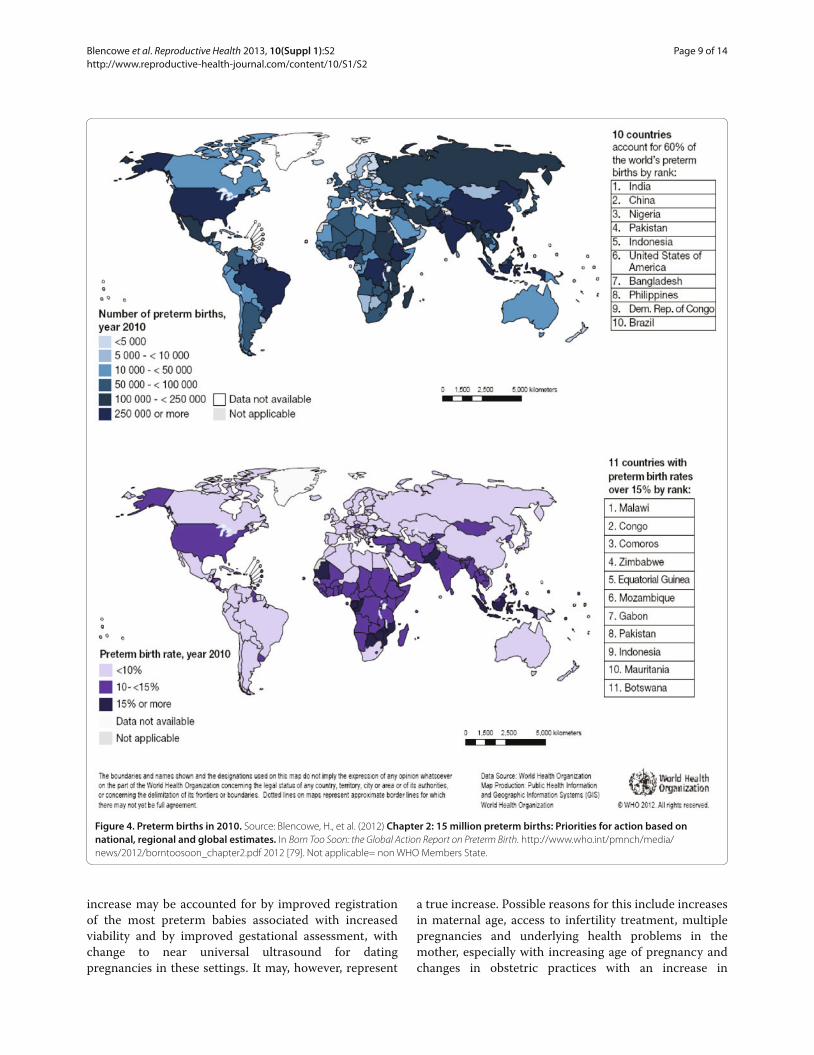
Th e maps in Figure 4 depict preterm birth rates and the absolute numbers of preterm birth in 2010 by country. Estimated rates vary from around 5 in several Northern European countries to 18.1% in Malawi. Th e estimated preterm birth rate is less than 10% in 88 countries, whilst 11 countries have estimated rates of 15% or more (Figure 4). Th e 10 countries with the highest numbers of estimated preterm births are India, China, Nigeria, Pakistan, Indonesia, United States, Bangladesh, the Philippines, Democratic Republic of the Congo and Brazil (Figure 4). Th ese 10 countries account for 60% of all preterm births worldwide.
Mortality rates increase with decreasing gestational age, and babies who are both preterm and small for
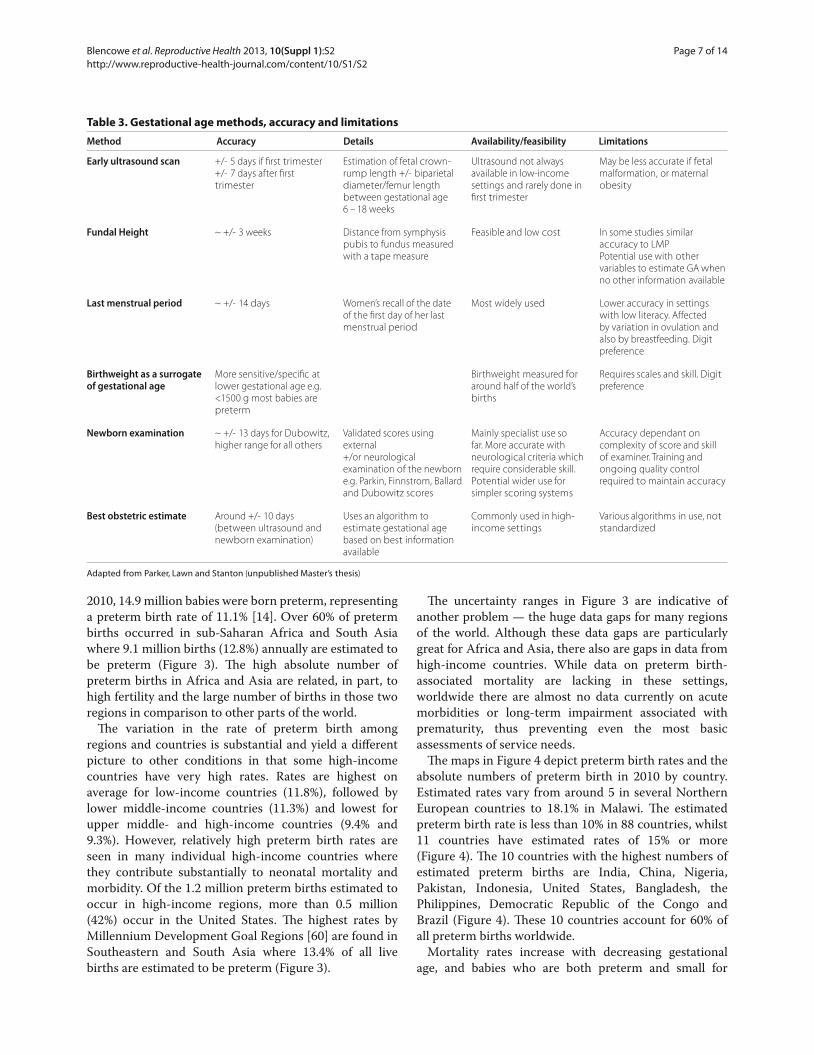
Table 3. Gestational age methods, accuracy and limitations
Method Accuracy Details Availability/feasibility Limitations
Early ultrasound scan +/- 5 days if fi rst trimester+/- 7 days after fi rst trimester
Estimation of fetal crown-rump length +/- biparietal diameter/femur length between gestational age 6 – 18 weeks
Ultrasound not always available in low-income settings and rarely done in fi rst trimester
May be less accurate if fetal malformation, or maternal obesity
Fundal Height ~ +/- 3 weeks Distance from symphysis pubis to fundus measured with a tape measure
Feasible and low cost In some studies similar accuracy to LMPPotential use with other variables to estimate GA when no other information available
Last menstrual period ~ +/- 14 days Women’s recall of the date of the fi rst day of her last menstrual period
Most widely used Lower accuracy in settings with low literacy. Affected by variation in ovulation and also by breastfeeding. Digit preference
Birthweight as a surrogate of gestational age
More sensitive/specifi c at lower gestational age e.g. <1500 g most babies are preterm
Birthweight measured for around half of the world’s births
Requires scales and skill. Digit preference
Newborn examination ~ +/- 13 days for Dubowitz, higher range for all others
Validated scores using external+/or neurological examination of the newborn e.g. Parkin, Finnstrom, Ballard and Dubowitz scores
Mainly specialist use so far. More accurate with neurological criteria which require considerable skill. Potential wider use for simpler scoring systems
Accuracy dependant on complexity of score and skill of examiner. Training and ongoing quality control required to maintain accuracy
Best obstetric estimate Around +/- 10 days (between ultrasound and newborn examination)
Uses an algorithm to estimate gestational age based on best information available
Commonly used in high-income settings
Various algorithms in use, not standardized
Adapted from Parker, Lawn and Stanton (unpublished Master’s thesis)
Blencowe et al. Reproductive Health 2013, 10(Suppl 1):S2http://www.reproductive-health-journal.com/content/10/S1/S2
Page 7 of 14
gestational age are at even higher risk [61]. Babies born at less than 32 weeks represent about 16% of all preterm births [14]. Across all regions, mortality and morbidity are highest among those babies although improvements in medical care have led to improved survival and long-term outcomes among very and extremely preterm babies in high-income countries [62]. In 1990, around 60% of babies born at less than 28 weeks gestation survived in high-income settings, with approximately two-thirds surviving without impairment [63]. In these high-income countries, almost 95% of those born at 28 to 32 weeks survive, with more than 90% surviving without impairment. In contrast, in many low-income countries, only 30% of those born at 28 to 32 weeks survive, with almost all those born at <28 weeks dying in the fi rst few days of life. In all settings, these very or extremely preterm babies account for the majority of deaths, especially in low-income countries where even simple care is lacking [64].
Preterm births time trends 1990 to 2010Absolute numbers and rates of preterm birth for 65 countries in Europe, the Americas and Australasia from 1990 to 2010 for these countries suggest an increasing burden of preterm birth [5]. Th is increase is partly explained by an increase in preterm births occurring at 32 to <37 weeks (late and moderate preterm) reported over the past decades in some countries [65]. Despite a
reduction in the number of live births, the estimated number of preterm births in these countries increased from 2.0 million in 1990 to nearly 2.2 million in 2010 [14]. Preterm birth rate trends for low- and middle-income countries suggest an increase in some countries (e.g., China) and some regions (e.g., South Asia) but given changes in the data type and the measurement of gestational age, these remain uncertain.
Priority policy and program actions based on the dataIn 2010, approximately 15 million babies were born pre- term, and more than 1 million died due to complications in the fi rst month of life, more from indirect eff ects, and millions have a lifetime of impairment. Th e burden of preterm birth is highest in low-income countries, particularly those in South Asia. Yet unlike many other global health issues, preterm birth is truly a global problem with a high burden being found in high-income countries as well (e.g. the United States where almost 1 in 8 babies is preterm). However, while the risk of preterm birth is high for both the poorest and the richest countries, there exists a major survival gap in some regions for babies who are preterm. In high-income settings, half of babies born at 24 weeks may survive, but in low-income settings half of babies born at 32 weeks still die due to a lack of basic care [64].
Preterm birth rates appear to be increasing in most of the countries where data are available. Some of this
Figure 3. Preterm births by gestational age and region for the year 2010. Based on Millennium Development Goal regions. Source: Reproduced with permission from Blencowe et al. (2012) National, regional and worldwide estimates of preterm birth rates in the year 2010 with time trends since 1990 for selected countries: a systematic analysis and implications. Lancet 379(9832): 2162-2172.
Blencowe et al. Reproductive Health 2013, 10(Suppl 1):S2http://www.reproductive-health-journal.com/content/10/S1/S2
Page 8 of 14
increase may be accounted for by improved registration of the most preterm babies associated with increased viability and by improved gestational assessment, with change to near universal ultrasound for dating pregnancies in these settings. It may, however, represent
a true increase. Possible reasons for this include increases in maternal age, access to infertility treatment, multiple pregnancies and underlying health problems in the mother, especially with increasing age of pregnancy and changes in obstetric practices with an increase in
Figure 4. Preterm births in 2010. Source: Blencowe, H., et al. (2012) Chapter 2: 15 million preterm births: Priorities for action based on national, regional and global estimates. In Born Too Soon: the Global Action Report on Preterm Birth. http://www.who.int/pmnch/media/news/2012/borntoosoon_chapter2.pdf 2012 [79]. Not applicable= non WHO Members State.
Blencowe et al. Reproductive Health 2013, 10(Suppl 1):S2http://www.reproductive-health-journal.com/content/10/S1/S2
Page 9 of 14
provider-initiated preterm births in moderate and late preterm infants who would not have otherwise been born preterm [46]. In the 1980s and 1990s, the increases seen in many high-income countries were attributed to higher multiple gestation and preterm birth rates amongst assisted conceptions after treatment for sub-fertility. Recent changes in policies limiting the number of embryos that can be implanted have led to a reduction in preterm births due to assisted fertility treatments in many countries [63]. However, in many middle-income regions with newer, relatively unregulated assisted fertility services, a similar increase may be seen if policies to counteract this are not introduced and adhered to. A reduction in preterm birth was reported from the 1960s to 1980s in a few countries (e.g. Finland, France, Scotland), and this was attributed, in part, to improved socioeconomic factors and antenatal care. For the majority of countries in low- and middle-income regions, it is not possible to estimate trends in preterm birth over time as there are not suffi cient data to provide reliable evidence of a time trend for preterm birth overall. Some countries in some regions (e.g. South and Eastern Asia) have data suggesting possible increases in preterm birth rates over time, but this may represent measurement artifact due to increases in data and data reliability.
Distinguishing spontaneous and provider-initiated preterm birth is of importance to programs aiming to reduce preterm birth. For spontaneous preterm births, the underlying causes need to be understood and addressed while in the case of provider-initiated preterm births both the underlying conditions (e.g. pre- eclampsia) and obstetric policies and practices require assessment and to be addressed [66,67].
Th e proportion of neonatal deaths attributed to preterm births is inversely related to neonatal mortality rates, because in countries with very high neonatal mortality, more deaths occur due to infections such as sepsis, pneumonia, diarrhea and tetanus as well as to intra partum-related “birth asphyxia” [2]. However, although the proportion of deaths due to preterm birth is lower in low-income countries than in high-income countries, the cause-specifi c rates are much higher in low- and middle-income than in high-income countries. For example, in Afghanistan and Somalia, the estimated cause-specifi c rate for neonatal deaths directly due to preterm birth is 16 per 1,000 compared to Japan, Norway and Sweden where it is under 0.5 per 1,000. Th is is due to the lack of even simple care for premature babies resulting in a major survival gap for babies depending on where they are born [64].
Preterm birth can result in a range of long-term complications in survivors, with the frequency and severity of adverse outcomes rising with decreasing gestational age and decreasing quality of care (Table 1).
Most babies born at less than 28 weeks need neonatal intensive care services to survive, and most babies 28 to 32 weeks will need special newborn care at a minimum. Th e availability and quality of these services are not yet well established in many low- and middle-income countries. Many middle- income countries, currently scaling up neonatal intensive care, are just beginning to experience these long-term consequences in survivors. 43% of the estimated 0.9 million preterm babies surviving with neurodevelopmental impairment are from middle income countries [8]. Th ese eff ects are most marked amongst survivors born extremely preterm; however, there is increasing evidence that all premature babies regardless of gestational age are at increased risk. Th e vast majority (84%) of all preterm births occur at 32 to 36 weeks. Most of these infants will survive with adequate supportive care and without needing neonatal intensive care. However, even babies born at 34 to 36 weeks have been shown to have an increased risk of neonatal and infant death when compared with those born at term and contribute importantly to overall infant deaths [68]. Babies born at 34 to 36 weeks also experience increased rates of short-term morbidity associated with prematurity (e.g., respiratory distress and intraventricular hemorrhage) than their peers born at term [69-71]. In the longer term, they have worse neurodevelopmental and school performance outcomes and increased risk of cerebral palsy [72,73]. On a global level, given their relatively larger numbers, babies born at 34 to 36 weeks are likely to have the greatest public health impact and to be of the most importance in the planning of services (e.g., training community health workers in Kangaroo Mother Care (KMC), essential newborn care and special care of the moderately preterm baby) [64].
We have highlighted the diff erences in preterm birth rates among countries, but marked disparities are also present within countries. For example, in the United States in 2009, reported preterm birth rates were as high as 17.5% in black Americans, compared to just 10.9% in white Americans, with rates varying from around 11 to 12% in those 20 to 35 years of age to more than 15% in those under age 17 or over 40 [13]. Disparities within countries need to be better understood in order to identify high-risk groups and improve care.
Th e economic costs of preterm birth are large in terms of the immediate neonatal intensive care and ongoing long-term complex health needs frequently experienced. Th ese costs, in addition, are likely to rise as premature babies increasingly survive at earlier gestational ages in all regions. Th is survival also will result in the increased need for special education services and associated costs that will place an additional burden on aff ected families and the communities in which they live [74]. An increased awareness of the long-term consequences of
Blencowe et al. Reproductive Health 2013, 10(Suppl 1):S2http://www.reproductive-health-journal.com/content/10/S1/S2
Page 10 of 14
preterm birth (at all gestational ages) is required to fashion policies to support these survivors and their families as part of a more generalised improvement in quality of care for those with disabilities in any given country. In many middle-income countries, preterm birth is an important cause of disability. For example, a third of all children under 10 in schools for the visually impaired in Vietnam and more than 40% of under-5’s in similar schools in Mexico have blindness secondary to retinopathy of prematurity [75,76].
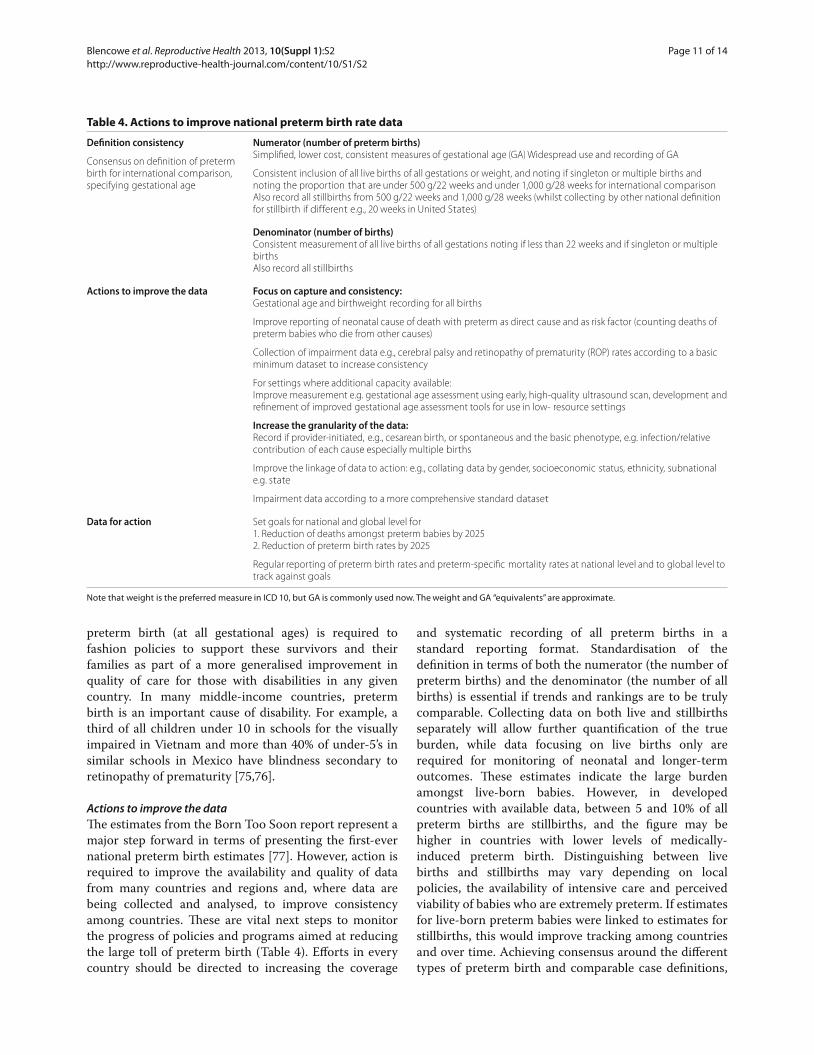
Actions to improve the dataTh e estimates from the Born Too Soon report represent a major step forward in terms of presenting the fi rst-ever national preterm birth estimates [77]. However, action is required to improve the availability and quality of data from many countries and regions and, where data are being collected and analysed, to improve consistency among countries. Th ese are vital next steps to monitor the progress of policies and programs aimed at reducing the large toll of preterm birth (Table 4). Eff orts in every country should be directed to increasing the coverage
and systematic recording of all preterm births in a standard reporting format. Standardisation of the defi nition in terms of both the numerator (the number of preterm births) and the denominator (the number of all births) is essential if trends and rankings are to be truly comparable. Collecting data on both live and stillbirths separately will allow further quantifi cation of the true burden, while data focusing on live births only are required for monitoring of neonatal and longer-term outcomes. Th ese estimates indicate the large burden amongst live-born babies. However, in developed countries with available data, between 5 and 10% of all preterm births are stillbirths, and the fi gure may be higher in countries with lower levels of medically-induced preterm birth. Distinguishing between live births and stillbirths may vary depending on local policies, the availability of intensive care and perceived viability of babies who are extremely preterm. If estimates for live-born preterm babies were linked to estimates for stillbirths, this would improve tracking among countries and over time. Achieving consensus around the diff erent types of preterm birth and comparable case defi nitions,
Table 4. Actions to improve national preterm birth rate data
Defi nition consistency
Consensus on defi nition of preterm birth for international comparison, specifying gestational age
Numerator (number of preterm births)Simplifi ed, lower cost, consistent measures of gestational age (GA) Widespread use and recording of GA
Consistent inclusion of all live births of all gestations or weight, and noting if singleton or multiple births and noting the proportion that are under 500 g/22 weeks and under 1,000 g/28 weeks for international comparisonAlso record all stillbirths from 500 g/22 weeks and 1,000 g/28 weeks (whilst collecting by other national defi nition for stillbirth if different e.g., 20 weeks in United States)
Denominator (number of births)Consistent measurement of all live births of all gestations noting if less than 22 weeks and if singleton or multiple birthsAlso record all stillbirths
Actions to improve the data Focus on capture and consistency:Gestational age and birthweight recording for all births
Improve reporting of neonatal cause of death with preterm as direct cause and as risk factor (counting deaths of preterm babies who die from other causes)
Collection of impairment data e.g., cerebral palsy and retinopathy of prematurity (ROP) rates according to a basic minimum dataset to increase consistency
For settings where additional capacity available:Improve measurement e.g. gestational age assessment using early, high-quality ultrasound scan, development and refi nement of improved gestational age assessment tools for use in low- resource settings
Increase the granularity of the data:Record if provider-initiated, e.g., cesarean birth, or spontaneous and the basic phenotype, e.g. infection/relative contribution of each cause especially multiple births
Improve the linkage of data to action: e.g., collating data by gender, socioeconomic status, ethnicity, subnational e.g. state
Impairment data according to a more comprehensive standard dataset
Data for action Set goals for national and global level for1. Reduction of deaths amongst preterm babies by 20252. Reduction of preterm birth rates by 2025
Regular reporting of preterm birth rates and preterm-specifi c mortality rates at national level and to global level to track against goals
Note that weight is the preferred measure in ICD 10, but GA is commonly used now. The weight and GA “equivalents” are approximate.
Blencowe et al. Reproductive Health 2013, 10(Suppl 1):S2http://www.reproductive-health-journal.com/content/10/S1/S2
Page 11 of 14
whilst challenging, are required where resources allow to further understand the complex syndrome of preterm birth [23].
In many low- and middle-income countries without wide- scale vital registration, no nationally representative data are available on rates of preterm birth. Substantial investment and attention are required to improve vital registration systems and to account for all birth outcomes [78]. In the meantime, the amount of population-based data available in high-burden countries could be dramatically increased to better inform future estimates and monitor time trends if data on preterm birth rates were able to be included in nationally representative surveys such as the Demographic and Health Surveys (DHS), but this will require developing, testing and training in the use of preterm-specifi c survey-based tools which are not currently available. Th e advent of inexpensive portable ultrasound machines makes inclu-sion of routine early ultrasound scans in demographic surveillance sites or representative cohorts a promising route to increase data availability in these settings in the short term. Innovation for simpler, low-cost, sensitive and specifi c tools for assessing gestational age could improve both the coverage and quality of gestational age assessment. Data from hospital-based information systems would also be helpful, but potential selection and other biases must be taken into account. Simpler stan-dard ized tools to assess acute and long-term morbidities-associated preterm birth also are critically important to inform program quality improvement to reduce the proportion of survivors with preventable impairment.
ConclusionTh ere are suffi cient data to justify action now to reduce this large burden of 15 million preterm births and more than one million neonatal deaths. Innovative solutions to prevent preterm birth and hence reduce preterm birth rates all around the world are urgently needed. Th is also requires strengthened data systems to adequately track trends in preterm birth rates and program eff ectiveness. Th ese eff orts must be coupled with action now to implement improved antenatal, obstetric and newborn care to increase survival and reduce disability amongst those born too soon. Th ese are reviewed further in the following papers in this supplement.
Additional File
Competing interestsThe author’s declare that they have no confl ict of interest. The authors alone are responsible for the views expressed in this article and they do not necessarily represent the views, decisions or policies of the institutions with which they are affi liated.
Author contributionHB, MK and JL drafted the paper with SC, DC, MZO, LS, ABM. All authors reviewed the fi nal manuscript.
AcknowledgmentsThe Born Too Soon report was funded by March of Dimes, the Partnership for Maternal, Newborn and Child Health and Save the Children. We would like to thank the Born Too Soon Preterm Birth Action Group, including the Preterm Birth Technical Review Panel and all the report authors (in alphabetical order): José Belizán (chair), Hannah Blencowe, Zulfi qar Bhutta, Sohni Dean, Andres de Francisco, Christopher Howson, Mary Kinney, Mark Klebanoff , Joy Lawn, Silke Mader, Elizabeth Mason (chair), Jeff rey Murray, Pius Okong, Carmencita Padilla, Robert Pattinson, Jennifer Requejo, Craig Rubens, Andrew Serazin, Catherine Spong, Antoinette Tshefu, Rexford Widmer, Khalid Yunis, Nanbert Zhong.
The authors appreciated review and inputs from Mark Klebanoff and Khalid Yunis. Thank you to Megan Bruno for her administrative support. We would also like to thank the Bill & Melinda Gates Foundation for funding the time for Boston Consulting Group.
FundingHB and SC were funded through a grant from the Bill & Melinda Gates Foundation through the Child Health Epidemiology Reference Group. JL and MK were funded by the Bill & Melinda Gates Foundation though Save the Children’s Saving Newborn Lives program.
List of abbreviations usedpPROM: prelabour premature rupture of membranes; WHO: World Health Organization.
Author details1MARCH, London School of Hygiene and Tropical Medicine, London, UK. 2World Health Organization, Geneva, Switzerland. 3Saving Newborn Lives, Save the Children, Cape Town, South Africa.
Published: 15 November 2013
References 1. Liu L, Johnson H, Cousens S, Perin J, Scott S, Lawn J, Ruden I, Campbell H,
Cibulskis R, Mengying. L, et al: Global, regional and national causes of child mortality: an updated systematic analysis for 2010 with time trends since 2000. The Lancet 2012, 379:2151-2161.
2. Lawn JE, Cousens S, Zupan J: 4 million neonatal deaths: when? Where? Why? Lancet 2005, 365:891-900.
3. Lawn JE, Kerber K, Enweronu-Laryea C, Cousens S: 3.6 million neonatal deaths - what is progressing and what is not? Semin Perinatol 2010, 34:371-386.
4. Millennium Development Goals Indicators [http://mdgs.un.org/unsd/mdg/Default.aspx]
5. Howson CP, Kimmey MV, McDougall L, Lawn JE: Born Too Soon: Preterm birth matters. Reprod Health 2013, 10(Suppl 1):S1.
6. Rogers LK, Velten M: Maternal infl ammation, growth retardation, and preterm birth: insights into adult cardiovascular disease. Life Sci 2011, 89:417-421.
7. Preterm Birth: Causes, Consequences, and Prevention [http://www.iom.edu/Reports/2006/Preterm-Birth-Causes-Consequences-and-Prevention.aspx]
8. Blencowe H, Lee AC, Cousens S, Bahalim A, Narwal R, Zhong N, Chou D, Say L, Modi N, Katz J, et al: Preterm birth associated neurodevelopmental impairment estimates at regional and global level for 2010. Pediatric Research 2013.
9. Murray CJ, Vos T, Lozano R, Naghavi M, Flaxman AD, Michaud C, Ezzati M, Shibuya K, Salomon JA, Abdalla S, et al: Disability-adjusted life years (DALYs) for 291 diseases and injuries in 21 regions, 1990-2010: a systematic analysis for the Global Burden of Disease Study 2010. Lancet 2012, 380:2197-2223.
10. Langhoff -Roos J, Kesmodel U, Jacobsson B, Rasmussen S, Vogel I: Spontaneous preterm delivery in primiparous women at low risk in Denmark: population based study. BMJ 2006, 332:937-939.
11. Martin JA, Hamilton BE, Sutton PD, Ventura SJ, Mathews TJ, Kirmeyer S, Osterman MJ: Births: fi nal data for 2007. Natl Vital Stat Rep 2010, 58:1-85.
Additional fi le 1. In line with the journal’s open peer review policy, copies of the reviewer reports are included as additional fi le 1.
Blencowe et al. Reproductive Health 2013, 10(Suppl 1):S2http://www.reproductive-health-journal.com/content/10/S1/S2
Page 12 of 14

12. Thompson JM, Irgens LM, Rasmussen S, Daltveit AK: Secular trends in socio-economic status and the implications for preterm birth. Paediatr Perinat Epidemiol 2006, 20:182-187.
13. Martin, Hamilton BE, Ventura P, Osterman M, Kirmeyer S, Mathews MS, Wilson E: Births: Final Data for 2009. National Vital Staistic Reports 2011, 60.
14. Blencowe H, Cousens S, Oestergaard MZ, Chou D, Moller AB, Narwal R, Adler A, Vera Garcia C, Rohde S, Say L, Lawn JE: National, regional, and worldwide estimates of preterm birth rates in the year 2010 with time trends since 1990 for selected countries: a systematic analysis and implications. Lancet 2012, 379:2162-2172.
15. WHO: WHO: recommended defi nitions, terminology and format for statistical tables related to the perinatal period and use of a new certifi cate for cause of perinatal deaths. Modifi cations recommended by FIGO as amended October 14, 1976. Acta Obstet Gynecol Scand 1977, 56:247-253.
16. Marlow N: Full term; an artifi cial concept. . Arch Dis Child Fetal Neonatal Ed 2012, 97:F158.
17. Lawn JE, Blencowe H, Pattinson R, Cousens S, Kumar R, Ibiebele I, Gardosi J, Day LT, Stanton C: Stillbirths: Where? When? Why? How to make the data count? Lancet 2011, 377:1448-1463.
18. Cousens S, Blencowe H, Stanton C, Chou D, Ahmed S, Steinhardt L, Creanga AA, Tuncalp O, Balsara ZP, Gupta S, et al: National, regional, and worldwide estimates of stillbirth rates in 2009 with trends since 1995: a systematic analysis. Lancet 2011, 377:1319-1330.
19. Goldenberg RL, Nelson KG, Dyer RL, Wayne J: The variability of viability: the eff ect of physicians’ perceptions of viability on the survival of very low-birth weight infants. Am J Obstet Gynecol 1982, 143:678-684.
20. Sanders MR, Donohue PK, Oberdorf MA, Rosenkrantz TS, Allen MC: Impact of the perception of viability on resource allocation in the neonatal intensive care unit. J Perinatol 1998, 18:347-351.
21. Flenady V, Middleton P, Smith GC, Duke W, Erwich JJ, Khong TY, Neilson J, Ezzati M, Koopmans L, Ellwood D, et al: Stillbirths: the way forward in high-income countries. Lancet 2011, 377:1703-1717.
22. Kramer MS, Papageorghiou A, Culhane J, Bhutta Z, Goldenberg RL, Gravett M, Iams JD, Conde-Agudelo A, Waller S, Barros F, et al: Challenges in defi ning and classifying the preterm birth syndrome. Am J Obstet Gynecol 2012, 206:108-112.
23. Goldenberg RL, Gravett MG, Iams J, Papageorghiou AT, Waller SA, Kramer M, Culhane J, Barros F, Conde-Agudelo A, Bhutta ZA, et al: The preterm birth syndrome: issues to consider in creating a classifi cation system. Am J Obstet Gynecol 2012, 206:113-118.
24. Steer P: The epidemiology of preterm labour. BJOG 2005, 112 Suppl 1:1-3. 25. Menon R: Spontaneous preterm birth, a clinical dilemma: etiologic,
pathophysiologic and genetic heterogeneities and racial disparity. Acta Obstet Gynecol Scand 2008, 87:590-600.
26. Plunkett J, Muglia LJ: Genetic contributions to preterm birth: implications from epidemiological and genetic association studies. Ann Med 2008, 40:167-195.
27. Goldenberg RL, Culhane JF, Iams JD, Romero R: Epidemiology and causes of preterm birth. Lancet 2008, 371:75-84.
28. Muglia LJ, Katz M: The enigma of spontaneous preterm birth. N Engl J Med 2010, 362:529-535.
29. Blondel B, Macfarlane A, Gissler M, Breart G, Zeitlin J: Preterm birth and multiple pregnancy in European countries participating in the PERISTAT project. BJOG 2006, 113:528-535.
30. Felberbaum RE: Multiple pregnancies after assisted reproduction - international comparison. Reprod Biomed Online 2007, 15 Suppl 3:53-60.
31. Blondel B, Kaminski M: Trends in the occurrence, determinants, and consequences of multiple births. Semin Perinatol 2002, 26:239-249.
32. Kaprio J MR: Demographic trends in Nordic countries. In Multiple Pregnancy: Epidemiology, Gestation & Perinatal Conditions 2nd edn. 2nd edition. Edited by Blickstein I KL. London: Taylor & Francis; 2005: p 22 - 25
33. Lim JW: The changing trends in live birth statistics in Korea, 1970 to 2010. Korean J Pediatr 2011, 54:429-435.
34. Martin, Hamilton BE, Sutton PD, Ventura SJ, Mathews TJ, Osterman MJ: Births: fi nal data for 2008. Natl Vital Stat Rep 2010, 59:1, 3-71.
35. Gravett MG, Rubens CE, Nunes TM: Global report on preterm birth and stillbirth (2 of 7): discovery science. BMC Pregnancy Childbirth 2010, 10 Suppl 1:S2.
36. Lee SE, Romero R, Park CW, Jun JK, Yoon BH: The frequency and signifi cance of intraamniotic infl ammation in patients with cervical insuffi ciency. Am J
Obstet Gynecol 2008, 198:633 e631-638. 37. Zeitlin J, Saurel-Cubizolles MJ, De Mouzon J, Rivera L, Ancel PY, Blondel B,
Kaminski M: Fetal sex and preterm birth: are males at greater risk? Hum Reprod 2002, 17:2762-2768.
38. Kent AL, Wright IM, Abdel-Latif ME: Mortality and adverse neurologic outcomes are greater in preterm male infants. Pediatrics 2012, 129:124-131.
39. Ananth CV, Vintzileos AM: Epidemiology of preterm birth and its clinical subtypes. J Matern Fetal Neonatal Med 2006, 19:773-782.
40. Patel RR, Steer P, Doyle P, Little MP, Elliott P: Does gestation vary by ethnic group? A London-based study of over 122,000 pregnancies with spontaneous onset of labour. Int J Epidemiol 2004, 33:107-113.
41. Farrell PM, Wood RE: Epidemiology of hyaline membrane disease in the United States: analysis of national mortality statistics. Pediatrics 1976, 58:167-176.
42. Alexander GR, Kogan M, Bader D, Carlo W, Allen M, Mor J: US birth weight/gestational age-specifi c neonatal mortality: 1995-1997 rates for whites, hispanics, and blacks. Pediatrics 2003, 111:e61-66.
43. Gyamfi -Bannerman C, Fuchs KM, Young OM, Hoff man MK: Nonspontaneous late preterm birth: etiology and outcomes. Am J Obstet Gynecol 2011, 205:456 e451-456.
44. Mukhopadhaya N, Arulkumaran S: Reproductive outcomes after in-vitro fertilization. Curr Opin Obstet Gynecol 2007, 19:113-119.
45. Kalra SK, Molinaro TA: The association of in vitro fertilization and perinatal morbidity. Semin Reprod Med 2008, 26:423-435.
46. Joseph KS, Demissie K, Kramer MS: Obstetric intervention, stillbirth, and preterm birth. Semin Perinatol 2002, 26:250-259.
47. Joseph KS, Kramer MS, Marcoux S, Ohlsson A, Wen SW, Allen A, Platt R: Determinants of preterm birth rates in Canada from 1981 through 1983 and from 1992 through 1994. N Engl J Med 1998, 339:1434-1439.
48. Barros FC, Velez Mdel P: Temporal trends of preterm birth subtypes and neonatal outcomes. Obstet Gynecol 2006, 107:1035-1041.
49. Alhaj AM, Radi EA, Adam I: Epidemiology of preterm birth in Omdurman Maternity hospital, Sudan. J Matern Fetal Neonatal Med 2010, 23:131-134.
50. Ip M, Peyman E, Lohsoonthorn V, Williams MA: A case-control study of preterm delivery risk factors according to clinical subtypes and severity. J Obstet Gynaecol Res 2010, 36:34-44.
51. Nkyekyer K, Enweronu-Laryea C, Boafor T: Singleton preterm births in korle bu teaching hospital, accra, ghana - origins and outcomes. Ghana Med J 2006, 40:93-98.
52. Klebanoff MA, Shiono PH: Top down, bottom up and inside out: refl ections on preterm birth. Paediatr Perinat Epidemiol 1995, 9:125-129.
53. Kramer MS, McLean FH, Boyd ME, Usher RH: The validity of gestational age estimation by menstrual dating in term, preterm, and postterm gestations. JAMA 1988, 260:3306-3308.
54. ICD-10: international statistical classifi ciation of diseases and related health problems: tenth revision.- 2nd ed. [http://www.who.int/classifi cations/icd/ICD-10_2nd_ed_volume2.pdf ]
55. Froen JF, Gordijn SJ, Abdel-Aleem H, Bergsjo P, Betran A, Duke CW, Fauveau V, Flenady V, Hinderaker SG, Hofmeyr GJ, et al: Making stillbirths count, making numbers talk - issues in data collection for stillbirths. BMC Pregnancy Childbirth 2009, 9:58.
56. Annual Reports for the years 1991 and 1999. Melbourne:Consultative Council on Obstetrics and Paediatric Mortality and Morbidity, 1992 and 2001
57. MRC PPIP Users, the Saving Babies Technical Task Team: Saving Babies 2008-2009. Seventh report on perinatal care in South Africa. 2010.
58. Miljeteig I, Johansson KA, Sayeed SA, Norheim OF: End-of-life decisions as bedside rationing. An ethical analysis of life support restrictions in an Indian neonatal unit. J Med Ethics 2010, 36:473-478.
59. Lumley J: Defi ning the problem: the epidemiology of preterm birth. BJOG 2003, 110 Suppl 20:3-7.
60. Millennium, Development Goals Indicators [http://mdgs.un.org/unsd/mdg/Default.aspx Accessed 3rd January 2012]
61. Katz J, Lee AC, Kozuki N, Lawn JE, Cousens S, Blencowe H, Ezzati M, Bhutta ZA, Marchant T, Willey BA, et al: Mortality risk in preterm and small-for-gestational-age infants in low-income and middle-income countries: a pooled country analysis. Lancet 2013.
62. Saigal S, Doyle LW: An overview of mortality and sequelae of preterm birth from infancy to adulthood. Lancet 2008, 371:261-269.
63. Mohangoo AD, Buitendijk SE, Szamotulska K, Chalmers J, Irgens LM, Bolumar F, Nijhuis JG, Zeitlin J: Gestational age patterns of fetal and neonatal
Blencowe et al. Reproductive Health 2013, 10(Suppl 1):S2http://www.reproductive-health-journal.com/content/10/S1/S2
Page 13 of 14
mortality in europe: results from the Euro-Peristat project. PLoS One 2011, 6:e24727.
64. Lawn JE, Davidge R, Paul VK, von Xylander S, de Graft Johnson J, Costello A, Kinney MV, Segre J, Molyneux L: Born Too Soon: Care for the preterm baby. Reprod Health 2013, 10(Suppl 1):S5.
65. Davidoff MJ, Dias T, Damus K, Russell R, Bettegowda VR, Dolan S, Schwarz RH, Green NS, Petrini J: Changes in the gestational age distribution among U.S. singleton births: impact on rates of late preterm birth, 1992 to 2002. Semin Perinatol 2006, 30:8-15.
66. Dean SV, Mason EM, Howson CP, Lassi ZS, Imam AM, Bhutta ZA: Born Too Soon: Care before and between pregnancy to prevent preterm births: from evidence to action. Reprod Health 2013, 10(Suppl 1):S3.
67. Requejo J, Althabe F, Merialdi M, Keller K, Katz J, Menon R: Born Too Soon: Care during pregnancy and childbirth to reduce preterm deliveries and improve health outcomes of the preterm baby. Reprod Health 2013, 10(Suppl 1):S4.
68. Kramer MS, Demissie K, Yang H, Platt RW, Sauve R, Liston R: The contribution of mild and moderate preterm birth to infant mortality. Fetal and Infant Health Study Group of the Canadian Perinatal Surveillance System. JAMA 2000, 284:843-849.
69. Femitha P, Bhat BV: Early Neonatal Outcome in Late Preterms. Indian J Pediatr 2011.
70. Escobar GJ, Clark RH, Greene JD: Short-term outcomes of infants born at 35 and 36 weeks gestation: we need to ask more questions. Semin Perinatol 2006, 30:28-33.
71. Teune MJ, Bakhuizen S, Gyamfi Bannerman C, Opmeer BC, van Kaam AH, van Wassenaer AG, Morris JM, Mol BW: A systematic review of severe morbidity in infants born late preterm. Am J Obstet Gynecol 2011, 205:374 e371-379.
72. Quigley MA, Poulsen G, Boyle E, Wolke D, Field D, Alfi revic Z, Kurinczuk JJ: Early term and late preterm birth are associated with poorer school performance at age 5 years: a cohort study. Arch Dis Child Fetal Neonatal Ed 2012.
73. Woythaler MA, McCormick MC, Smith VC: Late preterm infants have worse 24-month neurodevelopmental outcomes than term infants. Pediatrics 2011, 127:e622-629.
74. Petrou S, Eddama O, Mangham L: A structured review of the recent literature on the economic consequences of preterm birth. Arch Dis Child Fetal Neonatal Ed 2011, 96:F225-232.
75. Limburg H, Gilbert C, Hon do N, Dung NC, Hoang TH: Prevalence and causes of blindness in children in Vietnam. Ophthalmology 2012, 119:355-361.
76. Zepeda-Romero LC, Barrera-de-Leon JC, Camacho-Choza C, Gonzalez Bernal C, Camarena-Garcia E, Diaz-Alatorre C, Gutierrez-Padilla JA, Gilbert C:
Retinopathy of prematurity as a major cause of severe visual impairment and blindness in children in schools for the blind in Guadalajara city, Mexico. Br J Ophthalmol 2011, 95:1502-1505.
77. Born Too Soon : The Global Action Report on Preterm Birth: Eds. Howson CP, Kinney MV, Lawn JE. March of Dimes, PMNCH, Save the Children, World Health Organization. New York 2012 http://www.who.int/pmnch/media/news/2012/preterm_birth_report/en/index1.html; 2012.
78. Keeping promises, measuring results: Commission on Information and Accountability for Women’s and Children’s Health
79. Blencowe H, Cousens S, Chou D, Oestergaard MZ, Say L, Moller A, Kinney M, Lawn J: Chapter 2: 15 million preterm births: Priorities for action based on national, regional and global estimates. In Born Too Soon: the Global Action Report on Preterm Birth. Edited by Howson CP KM, Lawn JE. New York 2012: March of Dimes, PMNCH, Save the Children, World Health Organization, New York 2012 http://www.who.int/pmnch/media/news/2012/borntoosoon_chapter2.pdf 2012
80. O’Connor AR, Wilson CM, Fielder AR: Ophthalmological problems associated with preterm birth. Eye (Lond) 2007, 21:1254-1260.
81. Marlow N, Wolke D, Bracewell MA, Samara M: Neurologic and developmental disability at six years of age after extremely preterm birth. N Engl J Med 2005, 352:9-19.
82. Doyle LW, Ford G, Davis N: Health and hospitalistions after discharge in extremely low birth weight infants. Semin Neonatol 2003, 8:137-145.
83. Greenough A: Long term respiratory outcomes of very premature birth (<32 weeks). Semin Fetal Neonatal Med 2012, 17:73-76.
84. Mwaniki MK, Atieno M, Lawn JE, Newton CR: Long-term neurodevelopmental outcomes after intrauterine and neonatal insults: a systematic review. Lancet 2012, 379:445-452.
85. Hagberg B, Hagberg G, Beckung E, Uvebrant P: Changing panorama of cerebral palsy in Sweden. VIII. Prevalence and origin in the birth year period 1991-94. Acta Paediatr 2001, 90:271-277.
86. Singer LT, Salvator A, Guo S, Collin M, Lilien L, Baley J: Maternal psychological distress and parenting stress after the birth of a very low-birth-weight infant. JAMA 1999, 281:799-805.
doi:10.1186/1742-4755-10-S1-S2Cite this article as: Blencowe H, et al.: Born Too Soon: The global epidemiology of 15 million preterm births. Reproductive Health 2013, 10(Suppl 1):S2.
Blencowe et al. Reproductive Health 2013, 10(Suppl 1):S2http://www.reproductive-health-journal.com/content/10/S1/S2
Page 14 of 14