Embed Size (px)
Citation preview

Born to Win, Schooled to LoseWhy Equally Talented Students Don’t Get Equal Chances to Be All They Can Be
ANTHONY P. CARNEVALEMEGAN L. FASULESMICHAEL C. QUINNKATHRYN PELTIER CAMPBELL
2019
Reprint Permission
The Georgetown University Center on Education and the Workforce carries a Creative Commons license, which permits non-commercial reuse of any of our content when proper attribution is provided.
You are free to copy, display, and distribute our work, or include our content in derivative works, under the CEW’s following conditions:
Attribution: You must clearly attribute the work to the Georgetown University Center on Education and the Workforce and provide a print or digital copy of the work to [email protected].
Our preference is to cite figures and tables as follows:
Source: Georgetown University Center on Education and the Workforce, Born to Win, Schooled to Lose: Why Equally Talented Students Don’t Get Equal Chances to Be All They Can Be, 2019.
Non-commercial use: You may not use this work for commercial purposes. Written permission must be obtained from the owners of the copy/literary rights and from Georgetown University for any publication or commercial use of reproductions.
Approval: If you are using one or more of our available data representations (figures, charts, tables, etc.), please visit our website at cew.georgetown.edu/publications/reprint-permission for more information.
For the full legal code of this Creative Commons license, please visit creativecommons.org.
Email [email protected] with any questions.

Anthony P. CarnevaleMegan L. FasulesMichael C. Quinn
Kathryn Peltier Campbell
2019
Born to Win, Schooled to LoseWhy Equally Talented Students Don’t Get Equal
Chances to Be All They Can Be
GEORGETOWN UNIVERSITY CENTER ON EDUCATION AND THE WORKFORCEiv vBORN TO WIN, SCHOOLED TO LOSE
Tenth GradeEighth Grade College Early Career
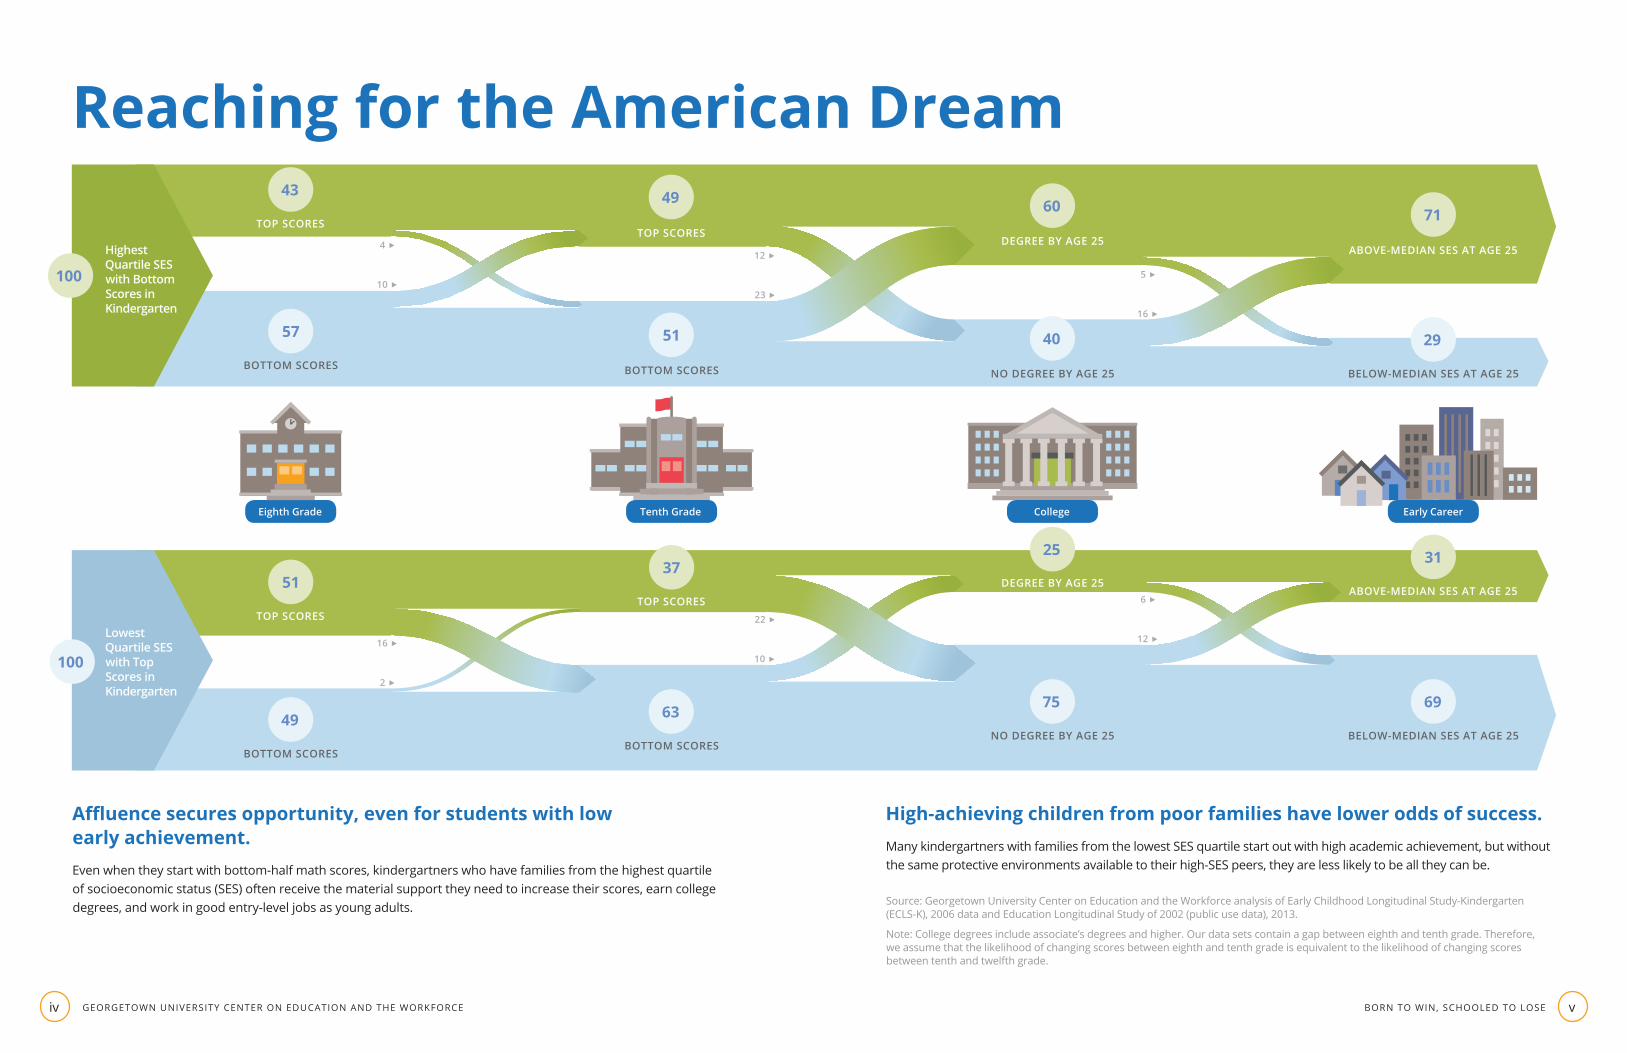
Reaching for the American Dream
Affluence secures opportunity, even for students with low early achievement.Even when they start with bottom-half math scores, kindergartners who have families from the highest quartile of socioeconomic status (SES) often receive the material support they need to increase their scores, earn college degrees, and work in good entry-level jobs as young adults.
High-achieving children from poor families have lower odds of success.Many kindergartners with families from the lowest SES quartile start out with high academic achievement, but without the same protective environments available to their high-SES peers, they are less likely to be all they can be.
Source: Georgetown University Center on Education and the Workforce analysis of Early Childhood Longitudinal Study-Kindergarten (ECLS-K), 2006 data and Education Longitudinal Study of 2002 (public use data), 2013.
Note: College degrees include associate’s degrees and higher. Our data sets contain a gap between eighth and tenth grade. Therefore, we assume that the likelihood of changing scores between eighth and tenth grade is equivalent to the likelihood of changing scores between tenth and twelfth grade.
4 F
16 F
22 F
12 F
5 F
6 F
10 F
2 F
10 F
23 F
16 F
12 F
43
TOP SCORES
57
BOTTOM SCORES
51
TOP SCORES
49
BOTTOM SCORES
49
TOP SCORES
51
BOTTOM SCORES
37
TOP SCORES
63
BOTTOM SCORES
60
DEGREE BY AGE 25
40
NO DEGREE BY AGE 25
25
DEGREE BY AGE 25
75
NO DEGREE BY AGE 25
71
ABOVE-MEDIAN SES AT AGE 25
29
BELOW-MEDIAN SES AT AGE 25
31
ABOVE-MEDIAN SES AT AGE 25
69
BELOW-MEDIAN SES AT AGE 25
Lowest Quartile SESwith Top Scores in Kindergarten
Highest Quartile SESwith Bottom Scores in Kindergarten
100
100

AcknowledgmentsWe are grateful to the individuals and organizations whose generous support has made this report possible: Lumina Foundation (Jamie Merisotis, Wendy Sedlak, Holly Zanville, and Susan D. Johnson); the Bill & Melinda Gates Foundation (Patrick Methvin and Jamey Rorison); the Joyce Foundation (Sameer Gadkaree); and the Annie E. Casey Foundation (Bob Giloth and Allison Gerber). We are honored to be their partners in our shared mission of promoting postsecondary access, completion, and career success for all Americans.
The staff of the Georgetown University Center on Education and the Workforce was instrumental in the production of this report from conception to publication. In particular, we would like to thank
� Jeff Strohl for research direction;
� Andrea Porter for strategic guidance;
� Nicole Smith for economic methodology;
� Martin Van Der Werf, Tanya I. Garcia, and Artem Gulish for editorial and qualitative feedback;
� Hilary Strahota, Vikki Hartt Salinkas, Emma Wenzinger, and Frank Zhang for communications efforts, including design development and public relations; and
� Joe Leonard and Coral Castro for assistance with logistics and operations.
Many others contributed their thoughts and feedback throughout the production of this report. We especially are grateful to our talented designers, editorial advisors, and printers, whose efforts were vital to this report’s successful completion. We would also like to thank Brian Bridges of the United Negro College Fund, who provided feedback on an earlier version of this report, and Vanessa Scanfeld of the Harlem Academy, whose questions encouraged us to explore this topic.
The views expressed in this publication are those of the authors and do not necessarily represent those of Lumina Foundation, the Bill & Melinda Gates Foundation, the Joyce Foundation, or the Annie E. Casey Foundation, or any of their officers or employees. All errors and omissions are the responsibility of the authors.

ContentsIntroduction . . . . . . . . . . . . . . . . . . . . . . . . . . . . . . . . . . . . . . . . . . . . . . . . . . . . . . . . . . . . . 1
Key Findings . . . . . . . . . . . . . . . . . . . . . . . . . . . . . . . . . . . . . . . . . . . . . . . . . . . . . . . . . . . 5
Part 1: Conditioned by Unequal Environments . . . . . . . . . . . . . . . . . . . . . . . . . . . . . 8
The environment that high socioeconomic status can provide tends to protect children and propel them to succeed. . . . . . . . . . . . . . . . . . . . . . . . . . . . 9
Advantaged children benefit from their parents’ habits and educational experiences. . . . . . . . . . . . . . . . . . . . . . . . . . . . . . . . . . . . . . . . . . . . 11
Schools and peers contribute to upper-class advantage. . . . . . . . . . . . . . . . . . . . . 13
Black and Latino children in particular face the additional challenges of discrimination and segregation. . . . . . . . . . . . . . . . . . . . . . . . . . . . . . . . . . . . . . . 14
Education has the potential to be the great equalizer. . . . . . . . . . . . . . . . . . . . . . . 16
Part 2: Traveling the Uneven Academic Pathway . . . . . . . . . . . . . . . . . . . . . . . . . . 17
Academic gaps are already large in the first year of school. . . . . . . . . . . . . . . . . . 17
The more disadvantaged children are, the less likely they are to recover if their test scores fall. . . . . . . . . . . . . . . . . . . . . . . . . . . . . . . . . . . . . . . . . . . . . . . . . . 18
Advantage helps propel students toward academic success. . . . . . . . . . . . . . . . . 19
The effects of advantage and disadvantage continue through high school— but paths are less likely to change at that point. . . . . . . . . . . . . . . . . . . . . . . . . . . . 20
K–12 academic development and socioeconomic status both play a role in college enrollment and completion. . . . . . . . . . . . . . . . . . . . . . . . . . . . . . . . . . . . 23
Race and ethnicity interact with socioeconomic status to affect students’ likelihood of achieving and maintaining academic success. . . . . . . . . . 25
K–16 academic performance has lasting consequences. . . . . . . . . . . . . . . . . . . . . 31
Part 3: Early Career Success . . . . . . . . . . . . . . . . . . . . . . . . . . . . . . . . . . . . . . . . . . . . . 32
Students with high test scores in 10th grade have better chances of early career success regardless of race or ethnicity. . . . . . . . . . . . . . . . . . . . . . . . . . . . . 34
By facing and addressing the facts, we can revive the American Dream. . . . . . . 37
Conclusion . . . . . . . . . . . . . . . . . . . . . . . . . . . . . . . . . . . . . . . . . . . . . . . . . . . . . . . . . . . . . 38
Policy Recommendations . . . . . . . . . . . . . . . . . . . . . . . . . . . . . . . . . . . . . . . . . . . . . . . 39
References . . . . . . . . . . . . . . . . . . . . . . . . . . . . . . . . . . . . . . . . . . . . . . . . . . . . . . . . . . . . . 41
Appendix A: Data Sources and Methodology . . . . . . . . . . . . . . . . . . . . . . . . . . . . . . 45
Appendix B: Robustness Checks . . . . . . . . . . . . . . . . . . . . . . . . . . . . . . . . . . . . . . . . . . 47
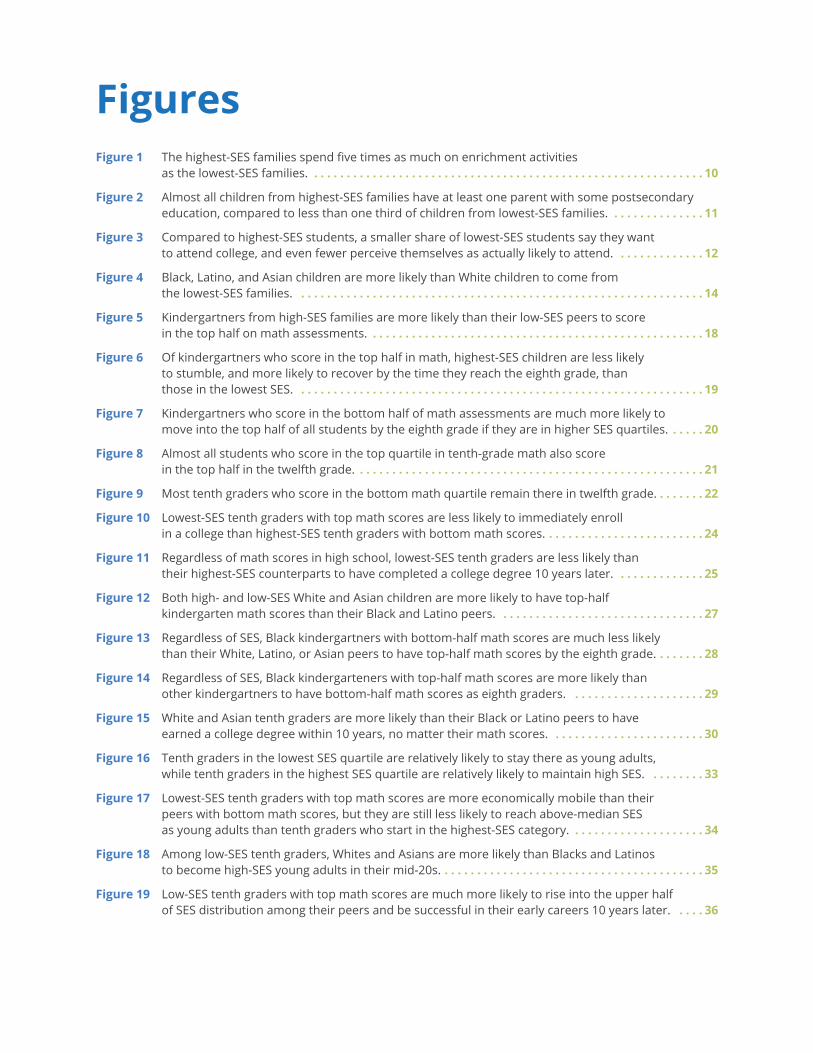
FiguresFigure 1 The highest-SES families spend five times as much on enrichment activities
as the lowest-SES families. . . . . . . . . . . . . . . . . . . . . . . . . . . . . . . . . . . . . . . . . . . . . . . . . . . . . . . . . . . . . 10
Figure 2 Almost all children from highest-SES families have at least one parent with some postsecondary education, compared to less than one third of children from lowest-SES families. . . . . . . . . . . . . . . 11
Figure 3 Compared to highest-SES students, a smaller share of lowest-SES students say they want to attend college, and even fewer perceive themselves as actually likely to attend. . . . . . . . . . . . . . 12
Figure 4 Black, Latino, and Asian children are more likely than White children to come from the lowest-SES families. . . . . . . . . . . . . . . . . . . . . . . . . . . . . . . . . . . . . . . . . . . . . . . . . . . . . . . . . . . . . . . 14
Figure 5 Kindergartners from high-SES families are more likely than their low-SES peers to score in the top half on math assessments. . . . . . . . . . . . . . . . . . . . . . . . . . . . . . . . . . . . . . . . . . . . . . . . . . . . 18
Figure 6 Of kindergartners who score in the top half in math, highest-SES children are less likely to stumble, and more likely to recover by the time they reach the eighth grade, than those in the lowest SES. . . . . . . . . . . . . . . . . . . . . . . . . . . . . . . . . . . . . . . . . . . . . . . . . . . . . . . . . . . . . . . 19
Figure 7 Kindergartners who score in the bottom half of math assessments are much more likely to move into the top half of all students by the eighth grade if they are in higher SES quartiles. . . . . . 20
Figure 8 Almost all students who score in the top quartile in tenth-grade math also score in the top half in the twelfth grade. . . . . . . . . . . . . . . . . . . . . . . . . . . . . . . . . . . . . . . . . . . . . . . . . . . . . . 21
Figure 9 Most tenth graders who score in the bottom math quartile remain there in twelfth grade. . . . . . . . 22
Figure 10 Lowest-SES tenth graders with top math scores are less likely to immediately enroll in a college than highest-SES tenth graders with bottom math scores. . . . . . . . . . . . . . . . . . . . . . . . . 24
Figure 11 Regardless of math scores in high school, lowest-SES tenth graders are less likely than their highest-SES counterparts to have completed a college degree 10 years later. . . . . . . . . . . . . . 25
Figure 12 Both high- and low-SES White and Asian children are more likely to have top-half kindergarten math scores than their Black and Latino peers. . . . . . . . . . . . . . . . . . . . . . . . . . . . . . . . 27
Figure 13 Regardless of SES, Black kindergartners with bottom-half math scores are much less likely than their White, Latino, or Asian peers to have top-half math scores by the eighth grade. . . . . . . . 28
Figure 14 Regardless of SES, Black kindergarteners with top-half math scores are more likely than other kindergartners to have bottom-half math scores as eighth graders. . . . . . . . . . . . . . . . . . . . . 29
Figure 15 White and Asian tenth graders are more likely than their Black or Latino peers to have earned a college degree within 10 years, no matter their math scores. . . . . . . . . . . . . . . . . . . . . . . . 30
Figure 16 Tenth graders in the lowest SES quartile are relatively likely to stay there as young adults, while tenth graders in the highest SES quartile are relatively likely to maintain high SES. . . . . . . . . 33
Figure 17 Lowest-SES tenth graders with top math scores are more economically mobile than their peers with bottom math scores, but they are still less likely to reach above-median SES as young adults than tenth graders who start in the highest-SES category. . . . . . . . . . . . . . . . . . . . . 34
Figure 18 Among low-SES tenth graders, Whites and Asians are more likely than Blacks and Latinos to become high-SES young adults in their mid-20s. . . . . . . . . . . . . . . . . . . . . . . . . . . . . . . . . . . . . . . . . 35
Figure 19 Low-SES tenth graders with top math scores are much more likely to rise into the upper half of SES distribution among their peers and be successful in their early careers 10 years later. . . . . 36
1BORN TO WIN, SCHOOLED TO LOSE
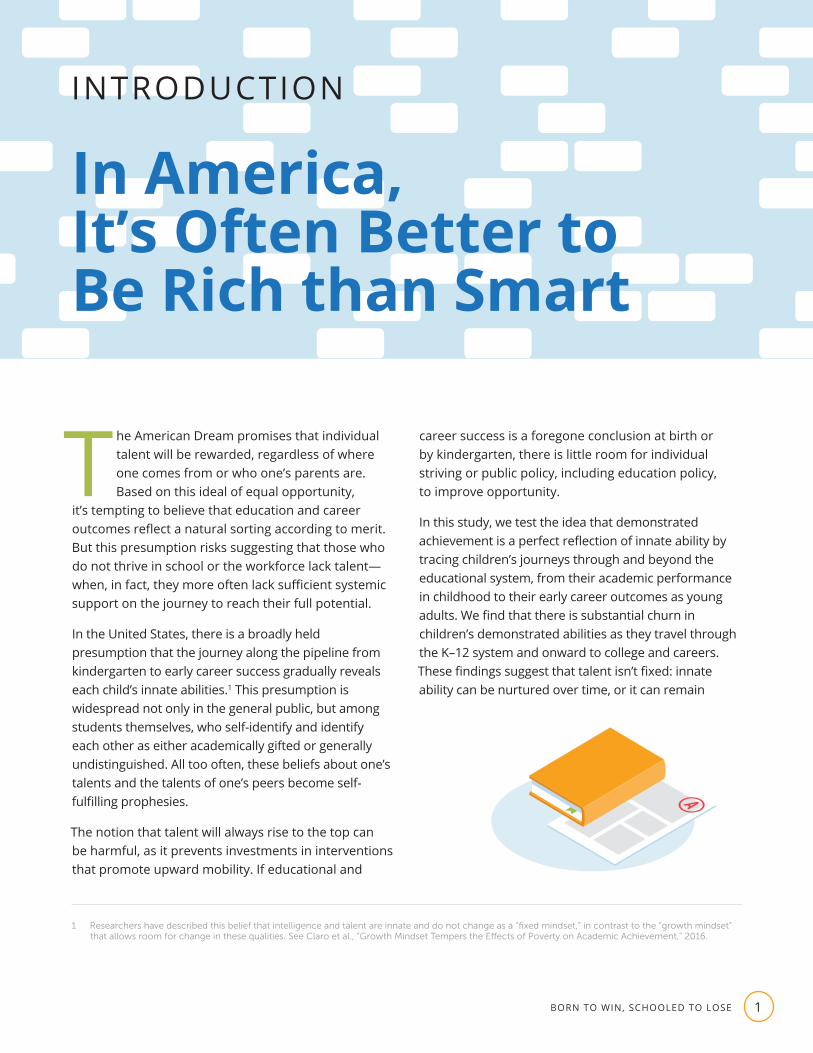
The American Dream promises that individual talent will be rewarded, regardless of where one comes from or who one’s parents are. Based on this ideal of equal opportunity,
it’s tempting to believe that education and career outcomes reflect a natural sorting according to merit. But this presumption risks suggesting that those who do not thrive in school or the workforce lack talent—when, in fact, they more often lack sufficient systemic support on the journey to reach their full potential.
In the United States, there is a broadly held presumption that the journey along the pipeline from kindergarten to early career success gradually reveals each child’s innate abilities.1 This presumption is widespread not only in the general public, but among students themselves, who self-identify and identify each other as either academically gifted or generally undistinguished. All too often, these beliefs about one’s talents and the talents of one’s peers become self-fulfilling prophesies.
The notion that talent will always rise to the top can be harmful, as it prevents investments in interventions that promote upward mobility. If educational and
1 Researchers have described this belief that intelligence and talent are innate and do not change as a “fixed mindset,” in contrast to the “growth mindset” that allows room for change in these qualities. See Claro et al., “Growth Mindset Tempers the Effects of Poverty on Academic Achievement,” 2016.
career success is a foregone conclusion at birth or by kindergarten, there is little room for individual striving or public policy, including education policy, to improve opportunity.
In this study, we test the idea that demonstrated achievement is a perfect reflection of innate ability by tracing children’s journeys through and beyond the educational system, from their academic performance in childhood to their early career outcomes as young adults. We find that there is substantial churn in children’s demonstrated abilities as they travel through the K–12 system and onward to college and careers. These findings suggest that talent isn’t fixed: innate ability can be nurtured over time, or it can remain
INTRODUCTION
In America, It’s Often Better to Be Rich than Smart

GEORGETOWN UNIVERSITY CENTER ON EDUCATION AND THE WORKFORCE2
underdeveloped. The education system can play a role in whether children reach their full potential.
Early measures of academic talent do not predetermine children’s educational and career outcomes. Many children start with low measured abilities, but show improvement at various points along the educational and early career pathway. In contrast, many start out with high measured abilities but stumble along the way from kindergarten to high school, college, and early careers. Some who stumble recover, and others don’t; some who climb maintain their footing, while others slide back toward lower academic achievement.
Our findings suggest both a good-news and a bad-news story. The good news is that early academic performance is not destiny and that individual striving, educational quality, and policy matter. The bad news is that our existing systems distribute opportunity based on income, class status, race, and ethnicity rather than hard work and talent. As a result, race and class also matter when it comes to children’s life chances.
Money trumps talent when it comes to the prospects of the poor and the working class.
For most children from low-income and working-class families, especially those who are Black or Latino,2 academic promise alone is not enough to secure their place among the middle or upper class. When poor children succeed, they often do so in spite of environments that impede their success—without access to the material supports and social advantages that protect and propel affluent students. Historic and ongoing segregation and discrimination create additional challenges for Black and Latino children, and those challenges are compounded if they are from poor families. As a result, their academic and career success is less certain. For Asian students, the story is similar
2 In this report, we use the term Black to refer to people who identify as Black or African American and the term Latino to refer to people who identify as Hispanic or Latino. We use single terms for different racial and ethnic groups—White, Black, Latino, and Asian—to alleviate ambiguity and enhance clarity. In charts and tables, we use White, Black/African American, Hispanic/Latino, and Asian/Pacific Islander.
in some ways, but different in others: in kindergarten, poor Asians are less likely to have top test scores than their poor White peers, but by the end of the academic pipeline, they are more likely to attain a college degree than those from other racial and ethnic groups.
In general, money trumps talent when it comes to the prospects of the poor and the working class. In other words, if you come from a poor or working-class family, the chances are slim that you’ll be able to be all that you can be. Conversely, innate ability has a much better chance to shine through for upper-class children, who predominantly are White. For these more advantaged youth, signs of high potential in early childhood accurately predict success in college and the labor market. For the most part, if you come from a more advantaged family, you get the best shot at being all you can be.
People of all abilities and backgrounds experience false starts and stumbles. But advantaged students in the middle and upper classes are guided by helping hands that usher them along the academic pathway. Meanwhile, economically disadvantaged students, even those with academic potential and performance similar to those of their affluent peers, are more likely to fall and stay behind. When students from affluent families stumble, they have a softer landing and assistance getting back up, while those in adverse environments land on rocky ground that does little to help them bounce back.
Thus, children from families with low socioeconomic standing and racial or ethnic minority status are too often left behind in our schools and in our society. For a majority of these children, upward economic mobility is not within reach. Among students from families with low socioeconomic status, half who had high test scores in kindergarten have already fallen behind by eighth grade. And Black and Latino students, regardless of class, face additional systemic barriers to achievement. The picture for Black students is particularly bleak: among economically disadvantaged students, 6 in 10 Black students who had above-median test scores as

3BORN TO WIN, SCHOOLED TO LOSE
kindergartners have been left behind by eighth grade, compared to fewer than 4 in 10 White and Latino students and 2 in 10 Asian students.3
It is critical to note that these students do not lack the innate talent to succeed—and when they do beat the odds and make it into adolescence as high achievers, their chances of college and career achievement are good. An economically disadvantaged student who has high test scores in tenth grade has double the chance of graduating from college within 10 years and being middle or upper class as a young adult compared to his or her peers with low test scores.
Even a child who stumbles and struggles early on can beat the odds and become a successful adult, and the fact that children’s test scores change over time shows that there is room for intervention. But a child’s chance of improvement depends largely on social class: a child with low test scores in kindergarten who comes from an affluent family is more than twice as likely to have high test scores in eighth grade as a similarly scoring child from a poor family. And the gap doesn’t exist because affluent children are smarter than poor children—it’s because income and social status provide access to environments that allow children to develop to their full potential, all but ensuring their success. Privileged children have safety nets to break their falls if they stumble and helping hands to lift them back up. In contrast, disadvantaged children are out of luck. The likelihood of success is too often determined by a child’s family background, not by his or her talent.
For most children, the chance of making it depends on their access to environments that nurture and promote success. Throughout their youth, relatively
3 While we have aggregated Asian and Pacific Islander groups in this report due to small sample sizes, we recognize that Pacific Islanders show different achievement patterns than Asians. For further discussion, see Sablan, “Pacific Islanders and College Readiness,” 2015.
advantaged children enjoy more protective and enriched environments, which help them realize their full potential by the time they become young adults. Supported by their parents’ social and economic capital, their neighborhoods’ well-funded and academically challenging schools, and their access to empowering social networks, they are typically able to overcome barriers to achievement. Meanwhile, equally talented children from low-income backgrounds are held back by material disadvantages, such as a lack of access to enrichment activities, underfunded schools, poorly maintained neighborhood infrastructure, and limited interaction with role models who have postsecondary experience. These disadvantages are compounded by racial and ethnic inequities.
As a society, we aren’t doing enough to ensure that equally talented children have equal access to affirming environments. There are things we can do to even the odds. In the interaction between nature and nurture, the education system plays a critical role and can act as a lever: with adequate resources, schools can influence students’ development of skills and abilities and, ultimately, their socioeconomic mobility through advanced educational attainment. Thus, education policy can make the difference between whether children fulfill their potential or fall by the wayside.
Even a child who stumbles and struggles early on can beat the odds and become a successful adult.
Children who have the least will benefit most from improved support and resources. Research has shown that for poor children, home and school environments have a significant impact on educational attainment, and whether children are naturally predisposed toward academic achievement is close to irrelevant. For affluent children, however, the opposite holds: among children

GEORGETOWN UNIVERSITY CENTER ON EDUCATION AND THE WORKFORCE4
already ensconced within well-resourced environments, almost all variation in educational attainment is attributable to genes.4 Without intervention, a student’s class status will predict his or her test scores, and innate ability will reliably translate into developed ability for the affluent, but not for the poor. Only with intervention can all students’ innate abilities shine through.
Rather than settle for the status quo, we need to successfully leverage education to clear the pathway to opportunity for all, regardless of background. Top-performing students should not be allowed to fall behind because of their class, race, or ethnicity. At present, throughout the K–12 pipeline, economically disadvantaged students are more likely to lose ground at each point along the way. We lose the most talent from underdevelopment before high school: 49 percent of economically disadvantaged students who had above-median math scores in kindergarten have below-median scores in eighth grade. But the leaks in the talent pipeline don’t end there. Every year, US high schools graduate 500,000 college-ready students who
4 Turkheimer et al., “Socioeconomic Status Modifies Heritability of IQ in Young Children,” 2003.
5 Carnevale, “Every Year, Half a Million Top-Scoring Students Never Get a College Credential,” 2018.
6 For workers without a bachelor’s degree, good jobs pay a median of $56,000 per year. Carnevale et al., Three Educational Pathways to Good Jobs, 2018.
never get a college credential.5 We must put a stop to the tremendous loss of talent that currently results from underdeveloped potential.
Indeed, the early sorting of children into “haves” and “have-nots” has long-term consequences. Children who are initially set on a pathway of academic underachievement are less likely to enter college, graduate, and obtain jobs that will secure their place in the middle and upper classes. And it’s more important than ever that a child’s early pathway lead to some kind of postsecondary education. In today’s workforce, 56 percent of good jobs—those that pay a median of $65,000—go to workers with a bachelor’s degree, and an additional 24 percent go to workers with some education beyond high school.6 Early achievement puts children on track toward those good jobs.
In the modern knowledge economy, only by amending the inequities in our education system will we achieve anything close to equitable economic and social outcomes in society.
5BORN TO WIN, SCHOOLED TO LOSE
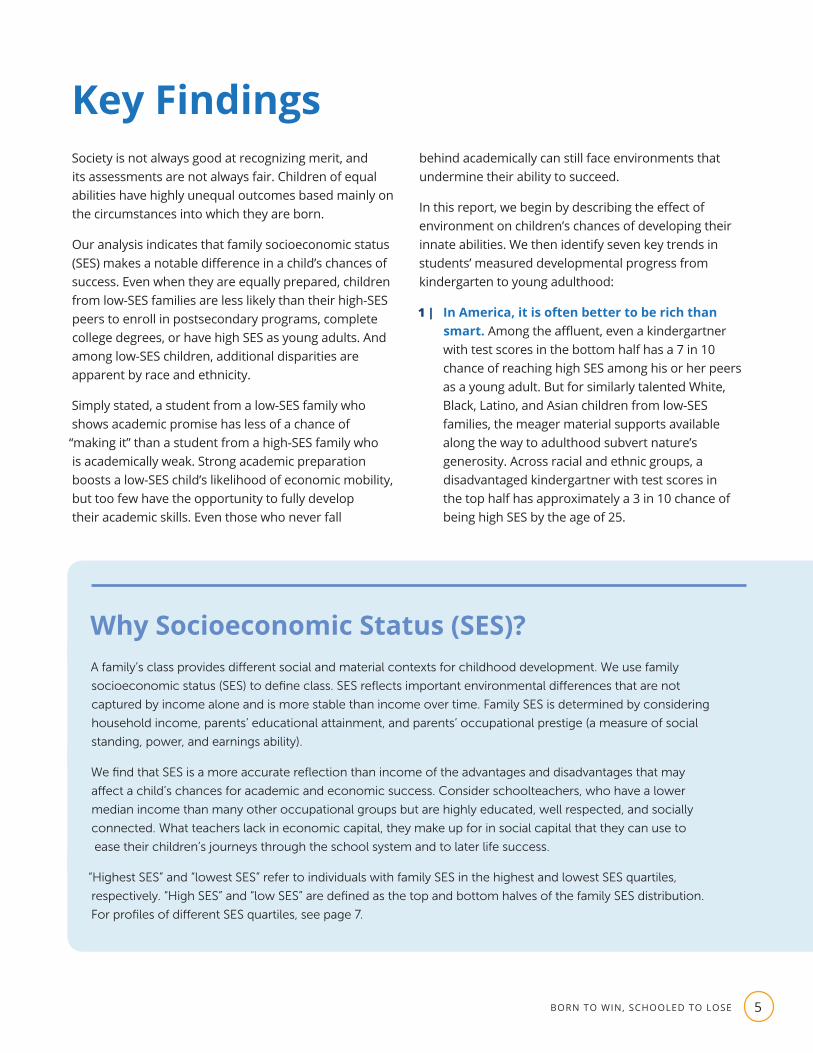
Key FindingsSociety is not always good at recognizing merit, and its assessments are not always fair. Children of equal abilities have highly unequal outcomes based mainly on the circumstances into which they are born.
Our analysis indicates that family socioeconomic status (SES) makes a notable difference in a child’s chances of success. Even when they are equally prepared, children from low-SES families are less likely than their high-SES peers to enroll in postsecondary programs, complete college degrees, or have high SES as young adults. And among low-SES children, additional disparities are apparent by race and ethnicity.
Simply stated, a student from a low-SES family who shows academic promise has less of a chance of “making it” than a student from a high-SES family who is academically weak. Strong academic preparation boosts a low-SES child’s likelihood of economic mobility, but too few have the opportunity to fully develop their academic skills. Even those who never fall
behind academically can still face environments that undermine their ability to succeed.
In this report, we begin by describing the effect of environment on children’s chances of developing their innate abilities. We then identify seven key trends in students’ measured developmental progress from kindergarten to young adulthood:
1 | In America, it is often better to be rich than smart. Among the affluent, even a kindergartner with test scores in the bottom half has a 7 in 10 chance of reaching high SES among his or her peers as a young adult. But for similarly talented White, Black, Latino, and Asian children from low-SES families, the meager material supports available along the way to adulthood subvert nature’s generosity. Across racial and ethnic groups, a disadvantaged kindergartner with test scores in the top half has approximately a 3 in 10 chance of being high SES by the age of 25.
Why Socioeconomic Status (SES)?A family’s class provides different social and material contexts for childhood development. We use family
socioeconomic status (SES) to define class. SES reflects important environmental differences that are not
captured by income alone and is more stable than income over time. Family SES is determined by considering
household income, parents’ educational attainment, and parents’ occupational prestige (a measure of social
standing, power, and earnings ability).
We find that SES is a more accurate reflection than income of the advantages and disadvantages that may
affect a child’s chances for academic and economic success. Consider schoolteachers, who have a lower
median income than many other occupational groups but are highly educated, well respected, and socially
connected. What teachers lack in economic capital, they make up for in social capital that they can use to
ease their children’s journeys through the school system and to later life success.
“Highest SES” and “lowest SES” refer to individuals with family SES in the highest and lowest SES quartiles,
respectively. “High SES” and “low SES” are defined as the top and bottom halves of the family SES distribution.
For profiles of different SES quartiles, see page 7.

GEORGETOWN UNIVERSITY CENTER ON EDUCATION AND THE WORKFORCE6
2 | Even at an early age, environmental disparities by class, race, and ethnicity are evident in measures of children’s achievement. Only about a quarter of lowest-SES kindergartners have top-half math scores, compared to around three-quarters of highest-SES kindergartners. Children’s early scores also vary by race, in part because Black and Latino children are twice as likely as White children to come from lowest-SES families.
3 | As children progress through primary school, they can improve on measures of achievement, but their chances of improvement correlate to their class status. Becoming high achieving is less likely for low-SES kindergartners with bottom-half math scores. By the eighth grade, fewer than 1 in 5 lowest-SES kindergartners with bottom-half math scores will score in the top half, compared to more than 2 in 5 highest-SES kindergartners with bottom-half math scores.
4 | A child from an advantaged class is more likely to maintain high scores than one from a poor family, and White and Asian children are more likely to do so than Black or Latino children. For low-SES students with top-half math scores, staying at the top throughout their academic journeys is difficult. In addition, Black and Latino students with top-half math scores in kindergarten are less likely than their White and Asian peers to persist in earning top scores.
5 | Achievement patterns are largely set by the time children enter high school. This is particularly evident for students with the lowest scores: students with bottom-quartile scores have difficulty improving their scores once they reach high school. Most tenth graders who score in the bottom math quartile will still score in the bottom quartile in twelfth grade.
6 | High school achievement sets the stage for college attainment—but family class plays an even greater role. The highest-SES students with bottom-half math scores are more likely to complete a college degree than the lowest-SES students with top-half math scores.
7 | Class mobility in America is limited—but education can be a lever for change. The lowest-SES tenth graders with top-half math scores are twice as likely to become high-SES (top-half) young adults as their peers with bottom-half math scores. Disadvantaged students who show promise can achieve, but their chances are better with interventions—and while lowest-SES tenth graders with bottom-half scores can become high SES, their chances are very slim.
Our findings suggest that families with high SES can provide their children with the material supports they need to maximize their chances at success in life. Meanwhile, disadvantaged families may be unable to provide the same environmental protections and enrichments—not because they don’t want the best for their children, but because systemic economic inequality bars their access to the social capital or material resources they need to give their children an advantage. In addition, the effects of racial segregation and discrimination continue to play out in children’s life chances.
In the face of these troubling dynamics, education can be the great equalizer—but only if we leverage its power to ensure equal access to the American Dream.
Why Math Scores?We use standardized math scores as a measure of
academic achievement. We focus on math scores
because our data set did not include twelfth-grade
reading scores. However, data on reading scores
indicate similar trends. See Appendix A for more
information on data sources and methodology and
Appendix B for more information on reading scores.

7BORN TO WIN, SCHOOLED TO LOSE
Profiles of SES Quartiles
Parental educational attainment Family income Examples of parental occupations
Low
est-
SES-
quar
tile
fa
mili
es
4%
56%37%
6%1% � Construction laborers
� Dental assistants � Dishwashers, cooks, and waiters � Packing machine operators � Personal care and childcare
workers � Taxi drivers � Welders
Seco
nd-S
ES-q
uart
ile
fam
ilies
13% 21%
49%
23%
7% � Administrative assistants � Automotive mechanics � Bus and truck drivers � Farmers and ranchers � Plumbers and pipefitters � Preschool and kindergarten
teachers � Retail salespersons
Thir
d-SE
S-qu
artil
e
fam
ilies 41%
7%
31%
35%
27%
� Electricians � Event planners � Firefighters � Flight attendants � Sales representatives � Social workers � Tool and die makers
Hig
hest
-SES
-qua
rtile
fa
mili
es
94%
11%
21%
67%
1% � Accountants and auditors � Architects and engineers � Lawyers, legislators, and judges � Natural and social scientists � Physicians, dentists, and nurses � Primary and secondary teachers � Programmers
Have a parent with a bachelor's degree
Less than $25,000 $25,000 to $50,000
$50,000 to $75,000 More than $75,000
Source: Georgetown University Center on Education and the Workforce analysis of Early Childhood Longitudinal Study-Kindergarten (public use data), 2006, and National Opinion Research Center (NORC), 2017.
GEORGETOWN UNIVERSITY CENTER ON EDUCATION AND THE WORKFORCE8
A child’s everyday interactions matter. Childhood development is powerfully informed by the who, where, and what of children’s lives: the people with whom they
interact, the places where they spend their time, and the activities in which they engage. Achievement is not merely a function of innate ability, but a cross product of a child’s inherent talent and the environment (the general social and material context) that determines the long-term development of potential abilities.7 When society fails to invest in ensuring that all children have access to nurturing environments, we pay the price in the form of unrealized potential.
The environment creates a dynamic that makes its mark early as intertwined advantages and disadvantages affect a child’s chances of success. Childhood environments have significant long-term effects on everything from health to educational achievement, and, as a result, on economic mobility and well-being.8 The influence of environment is far-reaching
7 See Hanson et al., “Family Poverty Affects the Rate of Human Infant Brain Growth,” 2013; Essex et al., “Epigenetic Vestiges of Early Developmental Adversity,” 2013; Boyce, “A Biology of Misfortune,” 2012; Sameroff, “A Unified Theory of Development,” 2010; and Phillips et al., “Family Background, Parenting Practices, and the Black–White Test Score Gap,” 1998.
8 See Melchior et al., “Why Do Children from Socioeconomically Disadvantaged Families Suffer from Poor Health When They Reach Adulthood?” 2007; and Evans and Kantrowitz, “Socioeconomic Status and Health,” 2002.
9 Bronfenbrenner and Morris, “The Ecology of Developmental Processes,” 1998.
10 Carneiro et al., “Labor Market Discrimination and Racial Differences in Premarket Factors,” 2005.
and cumulative: as people progress through different stages in life and new societal contexts, they carry their previous experiences with them. These experiences shape their acquisition of new skills, as well as their interactions with peers, parents, and teachers.9
Differences in cognitive and noncognitive skills start to appear in children growing up in disparate environments as early as age one or two.10 By the time children enter kindergarten, there are already substantial gaps in measured abilities. As children progress through primary (elementary and middle), secondary, and postsecondary schooling and into the labor market, gaps in developed ability grow and harden, even among those who start out with equal abilities. Supportive environments protect and propel students, while adverse environments erect hurdles that hamper children and reduce their chances of being all they can be.
The hallmarks of high socioeconomic status (SES)—high family income, a college education, and occupational
PART 1
Conditioned by Unequal Environments

9BORN TO WIN, SCHOOLED TO LOSE
prestige—are golden tickets to safe, opportunity-enhancing environments. While high- and low-SES families alike can and do provide crucial emotional support to their children, affluent families have more resources to provide materially supportive environments.11 Consequently, the children of the most well-off in society are ensconced in a protective environment that allows them to reach their full potential. Meanwhile, students from low-SES families
11 All families, regardless of SES, can provide emotional support, and emotional support matters. For example, low-income students who receive emotional support from their families are more likely to do well in their first year of college (Roksa and Kinsley, “The Role of Family Support in Facilitating Academic Success of Low-Income Students,” 2018). However, as this section discusses, high-SES families are more able to provide material resources that lower stress factors and enhance children’s well-being.
12 See Coleman et al., Equality of Educational Opportunity, 1966; Brooks-Gunn and Duncan, “The Effects of Poverty on Children,” 1997; and Reardon, “The Widening Academic Achievement Gap Between the Rich and the Poor,” 2011.
13 See Phillips et al., “Family Background, Parenting Practices, and the Black–White Test Score Gap,” 1998; and Rothstein, Class and Schools, 2004.
14 Turkheimer et al., “Socioeconomic Status Modifies Heritability of IQ in Young Children,” 2003; see also Papageorge and Thom, “Genes, Education, and Labor Market Outcomes,” 2018.
15 Georgetown University Center on Education and the Workforce analysis of data from US Census Bureau, American Community Survey (ACS), 2016.
16 Cotti et al., “When Does It Count?” 2017.
17 Alexander et al., “Lasting Consequences of the Summer Learning Gap,” 2007.
live in settings distinguished by fewer material and social advantages. Historic and ongoing race-based discrimination and segregation create additional challenges for Black and Latino children. Thus, SES, race, and ethnicity have strong and distinct relationships to children’s educational outcomes.12 Indeed, the disparate environments and social contexts students face are driving factors in the racial and class gaps in school achievement.13
The environment that high socioeconomic status can provide tends to protect children and propel them to succeed.
The time and money families invest in their children help determine those children’s chances of developing their inherited abilities.14 The highest-SES families are typically more able than the lowest-SES families to invest more financial resources in their children, for reasons often beyond these families’ control. The median earnings of the highest-SES individuals (those in the highest SES quartile) are approximately $40,000 more per year than those of the lowest-SES individuals (those in the lowest SES quartile),15 and that money translates directly into differences in the learning environments of their children.
Children of the most well-off in society are ensconced in a protective environment that allows them to reach their full potential.
One consequence of gaps in financial support is that highest-SES children are better able to concentrate on their education because they have fewer worries about basic needs such as food, clothing, and shelter.16 In addition, their families are better able to provide extra support that prevents them from slipping backward in school. For example, children from affluent families are less likely than those from poor families to fall behind over summer break because more affluent families tend to engage in more enrichment activities, such as summer camps and vacations.17

GEORGETOWN UNIVERSITY CENTER ON EDUCATION AND THE WORKFORCE10
As of 2016, families in the highest income quintile spent around $8,600 per year on child enrichment activities, which include recreation and education, whereas families in the lowest quintile spent around $1,700 per year (Figure 1). Because they can spend five times as much on goods and services, affluent families can give their children more access to novel experiences and related support, such as books, school supplies, computers, summer camps, music lessons, tutoring, childcare, and private schooling.
In addition to having access to more resources within the home, highest-SES children also have access to
18 Georgetown University Center on Education and the Workforce analysis of data from National Longitudinal Study of Adolescent to Adult Health Wave 1, 1994–95.
19 Carrell and Hoekstra, “Externalities in the Classroom,” 2010; and Peterson and Krivo, Divergent Social Worlds, 2010.
20 Georgetown University Center on Education and the Workforce analysis of data from National Longitudinal Study of Adolescent to Adult Health Wave 1, 1994–95.
21 See Burdick-Will, “School Violent Crime and Academic Achievement in Chicago,” 2013; and Sharkey et al., “High Stakes in the Classroom, High Stakes on the Street,” 2014.
better-maintained and safer neighborhoods. While over a quarter (28%) of lowest-SES children live in neighborhoods where a majority of buildings need at least minor (non-cosmetic) repairs, this is the case for only 4 percent of children from families in the highest SES quartile.18 Living in under-resourced neighborhoods increases the chance of exposure to crime and domestic violence.19 Therefore, it is not surprising that 95 percent of highest-SES children feel safe in their neighborhoods, compared to 82 percent of lowest-SES children.20 This difference is consequential: feeling unsafe has a significant impact on academic achievement.21
Figure 1. The highest-SES families spend five times as much on enrichment activities as the lowest-SES families.
Recreation Education
Lowest income quintile Highest income quintile
$5,000
$3,600
$1,000
$700
Aver
age
hous
ehol
d ex
pend
itur
e
Source: Georgetown University Center on Education and the Workforce analysis of the Consumer Expenditure Survey, 2016.
Note: Income is used here as a proxy for SES. Recreation includes such items as reading materials (books, newspapers, etc.); admission to movies, concerts, parks, and other events; audio and visual equipment; and pets, toys, and hobbies.

11BORN TO WIN, SCHOOLED TO LOSE
Advantaged children benefit from their parents’ habits and educational experiences.
22 Fox et al., “How the Timing and Quality of Early Experience Influence the Development of Brain Architecture,” 2010; Weisleder and Fernald, “Talking to Children Matters,” 2013; and Rowe, “A Longitudinal Investigation of the Role of Quantity and Quality of Child-Directed Speech in Vocabulary Development,” 2012.
23 Differences in the number of distinct words a child hears (known in popular parlance as the “word gap”) is not strongly tied to SES, however. In fact, there seems to be a great deal of variance within socioeconomic groups. See Sperry et al., “Reexamining the Verbal Environments of Children from Different Socioeconomic Backgrounds,” 2018.
24 Schütz et al., “Education Policy and Equality of Opportunity,” 2005; and Lemke et al., “Outcomes of Learning,” 2001.
25 Hofferth and Sandberg, “How American Children Spend Their Time,” 2001; Bianchi and Robinson, “What Did You Do Today?” 1997; and Mikulecky, “Family Literacy,” 1996.
26 Snow and Tabors, “Intergenerational Transfer of Literacy,” 1996.
27 Programme for International Student Assessment, Knowledge and Skills for Life, 2001.
From a very early age, parental habits strongly influence childhood development. While highest-SES parents have the time and educational background to engage in habits that positively affect their children’s development, lowest-SES parents may have less time and money to spend on such activities.
In particular, time spent with children affects developing verbal and literacy skills.22 Speech used by caregivers influences cognitive development.23 The number of books in a home strongly and consistently predicts students’ test scores and educational attainment in almost every country.24 Higher-SES families are more likely to read consistently to young children, spend more time doing so, and promote engaged reading.25 They also spend more time reading themselves,
which perhaps signals the value of literacy within the household.26 Given these disparities, it is not surprising that by age 15, large gaps in literacy emerge by SES.27
Parents’ habits in the home may be informed by their own educational experiences. Children from higher-SES families are more likely to have parents with higher educational attainment. Almost all children from households in the highest SES quartile have at least one parent who attended college, and 94 percent have at least one parent with a bachelor’s degree. In comparison, only 29 percent of children from households in the lowest SES quartile have at least one parent who attended college, and only 4 percent have at least one parent with a bachelor’s degree (Figure 2).
Figure 2. Almost all children from highest-SES families have at least one parent with some postsecondary education, compared to less than one third of children from lowest-SES families.
High school or less Some college, no degree Associate's degree Bachelor's degree or higher
Second SES
quartile
38%
18%
13%
Lowest SES
quartile
71%
31%17%
8%4%
Third SES
quartile
7%
35%
17%
41%Highest
SES quartile
4%
94%
2%
Source: Georgetown University Center on Education and the Workforce analysis of the Education Longitudinal Study of 2002 (public use data), 2012.
GEORGETOWN UNIVERSITY CENTER ON EDUCATION AND THE WORKFORCE12
Undeniably, parental education matters. Students whose parents have an advanced degree are over five times as likely to earn a bachelor’s degree as those whose parents didn’t get past high school.28 Children who are of the first generation in their families to attend college are also more than twice as likely to
28 Carnevale and Strohl, Separate and Unequal, 2013.
29 Cataldi et al., “First-Generation Students,” 2018.
30 Lareau, “Invisible Inequality,” 2002.
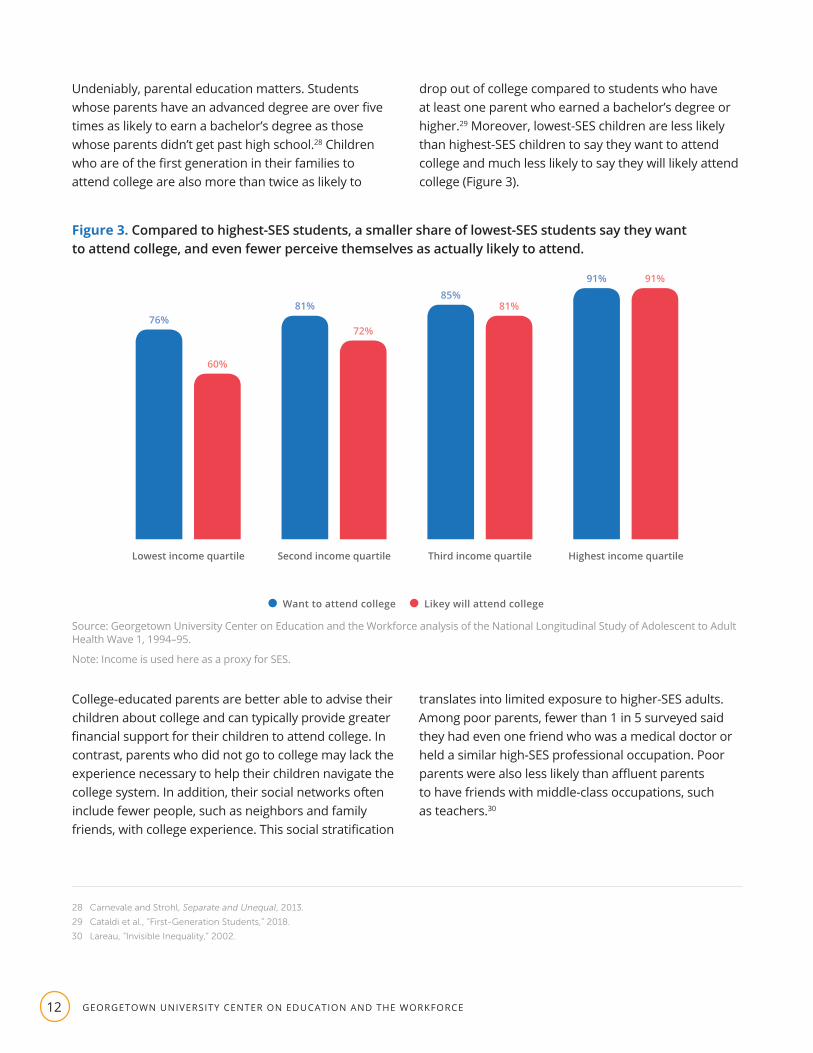
drop out of college compared to students who have at least one parent who earned a bachelor’s degree or higher.29 Moreover, lowest-SES children are less likely than highest-SES children to say they want to attend college and much less likely to say they will likely attend college (Figure 3).
Figure 3. Compared to highest-SES students, a smaller share of lowest-SES students say they want to attend college, and even fewer perceive themselves as actually likely to attend.
76%81%
85%91%
60%
72%
81%
91%
Want to attend college Likey will attend college
Lowest income quartile Second income quartile Third income quartile Highest income quartile
Source: Georgetown University Center on Education and the Workforce analysis of the National Longitudinal Study of Adolescent to Adult Health Wave 1, 1994–95.
Note: Income is used here as a proxy for SES.
College-educated parents are better able to advise their children about college and can typically provide greater financial support for their children to attend college. In contrast, parents who did not go to college may lack the experience necessary to help their children navigate the college system. In addition, their social networks often include fewer people, such as neighbors and family friends, with college experience. This social stratification
translates into limited exposure to higher-SES adults. Among poor parents, fewer than 1 in 5 surveyed said they had even one friend who was a medical doctor or held a similar high-SES professional occupation. Poor parents were also less likely than affluent parents to have friends with middle-class occupations, such as teachers.30

13BORN TO WIN, SCHOOLED TO LOSE
Having role models who have postsecondary education, or who value it highly, is powerful. Expectations are highly predictive of college enrollment. Across every SES
31 Georgetown University Center on Education and the Workforce analysis of data from National Longitudinal Study of Adolescent to Adult Health Wave 1, 1994–95.
32 Cornman et al., Revenues and Expenditures for Public Elementary and Secondary Education, 2018.
33 Ushomirsky and Williams, Funding Gaps 2015, 2015.
34 Clotfelter et al., “Teacher-Student Matching and the Assessment of Teacher Effectiveness,” 2006; and Hanushek et al., “Why Public Schools Lose Teachers,” 2004.
35 Rivkin et al., “Teachers, Schools, and Academic Achievement,” 2005.
36 Kolluri, “Advanced Placement,” 2018.
37 Graham, “Identifying Social Interactions through Conditional Variance Restrictions,” 2008.
38 Duncan and Murnane, “Introduction: The American Dream, Then and Now,” 2011.
39 Fletcher, “Social Interactions in College Choice,” 2006.
quartile, children who report that their mothers would be disappointed if they didn’t go to college are more likely to say that they want to go to college.31
Schools and peers contribute to upper-class advantage.
The upper-class advantage goes beyond the home. Higher incomes result in more resources in one’s neighborhood; neighborhoods, in turn, shape children’s schools.
The money a school receives and the children who attend it depend on factors like property taxes and neighborhood population. Almost half (45%) of K–12 public school money, on average, comes from local government sources, usually property taxes.32 As a result, the highest-SES neighborhoods have more resources to allocate to schools than the lowest-SES neighborhoods. School districts with the highest poverty levels receive about 10 percent less combined state and local funding per student than districts with the lowest levels of poverty.33
Schools in neighborhoods where higher-SES children are more concentrated are also more likely than schools in under-resourced neighborhoods to attract and retain highly qualified, experienced teachers, who tend to seek work in more affluent districts.34 Even within schools, highly qualified teachers tend to sort themselves toward working with children who have fewer behavioral problems and higher abilities.35 Thus, children with the least need for a high-quality teacher are the most likely to have one.
Schools that serve predominantly high-SES children not only attract more-qualified teachers, but also are more likely to offer higher-quality courses that improve college readiness and increase their students’ chances of getting into college. In particular, these schools are more likely than low-income high schools to offer Advanced Placement (AP) courses. Even when schools serving low-income students offer AP courses, they offer a much smaller selection.36
In addition, all children do better when they are in classes with students of high demonstrated ability and those who are less prone to disruptive and antisocial behavior.37 A lowest-SES child is two to four times more likely than a child from a highest-SES family to have classmates with low academic skills and significant behavioral problems.38 In contrast, students whose classmates plan to attend a college or university are more likely to attend themselves.39
Thus, while highest-SES students are enveloped in broadly supportive environments, from their households to their neighborhoods to their schools, lowest-SES children are constrained by environments often defined by limited material resources and limited social capital. While lowest-SES students stand to benefit the most from investment of resources, their schools lack the resources that would support them.

GEORGETOWN UNIVERSITY CENTER ON EDUCATION AND THE WORKFORCE14
Black and Latino children in particular face the additional challenges of discrimination and segregation.
40 Georgetown University Center on Education and the Workforce analysis of data from National Longitudinal Study of Adolescent to Adult Health Wave 1, 1994–95.
41 Iceland et al., “The Residential Segregation of Detailed Hispanic and Asian Groups in the United States: 1980–2010,” 2014.
42 Rothstein, The Color of Law, 2017.
43 Frey, “Census Data: Blacks and Hispanics Take Different Segregation Paths,” 2010.
44 Iceland et al., “The Residential Segregation of Detailed Hispanic and Asian Groups in the United States: 1980–2010,” 2014.
Socioeconomic status is an important factor in explaining disparate educational and career outcomes by race and ethnicity. However, race and ethnicity themselves also affect childhood experiences in distinct ways. Racial discrimination and its harms, both current and historical, affect how children experience their environments and their chances of reaching their full potential.
Black and Latino children are disproportionately more likely than White children to be part of lowest-SES households and residents of the lowest-SES neighborhoods.40 About 35 percent of Black children and 50 percent of Latino children are from the lowest-SES families, compared to 16 percent of White children. Asian children are also more likely than White children to be part of the lowest-SES families (27%), but they are as likely as White children to be a part of the highest-SES families (Figure 4).
Figure 4. Black, Latino, and Asian children are more likely than White children to come from the lowest-SES families.
Lowest SES quartile Second SES quartile Third SES quartile Highest SES quartile
16%
24%
29%
32%
WhiteBlack/African
American
35%
30%
22%
13%
Hispanic/Latino 50%
24%
16%
10%
Asian/Pacific
Islander
27%
19%22%
33%
Source: Georgetown University Center on Education and the Workforce analysis of the Education Longitudinal Study of 2002 (public use data), 2012.
Note: Groups might not add to 100 percent due to rounding.
Racial and ethnic segregation shapes children’s environments and social networks. Racial segregation in housing, linked to factors including federal policies, discriminatory real estate practices, and individual choice, has a long history.41 Black–White segregation, originally rooted in slavery and Reconstruction, was extended through policies like New Deal-era segregated public housing projects and the refusal of the Federal Housing Administration to insure
mortgages in or near Black neighborhoods.42 Among Latinos, those who are new immigrants and have low-wage jobs often congregate in neighborhoods that have cultural networks and affordable housing.43 Many Asians also continue to live in segregated areas, although as a group they are more likely to live in neighborhoods with Whites than with those of other races and ethnicities.44
15BORN TO WIN, SCHOOLED TO LOSE
These longstanding policies and practices have resulted in persistent neighborhood racial barriers with particularly negative effects for Black and Latino students. Because school assignment typically depends on residential location, de facto school segregation remains prevalent. Racial segregation in high school is one of the largest contributors to the college completion gap between Blacks and Latinos on one hand and Whites on the other.45 School districts with the most Blacks and Latinos receive about 15 percent less state and local funding per student than those with the fewest Blacks and Latinos.46 Recent research shows that high-poverty non-White districts receive 11 percent less revenue per student than high-poverty White districts.47
These schools also tend to offer fewer math, science, and college preparatory courses, and their students tend to be held back, suspended, or expelled at higher rates.48 Black students, in particular, have less access to rigorous curricula in high school.49 Moreover, Blacks with high test scores are much more likely than Whites with similar scores to attend schools where the median skill level is far beneath their own.50 Meanwhile, Latinos experience differences in education before formal schooling even starts. Compared to other racial and ethnic groups, Latino students are least likely to attend high-quality preschools.51
45 Flores et al., “The Racial College Completion Gap,” 2017.
46 Ushomirsky and Williams, Funding Gaps 2015, 2015.
47 EdBuild, “Nonwhite School Districts Get $23 Billion Less Than White Districts Despite Serving the Same Number of Students,” 2019.
48 US Government Accountability Office, K-12 Education, 2016.
49 Flores et al., “The Racial College Completion Gap,” 2017.
50 Carneiro et al., “Labor Market Discrimination and Racial Differences in Premarket Factors,” 2005.
51 Nichols, A Look at Latino Student Success, 2017.
52 Papageorge et al., “Teacher Expectations Matter,” 2018.
53 Tenenbaum and Ruck, “Are Teachers’ Expectations Different for Racial Minority than for European American Students? A Meta-Analysis,” 2007.
54 Skiba et al., “Race Is Not Neutral,” 2011.
55 Gregory et al., “The Achievement Gap and the Discipline Gap: Two Sides of the Same Coin?” 2010.
The expectations that students encounter at school also matter. Student postsecondary attainment is influenced by teacher expectations.52 Teacher expectations, in turn, are influenced by racial biases, both conscious and unconscious. Teachers have been found to have higher expectations for White students than for Black or Latino students, and higher expectations for Asian students than for White students.53
Implicit bias and stereotypes may affect the likelihood of academic success.
Research on disciplinary action offers an additional example of how race and ethnicity can influence the school environment for children. Schools are more likely to suspend or discipline Black and Latino students than their White peers, and are more likely to subject Black and Latino students to harsher punishments (such as expulsions or school suspensions) for the same infractions.54 In addition, teachers are more likely to refer Black students to the main office for discipline for subjective infractions (e.g., being disrespectful), while they are more likely to refer White students for objective offenses (e.g., vandalism). These disciplinary differences, which may be related to implicit bias and stereotypes, can affect the likelihood of academic success.55

GEORGETOWN UNIVERSITY CENTER ON EDUCATION AND THE WORKFORCE16
Education has the potential to be the great equalizer.
56 Chetty et al., “Where Is the Land of Opportunity?” 2014.
57 Georgetown University Center on Education and the Workforce analysis of National Longitudinal Study of Adolescent to Adult Health Wave 1, 1994–95.
58 Heckman and Mosso, “The Economics of Human Development and Social Mobility,” 2014; and Aizer and Currie, “The Intergenerational Transmission of Inequality,” 2014.
59 Duncan et al., “Child Development,” 2010; and Wong et al., “An Effectiveness-Based Evaluation of Five State Pre-Kindergarten Programs,” 2008.
60 Georgetown University Center on Education and the Workforce analysis of the American Community Survey (ACS), 2017. These data exclude three- and four-year-olds who are enrolled in kindergarten.
61 Rothstein et al., Can Public Schools Learn from Private Schools?, 1999.
62 Lafortune et al., “School Finance Reform and the Distribution of Student Achievement,” 2016.
Children of all abilities may at some point trip and fall on their way to adulthood. Those in supportive environments have a soft landing and help getting back up, whereas those in adverse environments land on hardened ground. Children facing the greatest adversity in their environments are also the least likely to have opportunities that would increase their educational attainment and skills and improve their workforce outcomes.
When starting points are so different, the least advantaged have reason to be pessimistic. Nearly 40 percent of children in the lowest SES category remain in the lowest SES quartile into adulthood.56 Less than half of all Americans—and less than one third of people from racial or ethnic minority groups—believe that if you work hard, you will get ahead. Nearly 1 in 5 lowest-SES children report that they never or rarely feel hopeful about the future, compared to slightly more than 1 in 20 highest-SES children.57
Education can help move the needle. Early interventions tend to be more cost-effective than later ones: while the negative effects of living with few resources are
cumulative over a lifetime, so are the positive effects of early education.58 Some preschool interventions have lasting positive effects for students from very adverse conditions.59 And there is much room for growth: 62 percent of three- and four-year-olds in the highest family income quartile attend a preschool program, while only 39 percent from the lowest family income quartile attend such programs.60
Later interventions, while not as cost-effective, are also important. Many innovative schools have made huge strides in narrowing, if not closing, achievement gaps.61 And money matters: when schools that serve poor communities receive more funding, they see significant improvements in student test scores and educational attainment.62
In the following sections, we examine data that follow students through primary and secondary education and into college and the workforce, exploring how nature and nurture interact as students strive to reach the top. We find that students’ chances depend in large part on life circumstances—but education policy can help close the gaps.
17BORN TO WIN, SCHOOLED TO LOSE
PART 2
Traveling the Uneven Academic Pathway
Environment leaves its imprint early and influences students throughout their scholastic lives. Before children even enter kindergarten, gaps in their academic skills have already been
established, and the effects of different environments do not end there. Throughout their academic journeys,
supportive environments propel and uplift children, while adverse environments have the opposite effect. While all children stumble, affluent students are not only more likely to be helped back up—they are far less likely to trip in the first place.
Academic gaps are already large in the first year of school.
The skills children begin developing at birth lay the groundwork for the math skills they are expected to possess in kindergarten. By the end of kindergarten, there are significant gaps in math scores by SES.
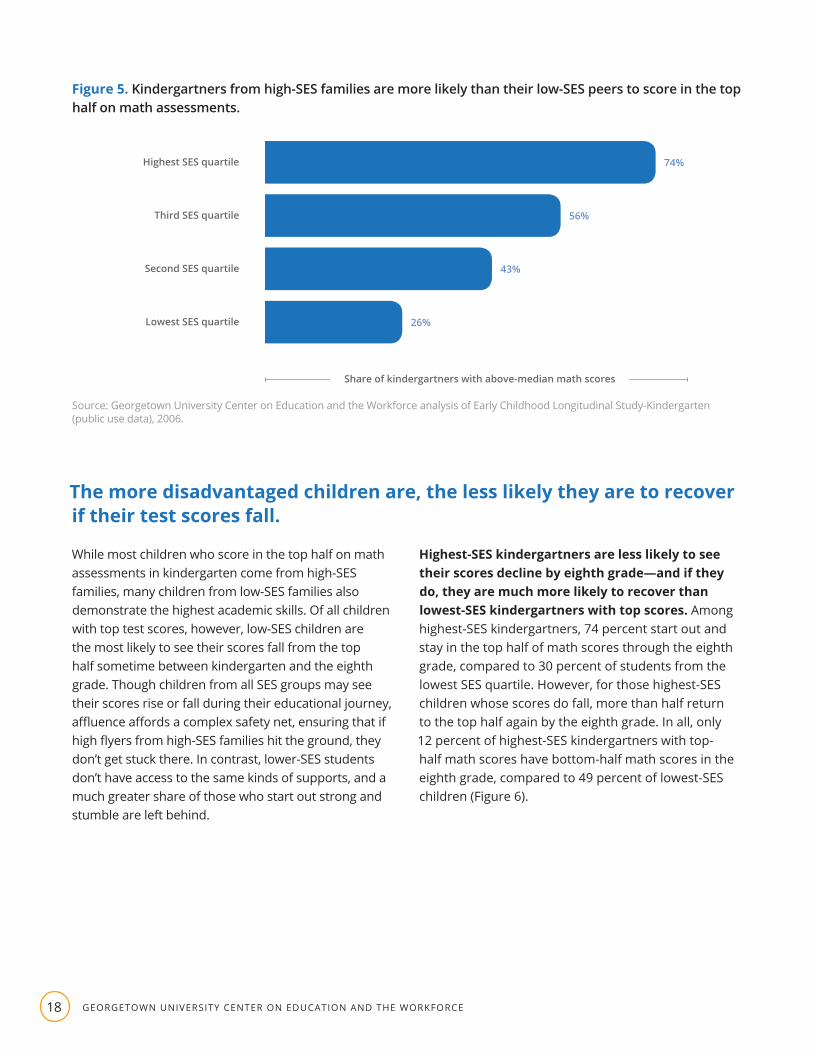
The higher the family’s SES, the more likely a child is to score in the top half on assessments of mathematical skills and knowledge, and there are significant differences between SES quartiles. Among children whose families are in the highest SES quartile, a vast majority score in the top half in math (74%). For those
whose families are in the lowest SES quartile, the share earning top scores in math (26%) is about one-third of that (Figure 5). Even so close to the beginning of formal schooling, class has already made its mark.
The higher the family’s SES, the more likely a child is to score in the top half on math assessments.
GEORGETOWN UNIVERSITY CENTER ON EDUCATION AND THE WORKFORCE18
Figure 5. Kindergartners from high-SES families are more likely than their low-SES peers to score in the top half on math assessments.
Lowest SES quartile
Second SES quartile
Third SES quartile
Highest SES quartile
Share of kindergartners with above-median math scores
74%
56%
43%
26%
Source: Georgetown University Center on Education and the Workforce analysis of Early Childhood Longitudinal Study-Kindergarten (public use data), 2006.
The more disadvantaged children are, the less likely they are to recover if their test scores fall.
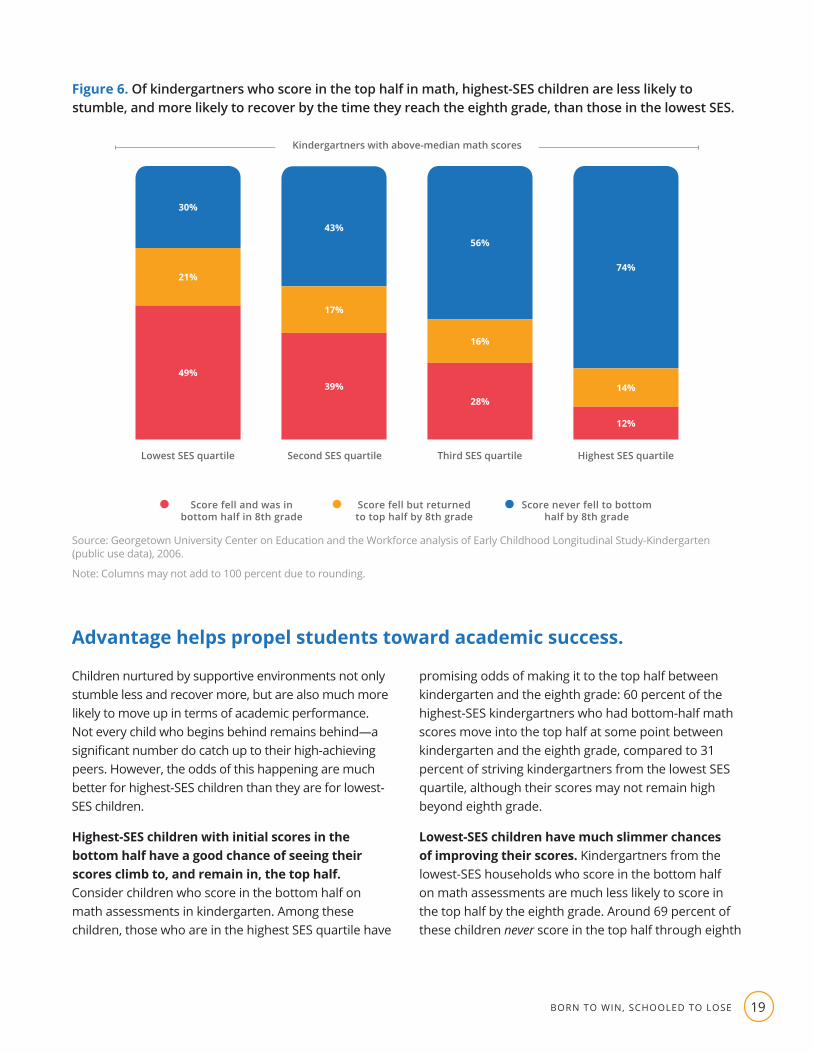
While most children who score in the top half on math assessments in kindergarten come from high-SES families, many children from low-SES families also demonstrate the highest academic skills. Of all children with top test scores, however, low-SES children are the most likely to see their scores fall from the top half sometime between kindergarten and the eighth grade. Though children from all SES groups may see their scores rise or fall during their educational journey, affluence affords a complex safety net, ensuring that if high flyers from high-SES families hit the ground, they don’t get stuck there. In contrast, lower-SES students don’t have access to the same kinds of supports, and a much greater share of those who start out strong and stumble are left behind.
Highest-SES kindergartners are less likely to see their scores decline by eighth grade—and if they do, they are much more likely to recover than lowest-SES kindergartners with top scores. Among highest-SES kindergartners, 74 percent start out and stay in the top half of math scores through the eighth grade, compared to 30 percent of students from the lowest SES quartile. However, for those highest-SES children whose scores do fall, more than half return to the top half again by the eighth grade. In all, only 12 percent of highest-SES kindergartners with top-half math scores have bottom-half math scores in the eighth grade, compared to 49 percent of lowest-SES children (Figure 6).
19BORN TO WIN, SCHOOLED TO LOSE
Figure 6. Of kindergartners who score in the top half in math, highest-SES children are less likely to stumble, and more likely to recover by the time they reach the eighth grade, than those in the lowest SES.
Score fell and was in bottom half in 8th grade
Score fell but returned to top half by 8th grade
Score never fell to bottom half by 8th grade
Lowest SES quartile Second SES quartile Third SES quartile Highest SES quartile
30%
43%56%
74%21%
17%
16%
14%49%
39%28%
12%
Kindergartners with above-median math scores
Source: Georgetown University Center on Education and the Workforce analysis of Early Childhood Longitudinal Study-Kindergarten (public use data), 2006.
Note: Columns may not add to 100 percent due to rounding.
Advantage helps propel students toward academic success.
Children nurtured by supportive environments not only stumble less and recover more, but are also much more likely to move up in terms of academic performance. Not every child who begins behind remains behind—a significant number do catch up to their high-achieving peers. However, the odds of this happening are much better for highest-SES children than they are for lowest-SES children.
Highest-SES children with initial scores in the bottom half have a good chance of seeing their scores climb to, and remain in, the top half. Consider children who score in the bottom half on math assessments in kindergarten. Among these children, those who are in the highest SES quartile have
promising odds of making it to the top half between kindergarten and the eighth grade: 60 percent of the highest-SES kindergartners who had bottom-half math scores move into the top half at some point between kindergarten and the eighth grade, compared to 31 percent of striving kindergartners from the lowest SES quartile, although their scores may not remain high beyond eighth grade.
Lowest-SES children have much slimmer chances of improving their scores. Kindergartners from the lowest-SES households who score in the bottom half on math assessments are much less likely to score in the top half by the eighth grade. Around 69 percent of these children never score in the top half through eighth

GEORGETOWN UNIVERSITY CENTER ON EDUCATION AND THE WORKFORCE20
grade. Of the 31 percent who do rise, a significant portion fall again—in all, only 18 percent climb to the top half and stay there by eighth grade (Figure 7).
Without the stabilizing benefits of an advantageous environment, children are more likely to fall off track academically.
Figure 7. Kindergartners who score in the bottom half of math assessments are much more likely to move into the top half of all students by the eighth grade if they are in higher SES quartiles.
Score never rose to top half by 8th grade
Score climbed but fell back to bottom half by 8th grade
Score climbed to top half and remained
there in 8th grade
Kindergartners with below-median math scores
39%51%
59%69%
17%
19%14%
13% 43%
30%28%18%
Lowest SES quartile Second SES quartile Third SES quartile Highest SES quartile
Source: Georgetown University Center on Education and the Workforce analysis of Early Childhood Longitudinal Study-Kindergarten (public use data), 2006.
Note: Columns may not add to 100 percent due to rounding.
The effects of advantage and disadvantage continue through high school—but paths are less likely to change at that point.
Environment continues to play an important role as students progress through high school. As in their earlier years, advantageous environments protect and propel children toward success, while adverse environments present hurdles for those with lesser means. The achievement trends established in primary school continue in high school, as the highest-SES students are more likely to continue to have top scores,
while their lowest-SES peers are more likely to see their scores stay low or fall. At this stage, however, students are significantly less likely to see their scores rise or fall than they were during primary school, in part because the cumulative nature of both learning and environmental effects makes the gaps harder to overcome at later stages.

21BORN TO WIN, SCHOOLED TO LOSE
Among students with top scores in tenth grade, the chances of persistence are good. The good news is that the vast majority of students who have top-quartile math scores in the tenth grade will also have top-quartile math scores in the twelfth grade: 85 percent of those from the highest SES quartile with top math scores will still have top-quartile scores in the twelfth grade. Tenth graders who have top-quartile test scores but are from lowest-SES households are less likely than their peers to continue scoring in the top quartile in math; nevertheless, a majority of these students (61%) will still have top-quartile scores in the twelfth grade.
The bad news, though, is that lower-SES students with top-quartile scores are more likely to see their scores fall from the highest to the next-highest quartile by the
twelfth grade. A student who has top-quartile scores in math but is from the lowest SES quartile is more than twice as likely as a similarly scoring peer from the highest SES quartile to fall into the next-highest scoring quartile (32% versus 13%).
The tenth grade appears to be the point at which developmental gains begin to hold for all students. Fortunately, very few students who score in the very top quartile in tenth grade see their scores fall into the bottom half by twelfth grade, regardless of SES. Only 2 percent (highest SES) and 7 percent (lowest SES) of students who score in the top quartile in tenth-grade math score in the bottom half by twelfth grade (Figure 8).
Figure 8. Almost all students who score in the top quartile in tenth-grade math also score in the top half in the twelfth grade.
Below-median 12th-grade math scores*
Third quartile 12th-grade math scores
Top quartile 12th-grade math scores
10th graders with top-quartile math scores
Lowest SES quartile Second SES quartile Third SES quartile Highest SES quartile
32%27%
23%
7% 5% 3% 2%
13%
85%
61% 68%
74%
Source: Georgetown University Center on Education and the Workforce analysis of the Education Longitudinal Study of 2002 (public use data), 2012.
*Below-median twelfth-grade scores also include students who dropped out of high school before the twelfth-grade assessment.
GEORGETOWN UNIVERSITY CENTER ON EDUCATION AND THE WORKFORCE22
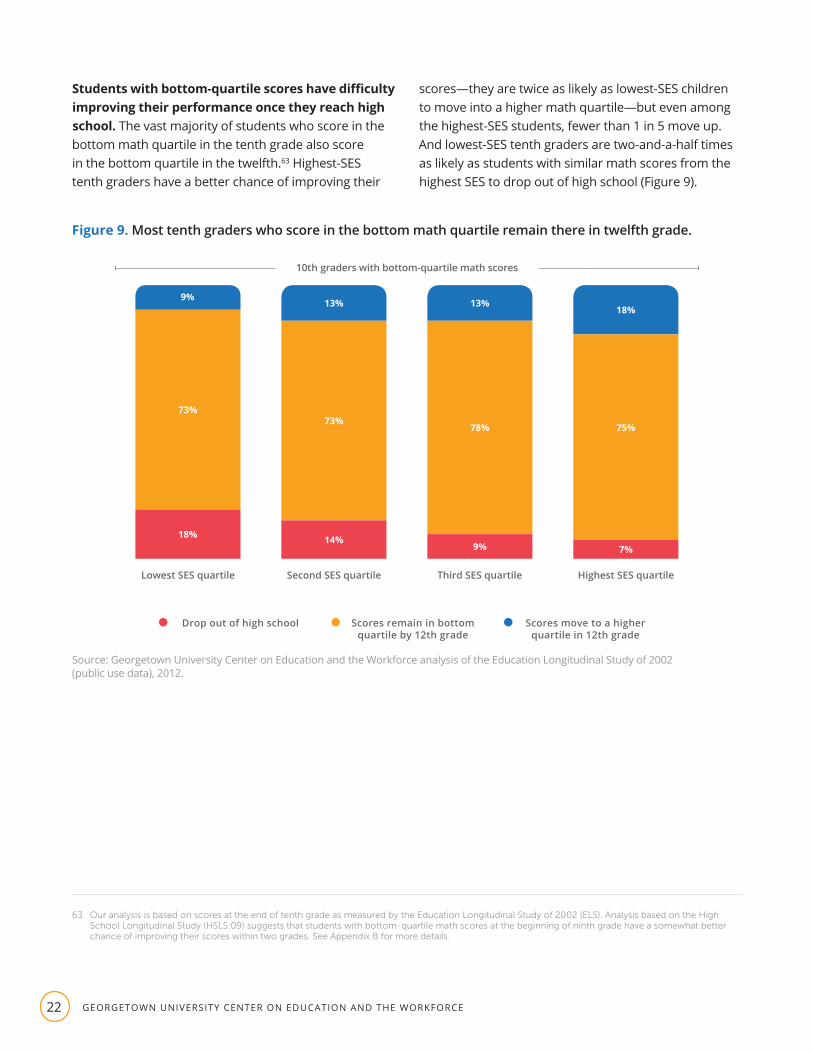
Students with bottom-quartile scores have difficulty improving their performance once they reach high school. The vast majority of students who score in the bottom math quartile in the tenth grade also score in the bottom quartile in the twelfth.63 Highest-SES tenth graders have a better chance of improving their
63 Our analysis is based on scores at the end of tenth grade as measured by the Education Longitudinal Study of 2002 (ELS). Analysis based on the High School Longitudinal Study (HSLS:09) suggests that students with bottom-quartile math scores at the beginning of ninth grade have a somewhat better chance of improving their scores within two grades. See Appendix B for more details.
scores—they are twice as likely as lowest-SES children to move into a higher math quartile—but even among the highest-SES students, fewer than 1 in 5 move up. And lowest-SES tenth graders are two-and-a-half times as likely as students with similar math scores from the highest SES to drop out of high school (Figure 9).
Figure 9. Most tenth graders who score in the bottom math quartile remain there in twelfth grade.
Drop out of high school Scores remain in bottom quartile by 12th grade
Scores move to a higher quartile in 12th grade
10th graders with bottom-quartile math scores
Lowest SES quartile Second SES quartile Third SES quartile Highest SES quartile
73%73%
78% 75%
18% 14%9% 7%
9% 13% 13%18%
Source: Georgetown University Center on Education and the Workforce analysis of the Education Longitudinal Study of 2002 (public use data), 2012.

23BORN TO WIN, SCHOOLED TO LOSE
K–12 academic development and socioeconomic status both play a role in college enrollment and completion.
64 Carnevale et al., Good Jobs That Pay without a BA, 2017; and Carnevale et al., America’s Divided Recovery, 2016.
Educational attainment is itself an important defining aspect of SES, and is associated with the other two defining factors: income and occupational prestige. The vast majority of good jobs require at least some postsecondary training or education.64 Lowest-SES-quartile tenth graders are less likely than their highest-SES-quartile peers to enroll in college, attend a four-year institution, and complete a college degree—regardless of academic ability. In addition, the odds of a tenth grader completing a college degree within 10 years depend heavily on the skills and knowledge developed from kindergarten through twelfth grade. Tenth graders with top-half test scores are more than twice as likely as their peers with bottom-half scores to earn a college degree within 10 years.
Those with highest SES are more likely to enroll in a four-year college than their lowest-SES peers.
Among tenth graders with top-half math scores, those from the lowest SES are less likely to immediately attend any postsecondary program. For students from the lowest SES quartile, 73 percent immediately (within two years of expected high school graduation) enroll in college, compared to 95 percent of those who are from the highest SES quartile. Highest-SES tenth graders are much more likely to enroll immediately in four-year colleges (85%) than their lowest-SES peers (43%).
For tenth graders with bottom-half math scores, the disparities in immediate college enrollment are more jarring. Within this group, 54 percent of those who are lowest SES do not immediately enroll in any college, compared to 16 percent who are highest SES. And those who are highest SES are more likely to enroll in a four-year college (46%) than their lowest-SES counterparts (14%). In fact, a tenth grader from the highest SES who has bottom-half math scores is more likely to enroll in college than one from the lowest SES with top-half math scores (Figure 10).

GEORGETOWN UNIVERSITY CENTER ON EDUCATION AND THE WORKFORCE24
Figure 10. Lowest-SES tenth graders with top math scores are less likely to immediately enroll in a college than highest-SES tenth graders with bottom math scores.
5% 10% 85%
46%38%16%
28% 30% 43%
14%32%54%Below-median math scores
Below-median math scores
Above-median math scores
Above-median math scores
Highest level of college enrollment four years after 10th grade
Did not enroll Less than two-year or two-year college Four-year college
Low
est S
ES
quar
tile
Hig
hest
SES
qu
artil
e
Source: Georgetown University Center on Education and the Workforce analysis of the Education Longitudinal Study of 2002 (public use data), 2012.
Note: Rows might not add to 100 percent due to rounding.
65 Turner, “Going to College and Finishing College,” 2004.
66 Niu and Tienda, “Delayed Enrollment and College Plans,” 2013.
Disparities in immediate college enrollment are consequential. Students are much more likely to complete a college degree if they do not delay college enrollment.65 While some students who start at two-year colleges eventually transfer to four-year colleges and complete their bachelor’s degrees, students who start at two-year colleges are much less likely to complete any college degree, let alone a bachelor’s degree, than those who start at four-year colleges.66
Tenth graders with top-half math scores are more likely than those with bottom-half scores to have completed a college degree within 10 years of tenth grade. As with enrollment, however, there are significant differences in completion when rates are
broken down by SES quartile. Among tenth graders with top-half scores, 40 percent who are lowest SES have earned a college degree 10 years later, compared to 75 percent of those who are highest SES.
The SES-based gap in college degree attainment after 10 years is even larger for students with bottom-half math scores. Among students with math scores in the bottom half, only 16 percent of the lowest-SES students have earned a college degree within 10 years, compared to 46 percent of highest-SES students. And highest-SES tenth graders with bottom-half math scores are even more likely to complete a college degree compared to lowest-SES tenth graders with top-half math scores (Figure 11).

25BORN TO WIN, SCHOOLED TO LOSE
Figure 11. Regardless of math scores in high school, lowest-SES tenth graders are less likely than their highest-SES counterparts to have completed a college degree 10 years later.
Associate‘s degree Bachelor‘s degree or higher
Below-median math scores
Below-median math scores
Above-median math scores
Above-median math scores
Share of 10th graders who completed a college degree within 10 years
Low
est S
ES
quar
tile
Hig
hest
SES
qu
artil
e
70%5%
35%11%
10% 30%
8% 8%
Source: Georgetown University Center on Education and the Workforce analysis of the Education Longitudinal Study of 2002 (public use data), 2012.
67 Overall, White (62%) and Asian (55%) kindergartners are more likely to have above-median math scores than their Black (31%) or Latino (33%) peers. Georgetown University Center on Education and the Workforce analysis of Early Childhood Longitudinal Study Kindergarten (ECLS-K), 2006 data.
Thus, lowest-SES students are far less likely than their highest-SES peers to earn a college degree by their mid-20s—even when their test scores suggest that they are equally prepared. Just as their environment has dampened their chances of maintaining top
scores from kindergarten through high school, so too has it reduced their likelihood of achieving the educational status needed to lift them into the middle or upper class.
Race and ethnicity interact with socioeconomic status to affect students’ likelihood of achieving and maintaining academic success.
Because Black and Latino children are more likely than White children to be from the lowest SES quartile, we would expect to see test-score gaps similar to those that are evident among SES groups reflected across racial and ethnic groups.67 However, SES alone does not explain racial and ethnic differences: as discussed in Part 1, societal factors like segregation and discrimination are also at play. Considering testing
data with both race and class in mind provides greater insight into how these factors may interact and affect the lives of students.
Our analysis shows that within same SES groups, White students tend to have better outcomes than their Black and Latino peers throughout the K–12 pipeline. For example, high-SES (above-median SES) White students are more likely to have top-half math

GEORGETOWN UNIVERSITY CENTER ON EDUCATION AND THE WORKFORCE26
scores than high-SES Black or Latino students.68 While scoring gaps between high- and low-SES (above- and below-median SES) students exist across all racial and ethnic groups, high-SES Black kindergartners in particular don’t score much better than their same-race low-SES peers. This suggests that relative affluence has a more protective effect for White students than for Black students. Even when they are relatively advantaged, Black students encounter barriers to success that are difficult to overcome, including the harsh realities of racial discrimination.69
The story for Asian students is more complex. In kindergarten, low-SES Asians are less likely to have top-half test scores than their White peers, while high-SES Asian students are as likely to have top-half test scores as White students. But by the end of the academic pipeline, things have changed: regardless of SES, Asian students are more likely to attain a college degree than those from other racial and ethnic groups.
Even when the relative disadvantages students from different racial and ethnic groups face are economic in nature, they may be understated in the usual metrics of SES (income, educational attainment, and occupational prestige). These metrics can only be regarded as proxy measures for deeper inequalities. They fail to account for racial differences in wealth,
68 Due to data limitations, we cannot provide analysis of SES quartiles by race or ethnicity.
69 See Chetty et al., “Race and Economic Opportunity in the United States,” 2018; and Badger et al., “Extensive Data Shows Punishing Reach of Racism for Black Boys,” 2018.
70 Asante-Muhammad et al., The Ever-Growing Gap, 2016.
71 Hanks et al., Systematic Inequality, 2018.
for example, which are much more extreme than racial differences in income,70 and make no adjustment for family composition (e.g., family size and number of income earners). Nor does current SES fully account for the cumulative effects of the intergenerational transfer of wealth and other advantages.71
Relative affluence has a more protective effect for White students than for Black students.
As early as kindergarten, racial and ethnic factors have given Whites and Asians environmental advantages over Blacks and Latinos, even when they have similar SES. Forty-five percent of White students and 33 percent of Asian students from families with below-median SES have top-half math scores in kindergarten, compared to 28 percent of Black and 25 percent of Latino kindergartners with similar SES. Similarly, 71 percent of both White and Asian students from families with above-median SES have top-half math scores in kindergarten, compared to 40 percent and 55 percent of Black and Latino kindergartners, respectively (Figure 12).

27BORN TO WIN, SCHOOLED TO LOSE
Figure 12. Both high- and low-SES White and Asian children are more likely to have top-half kindergarten math scores than their Black and Latino peers.
White Black/African American Hispanic/Latino Asian/Pacific Islander
Below-median family SES
45%
28%25%
33%
Above-median family SES
71%
40%
55%
71%
Shar
e of
kin
derg
artn
ers
wit
h ab
ove-
med
ian
mat
h sc
ores
Source: Georgetown University Center on Education and the Workforce analysis of Early Childhood Longitudinal Study-Kindergarten (public use data), 2006.
Across racial and ethnic groups, early success matters: children who test well in kindergarten are more likely to do well in primary and secondary school, and students who do well in secondary school are more likely to be successful in the workforce as young adults. While early success prepares children for future success, the environment continues to shape their odds throughout childhood.
Black students are the least likely among all racial and ethnic groups to see their scores rise from below to above the median between kindergarten and eighth grade. Within racial and ethnic groups,
being from the upper half of the SES distribution increases the odds that a kindergartner with bottom-half math scores will become an eighth grader with top-half math scores. Within the lower half of the SES distribution, White and Latino kindergartners with bottom-half math scores are similarly likely to have top-half math scores by the eighth grade, while high-SES Whites have a slight advantage over high-SES Latinos in moving from the bottom half of test scores to the top half. Regardless of SES, Black kindergartners with bottom-half scores are much less likely than their White, Latino, and Asian peers to see their scores rise into the top half by the eighth grade (Figure 13).
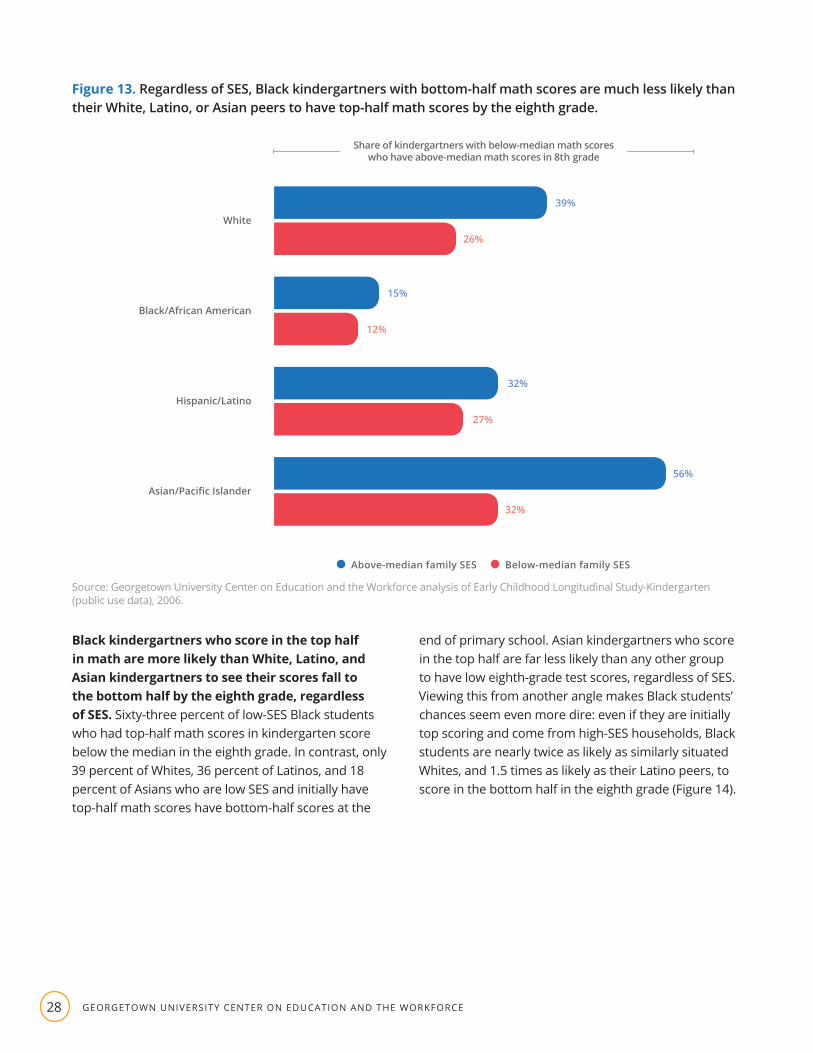
GEORGETOWN UNIVERSITY CENTER ON EDUCATION AND THE WORKFORCE28
Figure 13. Regardless of SES, Black kindergartners with bottom-half math scores are much less likely than their White, Latino, or Asian peers to have top-half math scores by the eighth grade.
Asian/Pacific Islander
Hispanic/Latino
Black/African American
White
39%
32%
56%
15%
26%
27%
32%
12%
Share of kindergartners with below-median math scores who have above-median math scores in 8th grade
Above-median family SES Below-median family SES
Source: Georgetown University Center on Education and the Workforce analysis of Early Childhood Longitudinal Study-Kindergarten (public use data), 2006.
Black kindergartners who score in the top half in math are more likely than White, Latino, and Asian kindergartners to see their scores fall to the bottom half by the eighth grade, regardless of SES. Sixty-three percent of low-SES Black students who had top-half math scores in kindergarten score below the median in the eighth grade. In contrast, only 39 percent of Whites, 36 percent of Latinos, and 18 percent of Asians who are low SES and initially have top-half math scores have bottom-half scores at the
end of primary school. Asian kindergartners who score in the top half are far less likely than any other group to have low eighth-grade test scores, regardless of SES. Viewing this from another angle makes Black students’ chances seem even more dire: even if they are initially top scoring and come from high-SES households, Black students are nearly twice as likely as similarly situated Whites, and 1.5 times as likely as their Latino peers, to score in the bottom half in the eighth grade (Figure 14).

29BORN TO WIN, SCHOOLED TO LOSE
Figure 14. Regardless of SES, Black kindergarteners with top-half math scores are more likely than other kindergartners to have bottom-half math scores as eighth graders.
Asian/Pacific Islander
Hispanic/Latino
Black/African American
White
18%
22%
7%
34%
39%
36%
18%
63%
Share of kindergartners with above-median math scores who have below-median math scores in 8th grade
Above-median family SES Below-median family SES
Source: Georgetown University Center on Education and the Workforce analysis of Early Childhood Longitudinal Study-Kindergarten (public use data), 2006.
72 Georgetown University Center on Education and the Workforce analysis of the Education Longitudinal Study of 2002 (public use data), 2012.
Racial and ethnic gaps in test scores continue and are cemented as students move through high school. Among all students with math scores in the top quartile in tenth grade, White and Asian students are slightly more likely to have scores in the top half in twelfth grade (81% and 77%, respectively) than are Black (72%) and Latino students (73%) with similar scores. Yet, regardless of race or ethnicity, students who have lowest-quartile math scores in tenth grade are very likely to have lowest-quartile scores in twelfth grade, or to have dropped out. However, Latino students with the lowest-quartile scores in tenth grade are slightly more likely to drop out (18%) by twelfth grade than their similar-scoring White (13%) and Black
(14%) peers, and three times as likely as their Asian peers (6%).72
Students’ chances of attaining a postsecondary degree also vary by race and ethnicity, whether considered on their own or in combination with SES. Disproportionately represented among low-SES students, and facing persistent racial and ethnic segregation and discrimination, Black and Latino children often find themselves striving against the odds to rise to the top in college attainment. White and Asian students are more likely to earn a college degree than their Black and Latino peers even with similar scores (Figure 15). Whites with tenth-grade

GEORGETOWN UNIVERSITY CENTER ON EDUCATION AND THE WORKFORCE30
math scores above the median get two-year or four-year degrees at a rate of 62 percent, and Asians with top-half scores get two-year or four-year degrees at a rate of 69 percent; meanwhile, Blacks and Latinos with top-half scores fall behind with rates of 51 percent and
46 percent, respectively. Degree attainment is similarly unequal for Asian, White, Black, and Latino students in the lower half of the test distribution, with degree attainment rates of 39 percent, 29 percent, 23 percent, and 22 percent, respectively.
Figure 15. White and Asian tenth graders are more likely than their Black or Latino peers to have earned a college degree within 10 years, no matter their math scores.
Associate‘s degree Bachelor‘s degree or higher
Below-median math scores
Above-median math scores
Below-median math scores
Above-median math scores
Below-median math scores
Above-median math scores
Below-median math scores
Above-median math scores
Share of 10th graders who completed a degree within 10 years
Whi
teBl
ack/
Afri
can
Amer
ican
His
pani
c/La
tino
Asia
n/Pa
cific
Is
land
er
8%
11%
5%
9%
9%
10%
3% 66%
28%11%
12%
14%
37%
46%
18%
54%
Source: Georgetown University Center on Education and the Workforce analysis of the Education Longitudinal Study of 2002 (public use data), 2012.
31BORN TO WIN, SCHOOLED TO LOSE
K–16 academic performance has lasting consequences.
73 Kitsantas et al., “Self-Regulation and Ability Predictors of Academic Success During College,” 2008.
74 Carnevale and Strohl, “How Increasing College Access Is Increasing Inequality, and What to Do About It,” 2010.
Students’ prior academic performance, generally measured using high school GPAs, class rank, and math and reading test scores, affects their access to and success in college73—and success in college has clear implications for upward economic mobility. Test scores, while imperfect reflections of individual skill and college readiness, are the measuring stick used by schools, teachers, families, and students themselves to gauge preparation for college-level work.74
For all the flaws with test scores, students with top-half test scores are much more likely to attend college and complete their degrees—and more likely to end up in the top half of SES as young adults. Yet while successful participation in postsecondary education is a boon to economic mobility, postsecondary educational achievement and success in the labor market are stratified by class as well as by race and ethnicity.
Because academic preparation is crucial to economic mobility, the association between academic achievement and class, along with race and ethnicity, is critically important. While education has the potential to be the great equalizer, students facing adverse environments not only start with lower measured academic skills, but also have much lower chances of having high test scores by the twelfth grade. Students who start strong but face adverse environments are much more likely to stumble and fall behind by the twelfth grade, and both those who stumble and those who survive the K–12 developmental gauntlet face new obstacles in the transition to postsecondary education. While their paths are not completely set, failure at that point makes their chances of success even slimmer.

GEORGETOWN UNIVERSITY CENTER ON EDUCATION AND THE WORKFORCE32
PART 3
Early Career Success
75 Georgetown University Center on Education and the Workforce analysis of National Longitudinal Study of Adolescent to Adult Health Wave 1, 1994–95.
76 Throughout this section, we define young adult SES according to individual status compared to the cohort group 10 years after tenth grade. Thus, while SES values for tenth graders are measured according to parental factors, SES values for young adults are determined by individual factors.
Hope for a better future is the hallmark of the American Dream, yet one of every five teenagers from families in the bottom SES quartile reports never or rarely feeling
hopeful about the future. A quarter believe they have less than a 50 percent chance of having a middle-class income by the age of 30.75 These teenagers have good reason to be pessimistic: compared to children raised in upper-class environments, lowest-SES children are less likely to go to college, complete a college degree, and find a prestigious job. Their limited hope accurately reflects the overall lack of economic mobility in the United States: affluent children are likely to stay affluent, and poor children are likely to stay poor.
Our data reflect this stark reality, showing that children of low-SES families are very likely to remain low-SES in their mid-20s, as compared to other young adults of the same age. Less than one third (31%) of tenth graders in the lowest SES quartile earn the income, educational attainment, or occupational prestige to be in the top half of the SES distribution among same-age young adults 10 years later.76 Meanwhile, 74 percent of young adults whose families were in the highest SES quartile remain in the top SES half as young adults (Figure 16).
Lowest-SES children are less likely to go to college, complete a degree, and find a prestigious job.
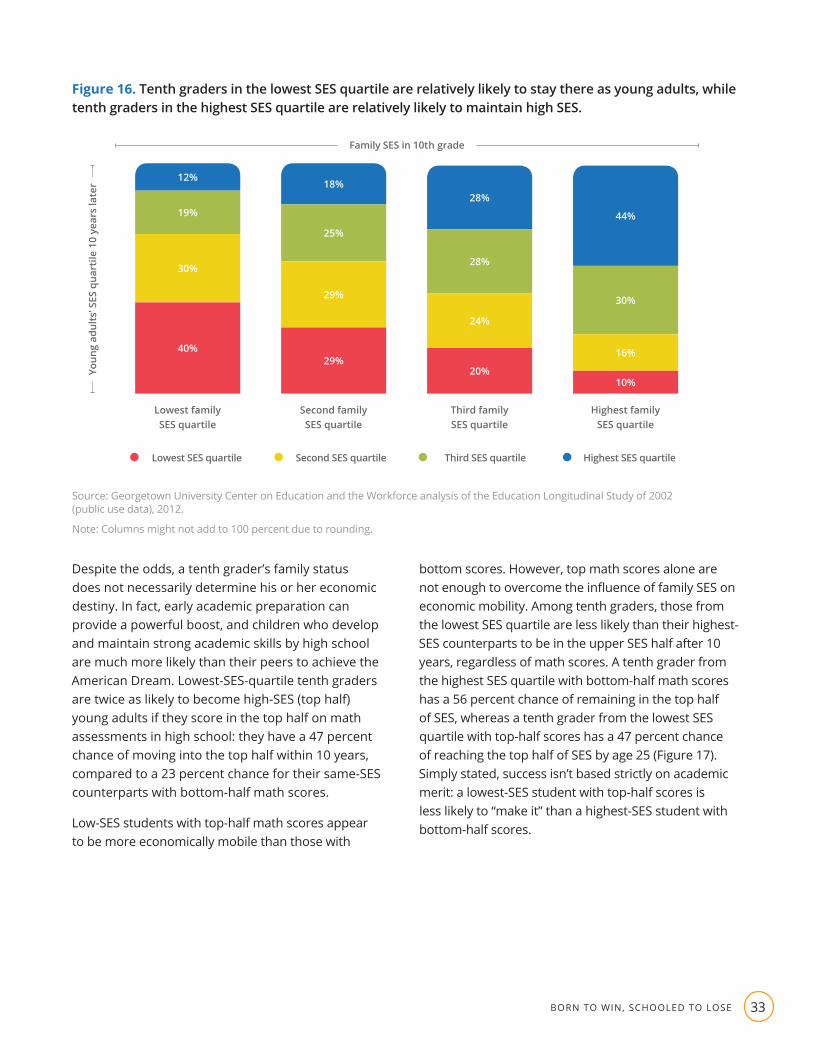
33BORN TO WIN, SCHOOLED TO LOSE
Figure 16. Tenth graders in the lowest SES quartile are relatively likely to stay there as young adults, while tenth graders in the highest SES quartile are relatively likely to maintain high SES.
Lowest family SES quartile
Second family SES quartile
Third family SES quartile
Highest family SES quartile
Lowest SES quartile Second SES quartile Third SES quartile Highest SES quartile
Family SES in 10th grade
12%18%
28%
44%19%
25%
28%
30%
30%
29%
24%
16%40%29%
20%10%
Source: Georgetown University Center on Education and the Workforce analysis of the Education Longitudinal Study of 2002 (public use data), 2012.
Note: Columns might not add to 100 percent due to rounding.
Despite the odds, a tenth grader’s family status does not necessarily determine his or her economic destiny. In fact, early academic preparation can provide a powerful boost, and children who develop and maintain strong academic skills by high school are much more likely than their peers to achieve the American Dream. Lowest-SES-quartile tenth graders are twice as likely to become high-SES (top half) young adults if they score in the top half on math assessments in high school: they have a 47 percent chance of moving into the top half within 10 years, compared to a 23 percent chance for their same-SES counterparts with bottom-half math scores.
Low-SES students with top-half math scores appear to be more economically mobile than those with
bottom scores. However, top math scores alone are not enough to overcome the influence of family SES on economic mobility. Among tenth graders, those from the lowest SES quartile are less likely than their highest-SES counterparts to be in the upper SES half after 10 years, regardless of math scores. A tenth grader from the highest SES quartile with bottom-half math scores has a 56 percent chance of remaining in the top half of SES, whereas a tenth grader from the lowest SES quartile with top-half scores has a 47 percent chance of reaching the top half of SES by age 25 (Figure 17). Simply stated, success isn’t based strictly on academic merit: a lowest-SES student with top-half scores is less likely to “make it” than a highest-SES student with bottom-half scores.
Youn
g ad
ults
’ SES
qua
rtile
10
year
s la
ter

GEORGETOWN UNIVERSITY CENTER ON EDUCATION AND THE WORKFORCE34
Figure 17. Lowest-SES tenth graders with top math scores are more economically mobile than their peers with bottom math scores, but they are still less likely to reach above-median SES as young adults than tenth graders who start in the highest-SES category.
Below-median math scores
Below-median math scores
Above-median math scores
Above-median math scores
Young adults‘ SES quartile 10 years later
Low
est f
amily
SES
qu
artil
e in
10t
h gr
ade
Hig
hest
fam
ily S
ES
quar
tile
in 1
0th
grad
e
Lowest SES quartile Second SES quartile Third SES quartile Highest SES quartile
7%
18%
24%
47%
13%
26%
29%
30%
29%
34%
23%
16%
51%
22%
24%
7%
Source: Georgetown University Center on Education and the Workforce analysis of the Education Longitudinal Study of 2002 (public use data), 2012.
Students with high test scores in 10th grade have better chances of early career success regardless of race or ethnicity.
While a majority of low-SES tenth graders will continue to have low SES 10 years later as young adults, the chance of becoming a high-SES young adult varies by race and ethnicity. Consider Black, Latino, Asian, and White tenth graders who grew up in the bottom half of the family SES distribution. A low-SES White tenth grader has a 41 percent chance of being in the upper half of the SES distribution 10 years later compared to other young adults; a low-SES Asian
tenth grader has a 51 percent chance. But for low-SES Blacks and Latinos, the chances of rising into the upper half of SES distribution are slimmer: 29 percent and 33 percent, respectively. Further, a low-SES White tenth grader has nearly a 1-in-5 chance of eventually attaining the highest quartile of SES 10 years later. By contrast, only 1 in 10 low-SES Black or Latino tenth graders rises to the highest SES quartile as a young adult (Figure 18).

35BORN TO WIN, SCHOOLED TO LOSE
Figure 18. Among low-SES tenth graders, Whites and Asians are more likely than Blacks and Latinos to become high-SES young adults in their mid-20s.
White Black/African American
Hispanic/Latino Asian/Pacific Islander
Race and ethicity of 10th graders with below-median family SES
59%70% 66%
49%
23%
19%22%
27%
18%10% 11%
24%
Below-median SES Third SES quartile Highest SES quartile
Youn
g ad
ults
‘ SES
10
year
s la
ter
Source: Georgetown University Center on Education and the Workforce analysis of the Education Longitudinal Study of 2002 (public use data), 2012.
Note: Columns might not add to 100 percent due to rounding.
77 Georgetown University Center on Education and the Workforce analysis of the Education Longitudinal Study of 2002 (public use data), 2012.
At the other end of the SES spectrum, high-SES Black and Latino tenth graders are much less likely than their White and Asian peers to remain in the upper SES half as young adults compared to others in their mid-20s. For Black and Latino students who grew up in high-SES households, the chance of remaining in the upper half of the SES distribution 10 years later is less than 50 percent, compared to 69 percent and 51 percent for White and Asian tenth graders, respectively.77
Across racial and ethnic groups, top-half math scores increase the odds that a low-SES tenth grader will become a high-SES young adult. In fact, the
difference between students with top- and bottom-half scores is relatively consistent across racial and ethnic groups. Among low-SES (below-median SES) tenth graders with top-half math scores, Whites have around a 1-in-2 chance of moving into the upper SES half 10 years later, much like their Black and Latino peers. Low-SES Asian tenth graders who have top-half scores have a 2-in-3 chance of moving into the upper SES half 10 years later. Meanwhile, across racial and ethnic groups, much lower shares of low-SES tenth graders with bottom-half math scores move into the upper SES half 10 years later (Figure 19).

GEORGETOWN UNIVERSITY CENTER ON EDUCATION AND THE WORKFORCE36
Figure 19. Low-SES tenth graders with top math scores are much more likely to rise into the upper half of SES distribution among their peers and be successful in their early careers 10 years later.
Below-median SES Above-median SES
Young adults‘ SES 10 years laterW
hite
Blac
k/Af
rica
n Am
eric
anH
ispa
nic/
Latin
oAs
ian/
Paci
fic
Isla
nder
Below-median math scores
Above-median math scores
Below-median math scores
Above-median math scores
Below-median math scores
Above-median math scores
Below-median math scores
Above-median math scores
47%
52%
53%
35%
71%
73%
70%
64%
53%
48%
47%
65%
29%
27%
30%
36%
Race
and
eth
nici
ty o
f 10t
h gr
ader
s w
ith
belo
w-m
edia
n fa
mily
SES
Source: Georgetown University Center on Education and the Workforce analysis of the Education Longitudinal Study of 2002 (public use data), 2012.
In assessing the prospects of low-SES students with bottom-half math scores in the tenth grade, one can take an optimistic or a pessimistic perspective. The optimistic view is that even with low SES and bottom-half test scores, some low-SES youth still make it into the upper half of the SES distribution in their early careers. These bottom-half-SES strivers who succeed against the odds make up similar shares of Whites (29%), Blacks (27%), Latinos (30%), and Asians (36%).
The pessimistic view is that low-SES tenth graders with bottom-half math scores make it into the upper half of the SES distribution in their early careers at only half the rate of low-SES tenth graders with top-half math scores. Racial inequities are also apparent: Asians (65%) and Whites (53%) from the lower half of the SES distribution with top-half math scores are more likely to succeed than Blacks (48%) and Latinos (47%) with similar scores.

37BORN TO WIN, SCHOOLED TO LOSE
By facing and addressing the facts, we can revive the American Dream.
If we care about improving and preserving opportunities for children of all backgrounds to achieve the American Dream, we cannot turn away from the disadvantages many face—or ignore the implications of the advantages others enjoy. The chance of a child becoming a successful young adult depends heavily on the economic class of his or her family. Favorable environments, often gained with status, protect and propel children along their academic pathways as they develop social, academic, and economic capital. Environments that don’t offer the same protections lessen the chances that children will develop the skills they need to succeed in postsecondary institutions.
The disparate intergenerational transfer of economic status crushes many children’s hopes.
Children from low-income, marginalized families are less likely than their peers from affluent, high-status families ever to enroll in a postsecondary program, complete a college degree, or earn a high-paying job. Within different socioeconomic groups, additional
disparities in educational and socioeconomic outcomes are apparent when factoring in race and ethnicity. Strong academic preparation boosts a low-SES child’s likelihood of economic mobility, but society provides too few children from low-SES families the opportunity to fully develop their academic skills. Those who show high achievement early are much less likely to reach their potential without supportive structures in place, and even those who never fall behind academically can still face environments that preclude their success.
In the end, a high-SES child with below-average academic skills is more likely to be high-SES as a young adult than a low-SES child with strong academic skills. What’s more, these inequalities can persist for generations. Children who can’t escape limiting economic circumstances, or whose options are circumscribed by continuing racial and ethnic disparities, may be unable to provide advantageous environments for their own children. And so the cycle reinforces itself. While the American Dream promises that all children can “be all they can be,” the disparate intergenerational transfer of economic status crushes many children’s hopes, and the educational system offers little relief.

GEORGETOWN UNIVERSITY CENTER ON EDUCATION AND THE WORKFORCE38
Conclusion
All individuals, regardless of where they come from or who their parents are, should have the opportunity to achieve their fullest potential. However, many poor, Black,
and Latino youth in the United States find the gates of opportunity barred—not because they lack talent, but because they are from environments defined by limited material resources and constrained social capital.
Income and connections often play a more important role than talent. Relatively advantaged children with below-median test scores are twice as likely as disadvantaged children with above-median test scores to earn a college degree as young adults. Only 25 percent of kindergartners who have top-half math scores and come from families in the lowest SES quartile will earn an associate’s or bachelor’s degree by age 25. Meanwhile, 60 percent of kindergartners who have bottom-half math scores and come from families in the highest SES quartile will earn a college degree by age 25. Most students experience false starts and stumbles, but students who are from low-SES families are more likely to fall and never recover, especially if they are Black or Latino.
Childhood environment begins making an imprint early and continues to influence students throughout their lives, stunting their growth or allowing them to flourish. High-SES students experience broadly supportive environments, from their households to their neighborhoods to their schools, while low-SES children are more likely to encounter greater financial challenges at home, be exposed to more crime in their neighborhoods, and attend underperforming schools. Advantages build on other advantages, and disadvantages build on other disadvantages.
Income and connections often play a more important role than talent.
Education can mitigate the effects of adverse environments, but it won’t fulfill its promise as the great equalizer until all students, regardless of class or race, have the same chances of achieving educational success. If education were the lever we need it to be, students with similar test scores would have similar outcomes across class, race, and ethnicity.

39BORN TO WIN, SCHOOLED TO LOSE
Unless school environments propel all students, today’s K–12 and postsecondary systems will continue to exacerbate the race- and class-based divides in educational and economic outcomes. While home
78 For example, about 50 percent of variation in lifetime earnings is determined by age 18; see Heckman, “The Case for Investing in Disadvantaged Young Children,” 2008.
79 Heckman and Raut, “Intergenerational Long-Term Effects of Preschool-Structural Estimates from Discrete Dynamic Programming Model,” 2016; Nores, “The Economics of Early Childhood Interventions,” 2010; and Heckman and Masterov, “The Productivity Argument for Investing in Young Children,” 2007.
80 Grunewald, “Early Childhood Investments,” 2018.
81 Knudsen et al., “Economic, Neurobiological, and Behavioral Perspectives on Building America’s Workforce,” 2006.
82 Cunha et al., “Interpreting the Evidence on Life Cycle Skill Formation,” 2006.
83 Cunha et al., “Interpreting the Evidence on Life Cycle Skill Formation,” 2006.
84 Carnevale et al., Three Educational Pathways to Good Jobs, 2018.
and neighborhood environments also affect students’ chances in life, the education system has a unique opportunity to enhance the advantages and counteract the disadvantages children may face in those spheres.
Policy Recommendations
The fact that so many talented young people don’t get the chance to develop into top students is intolerable—but the class and race mobility we find in our analysis shows that nothing is set in stone. Policy can amend the shortcomings of American meritocracy and help turn the equal opportunity ideal into a reality. To that end, we offer the following recommendations:
Expand academic interventions that start before kindergarten.
By the time students start kindergarten, they are already on different paths along which their advantages and disadvantages will continue to accumulate.78 Early childhood interventions are the most effective way to decrease the effects of adverse environments and improve educational outcomes.79 Increased access to high-quality preschool programs can increase school readiness and achievement and have long-term effects on educational attainment and earnings.80 Currently, programs such as Head Start and the Child Care and Development Fund, as well as federal and state tax strategies, are available to help some families afford quality childcare, but more could be done to increase access to all families.
Continue academic interventions throughout K–12.
Later interventions, while not as cost-effective, are also important. Though they might not have much influence on cognitive ability,81 they have been shown to increase non-cognitive ability, particularly grit.82 Another important aspect of later interventions is that they build on the progress of earlier interventions. Innovative schools have seen dramatic successes, as measured by high school graduation and college enrollment rates.83 These schools tend to take a wrap-around approach that sets high expectations for students and provides the resources needed for them to meet those expectations. Although these successes can be challenging to replicate, they are promising models.
Improve and expand high school counseling.
More students need better information and social supports to successfully transition from high school to postsecondary education and training. Workers with no more than a high school diploma are still able to obtain good jobs, but their opportunities to do so are few: only about 20 percent of all good jobs in the economy go to people with a high school diploma or less, and these jobs are generally not occupied by women.84 The remaining 80 percent of good jobs

GEORGETOWN UNIVERSITY CENTER ON EDUCATION AND THE WORKFORCE40
require some form of postsecondary education and training. All students need better information when deciding whether and where to attend college, how to pay for it, which courses to take, and what majors to pursue. When making these decisions, they should know in what field they are most likely to find a job and how much they will earn with a postsecondary credential. Reforms to student advising at the high school level would go a long way toward preparing high school students for college and careers.
Integrate career exploration and preparation into the advising process.
High school students do not have enough exposure to jobs, especially jobs that lead to middle-class careers. Today, only a quarter of teenagers have held any job, compared to more than half in the 1970s.85 To bridge the gap, we need to better connect education and careers while guarding against vocational tracking by race, class, and gender. All programs should be available to all students, but they are particularly important for youth from socioeconomically disadvantaged families who have limited exposure to education and career pathways. Innovative approaches like linked learning,86 career academies, and early-college high schools already exist, but only on a small scale.
85 Young people have been denied opportunities to earn and learn on the job since the 1980s, when the youth labor market began to collapse—a trend that intensified during the recessions of the 2000s. Carnevale and Garcia, 14 Is the New 12, forthcoming.
86 Linked learning is an approach that integrates academic achievement with career preparation. According to the Linked Learning Alliance (www.linkedlearning.org), it involves four components: rigorous academics, career-technical education, work-based learning, and comprehensive support services.
87 National Leadership Council on Liberal Education and America’s Promise, College Learning for the New Global Century, 2007.
Career exploration beginning as early as elementary school could include activities such as counseling, career fairs, and job shadowing. Students in high school and college should have access to internships, apprenticeships, mentorships, and opportunities to acquire industry-based credentials. Every individual should be aware of the range of possible career preparation options, including postsecondary degree and certificate programs, apprenticeships, employer- or military-provided training, and workforce development programs. At the same time, students in high school and college should receive both preparation for specific career tracks and a general education that includes exposure to a range of subject areas—a type of learning designed to convey adaptability and longevity in the workforce.87
Reforming student advising at the high school level would better prepare students for college and careers.
With these changes in policy and practice, we can replicate some of the upper-class environment’s enriching characteristics so that all students are able to achieve their fullest potential.
41BORN TO WIN, SCHOOLED TO LOSE
References
Aizer, Anna, and Janet Currie. “The Intergenerational Transmission of Inequality: Maternal Disadvantage and Health at Birth.” Science 344, no. 6186 (2014): 856–61.
Alexander, Karl L., Doris R. Entwisle, and Linda Steffel Olson. “Lasting Consequences of the Summer Learning Gap.” American Sociological Review 72, no. 2 (2007): 167–80.
Asante-Muhammad, Dedrick, Chuck Collins, Josh Hoxie, and Emanuel Nieves. The Ever-Growing Gap: Without Change, African-American and Latino Families Won’t Match White Wealth for Centuries. Washington, DC: Corporation for Enterprise Development and the Institute for Policy Studies, 2016.
Badger, Emily, Claire Cain Miller, Adam Pearce, and Kevin Quealy. “Extensive Data Shows Punishing Reach of Racism for Black Boys.” New York Times, March 19, 2018.
Bianchi, Suzanne M., and John Robinson. “What Did You Do Today? Children’s Use of Time, Family Composition, and the Acquisition of Social Capital.” Journal of Marriage and Family 59, no. 2 (May 1997): 332–44.
Brooks-Gunn, Jeanne, and Greg J. Duncan. “The Effects of Poverty on Children.” The Future of Children (1997): 55–71.
Bronfenbrenner, Urie, and Pamela A. Morris. “The Ecology of Developmental Processes.” In Handbook of Child Psychology: Theoretical Models of Human Development, edited by William Damon and Richard M. Lerner, 993–1028. Hoboken, NJ: John Wiley & Sons, 1998.
Burdick-Will, Julia. “School Violent Crime and Academic Achievement in Chicago.” Sociology of Education 86, no. 4 (2013): 343–61.
Boyce, W. Thomas. “A Biology of Misfortune.” Focus 29, no. 1 (Spring/Summer 2012): 1–6.
Carneiro, Pedro, James J. Heckman, and Dimitriy V. Masterov. “Labor Market Discrimination and Racial Differences in Premarket Factors.” Journal of Law and Economics 48, no. 1 (2005): 1–39.
Carnevale, Anthony P. “Every Year, Half a Million Top-Scoring Students Never Get a College Credential,” LinkedIn, April 12, 2018, https://www.linkedin.com/pulse/every-year-half-million-top-scoring-students-never-get-carnevale/.
Carnevale, Anthony P., and Tanya I. Garcia. 14 Is the New 12. Washington, DC: Georgetown University Center on Education and the Workforce, forthcoming.
Carnevale, Anthony P., Tamara Jayasundera, and Artem Gulish. America’s Divided Recovery: College Haves and Have-Nots. Washington, DC: Georgetown University Center on Education and the Workforce, 2016.
Carnevale, Anthony P., and Jeff Strohl. “How Increasing College Access Is Increasing Inequality, and What to Do About It.” In Rewarding Strivers, edited by Richard D. Kahlenberg, 71–190. New York: The Century Foundation Press, 2010.
Carnevale, Anthony P., and Jeff Strohl. Separate and Unequal: How Higher Education Reinforces the Intergenerational Reproduction of White Racial Privilege. Washington, DC: Georgetown University Center on Education and the Workforce, 2013.
Carnevale, Anthony P., Jeff Strohl, Ban Cheah, and Neil Ridley. Good Jobs That Pay without a BA. Washington, DC: Georgetown University Center on Education and the Workforce, 2017.
Carnevale, Anthony P., Jeff Strohl, Neil Ridley, and Artem Gulish. Three Educational Pathways to Good Jobs: High School, Middle Skills, and Bachelor’s Degree. Washington, DC: Georgetown University Center on Education and the Workforce, 2018.

GEORGETOWN UNIVERSITY CENTER ON EDUCATION AND THE WORKFORCE42
Carrell, Scott E., and Mark L. Hoekstra. “Externalities in the Classroom: How Children Exposed to Domestic Violence Affect Everyone’s Kids.” American Economic Journal: Applied Economics 2, no. 1 (2010): 211–28.
Cataldi, Emily Forrest, Christopher T. Bennett, and Xianglei Chen. “First-Generation Students: College Access, Persistence, and Postbachelor’s Outcomes.” Stats in Brief (February 2018). Washington, DC: US Department of Education, National Center for Education Statistics, 2018.
Chapman, Chris. Early Childhood Longitudinal Study, Kindergarten Class of 1998-99 (ECLS-K), Public Version (NCES 2009-005). Washington, DC: US Department of Education, National Center for Education Statistics, 2009.
Chetty, Raj, Nathaniel Hendren, Maggie R. Jones, and Sonya R. Porter. “Race and Economic Opportunity in the United States: An Intergenerational Perspective.” Working Paper, Cambridge, MA: Opportunity Insights, 2018.
Chetty, Raj, Nathaniel Hendren, Patrick Kline, and Emmanuel Saez. “Where Is the Land of Opportunity? The Geography of Intergenerational Mobility in the United States.” Quarterly Journal of Economics 129, no. 4 (2014): 1553–1623.
Claro, Susana, David Paunesku, and Carol S. Dweck. “Growth Mindset Tempers the Effects of Poverty on Academic Achievement.” Proceedings of the National Academy of Sciences of the United States of America 113, no. 31 (2016): 8664–68.
Clotfelter, Charles T., Helen F. Ladd, and Jacob L. Vigdor. “Teacher-Student Matching and the Assessment of Teacher Effectiveness.” Journal of Human Resources 41, no. 4 (2006): 778–820.
Coleman, James S., Ernest Q. Campbell, Carol J. Hobson, and others. Equality of Educational Opportunity. Washington, DC: US Department of Health, Education and Welfare, 1966.
Cornman, Stephen Q., Lei Zhou, Malia R. Howell, and Jumaane Young. Revenues and Expenditures for Public Elementary and Secondary Education: School Year 2015-16 (Fiscal Year 2016). Washington, DC: US Department of Education, National Center for Education Statistics, 2018.
Cotti, Chad D., John Gordanier, and Orgul D. Ozturk. “When Does It Count? The Timing of Food Stamp Receipt and Educational Performance.” June 25, 2017. https://ssrn.com/abstract=2992390.
Cunha, Flavio, James J. Heckman, Lance Lochner, and Dimitriy V. Masterov. “Interpreting the Evidence on Life Cycle Skill Formation.” Handbook of the Economics of Education 1 (2006): 697–812.
Duncan, Greg J., Jens Ludwig, and Katherine A. Magnuson. “Child Development.” In Targeting Investments in Children: Fighting Poverty When Resources Are Limited, edited by Philip B. Levine and David J. Zimmerman, 27–58. Chicago: University of Chicago Press, 2010.
Duncan, Greg J., and Richard J. Murnane. “Introduction: The American Dream, Then and Now.” In Whither Opportunity?, edited by Greg J. Duncan and Richard J. Murnane, 3–26. New York: Russell Sage Foundation, 2011.
Early Childhood Longitudinal Study, Kindergarten Class of 2010-11 (ECLS-K:2011), Public Version (NCES 2018-033). Washington, DC: US Department of Education, National Center for Education Statistics, 2018.
EdBuild, “Nonwhite School Districts Get $23 Billion Less Than White Districts Despite Serving the Same Number of Students,” 2019. https://edbuild.org/content/23-billion.
Education Longitudinal Study of 2002 (ELS:2002), Public Version (NCES 2014-365). Washington, DC: US Department of Education, National Center for Education Statistics, 2014.
Essex, Marilyn J., W. Thomas Boyce, Clyde Hertzman, Lucia L. Lam, Jeffrey M. Armstrong, Sarah M. A. Neumann, and Michael S. Kobor. “Epigenetic Vestiges of Early Developmental Adversity: Childhood Stress Exposure and DNA Methylation in Adolescence.” Child Development 84, no. 1 (2013): 58–75.
Evans, Gary W., and Elyse Kantrowitz. “Socioeconomic Status and Health: The Potential Role of Environmental Risk Exposure.” Annual Review of Public Health 23, no. 1 (2002): 303–31.
Fletcher, Jason M. “Social Interactions in College Choice: The Interplay of Information, Preferences, Social Norms, and Individual Characteristics in Predicting College Choice.” Working Paper, Princeton, NJ: Texas Higher Education Opportunity Project, 2006. http://theop.princeton.edu/reports/wp/Fletcher%20THEOP.pdf.
Flores, Stella M., Toby J. Park, and Dominique J. Baker. “The Racial College Completion Gap: Evidence from Texas.” Journal of Higher Education 88, no. 6 (April 3, 2017): 894–921.
Fox, Sharon E., Pat Levitt, and Charles A. Nelson III. “How the Timing and Quality of Early Experiences Influence the Development of Brain Architecture.” Child Development 81, no. 1 (2010): 28–40.
Frey, William H. “Census Data: Blacks and Hispanics Take Different Segregation Paths.” Washington, DC: Brookings Institution, December 16, 2010. https://www.brookings.edu/opinions/census-data-blacks-and-hispanics-take-different-segregation-paths/.
Graham, Bryan S. “Identifying Social Interactions Through Conditional Variance Restrictions.” Econometrica 76, no. 3 (2008): 643–60.
Gregory, Anne, Russell J. Skiba, and Pedro A. Noguera. “The Achievement Gap and the Discipline Gap: Two Sides of the Same Coin?” Educational Researcher 39, no. 1 (January/February 2010): 59–68.
Grunewald, Rob. “Early Childhood Investments: Paving the Way for the Future Workforce.” In Investing in America’s Workforce: Improving Outcomes for Workers and Employers, Vol. 1, edited by Stuart Andreason, Todd Greene, Heath Prince, and Carl E. Van Horn, 297–314. Kalamazoo, MI: W.E. Upjohn Institute for Employment Research, 2018.
Hanks, Angela, Danyelle Solomon, and Christian E. Weller. Systematic Inequality: How America’s Structural Racism Helped Create the Black-White Wealth Gap. Washington, DC: Center for American Progress, 2018.

43BORN TO WIN, SCHOOLED TO LOSE
Hanson, Jamie L., Nicole Hair, Dinggang G. Shen, Feng Shi, John H. Gilmore, Barbara L. Wolfe, and Seth D. Pollak. “Family Poverty Affects the Rate of Human Infant Brain Growth.” PLoS One 8, no. 12 (2013): e80954.
Hanushek, Eric A., John F. Kain, and Steven G. Rivkin. “Why Public Schools Lose Teachers.” Journal of Human Resources 39, no. 2 (2004): 326–54.
Hanushek, Eric A., and Steven G. Rivkin. “Harming the Best: How Schools Affect the Black-White Achievement Gap.” Journal of Policy Analysis and Management 28, no. 3 (2009): 366–93.
Harris, Kathleen Mullan, and J. Richard Udry. National Longitudinal Study of Adolescent to Adult Health (Add Health), 1994–2008 (Public Use). Ann Arbor, MI: Carolina Population Center, University of North Carolina-Chapel Hill (distributor), Inter-university Consortium for Political and Social Research (distributor), 2018-07-25. https://doi.org/10.3886/ICPSR21600.v19.
Heckman, James J. “The Case for Investing in Disadvantaged Young Children.” DESifo DICE Report 6, no. 2 (June 2008): 3–8.
Heckman, James J., and Dimitriy V. Masterov. “The Productivity Argument for Investing in Young Children.” Review of Agricultural Economics, American Agricultural Economics Association 29, no. 3 (2007): 446–93.
Heckman, James J., and Stefano Mosso. “The Economics of Human Development and Social Mobility.” Annual Review of Economics 6 (2014): 689–733.
Heckman, James J., and Lakshmi K. Raut. “Intergenerational Long-Term Effects of Preschool—Structural Estimates from a Discrete Dynamic Programming Model.” Journal of Economics 191, no. 1 (2016): 165–75.
Hofferth, Sandra L., and John F. Sandberg. “How American Children Spend Their Time.” Journal of Marriage and Family 63, no. 2 (2001): 295–308.
Iceland, John, Daniel Weinberg, and Lauren Hughes. “The Residential Segregation of Detailed Hispanic and Asian Groups in the United States: 1980–2010.” Demographic Research 31 (September 2014): 593–624.
Ingels, Steven J., Daniel J. Pratt, David Wilson, Laura J. Burns, Douglas Currivan, James E. Rogers, and Sherry Hubbard-Bednasz. Education Longitudinal Study of 2002 (ELS:2002): Base-Year to Second Follow-up Data File Documentation (NCES 2008-347). Washington, DC: US Department of Education, National Center for Education Statistics, 2007.
Kitsantas, Anastasia, Adam Winsler, and Faye Huie. “Self-Regulation and Ability Predictors of Academic Success During College: A Predictive Validity Study.” Journal of Advanced Academics 20, no. 1 (2008): 42–68.
Knudsen, Eric I., James J. Heckman, Judy L. Cameron, and Jack P. Shonkoff. “Economic, Neurobiological, and Behavioral Perspectives on Building America’s Future Workforce.” Proceedings of the National Academy of Sciences 103, no. 27 (2006): 10155–62.
Kolluri, Suneal. “Advanced Placement: The Dual Challenge of Equal Access and Effectiveness.” Review of Educational Research 88, no. 5 (2018): 671–711.
Lafortune, Julien, Jesse Rothstein, and Diane Whitmore Schanzenbach. “School Finance Reform and the Distribution of Student Achievement.” American Economic Journal: Applied Economics 10, no. 2 (2016): 1–26.
Lareau, Annette. “Invisible Inequality: Social Class and Childrearing in Black Families and White Families.” American Sociological Review (2002): 747–76.
Lemke, Mariann, Laura Lippman, Ghedam Bairu, Christopher Calsyn, Thea Kruger, Leslie Jocelyn, David Kastberg, Yan Yun Liu, Stephen Roey, and Trevor Williams. “Outcomes of Learning: Results from the 2000 Program for International Student Assessment of 15-Year-Olds in Reading, Mathematics, and Science Literacy.” Washington, DC: US Department of Education, National Center for Education Statistics, 2001.
Melchior, Maria, Terrie E. Moffitt, Barry J. Milne, Richie Poulton, and Avshalom Caspi. “Why Do Children from Socioeconomically Disadvantaged Families Suffer from Poor Health When They Reach Adulthood? A Life-Course Study.” American Journal of Epidemiology 166, no. 8 (2007): 966–74.
Mikulecky, Larry. “Family Literacy: Parent and Child Interactions.” In Family Literacy: Directions in Research and Implications for Practice, edited by L. Ann Benjamin and Jerome Lord, 55–65. Washington, DC: US Department of Education Office of Educational Research and Improvement, 1996.
National Leadership Council on Liberal Education and America’s Promise. College Learning for the New Global Century. Washington, DC: Association of American Colleges and Universities, 2007.
National Opinion Research Center. A Supplemental File for PRESTG10 and SEI10. Chicago, IL: University of Chicago, 2017.
Nichols, Andrew. A Look at Latino Student Success: Identifying Top- and Bottom-Performing Institutions. Washington, DC: The Education Trust, 2017.
Niu, Sunny, and Marta Tienda. “Delayed Enrollment and College Plans: Is There a Postponement Penalty?” Journal of Higher Education 84, no. 1 (2013): 1–27.
Nores, Milagros. “The Economics of Early Childhood Interventions.” In Economics of Education, edited by Dominic J. Brewer and Patrick J. McEwan, 191–96. Oxford: Academic Press, 2010.
Papageorge, Nicholas W., and Kevin Thom. “Genes, Education, and Labor Market Outcomes: Evidence from the Health and Retirement Study,” NBER Working Paper 25114, National Bureau of Economic Research, Cambridge, MA, 2018.
Papageorge, Nicholas W., Seth Gershenson, and Kyungmin Kang. “Teacher Expectations Matter,” IZA Discussion Paper 10165, Institute for the Study of Labor, Bonn, Germany, August 2016.
Peterson, Ruth D., and Lauren J. Krivo. Divergent Social Worlds: Neighborhood Crime and the Racial-Spatial Divide. New York: Russell Sage Foundation, 2010.
Phillips, Meredith, Jeanne Brooks-Gunn, Greg J. Duncan, Pamela Klebanov, and Jonathan Crane. “Family Background, Parenting Practices, and the Black–White Test Score Gap.” In The Black–White Test Score Gap, 103–45. Washington, DC: Brookings Institution Press, 1998.

GEORGETOWN UNIVERSITY CENTER ON EDUCATION AND THE WORKFORCE44
Programme for International Student Assessment. Knowledge and Skills for Life: First Results from the OECD Programme for International Student Assessment (PISA) 2000. Organisation for Economic Co-operation and Development, 2001.
Reardon, Sean F. “The Widening Academic Achievement Gap between the Rich and the Poor: New Evidence and Possible Explanations.” In Whither Opportunity?, edited by Greg J. Duncan and Richard J. Murnane, 91–117. New York: Russell Sage Foundation, 2011.
Rivkin, Steven G., Eric A. Hanushek, and John F. Kain. “Teachers, Schools, and Academic Achievement.” Econometrica 73, no. 2 (2005): 417–58.
Rogers, James E., Ethan Ritchie, and Laura Burns Fritch. High School Longitudinal Study of 2009 (HSLS:09) (NCES 2018-142). Washington, DC: US Department of Education, National Center for Education Statistics, 2018.
Roksa, Josipa, and Peter Kinsley. “The Role of Family Support in Facilitating Academic Success of Low-Income Students.” Research in Higher Education (2018): 1–22.
Rothstein, Richard. Class and Schools: Using Social, Economic, and Educational Reform to Close the Black–White Achievement Gap. New York: Teachers College, Columbia University, 2004.
Rothstein, Richard. The Color of Law: A Forgotten History of How Our Government Segregated America. New York: Liveright Publishing Corporation, 2017.
Rothstein, Richard, Martin Carnoy, and Luis Benveniste. Can Public Schools Learn from Private Schools? Case Studies in the Public and Private Nonprofit Sectors. Washington, DC: Economic Policy Institute, 1999.
Rowe, Meredith L. “A Longitudinal Investigation of the Role of Quantity and Quality of Child-Directed Speech in Vocabulary Development.” Child Development 83, no. 5 (2012): 1762–74.
Ruggles, Steven, Sarah Flood, Ronald Goeken, Josiah Grover, Erin Meyer, Jose Pacas, and Matthew Sobek. IPUMS USA: Version 8.0. Minneapolis, MN: IPUMS, 2018. http://doi.org/10.18128/D010.V8.0.
Sablan, Jenna. “Pacific Islanders and College Readiness.” Data sheet published by the Pullias Center for Higher Education, Rossier School of Education. Los Angeles, CA: University of Southern California, May 2015.
Sameroff, Arnold. “A Unified Theory of Development: A Dialectic Integration of Nature and Nurture.” Child Development 81, no. 1 (2010): 6–22.
Schütz, Gabriela, Heinrich W. Ursprung, and Ludger Wößmann. “Education Policy and Equality of Opportunity.” Kyklos 61, no. 2 (2008): 279–308.
Sharkey, Patrick, Amy Ellen Schwartz, Ingrid Gould Ellen, and Johanna Lacoe. “High Stakes in the Classroom, High Stakes on the Street: The Effects of Community Violence on Students’ Standardized Test Performance.” Sociological Science 1 (2014): 199.
Skiba, Russell J., Robert H. Horner, Choong-Geun Chung, M. Karega Rausch, Seth L. May, and Tary Tobin. “Race Is Not Neutral: A National Investigation of African American and Latino Disproportionality in School Discipline.” School Psychology Review 40, no. 1 (2011): 85–107.
Snow, Catherine, and Patton Tabors. “Intergenerational Transfer of Literacy.” In Family Literacy: Directions in Research and Implications for Practice, edited by L. Ann Benjamin and Jerome Lord, 73–80. Washington, DC: US Department of Education and Office of Educational Research and Improvement, 1996.
Sperry, Douglas E., Linda L. Sperry, and Peggy J. Miller. “Reexamining the Verbal Environments of Children from Different Socioeconomic Backgrounds.” Child Development (2018).
Tenenbaum, Harriet R., and Martin D. Ruck. “Are Teachers’ Expectations Different for Racial Minority than for European American Students? A Meta-Analysis.” Journal of Education Psychology 99, no. 2 (2007): 253–73.
Tourangeau, Karen, Christine Nord, Thanh Lê, Alberto G. Sorongon, and Michelle Najarian. Early Childhood Longitudinal Study, Kindergarten Class of 1998–99 (ECLS-K): Combined User’s Manual for the ECLS-K Eighth-Grade and K–8 Full Sample Data Files and Electronic Codebooks (NCES 2009-004). Washington, DC: US Department of Education, National Center for Education Statistics, 2009.
Turkheimer, Eric, Andreana Haley, Mary Waldron, Brian D’Onofrio, and Irving I. Gottesman. “Socioeconomic Status Modifies Heritability of IQ in Young Children.” Psychological Science 14, no. 6 (November 2003): 623–28.
Turner, Sarah. “Going to College and Finishing College: Explaining Different Educational Outcomes.” In College Choices: The Economics of Where to Go, When to Go, and How to Pay for It, edited by Caroline M. Hoxby, 13–62. Cambridge, MA: National Bureau of Economic Research, 2004.
US Bureau of Labor Statistics. Consumer Expenditure Survey. 2017.
US Census Bureau. American Community Survey (ACS): 2016: one-year person-level microdata files. http://www2.census.gov/.
US Government Accountability Office. K–12 Education: Better Use of Information Could Help Agencies Identify Disparities and Address Racial Discrimination. GAO-16-345, April 2016.
Ushomirsky, Natasha, and David Williams. Funding Gaps 2015: Too Many States Still Spend Less on Educating Students Who Need the Most. Washington, DC: The Education Trust, 2015.
Weisleder, Adriana, and Anne Fernald. “Talking to Children Matters: Early Language Experience Strengthens Processing and Builds Vocabulary.” Psychological Science 24, no. 11 (2013): 2143–52.
Wong, Vivian C., Thomas D. Cook, W. Steven Barnett, and Kwanghee Jung. “An Effectiveness-Based Evaluation of Five State Pre-Kindergarten Programs.” Journal of Policy Analysis and Management: The Journal of the Association for Public Policy Analysis and Management 27, no. 1 (2008): 122–54.
45BORN TO WIN, SCHOOLED TO LOSE
APPENDIX A
Data Sources and Methodology
American Community Survey (ACS)
The ACS is a nationally representative survey conducted annually by the US Census Bureau. Each year, the ACS is mailed to over 3 million households across the United States to collect data about jobs and occupations, educational attainment, veteran status, and whether people own or rent their homes, among other topics. The ACS contains information on family relationships, demographics, health insurance, education, work, income, occupational standing, migration, disability, and veteran status. We extracted publicly available data gathered by this survey to provide context and detail regarding differences in environment based on race or ethnicity and socioeconomic status (SES).
Consumer Expenditure Survey (CE)
The CE is a nationally representative household survey of the buying habits of the US population collected by the Bureau of Labor Statistics. In addition to data on expenditures, the CE also provides data on demographic characteristics and income of households. CE estimates are derived from two separate surveys: an interview survey and a diary survey. This report used data from the survey to compare differences in average spending on enrichment activities by household income quintiles. Enrichment activities include expenditures on
education (such as tuition, tutors, and school supplies) and entertainment (books and other reading materials; admission to movies, concerts, parks, and other events; audio and visual equipment; and pets, toys, and hobbies).
Early Childhood Longitudinal Study: Kindergarten Class of 1998–99 (ECLS-K)
ECLS-K is a longitudinal study that follows a representative cohort of kindergartners in fall 1998 and spring 1999 and first-graders in fall 1999 and spring 2000. The study includes parent interviews, teacher and school administrator questionnaires, and child assessments. Follow-up data collection occurred in spring 2002, spring 2004, and spring 2007. For this report, we used data from the spring 1999 parent interview base survey to inform demographic and socioeconomic class analysis. Additionally, we used assessments of children’s reading and math skills and knowledge available in the spring of each collection year.
To measure the progression of student math scores, we used scores of each available spring assessment: kindergarten, first grade, third grade, fifth grade, and eighth grade. Quartiles of each of these scores were defined using a panel weight. SES scores were

GEORGETOWN UNIVERSITY CENTER ON EDUCATION AND THE WORKFORCE46
composite variables derived from father’s/male guardian’s education, mother’s/female guardian’s education, father’s/male guardian’s occupation, mother’s/female guardian’s occupation, and household income. Occupational prestige scores were calculated using values from the 1989 General Social Survey (GSS).
The Education Longitudinal Study of 2002 (ELS)
ELS is a nationally representative longitudinal study that follows a cohort of people who were tenth graders in 2002 with a freshened sample of twelfth graders. Following base-year interviews in 2002, researchers conducted three follow-up interviews in 2004, 2006, and 2012. Additionally, the study includes high school transcript and postsecondary transcript data collected in 2005 and 2013, respectively. ELS data include a wide range of information on high school performance, postsecondary access, and early labor market outcomes. We use ELS to measure high school math scores and student outcomes.
We defined quartiles using math scores in tenth grade and twelfth grade using a panel weight that included students who were assessed in both these grades. When comparing student outcomes, we used tenth-grade math scores as a baseline in order to capture students who had dropped out by the twelfth grade. We used a different panel weight to include students who were captured in both the sophomore-year assessment and the final follow-up survey.
Family SES is based on five equally weighted and standardized variables: father’s/male guardian’s education, mother’s/female guardian’s education, family income, father’s/male guardian’s occupation, and mother’s/female guardian’s occupation. The occupational prestige scores used were defined by the 1961 Duncan Socioeconomic Index. Young adult SES draws on three variables: 2011 earnings, occupational prestige of most recent job, and educational attainment.
The National Longitudinal Study of Adolescent to Adult Health (Add Health)
Add Health is a nationally representative longitudinal sample of adolescents who were in seventh to twelfth grades in the United States during the 1994–95 school year. To date, the respondents have been followed into adulthood, with five in-home interviews conducted in 1995, 1996, 2001–02, 2007–08, and 2016–18. This survey examines social, economic, psychological, and physical well-being using contextual data about respondents’ families, neighborhoods, communities, schools, friendships, peer groups, and romantic relationships. We used Add Health data to compare differences in environment based on race, ethnicity, and SES.
A note on statistical testing: In cases in which we observed relatively small differences between groups, we tested that the key findings were statistically significantly different from each other. In particular, we conducted a two-sample test of proportions in the following cases: kindergarten test-score distributions by SES quartile and race, college enrollments by SES quartile and test-score half, college completion by SES quartile and test-score half, and SES as a young adult by tenth grade family SES quartile and test-score half. In each case, we found that our findings were statistically different from each other at the 5 percent significance level.

47BORN TO WIN, SCHOOLED TO LOSE
APPENDIX B
Robustness Checks
1 This follows methodology developed by Hanushek and Rivkin, “Harming the Best,” 2009.
2 General knowledge and science test scores were available in the Early Childhood Longitudinal Study, but not starting in kindergarten. Further, these test scores were not available in the Education Longitudinal Study of 2002.
T o affirm that our findings would hold had we approached our analysis differently, we conducted a series of robustness checks. These checks focused on whether our findings
might be sensitive to three factors: a change in the skill set assessed, a change in the data sets used, and a change in our approach to evaluating student scores.
First, we examined the relationship between educational progression and reading scores instead of math scores. We did this to ensure that our findings were consistent with patterns in students’ educational progression generally, as opposed to their progression in math alone.
Second, we explored alternative data sets. To ensure the reliability of our findings for primary school, we compared data from the Early Childhood Longitudinal Study for the kindergarten cohort of 1998–99 (our data source for this report) to data for the kindergarten cohort of 2010–11. To ensure the reliability of our findings for high school, we compared data from the Education Longitudinal Study of 2002 (our data source for this report) with data from the High School Longitudinal Study (2009 cohort).
Finally, we considered the potential implications of regression to the mean. In brief, regression to the mean is the hypothesis that the mean score across multiple administrations of a test is more meaningful than the score at any single administration, because the results of any single administration may be affected by anomalies (for example, guessed responses or less-than-ideal testing conditions). To account for regression to the mean, we conducted a test using reading scores alongside math scores to categorize kindergartners as having high or low test scores.1
Across these three factors, our checks affirmed our methodology, as described in detail below.
Comparison across Different Skill Sets
We focused our primary analysis on math scores for two reasons: (1) our data set did not include twelfth-grade reading scores, and (2) math scores do not depend on basic English-language proficiency and thus are a more inclusive measure.2 To test our analysis of math scores and confirm that our findings are
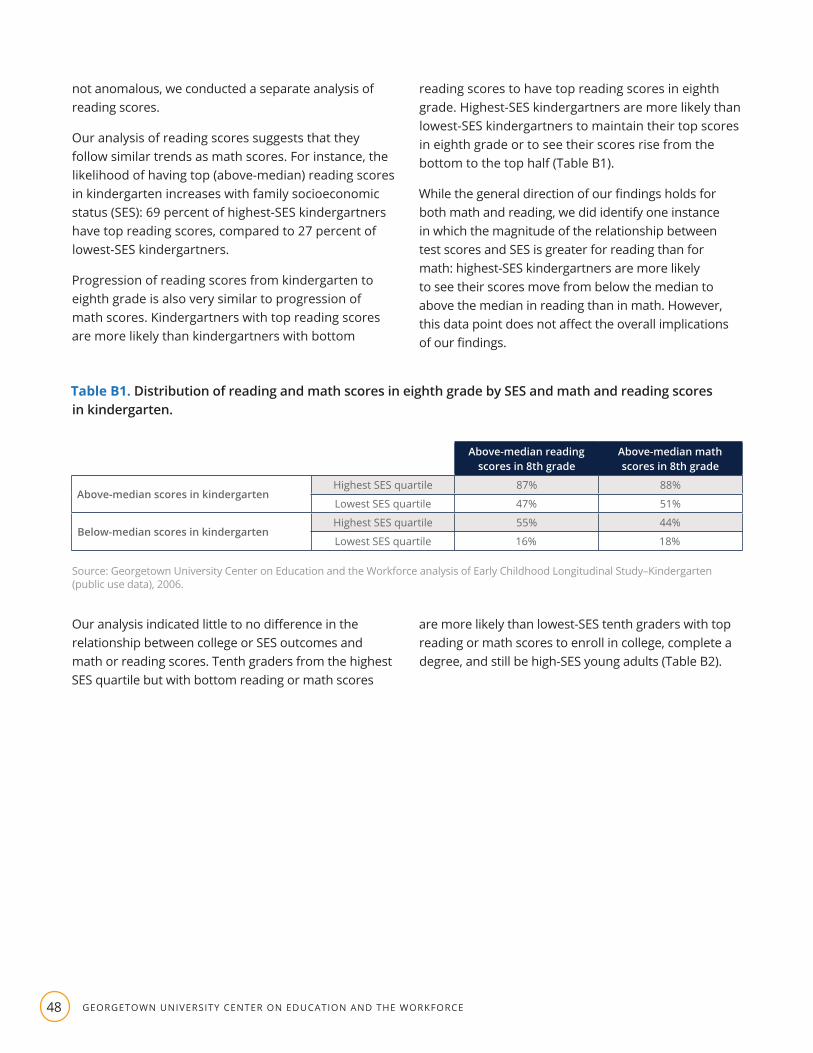
GEORGETOWN UNIVERSITY CENTER ON EDUCATION AND THE WORKFORCE48
not anomalous, we conducted a separate analysis of reading scores.
Our analysis of reading scores suggests that they follow similar trends as math scores. For instance, the likelihood of having top (above-median) reading scores in kindergarten increases with family socioeconomic status (SES): 69 percent of highest-SES kindergartners have top reading scores, compared to 27 percent of lowest-SES kindergartners.
Progression of reading scores from kindergarten to eighth grade is also very similar to progression of math scores. Kindergartners with top reading scores are more likely than kindergartners with bottom
reading scores to have top reading scores in eighth grade. Highest-SES kindergartners are more likely than lowest-SES kindergartners to maintain their top scores in eighth grade or to see their scores rise from the bottom to the top half (Table B1).
While the general direction of our findings holds for both math and reading, we did identify one instance in which the magnitude of the relationship between test scores and SES is greater for reading than for math: highest-SES kindergartners are more likely to see their scores move from below the median to above the median in reading than in math. However, this data point does not affect the overall implications of our findings.
Table B1. Distribution of reading and math scores in eighth grade by SES and math and reading scores in kindergarten.
Above-median reading scores in 8th grade
Above-median math scores in 8th grade
Above-median scores in kindergartenHighest SES quartile 87% 88%
Lowest SES quartile 47% 51%
Below-median scores in kindergartenHighest SES quartile 55% 44%
Lowest SES quartile 16% 18%
Source: Georgetown University Center on Education and the Workforce analysis of Early Childhood Longitudinal Study–Kindergarten (public use data), 2006.
Our analysis indicated little to no difference in the relationship between college or SES outcomes and math or reading scores. Tenth graders from the highest SES quartile but with bottom reading or math scores
are more likely than lowest-SES tenth graders with top reading or math scores to enroll in college, complete a degree, and still be high-SES young adults (Table B2).
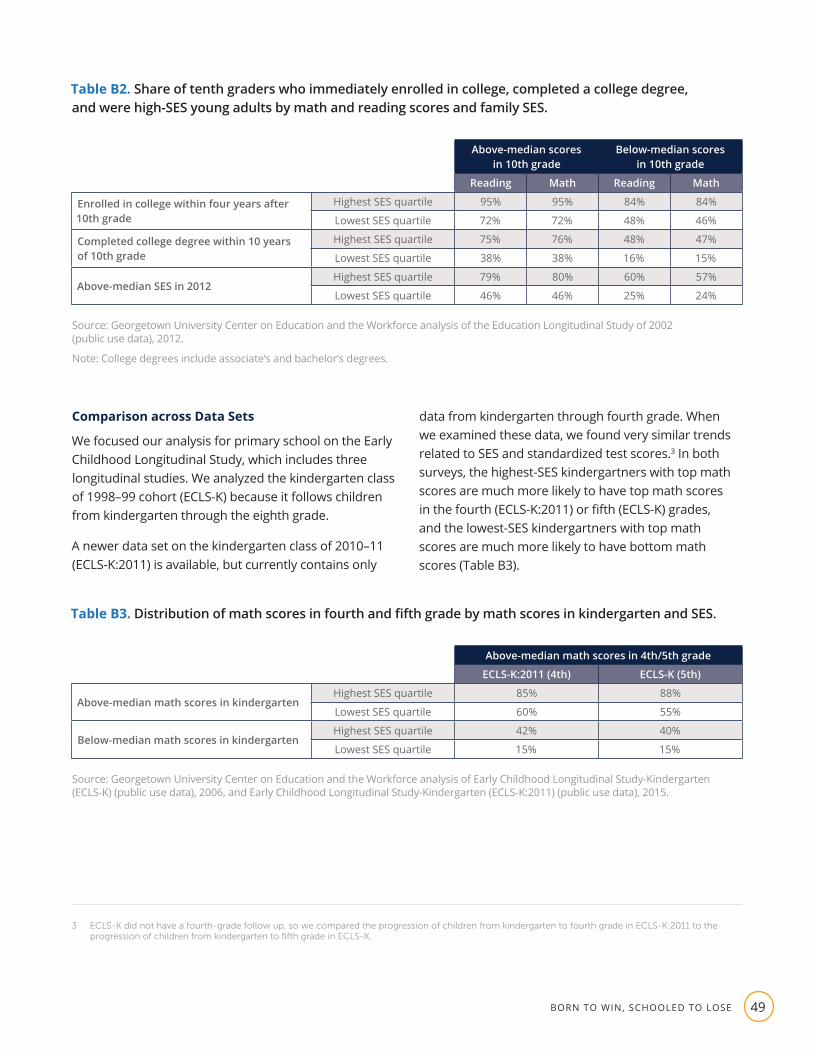
49BORN TO WIN, SCHOOLED TO LOSE
Table B2. Share of tenth graders who immediately enrolled in college, completed a college degree, and were high-SES young adults by math and reading scores and family SES.
Above-median scores in 10th grade
Below-median scores in 10th grade
Reading Math Reading Math
Enrolled in college within four years after 10th grade
Highest SES quartile 95% 95% 84% 84%
Lowest SES quartile 72% 72% 48% 46%
Completed college degree within 10 years of 10th grade
Highest SES quartile 75% 76% 48% 47%
Lowest SES quartile 38% 38% 16% 15%
Above-median SES in 2012Highest SES quartile 79% 80% 60% 57%
Lowest SES quartile 46% 46% 25% 24%
Source: Georgetown University Center on Education and the Workforce analysis of the Education Longitudinal Study of 2002 (public use data), 2012.
Note: College degrees include associate’s and bachelor’s degrees.
3 ECLS-K did not have a fourth-grade follow up, so we compared the progression of children from kindergarten to fourth grade in ECLS-K:2011 to the progression of children from kindergarten to fifth grade in ECLS-K.
Comparison across Data Sets
We focused our analysis for primary school on the Early Childhood Longitudinal Study, which includes three longitudinal studies. We analyzed the kindergarten class of 1998–99 cohort (ECLS-K) because it follows children from kindergarten through the eighth grade.
A newer data set on the kindergarten class of 2010–11 (ECLS-K:2011) is available, but currently contains only
data from kindergarten through fourth grade. When we examined these data, we found very similar trends related to SES and standardized test scores.3 In both surveys, the highest-SES kindergartners with top math scores are much more likely to have top math scores in the fourth (ECLS-K:2011) or fifth (ECLS-K) grades, and the lowest-SES kindergartners with top math scores are much more likely to have bottom math scores (Table B3).
Table B3. Distribution of math scores in fourth and fifth grade by math scores in kindergarten and SES.
Above-median math scores in 4th/5th grade
ECLS-K:2011 (4th) ECLS-K (5th)
Above-median math scores in kindergartenHighest SES quartile 85% 88%
Lowest SES quartile 60% 55%
Below-median math scores in kindergartenHighest SES quartile 42% 40%
Lowest SES quartile 15% 15%
Source: Georgetown University Center on Education and the Workforce analysis of Early Childhood Longitudinal Study-Kindergarten (ECLS-K) (public use data), 2006, and Early Childhood Longitudinal Study-Kindergarten (ECLS-K:2011) (public use data), 2015.
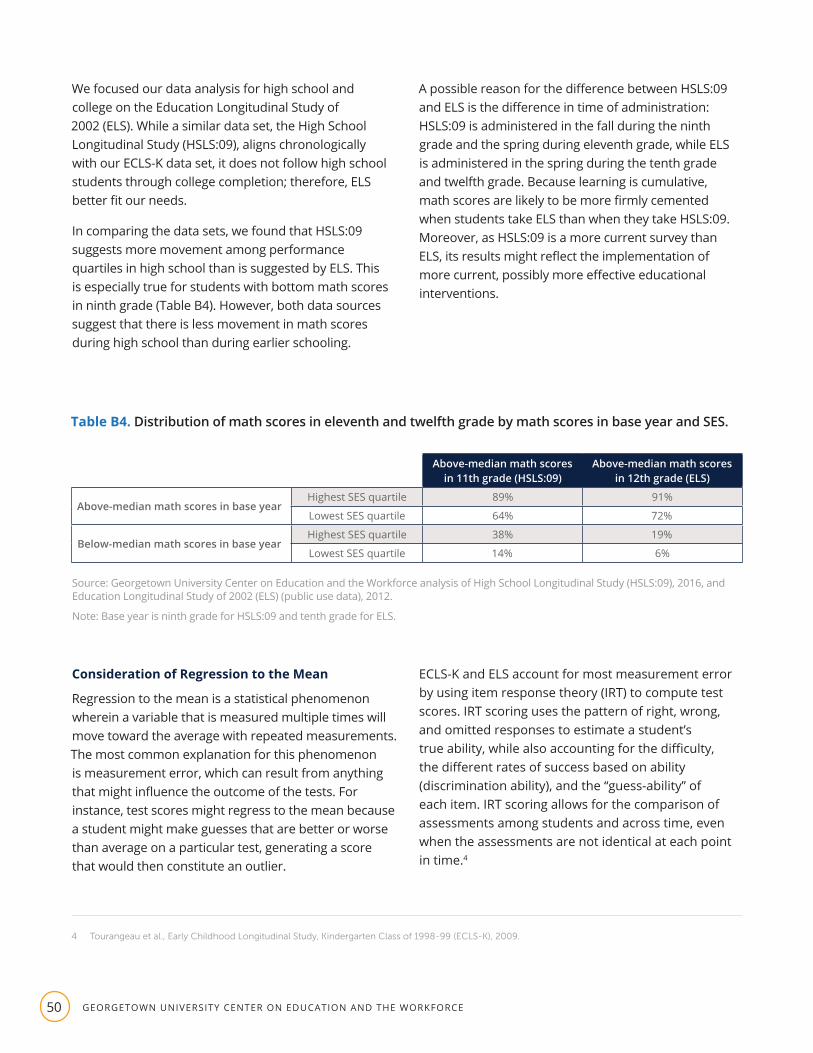
GEORGETOWN UNIVERSITY CENTER ON EDUCATION AND THE WORKFORCE50
We focused our data analysis for high school and college on the Education Longitudinal Study of 2002 (ELS). While a similar data set, the High School Longitudinal Study (HSLS:09), aligns chronologically with our ECLS-K data set, it does not follow high school students through college completion; therefore, ELS better fit our needs.
In comparing the data sets, we found that HSLS:09 suggests more movement among performance quartiles in high school than is suggested by ELS. This is especially true for students with bottom math scores in ninth grade (Table B4). However, both data sources suggest that there is less movement in math scores during high school than during earlier schooling.
4 Tourangeau et al., Early Childhood Longitudinal Study, Kindergarten Class of 1998-99 (ECLS-K), 2009.
A possible reason for the difference between HSLS:09 and ELS is the difference in time of administration: HSLS:09 is administered in the fall during the ninth grade and the spring during eleventh grade, while ELS is administered in the spring during the tenth grade and twelfth grade. Because learning is cumulative, math scores are likely to be more firmly cemented when students take ELS than when they take HSLS:09. Moreover, as HSLS:09 is a more current survey than ELS, its results might reflect the implementation of more current, possibly more effective educational interventions.
Table B4. Distribution of math scores in eleventh and twelfth grade by math scores in base year and SES.
Above-median math scores in 11th grade (HSLS:09)
Above-median math scores in 12th grade (ELS)
Above-median math scores in base yearHighest SES quartile 89% 91%
Lowest SES quartile 64% 72%
Below-median math scores in base yearHighest SES quartile 38% 19%
Lowest SES quartile 14% 6%
Source: Georgetown University Center on Education and the Workforce analysis of High School Longitudinal Study (HSLS:09), 2016, and Education Longitudinal Study of 2002 (ELS) (public use data), 2012.
Note: Base year is ninth grade for HSLS:09 and tenth grade for ELS.
Consideration of Regression to the Mean
Regression to the mean is a statistical phenomenon wherein a variable that is measured multiple times will move toward the average with repeated measurements. The most common explanation for this phenomenon is measurement error, which can result from anything that might influence the outcome of the tests. For instance, test scores might regress to the mean because a student might make guesses that are better or worse than average on a particular test, generating a score that would then constitute an outlier.
ECLS-K and ELS account for most measurement error by using item response theory (IRT) to compute test scores. IRT scoring uses the pattern of right, wrong, and omitted responses to estimate a student’s true ability, while also accounting for the difficulty, the different rates of success based on ability (discrimination ability), and the “guess-ability” of each item. IRT scoring allows for the comparison of assessments among students and across time, even when the assessments are not identical at each point in time.4
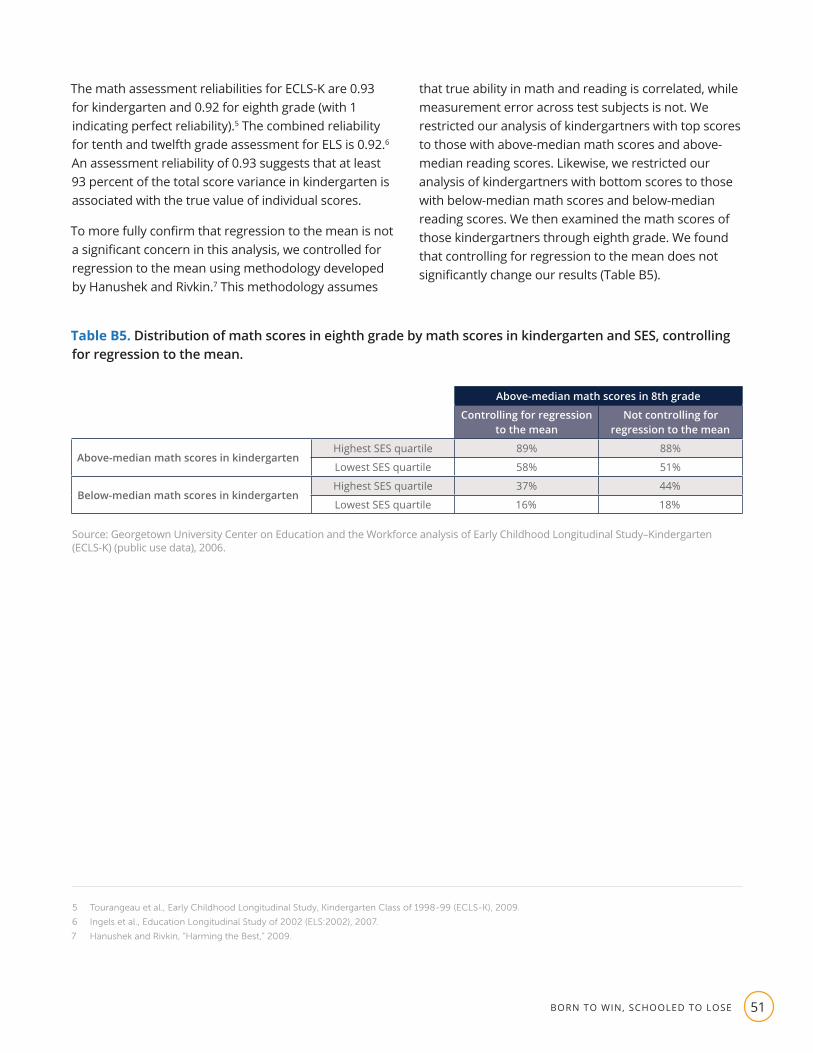
51BORN TO WIN, SCHOOLED TO LOSE
The math assessment reliabilities for ECLS-K are 0.93 for kindergarten and 0.92 for eighth grade (with 1 indicating perfect reliability).5 The combined reliability for tenth and twelfth grade assessment for ELS is 0.92.6 An assessment reliability of 0.93 suggests that at least 93 percent of the total score variance in kindergarten is associated with the true value of individual scores.
To more fully confirm that regression to the mean is not a significant concern in this analysis, we controlled for regression to the mean using methodology developed by Hanushek and Rivkin.7 This methodology assumes
5 Tourangeau et al., Early Childhood Longitudinal Study, Kindergarten Class of 1998-99 (ECLS-K), 2009.
6 Ingels et al., Education Longitudinal Study of 2002 (ELS:2002), 2007.
7 Hanushek and Rivkin, “Harming the Best,” 2009.
that true ability in math and reading is correlated, while measurement error across test subjects is not. We restricted our analysis of kindergartners with top scores to those with above-median math scores and above-median reading scores. Likewise, we restricted our analysis of kindergartners with bottom scores to those with below-median math scores and below-median reading scores. We then examined the math scores of those kindergartners through eighth grade. We found that controlling for regression to the mean does not significantly change our results (Table B5).
Table B5. Distribution of math scores in eighth grade by math scores in kindergarten and SES, controlling for regression to the mean.
Above-median math scores in 8th grade
Controlling for regression to the mean
Not controlling for regression to the mean
Above-median math scores in kindergartenHighest SES quartile 89% 88%
Lowest SES quartile 58% 51%
Below-median math scores in kindergartenHighest SES quartile 37% 44%
Lowest SES quartile 16% 18%
Source: Georgetown University Center on Education and the Workforce analysis of Early Childhood Longitudinal Study–Kindergarten (ECLS-K) (public use data), 2006.

Georgetown University Center on Education and the Workforce
3300 Whitehaven St. NW, Suite 3200 Washington, DC 20007 cew.georgetown.edu
facebook.com/GeorgetownCEW
@GeorgetownCEW
linkedin.com/company/GeorgetownCEW
To view the full report, visit cew.georgetown.edu/Schooled2Lose.