Embed Size (px)
Citation preview

Q4/ FY 2018 resultsFrankfurt am Main, 27 March 2019
Borislav Kostadinov, Member of the Management Board
Christian Dagrosa, Head of Controlling
ProCredit – A unique approach to banking
Notes: (1) Customer deposits divided by customer loan portfolio; (2) Full Rating Report as of 19.12.2017, re-affirmed on 03.10.2018; (3) The recovery unit “Administración y Recuperación de Cartera Michoacán S. A” (ARDEC)
was sold in January 2019 and has been re-classified from the group’s scope of continuing operations and the South American segment to discontinued operations
1
► A profitable, development-oriented commercial group of banks for
SMEs with a focus on South Eastern Europe and Eastern Europe
► Headquartered in Frankfurt and supervised by the German Federal
Financial Supervisory Authority (BaFin) and Deutsche Bundesbank
► Mission of promoting sustainable development with an ethical
corporate culture and long-term business relationships
► Track record of high quality loan portfolio
► Profitable every year since creation as a banking group in 2003
► Listed on the Frankfurt Stock Exchange since December 2016
Summary Key figures FY 2018 and FY 2017
ProCredit Group | Q4 2018 results | Frankfurt am Main, 27 March 2019
Total assets
EUR 5,966m
EUR 5,499m
Customer loan portfolio
EUR 4,392m
EUR 3,910m
Deposits/loans(1)
87%
91%
Number of employees
2,971
3,323
Profit of the period
EUR 54.5m
EUR 48.1m
RoAE
7.6%
7.1%
CET1 ratio (fully loaded)
14.4%
13.7%
Rating (Fitch)
BBB (stable)(2)
Geographical distribution Reputable development-oriented shareholder base
Germany
(ca. 2% of gross loan portfolio)
South America(3)
(ca. 6% of gross loan portfolio)
South Eastern Europe and Eastern Europe
(ca. 92% of gross loan portfolio)
Note: Shareholder structure according to the voting right notifications and voluntary disclosure of voting rights as published on
our website www.procredit-holding.com
MSCI ESG
rating: AA

Agenda
2
A Highlights
B Financial development
C Asset quality
D Balance sheet, capital and funding
Q&A
Appendix
ProCredit Group | Q4 2018 results | Frankfurt am Main, 27 March 2019

Where are we coming from?
Significant progress since 2013
3ProCredit Group | Q4 2018 results | Frankfurt am Main, 27 March 2019
Focused growth in SME loan categories(1) Decrease in overall branch network Decrease in number of total
group staff
Note:
All related figures and ratios for Dec-13 relate to the subsidiaries as shown in the consolidated financial statement as of 2013; (1) Loan portfolio > EUR 50k initial loan size in % of customer loan portfolio by outstanding principal
Regional focus on South Eastern
Europe and Eastern Europe
Decrease in number of cash
desk transactions
Increase in loan portfolio per
total group staff
46%
80%86%
Dec-13 Dec-17 Dec-18
Loan portfolio > EUR 50k in % total loan portfolio
31746 41
328
71 46
Dec-13 Dec-17 Dec-18Number of service points
Number of branches
645
87117
11,514
3,323 2,971
Dec-13 Dec-17 Dec-18
Number of total group staff
71%
92% 92%
Dec-13 Dec-17 Dec-18
SEE and EE as % of gross loan portfolio
28%
2% 1%
Dec-13 Dec-17 Dec-18
YTD Cash desk transactions in % total transactions
363
1,175
1,478
Dec-13 Dec-17 Dec-18
Gross loan portfolio per total group staff
(in
EU
R k
)

Key achievements 2018
4
Execution of “Hausbank” business client strategy
► Strengthened track record to grow with good portfolio quality
► Successful positioning as Hausbank for SMEs driving growth of transaction and deposit volumes
Execution of ProCredit Direct private client strategy
► Fully implemented unified range of client services for a standard fee in the ProCredit banks
► Roll-out of marketing campaigns for private clients started throughout the group
Environmental focus further strengthened
► Continued strong growth of the green loan portfolio (+39%), representing 15.4% of total loan portfolio
► Green Bond Framework in line with Green Bond Principles 2018 and Second Party Opinion by Sustainalytics
► Commitment to foster the SDGs as demonstrated in our Impact Report 2018
Positioning for profitable growth
► Successful capital increase in Feb-18 (EUR 61m)
► Sale of shares in ARDEC Mexico
► Invested in centralized IT back office to enhance efficiency, scalability and security
ProCredit Group | Q4 2018 results | Frankfurt am Main, 27 March 2019

► Return on average equity (RoAE)
5
2018 results versus guidance
► Cost-income ratio (CIR)
► Dividend pay-out ratio
► Growth of the loan portfolio(1) 12.3%
7.6%
70.2%
Actuals
2018
Commentary
Continued strong growth in the
SME segment
Includes result from discontinued
operations of EUR -4.6m
Slightly above guidance, affected by
elevated marketing expenses in Q4
Proposed dividend payout of
EUR 0.30 per share
Guidance
2018
12 – 15%
7.5 – 8.5%
< 70%
1/3 of
profits
1/3 of
profits
Note: (1) Assuming no significant FX volatility
► CET1 ratio (fully loaded) 14.4%Continuously high level of
capitalisation> 13%
In addition, our green loan portfolio has reached a share of 15.4% of total loan portfolio, in line with our target of 15%.
ProCredit Group | Q4 2018 results | Frankfurt am Main, 27 March 2019

Strong volume growth in loan portfolio
6
Note: Gross Loan volume growth split by initial loan size in all segments; FY 2017: restated from outstanding principal to gross loan portfolio
ProCredit Group | Q4 2018 results | Frankfurt am Main, 27 March 2019
FY
2018
FY
2017
+8%
Initial loan
size
(in EUR)
+12%
Initial loan
size
(in EUR)

7
ProCredit is committed to foster the SDGs
ProCredit Group | Q4 2018 results | Frankfurt am Main, 27 March 2019
► 20% green loans in our portfolio
► Become carbon neutral regarding our own CO2 emissions
► Maintain and further increase the high level of S&E competence among staff
Our targetsOur efforts
► E&S Standards and Exclusion List:
Ensures high social, moral and ecological
standards in all our business relations
► Code of Conduct: Based on the principle
of human dignity, mutual respect and
personal responsibility
► ProCredit Academy: Helps ensure
awareness of and commitment to our
ethical standards among our employees
► Impact Report: Reports on our non-
financial achievements and outlines our
efforts towards economic, social and
ecological sustainability
7 Goals for Sustainable Development (SDG) where we contribute the most
Key facts 2018
Average training
days per employee
18.3
Diversity of our
management boards
51% / 49%(women / men)
CO2 saved in 2018
56,536 t
Green loan portfolio
EUR 678m
% of transactions
are automated
99.9%

Outlook for ProCredit Group 2019
8
Note: (1) Assuming no significant FX volatility
ProCredit Group | Q4 2018 results | Frankfurt am Main, 27 March 2019
► Growth of the loan portfolio 10 – 13%(1)
► Profit for the period EUR 48 – 55m
► Cost-income ratio (CIR) < 70%
► CET1 ratio > 13%
In the medium term, assuming a stable political, economic and operating environment, we see potential for around 10% p.a. growth in the total
loan portfolio, a cost-income ratio (CIR) of < 60%, and a return on average equity (RoAE) of about 10%
► Dividend payout ratio 1/3 of profits

Agenda
9
A Highlights
B Financial development
C Asset quality
D Balance sheet, capital and funding
Q&A
Appendix
ProCredit Group | Q4 2018 results | Frankfurt am Main, 27 March 2019

Q4 / FY 2018 results at a glance
10
Notes: Return on average equity and CET1 ratio include discontinued operations; Previous periods have been adjusted according to the new scope of continued operations (see slide 38) (1) Gross amount; (2) Annualised; (3) Net
write-offs to customer loan portfolio; (4) Excluding interest accrued under IFRS 9 from PAR 90 loans, which is fully provisioned for; (5) Impaired loans under IAS 39; (6) Credit impaired portfolio under IFRS 9
ProCredit Group | Q4 2018 results | Frankfurt am Main, 27 March 2019
In EUR m FY 2017 FY 2018 Q3-2018 Q4-2018 y-o-y
Income
statement
Net interest income 204.7 189.8 48.0 48.1 -7%
Provision expenses 4.8 -3.9 0.2 -4.4 -181%
Net fee and commission income 45.8 52.2 13.3 14.8 14%
Net result of other operating income 2.7 2.1 1.5 1.0 -24%
Operating income 248.4 248.0 62.7 68.3 0%
Operating expenses 186.3 171.4 42.5 45.8 -8%
Operating results 62.1 76.6 20.3 22.6 23%
Tax expenses 14.6 17.6 5.7 6.1 21%
Profit of the period from continuing operations 47.6 59.0 14.6 16.5 24%
Profit of the period from discontinued operations 0.5 -4.6 -0.4 -3.0 -985%
Profit after tax 48.1 54.5 14.3 13.5 13%
Key performance
indicators
Change in customer loan portfolio(1) 7.7% 12.3% 1.1% 2.0% 4.6pp
Cost-income ratio 73.6% 70.2% 67.5% 71.6% -3.3pp
Return on equity(2) 7.1% 7.6% 7.8% 7.2% 0.5pp
CET1 ratio (fully loaded) 13.7% 14.4% 14.5% 14.4% 0.7pp
Additional
indicators
Net interest margin(2) 3.8% 3.3% 3.3% 3.3% -0.5pp
Net write-off ratio(2)(3)(4) 0.4% 0.5% 0.6% 0.5% 0.1pp
Impaired loans(5) 4.7% - - - n/a
Credit impaired loans (Stage 3)(6) 4.5% 3.1% 3.4% 3.1% -1.4pp
Coverage impaired portfolio (Stage 3)(6) 84.6% 90.8% 93.0% 90.8% 6.2pp
Book value per share 12.2 12.5 12.3 12.5 3%
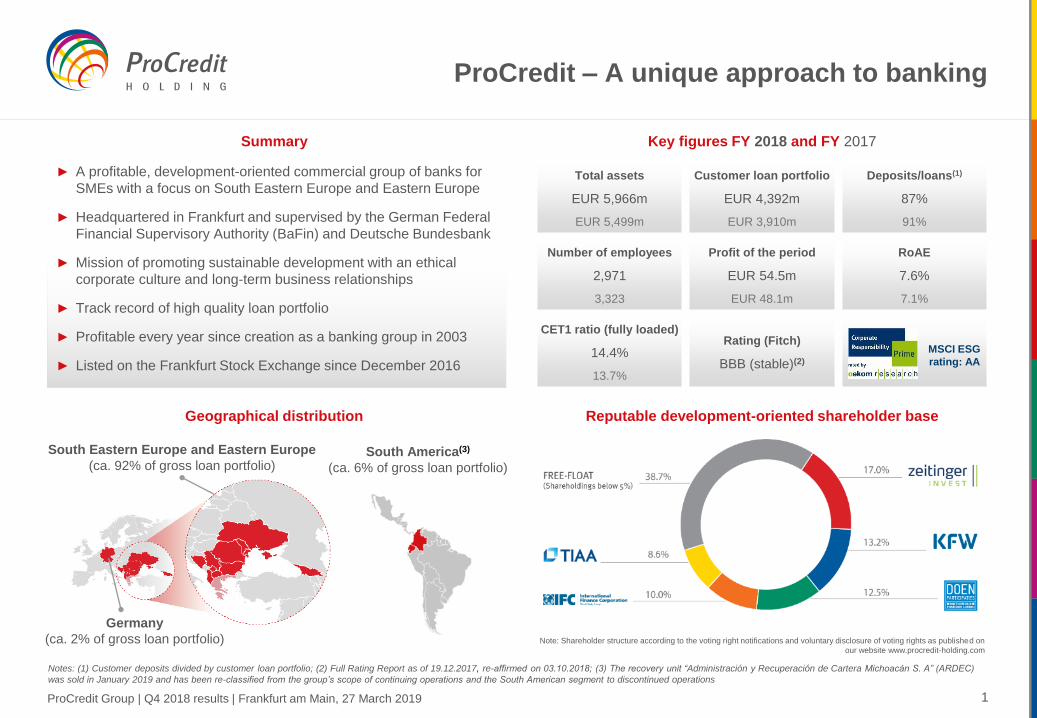
► Net interest income largely stable in Q4, showing an overall
positive trend throughout the year, which is further
characterised by a stabilisation of the net interest margin
► Trend is above all driven by interest income from loans to
customers, which is steadily strengthening on the basis of
the strong growth of our portfolio
► In the introduction phase of our direct banking strategy,
deposits have not grown at the same pace as our loan
portfolio
► Temporary increase in IFI and bank funding leading to
increased interest expenses
Notes: Previous periods have been adjusted according to the new scope of continued operations (see slide 38) (1) Annualised
11
Net interest income
ProCredit Group | Q4 2018 results | Frankfurt am Main, 27 March 2019
51.7
46.6 47.1 48.0 48.1
3.9%
3.4% 3.4% 3.3% 3.3%
Q4-17 Q1-18 Q2-18 Q3-18 Q4-18
Net interest income Net interest margin
(in E
UR
m)
(1)
(in E
UR
m)
(1)
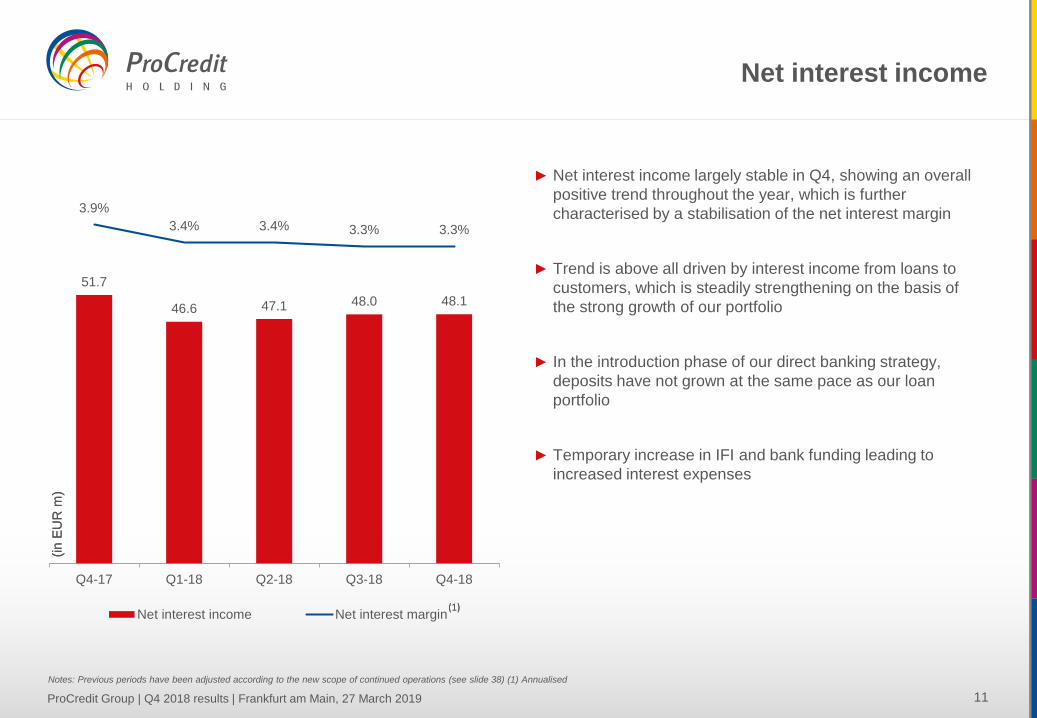
► Financial performance in 2018 supported by the very solid
risk profile, which maintained loan loss provisioning
expenses at extraordinarily low levels
► Credit impaired loans decreased to 3.1%, a substantial
improvement compared to the previous year
► Coverage ratio for credit impaired loans above 90%,
surpassing the previous year’s level
► Recoveries of written-off loans particularly strong in Q4,
contributing EUR 14m to provisioning result in 2018
► Additional LLP expenses are reflected in the result of
discontinued operations in connection with the wind-up of
ARDEC Mexico
Note: Previous periods have been adjusted according to the new scope of continued operations (see slide 38) (1) Cost of risk defined as allowances for losses on loans and advances to customers, divided by average customer
loan portfolio; Annualised
12
Provisioning expenses
ProCredit Group | Q4 2018 results | Frankfurt am Main, 27 March 2019
-0.1 -0.1
0.4
0.2
-4.4
-1 bps -1 bps
4 bps
1 bps
-40 bps
Q4-17 Q1-18 Q2-18 Q3-18 Q4-18
Allowance for losses on loans and advances to customers
Cost of risk (1)
(in E
UR
m)

► Net fee and commission income increased steadily quarter
by quarter
► YoY, increase in net fee and commission income of more
than EUR 6 million
► Direct banking strategy as major driver behind positive
development of net fee income
► Fee income from business clients developing positively on
the back of growing base of regionally active SME clients
► Increased net fee and commission income leading to higher
diversification of earnings and representing a source of
income that is not driven by risk-weighted assets
13
Net fee and commission income
ProCredit Group | Q4 2018 results | Frankfurt am Main, 27 March 2019
12.5
11.4
12.6
13.3
14.8
Q4-17 Q1-18 Q2-18 Q3-18 Q4-18
Net fee and commission income
(in E
UR
m)
Note: Previous periods have been adjusted according to the new scope of continued operations (see slide 38)

► YoY decrease in operating expenses of more than EUR 15m
► Reduction primarily driven by cost items related to
administration of branch network and personnel, facilitated
by direct banking strategy
► Q4 increase in operating expenses primarily related to the
launch of a group-wide marketing campaign for the direct
banking concept
► Increased cost-income ratio in Q4 in line with operating
expenses
14
Operating expenses
ProCredit Group | Q4 2018 results | Frankfurt am Main, 27 March 2019
26.3
22.1 22.3 22.1
25.1
20.3
19.5 19.3 20.4
20.6
75.4%70.4% 71.4%
67.5%71.6%
Q4-17 Q1-18 Q2-18 Q3-18 Q4-18
Personnel expenses
General and administrative expenses (incl. depreciation)
Cost-income ratio
(in E
UR
m)
Note: Previous periods have been adjusted according to the new scope of continued operations (see slide 38)

15
Contribution of segments to group net income FY 2018
ProCredit Group | Q4 2018 results | Frankfurt am Main, 27 March 2019
Group functions, e.g. risk management, reporting, capital management, IT, liquidity management,
training and development
Includes ProCredit Holding, Quipu, ProCredit Academy Fürth, ProCredit Bank Germany (EUR 76m
customer loan portfolio; EUR 272m customer deposits)
Customer loan portfolio (EUR m) 3,059 987 271 4,392
2018 Change in customer loan portfolio +10.9% +19.8% +13.3% +12.3%
Cost-income ratio 67.2% 44.2% 111.9% 70.2%
Return on Average Equity 8.8% 20.0% -5.6% 7.6%
(in
EU
R m
)

Agenda
16
A Highlights
B Financial development
C Asset quality
D Balance sheet, capital and funding
Q&A
Appendix
ProCredit Group | Q4 2018 results | Frankfurt am Main, 27 March 2019

Structure of the loan portfolio
Loan portfolio by geographical segments Loan portfolio by sector
Notes: Loan portfolio by geographical segments and by sector in % of gross loan portfolio (EUR 4,392m as per 31-Dec-18)
17ProCredit Group | Q4 2018 results | Frankfurt am Main, 27 March 2019
19%
17%
12%
8%
6%
4%
4%
12%
8%
2%
5%1%2%
Bulgaria Serbia Kosovo Macedonia
Romania Albania Bosnia Ukraine
Georgia Moldova Ecuador Colombia
Germany
Germany:
2%
South Eastern
Europe:
70%
Eastern Europe:
22%
South America:
6%
27%
20%
23%
5%
16%
7% 1% 0%
Wholesale and retail trade Agriculture, forestry and fishing
Production Transportation and storage
Other economic activities Housing
Investment loans Other
Private loans: Business loans:
92%

Structure of the loan portfolio (continued)
Loan portfolio by initial loan size Loan portfolio by currency
Notes: Loan portfolio by initial loan size and by currency in % of gross loan portfolio (EUR 4,392m as of 31-Dec-18)
18ProCredit Group | Q4 2018 results | Frankfurt am Main, 27 March 2019
52%
12%
36%
EUR USD Other currencies
14%
37%
18%
20%
11%
< 50k 50-250k 250-500k 500k-1.5m >1.5m

► Substantially improved portfolio quality in 2018, as volume
of stage 3 loans reduced by EUR 50m or 27% YoY
► Reduced share of impaired loans of 1.7 pp amid
continuously low write-offs
► Coverage ratio above 90%, improved visibly with respect to
previous year
19
Loan portfolio quality
ProCredit Group | Q4 2018 results | Frankfurt am Main, 27 March 2019
Notes: (1) Net write-offs to gross loan portfolio; (2) Allowances for losses on loans and advances divided by credit impaired portfolio; (3) Allowances for losses on loans and advances to customers divided by PAR 30 loan portfolio
(4) Figure has been restated according to IFRS 9; (5) Excluding interest accrued under IFRS 9 from PAR 90 loans, which is fully provisioned for; (6) 2017 figures presented without ARDEC
4.7%4.5%
3.1%2.9% 3.0%
2.1%
Dec-17 Dec-17 Dec-18
Impaired loans (IAS 39) Credit impaired loans (Stage 3) PAR 30
Net write-
offs(1)(5)
Coverage
impaired
portfolio(2)
0.4%
70.0%
0.4%
84.6%
0.5%
90.8%
IFRS 9IAS 39
Coverage
ratio
PAR 30(3)
112.1% 128.3% 134.2%
(4)
(6)

► Majority of collateral consists of mortgages
► Growing share of financial guarantees mainly as result of
InnovFin and other guarantee programmes provided by the
European Investment Fund
► Clear, strict requirements regarding types of acceptable
collateral, legal aspects of collateral and insurance of
collateral items
► Standardised collateral valuation methodology
► Regular monitoring of the value of all collateral and a clear
collateral revaluation process, including use of external
independent experts
► Verification of external appraisals, yearly update of market
standards and regular monitoring of activities carried out by
specialist staff members
20
Structure of collateral
ProCredit Group | Q4 2018 results | Frankfurt am Main, 27 March 2019
Collateral by type
67%2%
11%
20%
Mortgages Cash collateral Financial guarantees Other
Total: EUR 3.3 bn

67%
11%
22%
Energy efficiency Renewable energy Other green investments
► Strong growth in the green loan portfolio (+39% yoy)
► Includes financing of investments in
• Energy efficiency
• Renewable energies
• Other environmentally-friendly activities
► Largest part of green loan portfolio to finance energy
efficiency measures
► Green loans represent 15.4% of total loan portfolio, thus
meeting the target of 15% set for end 2018
► Share of green investment loans(2) to total investment loans
19%
► New medium-term target for green loans of 20% of total loan
portfolio
Notes: (1) Data for 2018 is presented as gross loan portfolio, previous year data is presented as outstanding principal; (2) Investment loans defined as loans with initial maturity > 3 years
21
Development of green loan portfolio
ProCredit Group | Q4 2018 results | Frankfurt am Main, 27 March 2019
Green loan portfolio growth
Structure of green loan portfolio
150242
316
475
662
23
21
15
14
15
174
264
331
489
678
4.0% 6.4% 9.1% 12.6% 15.4%
Dec-14 Dec-15 Dec-16 Dec-17 Dec-18
Business clients Private clients % of total loan portfolio
(in
EU
Rm
)
(1)

Agenda
22
A Highlights
B Financial development
C Asset quality
D Balance sheet, capital and funding
Q&A
Appendix
ProCredit Group | Q4 2018 results | Frankfurt am Main, 27 March 2019

Asset reconciliation
23ProCredit Group | Q4 2018 results | Frankfurt am Main, 27 March 2019
(in E
UR
m)
72%
16%
12%Other
assets
Cash and
cash
equivalents
Net loans
to
customers

Liabilities and equity reconciliation
24ProCredit Group | Q4 2018 results | Frankfurt am Main, 27 March 2019
Increase in deposits in spite of
substantial restructuring and
closing of branchesCapital increase in February
2018, IFRS 9 effect and
capitalised profits
IFI and bank funding as a
stable and long-term source to
support the dynamic growth in
our portfolio
Equity12%
2%1%3%
64%
17%Liabilities to
banks and
IFIs
Liabilities to
customers
Debt
securities
Subordinated
debt
Other liabilities
(in
EU
R m
)

25
Liquidity update
ProCredit Group | Q4 2018 results | Frankfurt am Main, 27 March 2019
► Level of HLAs further increased by EUR 36m in Q4
► Increase primarily driven by strong deposit growth
► LCR comfortably above regulatory minimum
Liquidity coverage ratio
Highly liquid assets (HLA) and HLA ratio
1.0 1.0
Dec-17 Dec-18
HLA HLA ratio
29% 27%
(in E
UR
bn)
179% 187%
80%100%
Dec-17 Dec-18
LCR ratio Regulatory minimum

► Increases in CET1, total capital and leverage ratios due to
the capital increase in Feb-18
► Profits up to Q3 2018 recognised
► IFRS 9 effects fully included in CET1 capital
► RWA increase resulting mainly from loan portfolio growth
► Minimum capital requirements since March 2019, including
SREP decision and all relevant capital buffers:
• 8.4% CET1 ratio
• 10.4% Tier 1 ratio
• 13.0% Total capital ratio
26
Regulatory capital and risk-weighted assets
ProCredit Group | Q4 2018 results | Frankfurt am Main, 27 March 2019
Overview of capitalisation
in EUR m Dec-17 Dec-18
CET1 capital 595 678
Additional Tier 1 capital 0 0
Tier 1 capital 595 678
Tier 2 capital 130 130
Total capital 725 808
RWA total 4,330 4,700
o/w Credit risk 3,341 3,720
o/w Market risk (currency risk) 439 511
o/w Operational risk 549 467
o/w CVA risk 2 1
CET1 capital ratio 13.7% 14.4%
Total capital ratio 16.7% 17.2%
Leverage ratio 10.5% 11.0%

Development of CET1 capital ratio (fully loaded)
27ProCredit Group | Q4 2018 results | Frankfurt am Main, 27 March 2019
Leverage ratio
10.5%
Leverage ratio
11.0%

Agenda
28
A Highlights
B Financial development
C Asset quality
D Balance sheet, capital and funding
Q&A
Appendix
ProCredit Group | Q4 2018 results | Frankfurt am Main, 27 March 2019

Q&A
29ProCredit Group | Q4 2018 results | Frankfurt am Main, 27 March 2019
ProCredit Bank Georgia

Agenda
30
A Highlights
B Financial development
C Asset quality
D Balance sheet, capital and funding
Q&A
Appendix
ProCredit Group | Q4 2018 results | Frankfurt am Main, 27 March 2019

Overview of quarterly financial development
31
Notes: P&L related figures and ratios, unless indicated otherwise, are based on continuing operations; Return on average equity and CET1 ratio include as well discontinued operations; (1) Annualised; (2) Net write-offs to
customer loan portfolio; (3) Impaired loans under IAS 39; (4) Credit impaired portfolio under IFRS 9; (5) Excluding interest accrued under IFRS 9 from PAR 90 loans, which is fully provisioned for
ProCredit Group | Q4 2018 results | Frankfurt am Main, 27 March 2019
In EUR m Q4-2017 Q1-2018 Q2-2018 Q3-2018 Q4-2018
Income
statement
Net interest income 51.7 46.6 47.1 48.0 48.1
Provision expenses -0.1 -0.1 0.4 0.2 -4.4
Net fee and commission income 12.5 11.4 12.6 13.3 14.8
Net result of other operating income -2.5 1.0 -1.5 1.5 1.0
Operating income 61.9 59.2 57.8 62.7 68.3
Operating expenses 46.5 41.6 41.6 42.5 45.8
Operating results 15.3 17.6 16.2 20.3 22.6
Tax expenses 4.0 3.1 2.8 5.7 6.1
Profit of the period from continuing operations 11.3 14.5 13.4 14.6 16.5
Profit of the period from discontinued operations 1.0 0.1 -1.3 -0.4 -3.0
Profit after tax 12.3 14.6 12.1 14.3 13.5
Key performance
indicators
Change in customer loan portfolio 2.0% 2.8% 5.9% 1.1% 2.0%
Cost-income ratio 75.4% 70.4% 71.4% 67.5% 71.6%
Return on Average Equity(1) 7.2% 8.2% 6.5% 7.8% 7.2%
CET1 ratio (fully loaded) 13.7% 14.4% 14.6% 14.5% 14.4%
Additional
indicators
Net interest margin(1) 3.9% 3.4% 3.4% 3.3% 3.3%
Net write-off ratio(1)(2)(5) 0.4% 0.4% 0.5% 0.6% 0.5%
Impaired loans(3) 4.7% - - - -
Credit impaired loans (Stage 3)(4) 4.5% 4.1% 3.6% 3.4% 3.1%
Coverage of Credit impaired portfolio (Stage 3)(4) 84.6% 84.5% 91.2% 93.0% 90.8%
Book value per share 12.2 12.1 12.2 12.3 12.5

23% 16%
77% 84%
2,7593,059
Dec-17 Dec-18
Loan portfolio < EUR 50k Loan portfolio > EUR 50k
(in
EU
R m
)
Notes: (1) Customer deposits divided by customer loan portfolio
32
Segment South Eastern Europe
ProCredit Group | Q4 2018 results | Frankfurt am Main, 27 March 2019
Regional loan portfolio breakdown
Loan portfolio growth
Total: EUR 3,059m (70% of gross loan portfolio)
Key financial data
Bulgaria27%
Serbia24%
Kosovo17%
Macedonia11%
Romania8%
Albania7%
Bosnia6%
(in EUR m) FY 2017 FY 2018
Net interest income 131.1 115.4
Provision expenses 0.2 -0.5
Net fee and commission income 31.3 36.1
Net result of other operating income -2.6 -1.0
Operating income 159.5 151.1
Operating expenses 107.3 101.2
Operating result 52.2 49.8
Tax expenses 6.8 7.8
Profit after tax 45.4 42.1
Change in customer loan portfolio 8.8% 10.9%
Deposits to loans ratio(1) 91.3% 88.5%
Net interest margin 3.6% 2.9%
Cost-income ratio 67.2% 67.2%
Return on Average Equity 9.8% 8.8%

8% 6%
92% 94%
823987
Dec-17 Dec-18
Loan portfolio < EUR 50k Loan portfolio > EUR 50k
(in
EU
R m
)
Notes: (1) Customer deposits divided by customer loan portfolio
33
Segment Eastern Europe
ProCredit Group | Q4 2018 results | Frankfurt am Main, 27 March 2019
Regional loan portfolio breakdown
Loan portfolio growth
Total: EUR 987m (22% of gross loan portfolio)
Key financial data
(in EUR m) FY 2017 FY 2018
Net interest income 55.9 56.3
Provision expenses 6.0 -1.8
Net fee and commission income 8.8 9.3
Net result of other operating income 3.2 3.3
Operating income 62.0 70.7
Operating expenses 31.6 30.5
Operating result 30.3 40.2
Tax expenses 4.3 7.0
Profit after tax 26.0 33.2
Change in customer loan portfolio 16.2% 19.8%
Deposits to loans ratio(1) 77.1% 71.1%
Net interest margin 5.1% 4.6%
Cost-income ratio 46.5% 44.2%
Return on Average Equity 18.2% 20.0%
Ukraine54%Georgia
35%
Moldova11%

38% 24%
62% 76%
239271
Dec-17 Dec-18
Loan portfolio < EUR 50k Loan portfolio > EUR 50k
(in
EU
R m
)
Notes: (1) Customer deposits divided by customer loan portfolio
34
Segment South America
ProCredit Group | Q4 2018 results | Frankfurt am Main, 27 March 2019
Regional loan portfolio breakdown
Loan portfolio growth
Total: EUR 271m (6% of gross loan portfolio)
Key financial data
(in EUR m) FY 2017 FY 2018
Net interest income 20.3 17.6
Provision expenses -1.4 -1.7
Net fee and commission income -0.1 -0.1
Net result of other operating income 1.2 1.5
Operating income 22.8 20.6
Operating expenses 24.3 21.2
Operating result -1.5 -0.6
Tax expenses 2.1 2.6
Profit after tax -3.6 -3.2
Change in customer loan portfolio -22.1% 13.3%
Deposits to loans ratio(1) 67.5% 54.3%
Net interest margin 4.9% 5.1%
Cost-income ratio 113.6% 111.9%
Return on Average Equity -5.8% -5.6%
Ecuador84%
Colombia16%

73%
15%
4%4% 3%1%
Customer deposits
Liabilities to IFIs
Liabilities to banks
Debt securities
Subordinated debt
Other liabilities
Funding and rating update
35ProCredit Group | Q4 2018 results | Frankfurt am Main, 27 March 2019
► Highly diversified funding structure and counterparties
► Customer deposits main funding source, accounting for 73% as
of Dec-18
► Supplemented by long-term funding from IFIs and institutional
investors
► Deposit-to-loan ratio with positive development in Q4
Funding sources overview
Deposit-to-loan ratio development
Total liabilities: EUR 5.2bn
Rating:
► ProCredit Holding and ProCredit Bank in Germany: BBB (stable)
by Fitch, re-affirmed in Oct-18
► ProCredit Banks: At or close to sovereign IDR; PCBs in Georgia,
Macedonia and Serbia are even rated above the sovereign IDR
91% 87%
Dec-17 Dec-18

Balance sheet
36ProCredit Group | Q4 2018 results | Frankfurt am Main, 27 March 2019
in EUR m Dec-17 Dec-18
Assets
Cash and central bank balances 1,077 964
Loans and advances to banks 196 212
Investment securities 0 297
Available-for-sale financial assets 215 0
Loans and advances to customers 3,910 4,392
Allowance for losses on loans and advances to customers -129 -124
Derivative financial assets 0 1
Financial assets at fair value through profit or loss 1 0
Property, plant and equipment 139 136
Other assets 90 87
Assets held for sale 1
Total assets 5,499 5,966
Liabilities
Liabilities to banks 359 201
Liabilities to customers 3,571 3,826
Liabilities to International Financial Institutions 550 813
Derivative financial liabilities 0 1
Financial liabilities at fair value through profit or loss 0 0
Debt securities 183 206
Other liabilities 37 32
Subordinated debt 141 143
Total liabilities 4,841 5,223
Equity
Subscribed capital 268 294
Capital reserve 115 147
Retained earnings 351 368
Translation reserve -84 -75
Revaluation reserve 1 2
Equity attributable to ProCredit shareholders 651 736
Non-controlling interests 7 8
Total equity 659 744
Total equity and liabilities 5,499 5,966

Income statement by segment
37ProCredit Group | Q4 2018 results | Frankfurt am Main, 27 March 2019
01.01.- 31.12.2018
(in EUR m)Germany Eastern Europe
South Eastern
EuropeSouth America Consolidation Group
Interest and similar income 20.6 107.9 141.0 28.1 -19.2 278.4
of which inter-segment 19.1 0.2 -0.1 0.0 0.0 0.0
Interest and similar expenses 20.5 51.6 25.5 10.5 -19.6 88.6
of which inter-segment 0.2 7.2 9.2 3.0 0.0 0.0
Net interest income 0.0 56.3 115.4 17.6 0.5 189.8
Allowance for losses on loans and advances to customers 0.0 -1.8 -0.5 -1.7 0.0 -3.9
Net interest income after allowances 0.1 58.0 115.9 19.2 0.5 193.7
Fee and commission income 11.6 13.7 51.4 1.5 -10.2 68.0
of which inter-segment 8.9 0.0 1.4 0.0 0.0 0.0
Fee and commission expenses 1.9 4.4 15.3 1.6 -7.3 15.9
of which inter-segment 0.0 1.9 5.0 0.5 0.0 0.0
Net fee and commission income 9.7 9.3 36.1 -0.1 -2.9 52.2
Result from foreign exchange transactions -2.7 4.6 7.4 0.1 -0.1 9.4
Result from derivative financial instruments 0.1 0.0 -0.1 0.0 0.0 0.0
Result from investment securities 0.0 0.0 0.0 0.0 0.0 0.0
Result on derecognition of financial assets
measured at amortised cost-0.4 0.3 0.1 0.0 0.0 -0.1
Net other operating income 83.9 -1.5 -8.3 1.4 -82.6 -7.2
of which inter-segment 80.1 0.0 2.1 0.5 0.0 0.0
Operating income 90.7 70.7 151.1 20.6 -85.1 248.0
Personnel expenses 23.9 10.8 37.6 7.5 0.0 79.8
Administrative expenses 29.2 19.7 63.6 13.8 -34.7 91.6
of which inter-segment 6.8 6.3 17.3 4.3 0.0 0.0
Operating expenses 53.1 30.5 101.2 21.2 -34.7 171.4
Profit before tax 37.7 40.2 49.8 -0.6 -50.5 76.6
Income tax expenses 0.2 7.0 7.8 2.6 0.0 17.6
Profit of the period from continuing operations 37.5 33.2 42.1 -3.2 -50.5 59.0
Profit of the period from discontinued operations 0.0 0.0 0.0 0.0 0.0 -4.6
Profit of the period 37.5 33.2 42.1 -3.2 -50.5 54.5
Profit attributable to ProCredit shareholders 52.8
Profit attributable to non-controlling interests 1.7

Information regarding financial figures
in this presentation
FY 2018:
► Financial data for the fiscal year ended 31 December 2018, as shown in the consolidated financial statements as of and for the
fiscal year ended 31 December 2018.
Q3 2018:
► Financial data for nine-month period ended 30 September 2018, restated according to the new scope of continuing operations as
of 31 December 2018. Balance-sheet related information is presented as shown in the unaudited quarterly financial report ended
30 September 2018. Profit and loss-related information is presented with ARDEC Mexico reclassified as discontinued operations.
Q2 2018:
► Financial data for six-month period ended 30 June 2018, restated according to the new scope of continuing operations as of 31
December 2018. Balance-sheet related information is presented as shown in the unaudited quarterly financial report ended 30
June 2018. Profit and loss-related information is presented with ARDEC Mexico reclassified as discontinued operations.
Q1 2018:
► Financial data for three-month period ended 31 March 2018, restated according to the new scope of continuing operations as of
31 December 2018. Balance-sheet related information is presented as shown in the unaudited quarterly financial report ended 31
March 2018. Profit and loss-related information is presented with ARDEC Mexico reclassified as discontinued operations.
FY 2017:
► Financial data for the fiscal year ended 31 December 2017 restated according to the new scope of continuing operations as of 31
December 2018. Balance-sheet related information is presented as shown in the consolidated financial statements as of and for
the fiscal year ended 31 December 2017. Profit and loss-related information is presented with Banco ProCredit Nicaragua, Banco
ProCredit El Salvador and ARDEC Mexico classified as discontinued operations.
Note: Unless indicated otherwise
38ProCredit Group | Q4 2018 results | Frankfurt am Main, 27 March 2019

39
Contact Investor Relations
ProCredit Group | Q4 2018 results | Frankfurt am Main, 27 March 2019
Contact details
Investor Relations
ProCredit Holding AG & Co. KGaA
Nadine Frerot
tel.: +49 69 951 437 285
e-mail: [email protected]
Media Relations
ProCredit Holding AG & Co. KGaA
Andrea Kaufmann
tel.: +49 69 951 437 138
e-mail: [email protected]
Date Place Event information
13.05.2019Quarterly Statement as of 31 March 2019
16:00 CEST Analyst Conference Call
17.05.2019 Frankfurt/Main Annual General Meeting
14.08.2019Interim Report as of 30 June 2019
16:00 CEST Analyst Conference Call
13.11.2019
Quarterly Statement as of 30 September
2019
16:00 CET Analyst Conference Call
Financial calendar

The material in this presentation and further supportingdocuments have been prepared by ProCredit Holding AG & Co.KGaA, Frankfurt am Main, Federal Republic of Germany(“ProCredit Holding”) and are general background informationabout the ProCredit group’s activities current as at the date ofthis presentation. This information is given in summary form anddoes not purport to be complete. Information in this presentationand further supporting documents, including forecast financialinformation, should not be considered as advice or arecommendation to investors or potential investors in relation toholding, purchasing or selling securities or other financialproducts or instruments and does not take into account yourparticular investment objectives, financial situation or needs.Before acting on any information contained in this or any otherdocument, you should consider its appropriateness and itsrelevance to your personal situation; moreover, you shouldalways seek independent financial advice. All securities andfinancial product or instrument transactions involve risks, whichinclude (among others) the risk of adverse or unanticipatedmarket, financial or political developments and, in internationaltransactions, currency risk.
This presentation and further supporting documents may containforward-looking statements including statements regarding ourintent, belief or current expectations with respect to theProCredit group’s businesses and operations, market conditions,results of operation and financial condition, capital adequacy,specific provisions and risk management practices. Readers arecautioned not to place undue reliance on these forward-lookingstatements. ProCredit Holding does not undertake any obligationto publicly release the result of any revisions to these forward-looking statements to reflect events or circumstances after thedate hereof to reflect the occurrence of unanticipated events.While due care has been used in the preparation of forecastinformation, actual results may vary in a materially positive ornegative manner. Forecasts and hypothetical examples aresubject to uncertainty and contingencies outside ProCreditHolding’s control. Past performance is not a reliable indication offuture performance.
40
Disclaimer
ProCredit Group | Q4 2018 results | Frankfurt am Main, 27 March 2019