Embed Size (px)
Citation preview
ASTO Geophysical Consulting offers a wide spectrum of borehole seismic ser-vices including survey design, quality control in real time, processing and inter-pretation of all commercially available VSP surveys. We use the most advanced modelling and processing packages which have been developed by the major geophysical software development vendors, the experts from research organi-zations and Oil&Gas companies.
Modeling
VSP Survey Design Ray tracing and FD synthetic P, S-wave synthetics 3C VTI VSP synthetic AVO synthetic and analysis Anisotropic synthetic
Processing
Checkshot, Rig VSP Offset, Walk Above VSP 2D-3C Walkaway VSP Wavelet extraction/matching Anisotropic VSP-CDP and
Kirchoff migration Sonic calibration Synthetic seismogram 3 ways well tie Multiple analysis Q Estimation Look Ahead Inversion Shear anisotropy analysis Pore pressure prediction Microseismic QC analysis
Benefits
Accurate inputs for seismic processing and interpretation
Fast delivery of VSP results Confidence in VSP results Data acquisition validation Reprocessing recommendations
Features
• Robust and novel signal processing algorithms
• Comprehensive VSP modeling
• 3C VSP processing
• International acquisition, processing expertise
• Wireline/LWD data processing
• Comprehensive QC analysis
Modeling
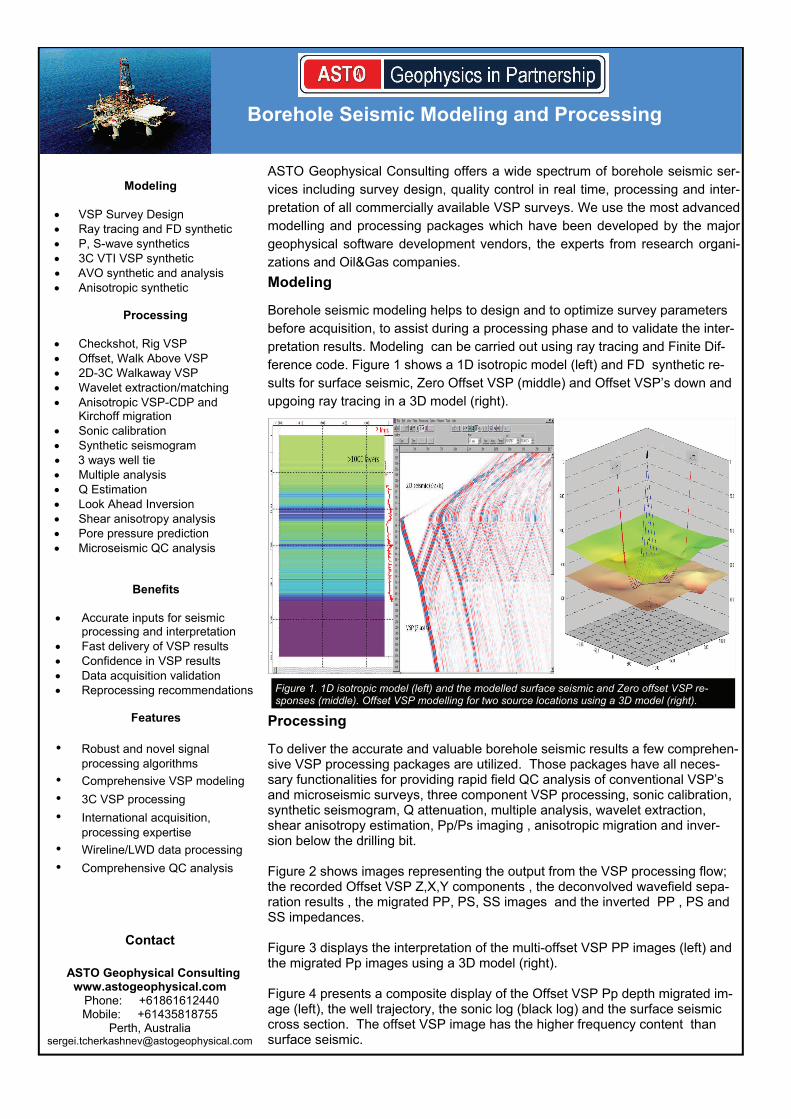
Borehole seismic modeling helps to design and to optimize survey parameters before acquisition, to assist during a processing phase and to validate the inter-pretation results. Modeling can be carried out using ray tracing and Finite Dif-ference code. Figure 1 shows a 1D isotropic model (left) and FD synthetic re-sults for surface seismic, Zero Offset VSP (middle) and Offset VSP’s down and upgoing ray tracing in a 3D model (right).
Figure 1. 1D isotropic model (left) and the modelled surface seismic and Zero offset VSP re-sponses (middle). Offset VSP modelling for two source locations using a 3D model (right).
Processing
To deliver the accurate and valuable borehole seismic results a few comprehen-sive VSP processing packages are utilized. Those packages have all neces-sary functionalities for providing rapid field QC analysis of conventional VSP’s and microseismic surveys, three component VSP processing, sonic calibration, synthetic seismogram, Q attenuation, multiple analysis, wavelet extraction, shear anisotropy estimation, Pp/Ps imaging , anisotropic migration and inver-sion below the drilling bit. Figure 2 shows images representing the output from the VSP processing flow; the recorded Offset VSP Z,X,Y components , the deconvolved wavefield sepa-ration results , the migrated PP, PS, SS images and the inverted PP , PS and SS impedances. Figure 3 displays the interpretation of the multi-offset VSP PP images (left) and the migrated Pp images using a 3D model (right). Figure 4 presents a composite display of the Offset VSP Pp depth migrated im-age (left), the well trajectory, the sonic log (black log) and the surface seismic cross section. The offset VSP image has the higher frequency content than surface seismic.
Contact
ASTO Geophysical Consulting www.astogeophysical.com
Phone: +61861612440 Mobile: +61435818755
Perth, Australia [email protected]
Borehole Seismic Modeling and Processing
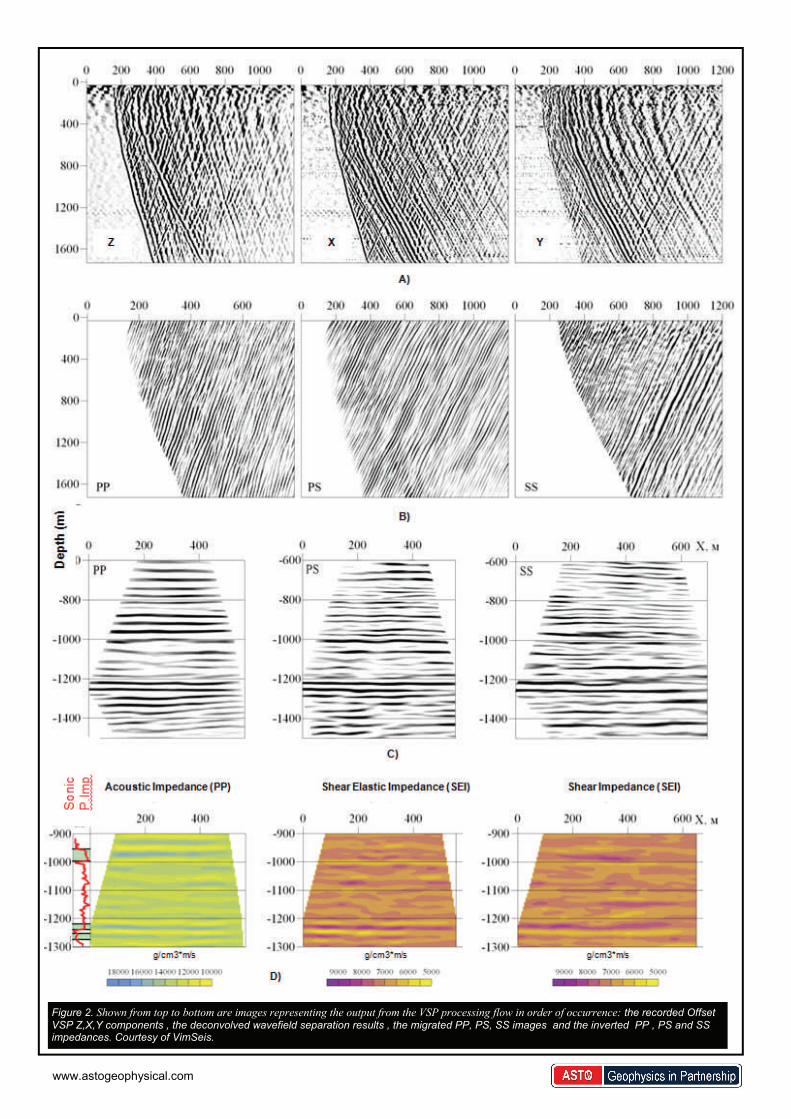
Figure 2. Shown from top to bottom are images representing the output from the VSP processing flow in order of occurrence: the recorded Offset VSP Z,X,Y components , the deconvolved wavefield separation results , the migrated PP, PS, SS images and the inverted PP , PS and SS impedances. Courtesy of VimSeis.
www.astogeophysical.com
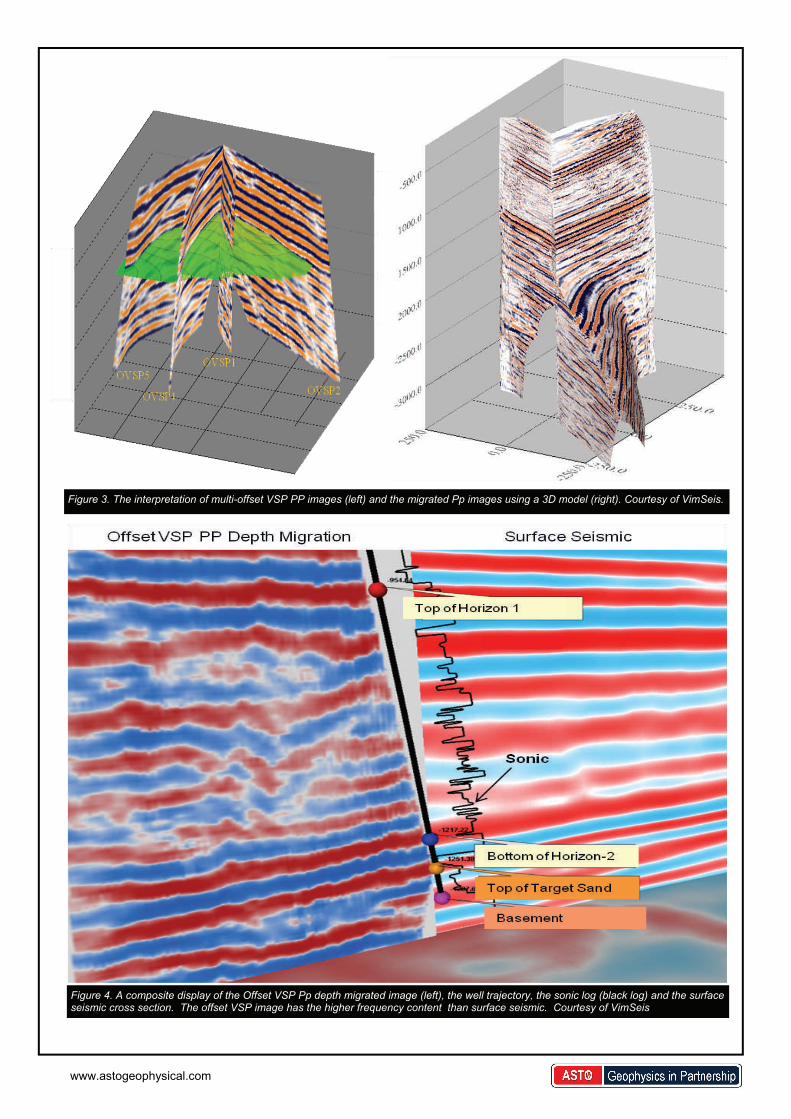
Figure 3. The interpretation of multi-offset VSP PP images (left) and the migrated Pp images using a 3D model (right). Courtesy of VimSeis.
Figure 4. A composite display of the Offset VSP Pp depth migrated image (left), the well trajectory, the sonic log (black log) and the surface seismic cross section. The offset VSP image has the higher frequency content than surface seismic. Courtesy of VimSeis
www.astogeophysical.com