Embed Size (px)
Citation preview
BORDERED Land Use Development in El Paso, Texas and Ciudad Juárez, Mexico
A Thesis Presented to the Faculty of Architecture and Planning COLUMBIA UNIVERSITY
In Partial Fulfillment of the Requirements for the Degree Master of Science in Urban Planning
By
Madeline Entrikin
May 2019
ABSTRACT:
This paper looks at major policy changes from 1960 to 2008 in order to investigate
to what extent they have impacted the cities of El Paso, Texas and Ciudad Juárez,
Mexico. These two cities offer an interesting urban juxtaposition as they reside on either
side of the U.S./Mexico border yet only 20 miles separate their respective city centers.
By conducting a longitudinal land cover analysis over these four decades, this study
attempts to understand how the macro level of organization (policies delegated at the
federal government level) influence organization at the micro level (local policy).
Understanding the relationship between certain categories of immigration policy and
organizational space could comment on the role of planning in border conditions.
TABLE OF CONTENTS:
I. Introduction
A. Background 1
B. The Cities of El Paso and Juárez 3
II. Literature Review
A. Control & Territorialization 6
B. Land Use & Control 8
C. Transborder Cities 10
III. Methodology
A. Border Policy Analysis and Categorization 12
B. Quantifying Land Use through Remote Sensing 13
C. Additional Data Collection 15
IV. Findings
A. Categorical Changes in Policies 16
B. Site Observations 23
C. GIS - Based Analysis 25
V. Discussion & Conclusion 35
VI. Bibliography 42
VII. Appendices 47
LIST OF TABLES:
Table 1. List of Policies
LIST OF FIGURES:
Figure 1. Parcels in Ciudad Juárez and El Paso
Figure 2. ProNaf Zone in Ciudad Juárez
Figure 3. Categorization of Border Policies from 1960 to 2006
Figure 4. Loan Office Locations in El Paso
Figure 5. Historic Districts in El Paso
Figure 6. Composite Landsat Imagery
Figure 7. Results of Remote Sensing Classification
Figure 8. 1984 and 2018 Imagery of Agriculture in Ciudad Juárez and El Paso
Figure 9. Developed Land in Ciudad Juárez and El Paso from 1984 to 2018
Figure 10. Agricultural Land in Ciudad Juárez and El Paso from 1984 to 2018
Figure 11. Commercial Land Use within Buffer of Border Crossing Stations from 1984 to
2018
LIST OF ABBREVIATIONS:
NAFTA: North American Free Trade Agreement
ProNaf: Programa Nacional Fronterizo
CHAPTER I: INTRODUCTION
A. BACKGROUND
The border between the United States and Mexico today is at risk of becoming
extremely regulated and closed off. Nearly every week a new proposal for revisions to
immigration policy or updates on the plan for a border wall are announced. While these
decisions are being made at the federal level, cities that exist along the border are
made to wait to receive their fate. These border cities, which include El Paso and
Ciudad Juárez, San Diego and Tijuana, and several others, generally act as single
entities with the border dividing them in two. Thus, a fortification of the border disrupts
the social and economic success of these cities on both sides of the border.
Often we speak of the perceived border between the United States and Mexico
as a tangible, concrete divider. Especially in the current political climate in the United
States, this perception manifests not only at the physical level, but on social and cultural
fronts as well. Immigration policy is most often associated with images of excruciatingly
long lines waiting to enter the United States, headlines cautioning of violence south of
the border propagating north and stories of children separated from their families. While
these issues are relevant and important, the local-level effects in border communities
are often overlooked. In 2017, there were just over 300,000 apprehensions of illegal
immigrants crossing into the United States (CBP Enforcement Statistics, 2018). At least
that many legal entries occur on any given day across the southwest border of the
United States. The circulation of citizens across border cities and the interconnectivity of
ENTRIKIN
1
daily life has remained ever present throughout major shifts in immigration policy over
the past several decades. Straddling the border, these cities do not function as separate
entities, one American and one Mexican. It is where two sovereign nations meet, and
one city attempts to coalesce amongst clashing federal policy.
In the United States today there are numerous proposals at the federal level of
incredibly unstable policies about the movement of people or goods across the border
and these proposals seem to change daily. As these decisions are largely made at the
federal level, the cities that exist along the border are left to handle the consequences of
such unstable policy on their own. On a micro level, “transborder cities” are the localized
realization of immigration decisions made at the federal level. Either side’s interaction
with and relationship to the border is a reflection of each country’s attitude toward
immigration policy.
This paper investigates the city as a cypher for federal policy. What does this
mean for the communities living along the border, and how do the policies dictated by
the federal government influence the organization of land and people at the level of the
city? The federal government and local planning authority can act autonomously and
contradict one another, or they can collaborate. If planners can understand
organizational space at the local level, we might also see evidence of the influence that
planning can have on border conditions and border policy. This analysis might arm
planners in border cities to argue or advocate at federal policies levels.
ENTRIKIN
2
B. THE CITIES OF CIUDAD JUÁREZ AND EL PASO
The bordering cities of El Paso, Texas, and Ciudad Juárez, Mexico, offer an
interesting urban juxtaposition. In 2017 there were over 43.5 million crossings through
the El Paso, Texas, port alone with an average of about 120,000 per day (Bureau of
Transportation Statistics, 2018). An estimated 600 to 1,000 children cross daily to
attend school, and many other people cross in either direction to shop or for recreational
activities (Nieves, 2017). On the U.S. side, El Paso has consistently ranked among the
lowest crime rates in the nation since the 1990s. On the Mexico side, however, Ciudad
Juárez is a city ruled by drug cartels and riddled with violence, having seen over 700
recorded homicides in 2017 alone (53 per 100,000 residents), which is a significant
decline from the 3,100 recorded homicides in 2010 (Borunda, 2018). That same year, El
Paso at a population of 683,577, had its second deadliest year ever, but with only 38
deaths (5.5 per 100,000 residents) (Borunda, 2018). With less than 20 miles separating
their respective city centers, it is apparent that the physical border between the two
countries plays a crucial role in the urban experience of each city.
While recent changes in immigration policy, such as the reduction in refugee
admission and the increase in the amount of arrests of unauthorized immigrants, have
made significant impacts on both of these cities, it is too soon to understand the
implications of these decisions. This paper looks at major policy changes from 1961 to
2008 and investigates to what extent these changes have impacted both cities and
shaped them into the communities they are today.
ENTRIKIN
3
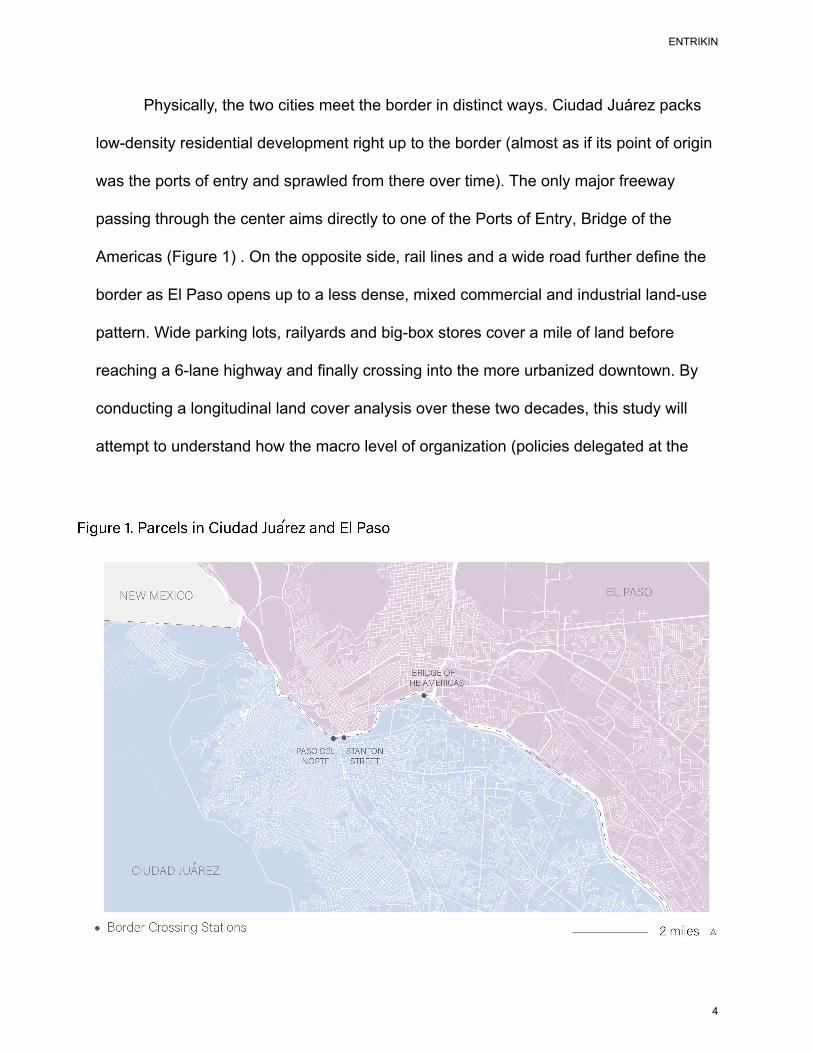
Physically, the two cities meet the border in distinct ways. Ciudad Juárez packs
low-density residential development right up to the border (almost as if its point of origin
was the ports of entry and sprawled from there over time). The only major freeway
passing through the center aims directly to one of the Ports of Entry, Bridge of the
Americas (Figure 1) . On the opposite side, rail lines and a wide road further define the
border as El Paso opens up to a less dense, mixed commercial and industrial land-use
pattern. Wide parking lots, railyards and big-box stores cover a mile of land before
reaching a 6-lane highway and finally crossing into the more urbanized downtown. By
conducting a longitudinal land cover analysis over these two decades, this study will
attempt to understand how the macro level of organization (policies delegated at the
ENTRIKIN
4
federal government level) influence organization at the micro level (local policy).
Understanding how the relationship between certain categories of immigration policy
and organizational space could comment on the role of planning in border communities.
Based on preliminary research, it seems that shifts in land use are born out of the
spikes and drops in daily immigration trends that have resulted from immigration policy.
Border crossings and apprehensions have shown drastic changes directly following
several of the policy implementations that are investigated in this research. With distinct
differences in how these two cities have developed over time and how that development
is a reflection of each country's relationship to the border, there will be a connection
between these policy implementations and the changes in land use. While we may not
work in international politics, it is the responsibility of planners to understand how
large-scale decisions influence small-scale organization. If we can extract themes of
response to different types of border policy, we can begin to understand and plan for
development trends following policy changes in the future.
ENTRIKIN
5
CHAPTER II: LITERATURE REVIEW
A. CONTROL AND TERRITORIALIZATION
In order to situate the concept of borders and control in relation to planning, this
literature review will begin by discussing Foucault’s concepts of governmentality and
biopolitics. Deleuze (1992) characterizes Foucault’s disciplinary society as initiating “the
organization of vast spaces of enclosure” (pg. 3); where the individual leaves one
environment of enclosure to enter a new environment of enclosure to begin again. The
Foucauldian narrative thus designates the border as defining environments of enclosure
at a massive scale. Leaving one country or space of enclosure means always starting
again; exchanging one society for another, adapting new laws, customs, lifestyles, and -
most pertinent this study - a new urban landscape.
Deleuze’s society of control, however, brings more complexity to the system. The
laws and practices are not autonomous within one environment of enclosure, but
proliferate throughout either side of the partition:
enclosures are molds , distinct castings, but controls are a modulation , like a self-deforming cast that will continuously change from one moment to the other, or like a sieve whose mesh will transmute from point to point (Deleuze, 1992, pg. 4).
The physical border between countries is the enclosure or mold, while the laws on
either side are the controls or modulation. Within a society of control, passing across the
physical border does not eliminate the manipulations of the previous country, especially
when the circulation from one side of the enclosure to the other becomes so prevalent.
As sovereign nations, the United States and Mexico are understood as separate,
ENTRIKIN
6
autonomous societies of control. However, as Deleuze synthesizes, as long as there is
transfer across the border, the controls and modulations can no longer be confined to
their enclosure of origin. Thus, international policies cannot be assumed to only impact
the country in which they originate, especially along the border where the transfer of
people, currency, and goods is so prevalent.
Another way to understand this relationship is through Elden’s (2013)
characterizations of territories and boundedness. He brings forth the concept of
territories and how they are commonly defined as two-dimensional spaces. The territory
is the concept of the enclosure and “can be understood as a political technology, or a
bundle of political technologies, understanding both political and technology in a broad
sense: techniques for measuring land and controlling terrain” (pg. 36). This
interpretation is helpful as it situates the concepts of territory and control within the
scope of the research in this study. Confining or bounding is the tool through which
political aims are carried out. At the macro level, sovereign borders are tools the federal
government uses to bound and enforce international policy. At the micro level, within
planning, cadastral borders are tools which are used to bound and enforce land use
designations. Socioeconomic and political incentives on both the macro and micro level,
when left unnoticed, can reveal themselves as rationale for the use of these tools. As
Eldon puts it, “boundedness is a particular form made possible by a deeper and
underlying determination of political space, as calculable” (pg. 35). In other words, a
boundary is created through the intention of political aims.
ENTRIKIN
7
Revisiting Foucault, land use designations can be understood as an operation of
governmentality. As Foucault theorizes, the concept of governmentality is the
purposeful molding of human conduct (Li, 2007):
“the will to govern...is concerned with ‘men in their relations, their links, their imbrication with...wealth, resources, means of subsistence, the territory with all its specific qualities, climate, irrigation, fertility...men in their relation to...accidents and misfortunes such as famine, epidemics, death, et cetera’” (pg. 275).
Therefore the will to govern, and thus to bound, is inherently tied to economic gain, the
right to land, safety, and prosperity.
B. LAND USE AS IT RELATES TO CONTROL
The conceptualization of power has long been linked to the claiming and
occupation of land. From colonization to western expansion the United States has been
built upon a practice of controlling and manipulating by seizure of land. Not only does
the occupation of land allow the owner to assert autonomy over their property, but it
also acts as a means to neglect and exclude that which falls outside of their ownership
(Lambin, 2001). It is here that the relationship between control and the planning of cities
becomes apparent. The designation of rights to the land fall under the category of land
use, which assigns the purpose for which land can be occupied (Lambin, 2001). Thus,
planners hold the power to neglect and exclude land outside of their jurisdictions
ownership.
Motivations for changes in land use designations vary depending on the region
and time period. Yet, as Lambin (2001) puts it, most often, “people's responses to
economic opportunities, as mediated by institutional factors, drive land-cover changes”
ENTRIKIN
8
(pg. 262). Which implies that the evolution of land occupation and use is a bottom-up
process. While in many places the use of land is designated by land use regulations,
and therefore the local government, the determination of these regulations are driven by
the promise of economic gain (Lambin, 2001). Returning to Foucault’s concept of
governmentality, “the concern of government is the wellbeing of populations at large...
to secure the ‘welfare of the population, the improvement of its conditions, the increase
of its wealth, longevity, health, et cetera’” and since it is “not possible to coerce every
individual and regulate their actions in minute detail. Rather, government operates by
educating desires and configuring habits, aspirations and beliefs” (Li, 2007, p. 275).
Thus, these laws, or institutional factors as Lambin refers to them, are not unbiased
from motivations of control and money.
Contemporary conditions of forces influencing land control, as defined by Peluso
(2011), become more complex. Peluso designates several factors that play a role in
manipulating the control of land in present day, defining control as actions that minimize
access, designate ownership or exclusion. These factors include, “enclosure,
territorialization, and legalization processes, as well as force and violence” (pg. 668). He
argues that contemporary conditions influencing land control are dynamic and complex.
That “authorities, sovereignties, and hegemonies” are being challenged by “new
enclosures, territorializations, and property regimes” (pg. 668). Peluso’s language
reflects that of both Deleuze and Elden, which helps to link the relationship between the
concept of territorialization to the practice of land use within planning. Additionally,
minimizing access and exclusion are two functions of a sovereign border. While one
ENTRIKIN
9
country does not have explicit control over the neighboring country, they are still able to
assert their control through exclusion and access.
C. TRANSBORDER CITIES
In order to situate these concepts of control and territorialization within the
context of El Paso and Juárez, it is necessary to understand what it means to be a
border city. These places are not autonomous entities acting under the laws of their
country alone. They are influenced by the current politics of both sides of the border as
well as the complex histories of each country and the relationship between the two.
Buursink (2001) situates a border city in the 21st century by emphasizing “the
importance of local conditions and historical backgrounds with regard to the mutual
relations and conditions of co-operation” (pg. 7). The histories of Mexico and the United
States and their political relationship with each other will be explored further in the
following section of this paper.
Fuentes (2006) differentiates between transnational processes and crossborder
processes. “Transnational” refers to processes such as immigration or imports and
exports. “Crossborder”, on the other hand, is defined as those processes occurring on a
local level and are directly impacted by what Fuentes calls “contiguous differences”
between the two countries (pg. 3). Herzog (1991) emphasizes the potentiality of such
cities situated along the border by coining the idealistic terminology of the “Transfrontier
Metropolis” (pg. 519), a utopia in which the city is not divided by the border but rather
united because of it. The “Transfrontier Metropolis” represents a hub of trade, industry,
ENTRIKIN
10
economy and the seamless integration of two societies and cultures. Lambin (2001), on
the other hand warns of using such sensationalistic terms. While the opportunities are
indeed plentiful in terms of trade, economy and society, the term fails to acknowledge
the complexities or a border city and the clashing of two cultures. Sloan (1977)
highlights some of these complexities of immigration policy and how local officials
objective’s are juxtaposed against state and federal objectives. All of these perspectives
reveal the complexities of a border city and the clashing motivations of agencies.
ENTRIKIN
11
CHAPTER III: METHODOLOGY
The methodology of this study includes a geographic information systems (GIS)
based analysis of land use and land cover in the regions surrounding the three border
crossing stations in El Paso, Texas, and Ciudad Juárez, Mexico, as well as site
observations in the study area. Land cover refers to the physical land type such as
developed land, desert or water. Land use refers to the way in which the developed land
is used, such as industrial, commercial or residential. Using these two methods allows
for the comparison of what happens over time within the border zone in comparison to
what is happening to the city as a whole. The scope of this research is not an
investigation of local land use policy, but local land use development and land use
outcomes.
A. BORDER POLICY ANALYSIS AND CATEGORIZATION
The policies evaluated in this research include the following enacted between
1961 and 2008 as shown in table 1. This list includes all of the policies between Mexico
and the United States which affected the movement of people or goods across the
border within this study period. These policies will be described further in the findings
section of this paper.
ENTRIKIN
12
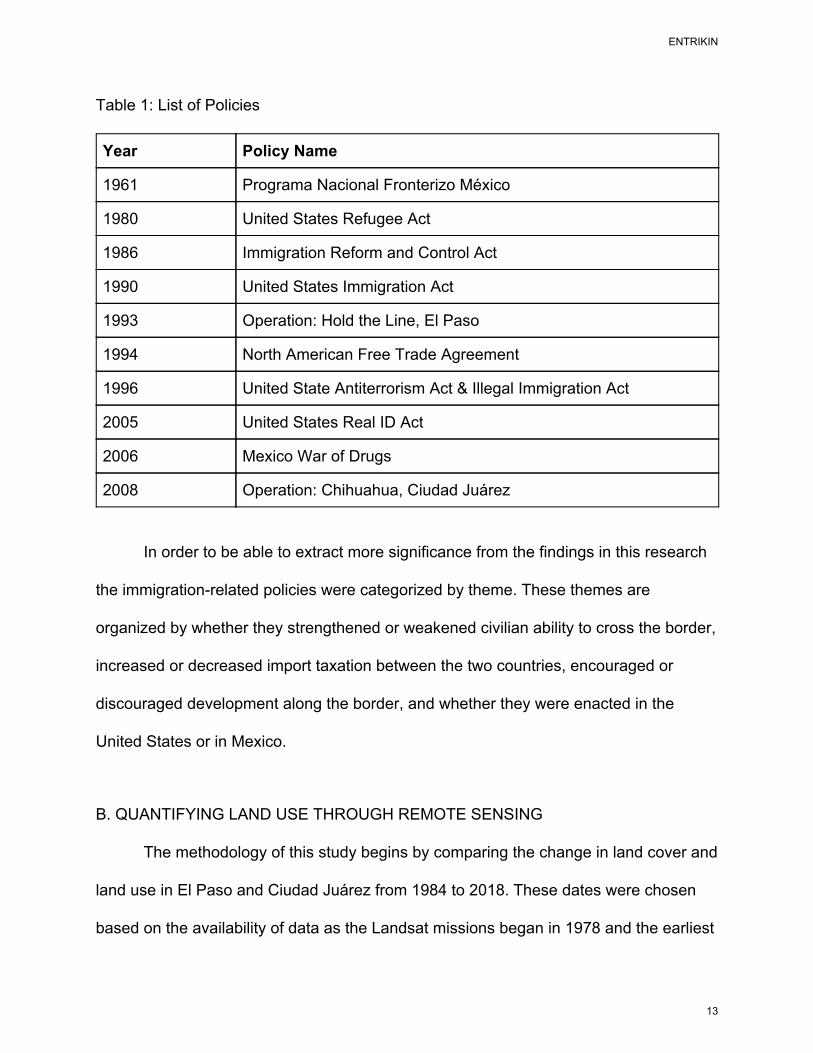
Table 1: List of Policies
Year Policy Name
1961 Programa Nacional Fronterizo México
1980 United States Refugee Act
1986 Immigration Reform and Control Act
1990 United States Immigration Act
1993 Operation: Hold the Line, El Paso
1994 North American Free Trade Agreement
1996 United State Antiterrorism Act & Illegal Immigration Act
2005 United States Real ID Act
2006 Mexico War of Drugs
2008 Operation: Chihuahua, Ciudad Juárez
In order to be able to extract more significance from the findings in this research
the immigration-related policies were categorized by theme. These themes are
organized by whether they strengthened or weakened civilian ability to cross the border,
increased or decreased import taxation between the two countries, encouraged or
discouraged development along the border, and whether they were enacted in the
United States or in Mexico.
B. QUANTIFYING LAND USE THROUGH REMOTE SENSING
The methodology of this study begins by comparing the change in land cover and
land use in El Paso and Ciudad Juárez from 1984 to 2018. These dates were chosen
based on the availability of data as the Landsat missions began in 1978 and the earliest
ENTRIKIN
13
quality image at the right location and during the right time of year (Summer and early
Fall when vegetation is healthy) is from 1984. By conducting a longitudinal land cover
and land use analysis, this study attempts to understand the implications of each of the
categories of policies between the two countries.
This portion of the analysis is two-fold. First, there is an overall land cover
analysis looking at the amount of land that is built and the amount of land that is
agricultural on either side of the border. The second, is a land use analysis which looks
at the built environment and how the area proximal to the border is being used.
Specifically, it looks at the change in land cover and land use on either side of the
border as well as how it changes proportionally from one side to the other. The imagery
that is used in this study is collected from the United States Geological Survey’s
Landsat mission for each year within the study period. This includes data from the
Landsat missions described in Appendix E.
While specifically interested in the years directly following a major policy change,
an identical spatial analysis has been conducted for each year within the study time
period in which there is available data (1984 to 2018, excluding 2012 due to a lack of
sufficient imagery). Since land use and land cover changes occur over a long period of
time, and thus any impact from policy changes would be delayed, this will help to
understand overarching trends in land use development and change in the region. The
details of this spatial analysis will be further described with the presentation of the
findings in the following chapter.
ENTRIKIN
14
C. ADDITIONAL DATA COLLECTION
Additionally, field research was conducted while in El Paso to gain an
on-the-ground perspective of changes in land use that have occurred near the border.
The area was surveyed to try to understand the physical implications of certain land-use
patterns.
ENTRIKIN
15
CHAPTER IV: FINDINGS
A. CATEGORICAL CHANGES IN POLICIES
In choosing which international policies to include in this analysis, it was
necessary to include any policy that pertains to the border itself, immigration in and out
of Mexico and the United States, economic ties between the two countries, or the
perception of immigration and foreign influences from the year 1960 to 2008. Thus, the
following list includes policies in both Mexico and the United states, on both the federal
and local level. One might think that there should be more than ten policies, but under
these terms these are the only ten. Policies related to the movement of people or goods
across the border are largely regulated at the federal level, rather than the local level,
and thus do not occur frequently.
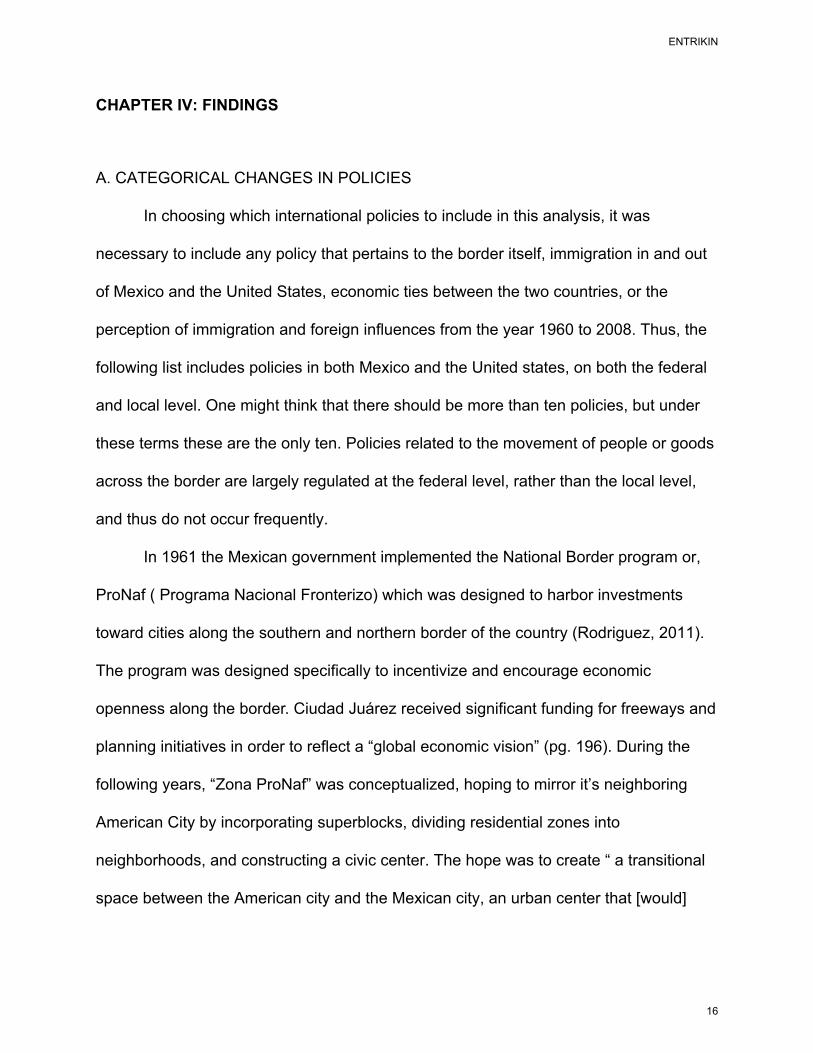
In 1961 the Mexican government implemented the National Border program or,
ProNaf ( Programa Nacional Fronterizo) which was designed to harbor investments
toward cities along the southern and northern border of the country (Rodriguez, 2011).
The program was designed specifically to incentivize and encourage economic
openness along the border. Ciudad Juárez received significant funding for freeways and
planning initiatives in order to reflect a “global economic vision” (pg. 196). During the
following years, “Zona ProNaf” was conceptualized, hoping to mirror it’s neighboring
American City by incorporating superblocks, dividing residential zones into
neighborhoods, and constructing a civic center. The hope was to create “ a transitional
space between the American city and the Mexican city, an urban center that [would]
ENTRIKIN
16
establish the primary gateway to a new international border crossing between the two
countries” in order to capitalize on the “advantages of being neighbor to the country with
the highest purchasing power” (pg. 196-197). Mexico saw an opportunity to invest In
their border cities and used land use as the means to carry out this investment.
During the 1980s and early 1990s the United States implemented a series of
legislation regarding the limits of refugees and immigrants that can legally enter the
country. The first of these policies was the United States Refugee Act of 1980 which
redefined the term ‘refugee’ and raised the annual limit from 17,400 to 50,000 (Refugee
Act of 1980). In the wake of some 300,000 refugees fleeing Cambodia and Vietnam
following the Vietnam War, the Act provided a necessary framework for the legal entry
of refugees into the country as well as setting a platform for adjusting the limit in a time
of crisis or emergency (National Archives Foundation, 2019).
ENTRIKIN
17
Next came the United States Immigration Reform & Control Act of 1986. The first
of its kind, this law combined “strengthened immigration enforcement with legalization
provisions for unauthorized immigrants” (Chishti, 2011, par. 1). While the goal of this
legislation was to halt the hiring of undocumented immigrants and increase security
along the border, it resulted in the legalization of any undocumented immigrant who
entered the country prior to 1982 as well as certain undocumented agricultural workers
(U.S. Citizenship and Immigration Services, 2016).
Four years later, the Federal government amended the Immigration and
Nationality Act with the creation of the US Immigration Act of 1990, raising the number
of immigrants that can legally enter the country annually from 530,000 to 675,000
(Leiden, 1990).
In 1993, Operation “Hold the Line” was implemented in El Paso. Lasting from
1993 until 1995, officers formed a physical blockade that included vehicles, humans and
the construction of a chain-linked fence along the border in order to deter illegal border
crossings (U.S. Customs and Border Protection, 2018). The operation proved to be
successful in significantly diminishing the number of apprehensions and, thus, other
border cities such as San Diego enacted similar efforts soon after.
Reducing restriction for trade between the US, Mexico and Canada, the North
American Free Trade Agreement (NAFTA) was enacted in 1994. It established an
official trade relationship between the three countries and progressively eliminated all
tariffs, duties and restrictions (Office of the U.S. Trade Representative, 2019).
Additionally, the North American Free Trade Agreement includes rules of “ origin,
ENTRIKIN
18
customs procedures, agriculture and sanitary and phytosanitary measures, government
procurement, investment, trade in services, protection of intellectual property rights, and
dispute settlement procedures” (par. 2). Thus, NAFTA was able to set the framework for
trade and economic relations across the three countries.
Shortly before the implementation of NAFTA, Mexico reduced taxation on the
importation of manufacturing equipment through the Maquiladora Decree of 1989
(Schechter, 1992). This combination of legislation resulted in an influx of Maquiladoras
along the United States border in Mexico. Maquiladoras are factories in Mexico that are
owned and run by foreign firms, most often employing Mexican workers and exporting
goods back to the United States.
As a result of rapidly growing illegal immigration and an increased apprehension
of foreign terror attacks, the United States enacted two pieces of legislation to
counteract terrorism and illegal immigration in 1996. The Illegal Immigration Reform and
Immigrant Responsibility Act of 1996 strengthened border enforcement by “imposing
criminal penalties for racketeering, alien smuggling and the use or creation of fraudulent
immigration-related documents and increasing interior enforcement by agencies
charged with monitoring visa applications and visa abusers” (Illegal Immigration Reform
and Immigration Responsibility Act, 2018, par. 2). Thus, reinforcing tactics used to
secure the border and reduce illegal immigration.
The second piece of legislation enacted by the federal government in 1996 is the
United States Antiterrorism and Effective Death Penalty Act, which was passed as a
reaction to the 1995 Oklahoma City bombings as well the 1993 World Trade Center
ENTRIKIN
19
bombing (Doyle, 1996). The stated purpose of this amendments is “to prevent persons
within the United States, or subject to the jurisdiction of the United States, from
providing material support or resources to foreign organizations that engage in terrorist
activities“ (Antiterrorism and Effective Death Penalty Act of 1996, p. 22). To do this, the
Act establishes a framework for designated terrorist organizations and prohibiting
financial relationships and assistance to countries with ties to terrorist organizations.
Additionally, Title IV addresses terrorism issues in regard to immigration:
it establishes or adjusts mechanisms to bar alien terrorists from the U.S., to remove from the U.S. any who are here, to narrow asylum provisions which allow terrorists to frustrate efforts to bar or remove them, and to expedite deportation of criminal aliens (Doyle, 1996, p. 1)
While this act is not explicitly about the United States’ relationship with Mexico, it
demonstrates how policy dealing primarily with domestic situations can influence
external relations at the borders.
In 2005 the United States enacted the Real ID Act which set requirements for ID
verification. It created standards for identification that could be issued by States in order
to make the creation of fraudulent identification such as driver’s licenses more difficult to
replicate. This act also required the verification of identification when “accessing Federal
facilities, entering nuclear power plants, and, boarding federally regulated commercial
aircraft” (“Real ID”, 2018, par. 1). Thus creating more barriers to people who were
illegally residing in the country.
Spearheaded by President Felipe Calderon, the Mexican government began the
War on Drugs in 2006, cracking down on drug cartels in order to reduce trafficking at
the border. By February 2007 there were 20,000 Mexico soldiers stationed throughout
ENTRIKIN
20
the country as part of the drug war, and during the first full year of it’s deployment
(2007) 2,837 people are killed (Rawlins, 2011). Then in 2008, the government enacted
a specialized military and police effort in Ciudad Juárez to reduce cartel violence named
Operation: Chihuahua.
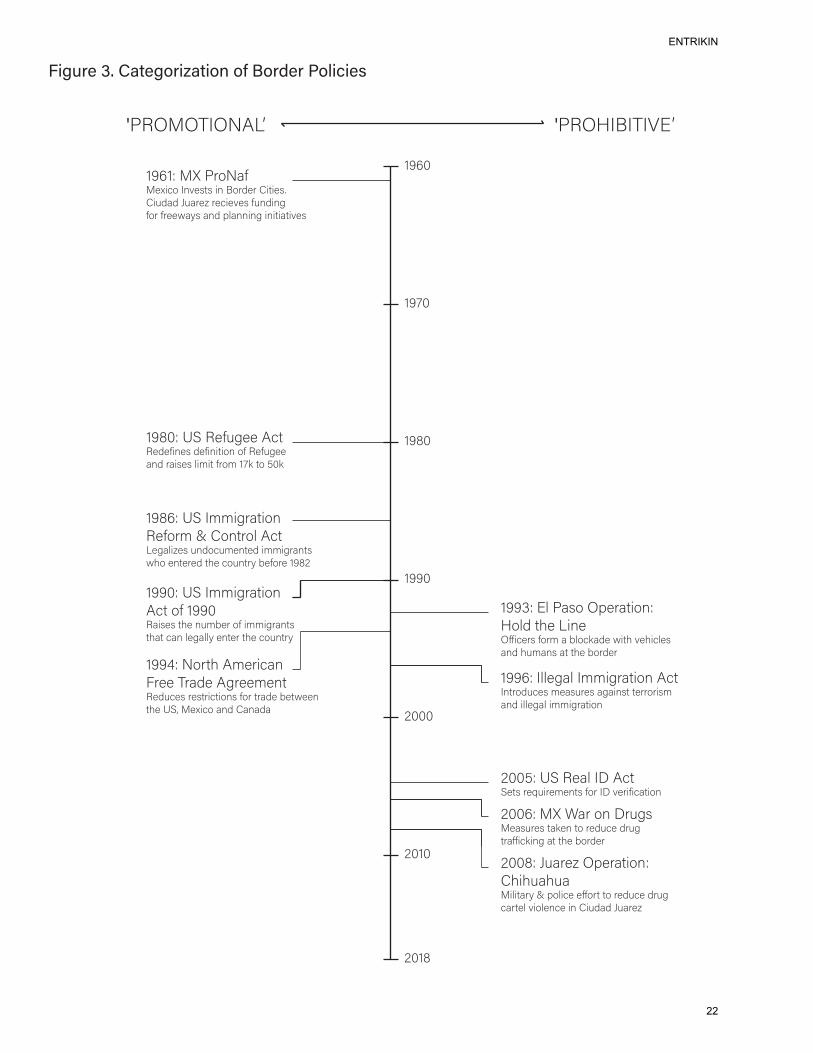
In order to understand the land use shifts in El Paso and Ciudad Juárez as it
relates to border policy, it is necessary to categorize these policies into groupings of
similar intents. Thus, the border policies under consideration in this study have been
divided into two categories. The first category is promotional, meaning legislation that
either directly or indirectly encourages immigration, economic relationships between
Mexico and the United States, development along the border, or circulation amongst
border cities. The second category is prohibitive, or rather legislation that is meant to
deter border crossings and immigration, strengthen border patrol, or dissuade economic
ties between the two countries.
Figure 3 describes the general arc of border policy across both countries, as it
shifted from more promotional in 1960 and became more and more prohibitive by 2018.
Because these two typologies are so cleanly distributed across the study period, the
results conclude three policy phases that were shared across the border. The first, prior
to 1993, all of the border policies within the study time period are promotional. Then
from 1993 to 2005 there is a transitional period where the United States begins to
introduce prohibitive policies and Mexico remains promotional. Lastly, from 2005
onward, Mexico begins its phase of prohibitive policy with the War on Drugs and all of
the remaining policies are prohibitive.
ENTRIKIN
21
!"#$%&'()'*+,&#-%".+,"-/'-0'1-%2&%'3-4"5"&6'
!"#$
!"%$
!"&$
!""$
'$$$
'$!$
'$!&
!"#!()*+),-./01*2345.)67829:9)47);.-<2-)=4:429>)=4?<0<)@?0-2A)-2542829)1?7<47B1.-)1-22C0D9)07<)EF07747B)474:40:4829
!"&$()GH)I21?B22)J5:I2<214729)<21474:4.7).1)I21?B22)07<)-04929)F4K4:)1-.K)!%L):.)M$L
!"&#()GH)6KK4B-0:4.7)I21.-K)N)=.7:-.F)J5:O2B0F4A29)?7<.5?K27:2<)4KK4B-07:9CP.)27:2-2<):P2)5.?7:-D)Q21.-2)!"&'
!""$()GH)6KK4B-0:4.7J5:).1)!""$I04929):P2)7?KQ2-).1)4KK4B-07:9:P0:)507)F2B0FFD)27:2-):P2)5.?7:-D)
!""R()SF),09.)TE2-0:4.7()U.F<):P2)O472TV452-9)1.-K)0)QF.5L0<2)C4:P)82P45F29)07<)P?K079)0:):P2)Q.-<2-
!""W()/.-:P)JK2-4507X-22)Y-0<2)JB-22K27:I2<?529)-29:-45:4.79)1.-):-0<2)Q2:C227:P2)GHZ)*2345.)07<)=070<0
!""#()6FF2B0F)6KK4B-0:4.7)J5:67:-.<?529)K209?-29)0B0479:):2--.-49K07<)4FF2B0F)4KK4B-0:4.7
'$$M()GH)I20F)6[)J5:H2:9)-2\?4-2K27:9)1.-)6[)82-41450:4.7
'$$#()*+)]0-).7)[-?B9*209?-29):0L27):.)-2<?52)<-?B:-0V45L47B)0:):P2)Q.-<2-)
'$$&()@?0-2A)TE2-0:4.7(=P4P?0P?0*4F4:0-D)N)E.F452)2V.-:):.)-2<?52)<-?B50-:2F)84.F2752)47)=4?<0<)@?0-2A)
',IT*TY6T/JO ',ITU6;6Y6_S^
ENTRIKIN
22
B. SITE OBSERVATIONS:
These site observations were conducted on a Monday in early January. It must
be noted that they do not reflect how these spaces in El Paso and Juárez are occupied
during a different time of year or different day of the week. Online resources such as
Google Maps and Reference USA were used to supplement these observations.
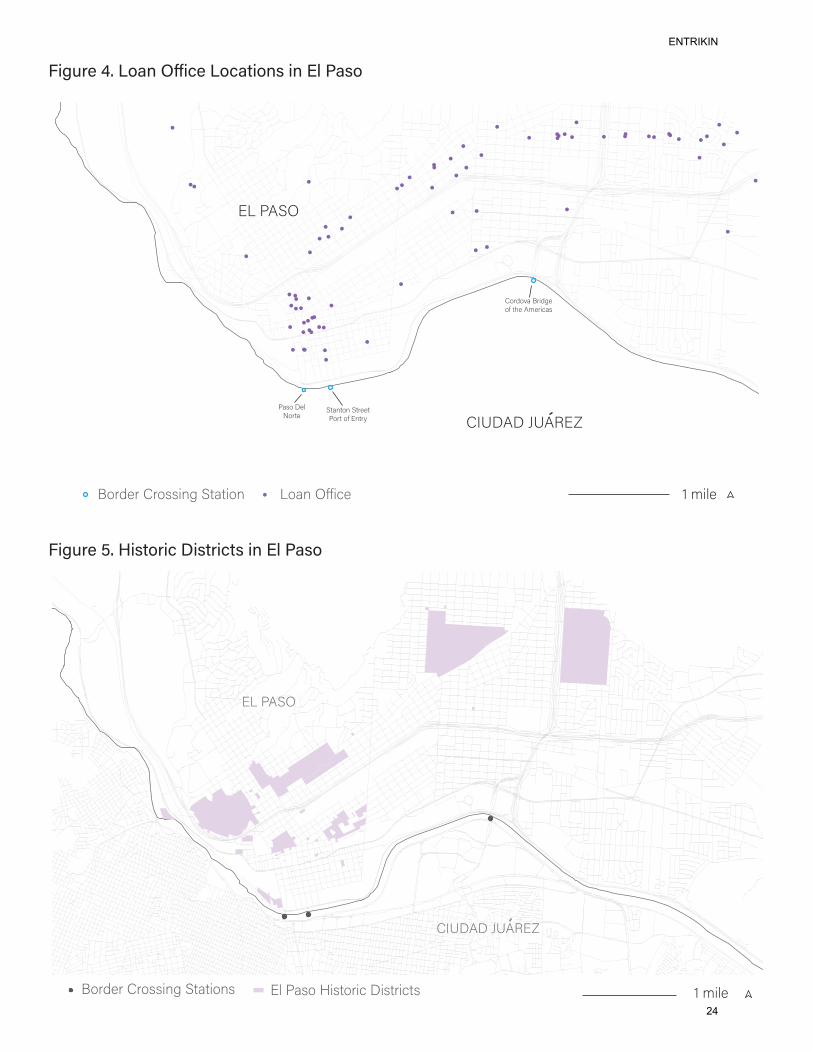
Immediately north of the border crossing stations located in downtown El Paso
(Paso Del Norte and Stanton Street Port of Entry), the landscape is barren. The built
environment is generally made up of large warehouse buildings and large parking lots.
Scattered throughout are retail spaces advertising duty free goods as well as school
catering to Mexican students who cross the border daily in order to attend school in El
Paso.
The urban landscape slightly further from the border is made up of commercial
space generally catering to the Mexican population as well as loan offices advertising
quick and convenient loan services. These types of payday lending offices are not
uncommon in mid-sized American cities but the concentration of their location near the
border in El Paso is noteworthy.
On the opposite side of the border, Ciudad Juárez greets its visitors with more of
a bustling commercial corridor. There are shops and spaces to exchange money as well
as several dental offices. Due to the low cost of dental work in Mexico it is common for
Americans to cross the border for dental services. Overall, the space is much more
ENTRIKIN
23
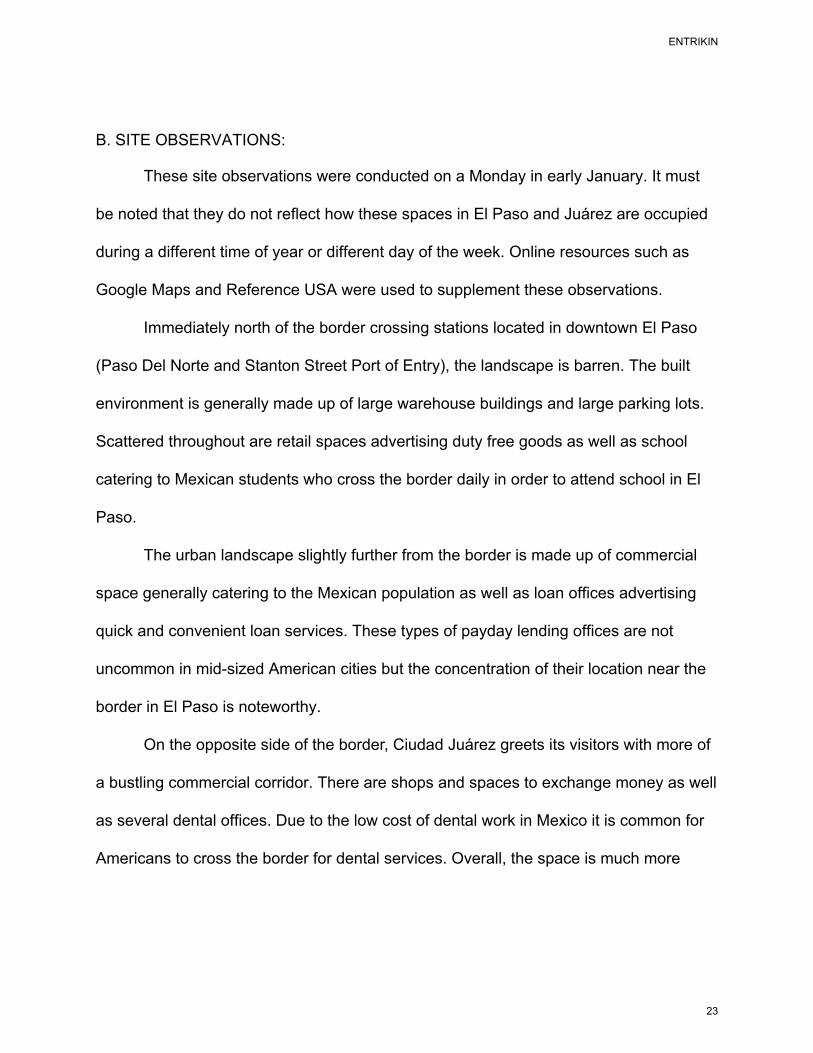
<&=)>%
!"#$%&'()'*+,-'./"0&'*+0,1"+-2'"-'34'5,2+'
!"#$%&'6)'7"21+%"0'8"21%"012'"-'34'5,2+'
'"#$"B.&!#)$+%"@&-C%&6=%#)2.(
,-.*-"*&,-#%%-;"#-&"@&9*-#A
;.("&5%>D"#-%
!"#$%#&'#"(()*+&,-.-)"* /".*&01)2%
'34565&74689:
9/&;6,0
<&=)>%!"#$%#&'#"(()*+&,-.-)"*(
9/&;6,0
'34565&74689:
9>&;.("&?)(-"#)2&5)(-#)2-(
ENTRIKIN
24
inhabited than its counterpart across the border. There is designated open space,
restaurants with outdoor seating, and murals on blank walls.
C. GIS-BASED ANALYSIS
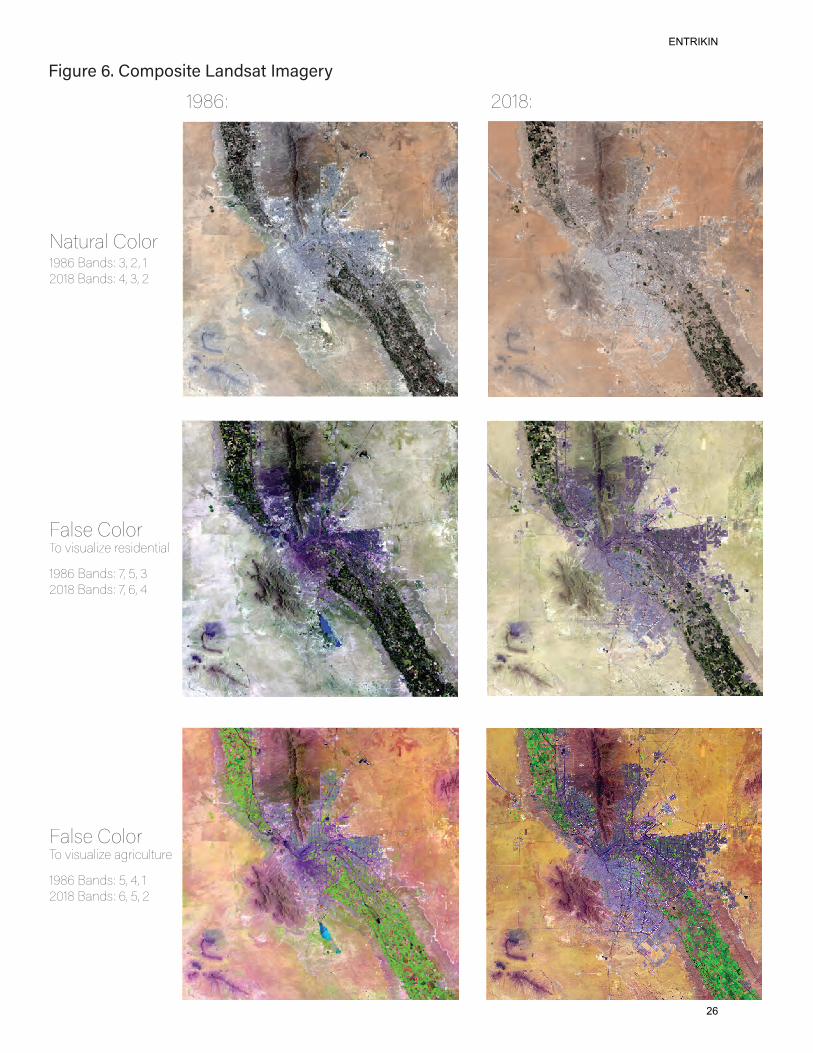
In order to utilize the remotely-sensed imagery from the United States Geological
Survey to understand the change in land cover on either side of the border it is
necessary to render new color composites. As shown in figure 6, the natural color
composite for Landsat missions 3 through 7 combine bands 3, 2, and 1. For Landsat
mission 7, the natural color composite bands are 4, 3, and 2. To visualize and classify
developed land (residential and commercial space) bands 7, 5 and 3 are used for
Landsats 3 through 7, and bands 7, 6 and 4 for Landsat 8 to create a false color
composite. When visualized this way, purple indicates the presence of residential
development, and white indicates the presence of commercial space. For agricultural
land, the false color composite is made for Landsats 3 through 7 with bands 5, 4 and 1
and for Landsat 8 with bands 6, 5 and 2. When visualized this way, healthy vegetation
renders green. These composite rasters are then classified by manually constructed
training samples which return a classified raster output.
As the quality and resolution of the imagery improves drastically from Landsat 3
to Landsat 8, the accuracy of the analysis changes over time as well. Additionally, the
training samples gathered while classifying the image are subject to user error. While
effort was taken to ensure a sufficient analysis for each year, it is impossible to generate
a completely accurate classification raster.
ENTRIKIN
25
!"#$%&'()'*+,-+."/&'0123.1/'4,1#&%5'
!"#$% &'!#%
()*+,)-./0-0,!"#$.1)234%.56.& 6.!&'!#.1)234%.76.56.&
8)-49./0-0,:0.;<4+)-<=9.,94<392*<)-
!"#$.1)234%.>6.?6.5&'!#.1)234%.>6.$6.7
8)-49./0-0,:0.;<4+)-<=9.)@,<A+-*+,9
!"#$.1)234%.?6.76.!&'!#.1)234%.$6.?6.&
ENTRIKIN
26
!"#$%&'()'*&+$,-+'./'*&0.-&'1&2+"2#'3,4++"/"54-".2'
!"#$%
&'!#%
:/;6+)<
:/;6+)<
()*)+,-)./012.
345678+9851+/012.
()*)+,-)./012.
345678+9851+/012.
ENTRIKIN
27
!"#$%&'()'*+(,'-./'01*('23-#&%4'56'7#%"8$9:$%&'".';"$/-/'<$-%&='-./'>9'?-@5'
!"#$%
&'!#%()*+,-.
()*+,-.
ENTRIKIN
28
Additionally, the difference in weather from year to year (wet or dry) causes
volatility in the readings of agricultural land. The imagery was collected from June to
October each year to try and ensure similar vegetation levels. For the year 2012, there
was no available imagery with minimal cloud coverage within that time period, thus
there is not data provided for that year. To compensate for the variation and inevitable
inaccuracy of remotely sensed raster classifications, the analysis examines the overall
trends of each land use type as well as the proportion between the two cities.
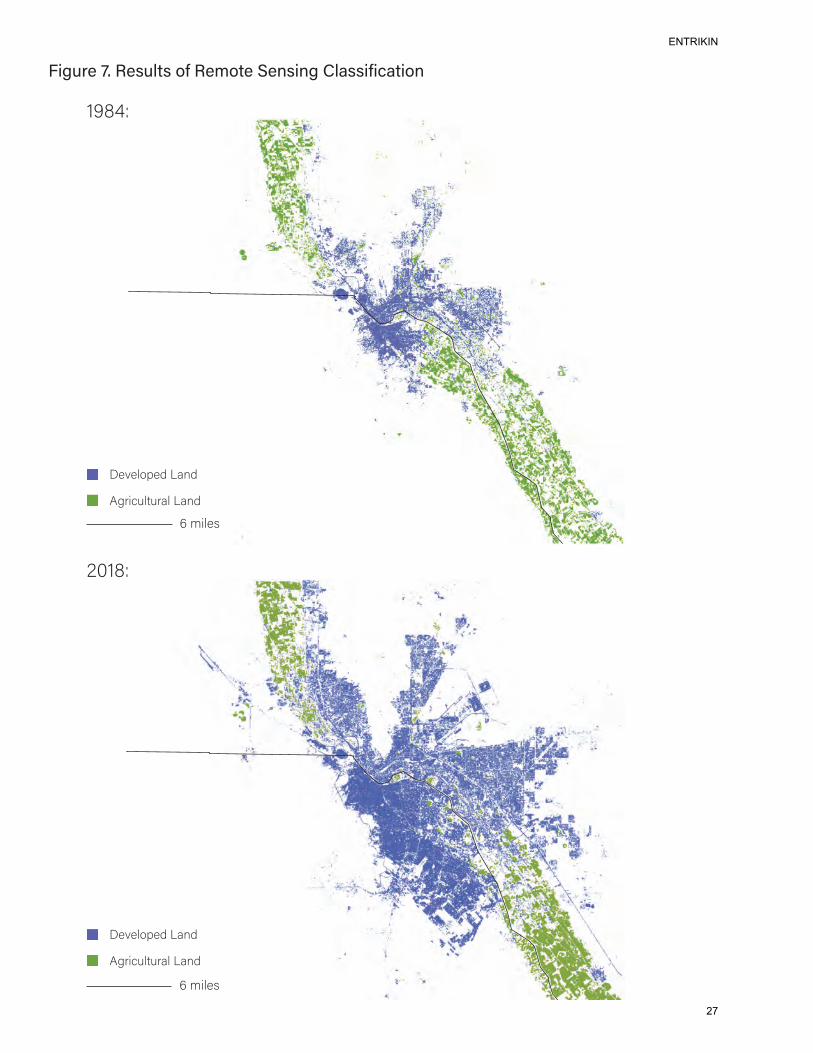
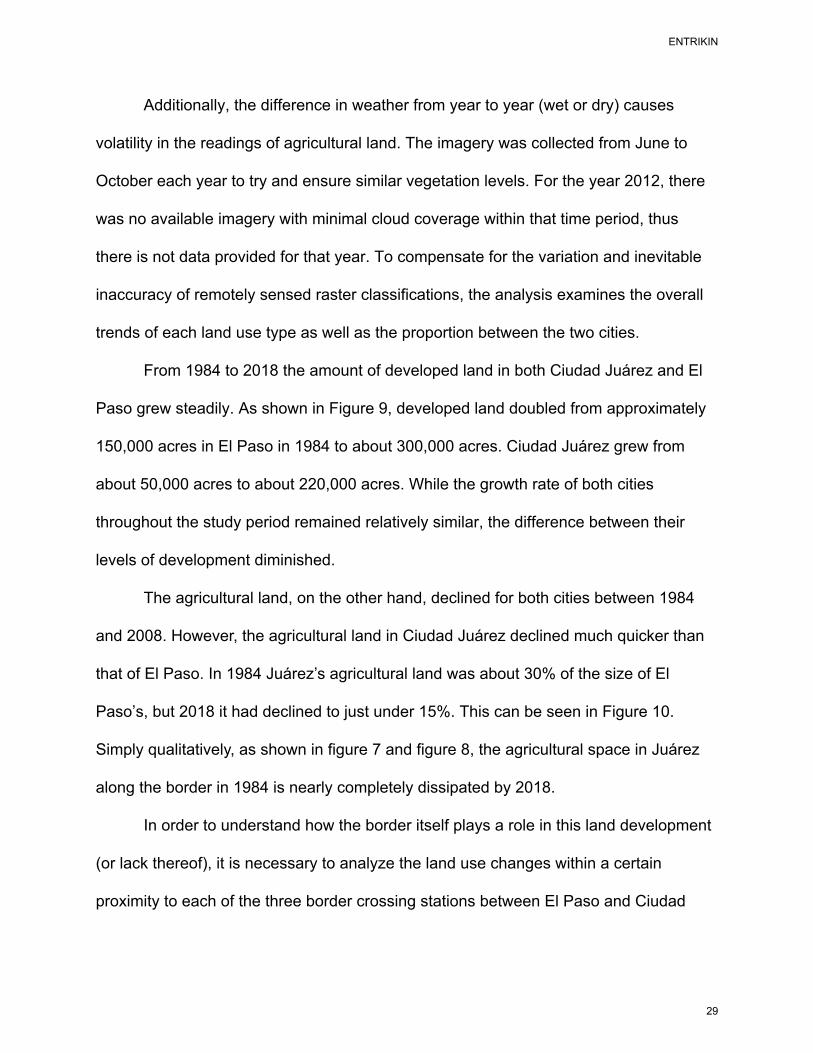
From 1984 to 2018 the amount of developed land in both Ciudad Juárez and El
Paso grew steadily. As shown in Figure 9, developed land doubled from approximately
150,000 acres in El Paso in 1984 to about 300,000 acres. Ciudad Juárez grew from
about 50,000 acres to about 220,000 acres. While the growth rate of both cities
throughout the study period remained relatively similar, the difference between their
levels of development diminished.
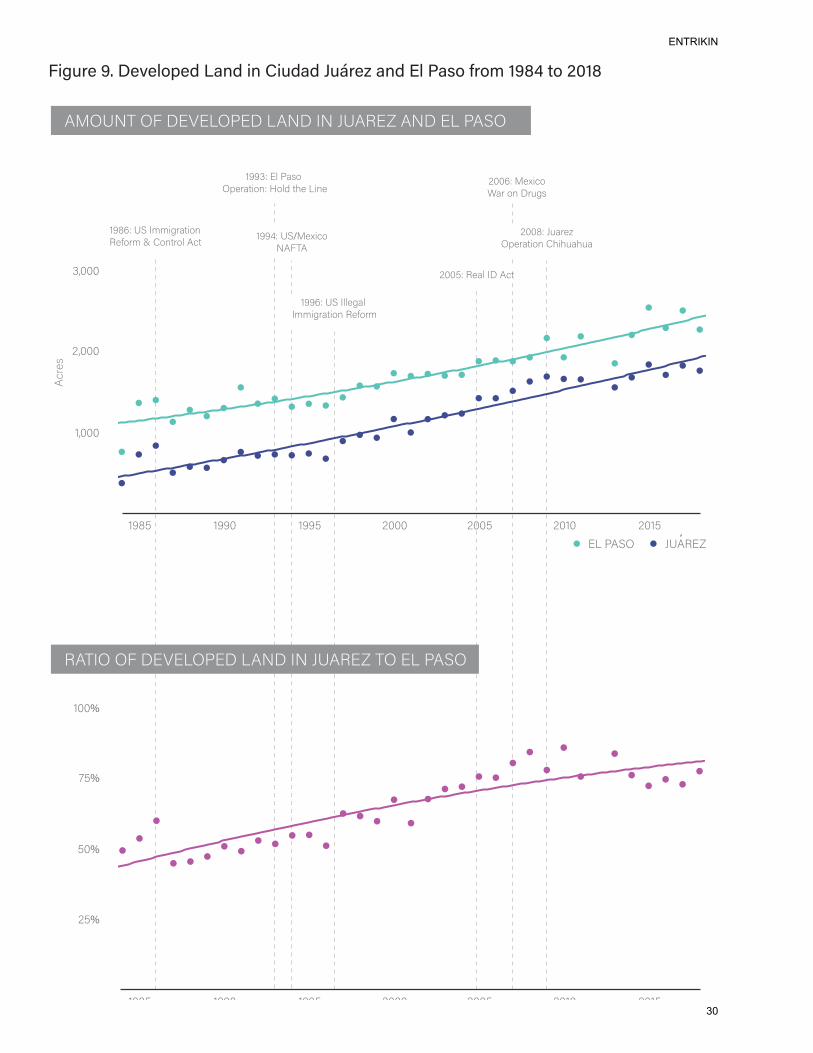
The agricultural land, on the other hand, declined for both cities between 1984
and 2008. However, the agricultural land in Ciudad Juárez declined much quicker than
that of El Paso. In 1984 Juárez’s agricultural land was about 30% of the size of El
Paso’s, but 2018 it had declined to just under 15%. This can be seen in Figure 10.
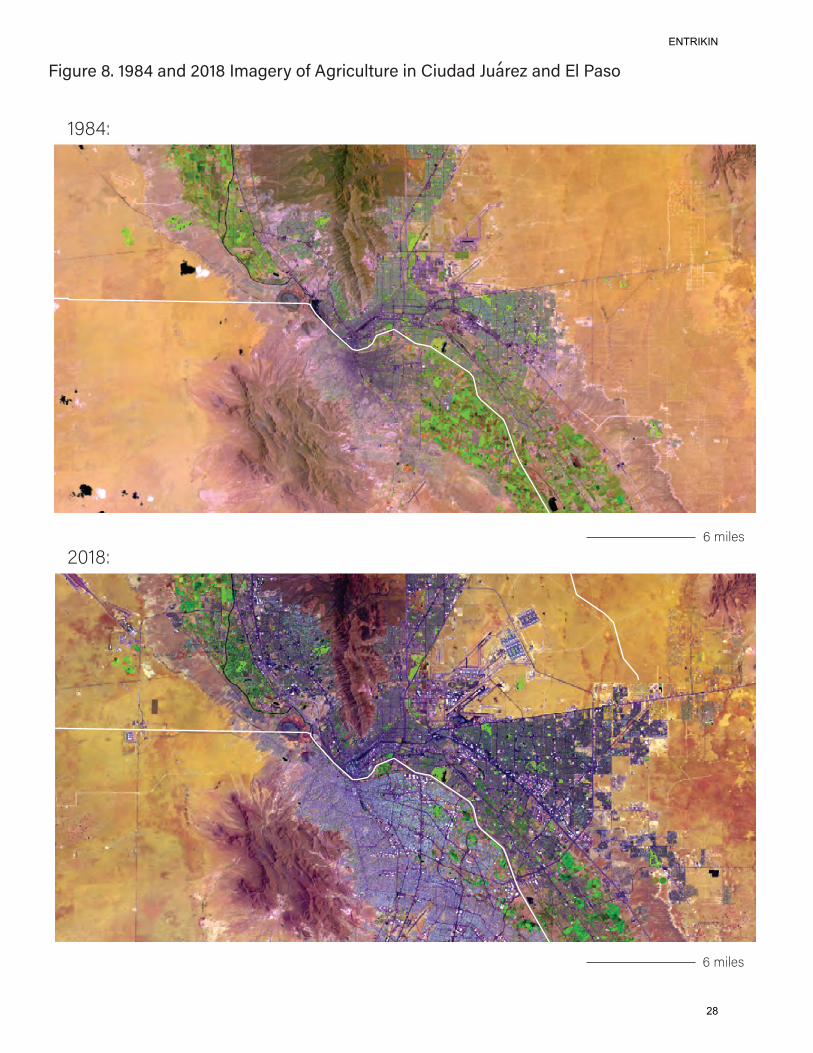
Simply qualitatively, as shown in figure 7 and figure 8, the agricultural space in Juárez
along the border in 1984 is nearly completely dissipated by 2018.
In order to understand how the border itself plays a role in this land development
(or lack thereof), it is necessary to analyze the land use changes within a certain
proximity to each of the three border crossing stations between El Paso and Ciudad
ENTRIKIN
29
!"#$%&'()'*&+&,-.&/'012/'"2'3"$/1/'4$5%&6'12/'7,'819-':%-;'<(=>'?-'@A<='
!"###
$"###
%"###
%##%
&'%
'#%
$'%
$##()*+,-./0123*04*53678
%9:()*;<*=>>.732?.04@,A03>*B*C04?30D*E/?
%99!)*FD*G280*HI,32?.04)*J0DK*?L,*M.4,
%99N)*;</+,-./0OEPQE
$##:)*R623,SHI,32?.04*CL.L62L62
%9:' %99# %99' $### $##' $#%# $#%'
%9:' %99# %99' $### $##' $#%# $#%'
@EQ=H*HP*5FTFMHGF5*MEO5*=O*R;E@FU*QH*FM*GE<H
E+H;OQ*HP*5FTFMHGF5*MEO5*=O*R;E@FU*EO5*FM*GE<H
FM*GE<H R;E@FU
$##')*@,2D*=5*E/?
%99()*;<*=DD,72D*=>>.732?.04*@,A03>
E/3,8
ENTRIKIN
30
!"#$%&'()*'+#%",$-.$%/-'0/12'"1'3"$2/2'4$5%&6'/12'7-'8/9:';%:<'(=>?'.:'@)(>'
!""#$%&'()*+,-.%+/%0.123
456#$%78%9::)2.-;)+/<'=+.:%>%?+/;.+@%A*;
455B$%C@%D-3+%EF'.-;)+/$%G+@H%;I'%J)/'
455K$%78/&'()*+LAMNA
!""6$%O1-.'PEF'.-;)+/%?I)I1-I1-
<AN9E%EM%GCAJNGQ%RCSCNAN9EL%9L%O7A<CT%NE%CJ%DA8E
A&E7LN%EM%GCAJNGQ%RCSCNAN9EL%9L%O7A<CT%AL0%CJ%DA8E
CJ%DA8E O7A<CT
4U"""
4UV""
!U"""
456V 455" 455V !""" !""V !"4" !"4V
456V 455" 455V !""" !""V !"4" !"4V
K"%
B"%
!"%
4"%
!""V$%<'-@%90%A*;455#$%78%9@@'2-@%
9::)2.-;)+/%<'=+.:
V""
A*.'3
ENTRIKIN
31
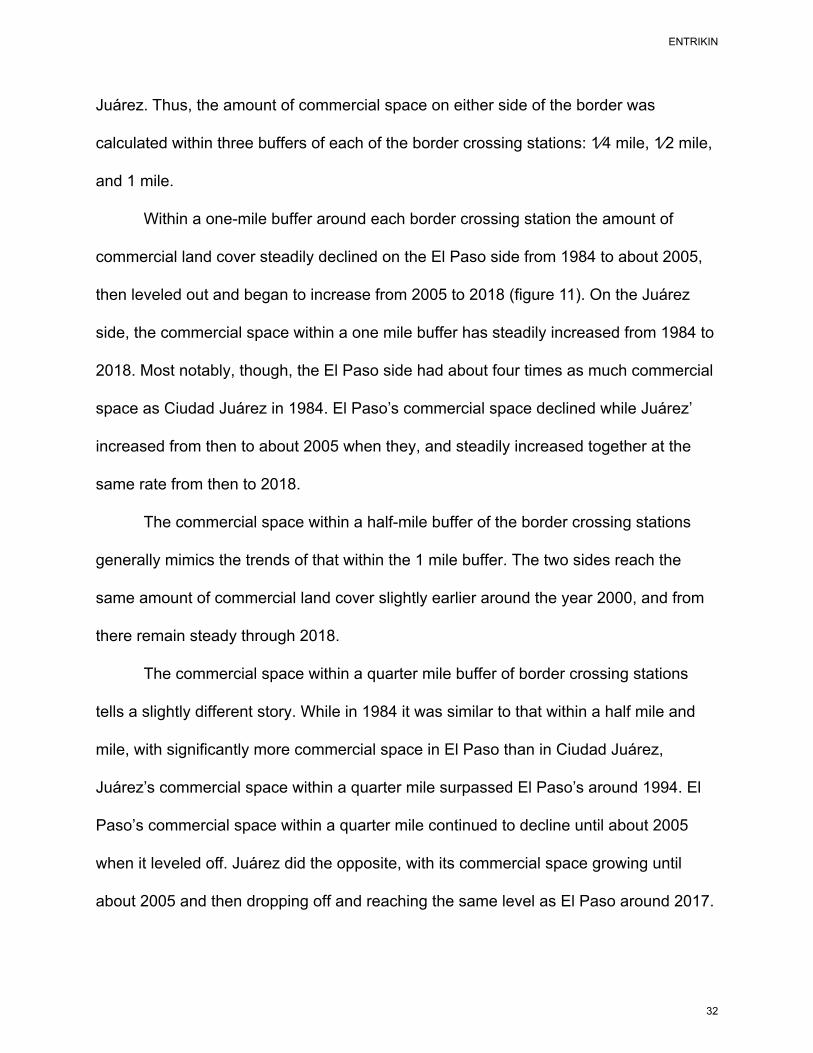
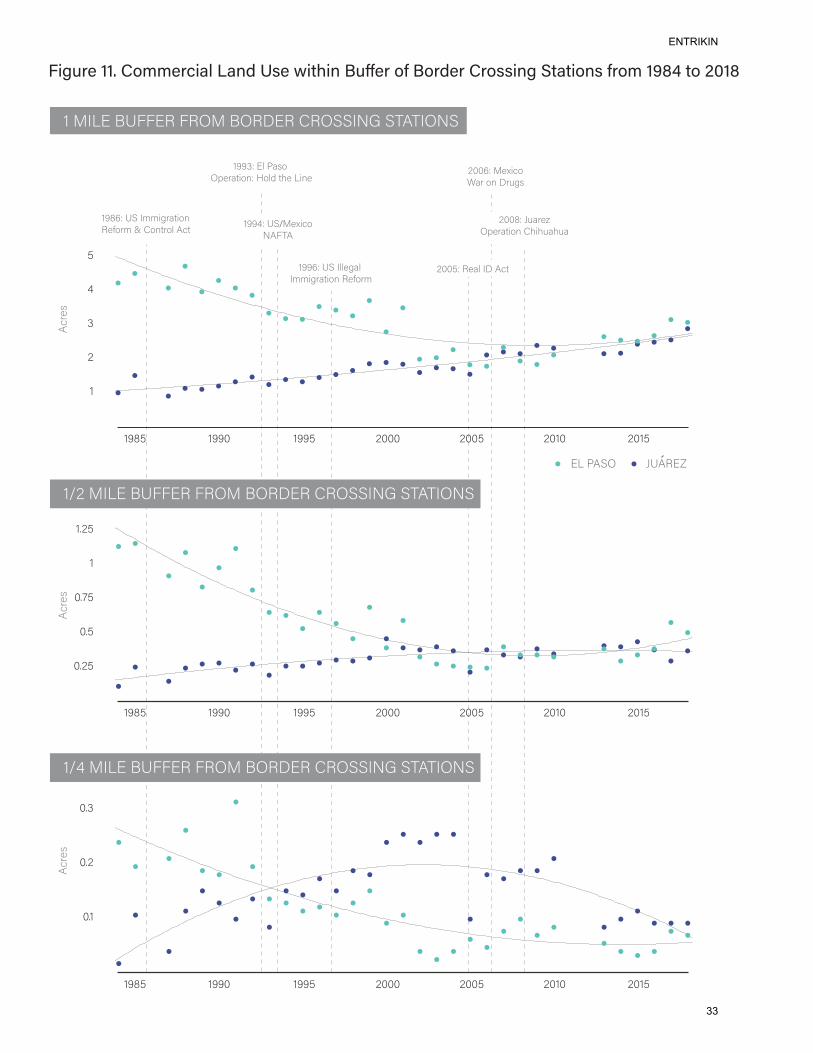
Juárez. Thus, the amount of commercial space on either side of the border was
calculated within three buffers of each of the border crossing stations: 1⁄4 mile, 1⁄2 mile,
and 1 mile.
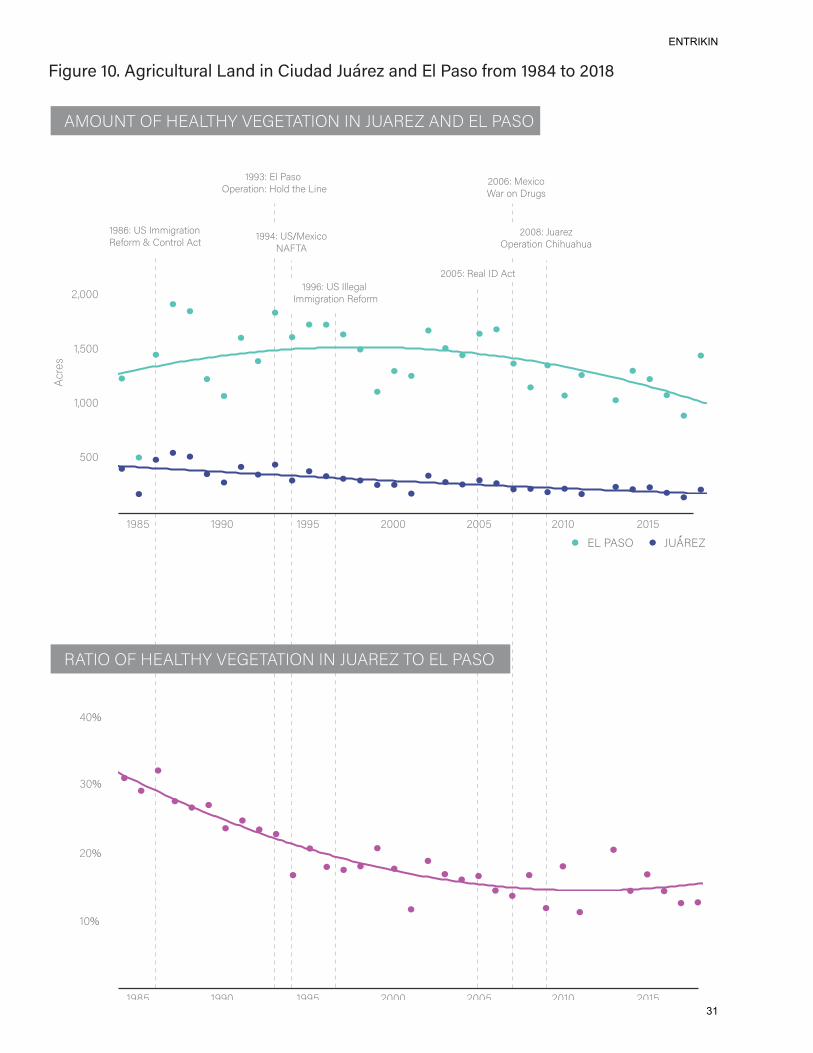
Within a one-mile buffer around each border crossing station the amount of
commercial land cover steadily declined on the El Paso side from 1984 to about 2005,
then leveled out and began to increase from 2005 to 2018 (figure 11). On the Juárez
side, the commercial space within a one mile buffer has steadily increased from 1984 to
2018. Most notably, though, the El Paso side had about four times as much commercial
space as Ciudad Juárez in 1984. El Paso’s commercial space declined while Juárez’
increased from then to about 2005 when they, and steadily increased together at the
same rate from then to 2018.
The commercial space within a half-mile buffer of the border crossing stations
generally mimics the trends of that within the 1 mile buffer. The two sides reach the
same amount of commercial land cover slightly earlier around the year 2000, and from
there remain steady through 2018.
The commercial space within a quarter mile buffer of border crossing stations
tells a slightly different story. While in 1984 it was similar to that within a half mile and
mile, with significantly more commercial space in El Paso than in Ciudad Juárez,
Juárez’s commercial space within a quarter mile surpassed El Paso’s around 1994. El
Paso’s commercial space within a quarter mile continued to decline until about 2005
when it leveled off. Juárez did the opposite, with its commercial space growing until
about 2005 and then dropping off and reaching the same level as El Paso around 2017.
ENTRIKIN
32
!"#$%&'(()'*+,,&%-"./'0.12'34&'5"67"1'8$9&%'+:'8+%2&%'*%+44"1#';6.6"+14':%+,'(<=>'6+'?@(='
!"#$ !""% !""$ &%%% &%%$ &%!% &%!$
'
(
!
!"#$ !""% !""$ &%%% &%%$ &%!% &%!$
!)&$
%)*$
%)$
!"#$ !""% !""$ &%%% &%%$ &%!% &%!$
%)(
%)&
%)!
&
$
+,-./
!
%)&$
+,-./
+,-./
&%%0123.45,678-2692:-;</
!"#012=>2?@@5<-8A569B.C6-@2D2E69A-6F2+,A
!""(12GF2H8/62IJ.-8A56912K6FL2AM.2N59.
!""'12=>/3.45,6O+PQ+
&%%#12R;8-.SIJ.-8A5692EM5M;8M;8
!23?NG2T=PPGB2PBI32TIB:GB2EBI>>?OU2>Q+Q?IO>
!V&23?NG2T=PPGB2PBI32TIB:GB2EBI>>?OU2>Q+Q?IO>
!V'23?NG2T=PPGB2PBI32TIB:GB2EBI>>?OU2>Q+Q?IO>
GN2H+>I R=+BGW
&%%$12B.8F2?:2+,A!""012=>2?FF.<8F2?@@5<-8A5692B.C6-@
ENTRIKIN
33
The results of the policy analysis found three distinct phases within the study
period: promotional, transitional, and prohibitive. The results of the land use and land
cover analysis match these three phases. Specifically, the commercial land use
changes lineup nearly perfectly with the transition from one policy phase to another.
Thus, federal policies and local land use outcomes and decisions are coinciding. The
changes in land use logically correspond to federal level policy, despite the fact that
policy has nothing to do with local land use.
ENTRIKIN
34
CHAPTER V: DISCUSSION AND CONCLUSIONS
In regards to the border policies utilized in this research, it is at first surprising
that there are only ten enacted between 1960 and 2008 that fall under the given criteria.
On a second pass, it becomes less startling because these are largely a matter of
federal foreign relations and, if there were more, that would suggest an instability.
These policies are not flexible. Ideally, these are matters that are not negotiable and are
set in stone for a generation or longer. Thus, the period between 1961 and 1980 does
not only represent an absence of policy but a period of stability. This is understandable
as it aligns with the promotional side of the timeline and reflects a stable relationship.
The latter period of the timeline, on the other hand, shows the transition to prohibitive as
well as an influx of revisions in immigration policy. This frequency of revisions reinforces
this categorization of prohibitive during the latter part of this timeline as it represents
more of an unstable relationship between the two countries.
Looking at the findings that emerged during the GIS-based analysis layered on
top of the categorizations of immigration policies, certain patterns begin to emerge. At
the beginning of the study period, all of the policies are promotional, meaning both the
United States and Mexico wanted to encourage cross-border circulation and
development along the border. At that time, El Paso was much larger than Ciudad
Juárez in terms of both overall developed land and agricultural land. Additionally, El
Paso had a significantly greater amount of commercial space within all three distances
from the border crossing stations. This can be interpreted to mean that during this
ENTRIKIN
35
period of ‘openness’ El Paso was more likely to capitalize off of border circulation by
having commercial space so close to border crossing stations. Ciudad Juárez on the
other hand, likely depended much more on their agricultural industry at the time.
In the early 1990s a new wave begins with the introduction of the first prohibitive
policies. The North American Free Trade Agreement was passed in 1994, sandwiched
between Operation “Hold the Line” in 1993 and the United States Illegal Immigration Act
in 1996. The effect is as if United States federal government said they wanted to benefit
from an economic relationship with neighboring countries but do not want citizens from
those countries crossing the border. This becomes apparent within the built
environment as the developed area of El Paso continues to grow yet the commercial
space within each buffer has significantly declined. Ciudad Juárez, however grows in
developed land and commercial space yet their agricultural land continues to be eaten
up by developed land cover. The beginning of this phase (1993) is the point in which
Ciudad Juárez’s commercial space within a quarter mile of the border surpasses that of
El Paso.
Generally, as the policies continued to move from promotional to prohibitive, the
ratio of developed land in Juárez to El Paso increased while the ratio of agricultural land
in Juárez to El Paso decreased. Ciudad Juárez saw the immigration border fortify but
the trade border open. They saw an opportunity to capitalize on the labor they could
offer United States firms, especially with the lowered trade tariffs due to NAFTA.
Circulation from Mexico to the United States had become more difficult but circulation
ENTRIKIN
36
from the United States to Mexico had not been halted, which is evidenced by the
continued growth of commercial space in proximity to the border on the Juárez side.
It is not until 2005 when Mexico begins to enact prohibitive policies that their
commercial space falls in line with that on the El Paso side of the border. It seems when
both countries hold the same perspective of the border (that it is dangerous and
therefore must be secured and lengths must taken to discourage illegal crossings) that
the land use on either side begin to act similarly. It should also be noted that Mexico’s
War on Drugs brought a significant amount of violence to Ciudad Juárez due to clashes
between the Mexican government and drug cartels in the area.
The current state of these two cities shows how these trends have manifested
themselves at the ground level. Most of the built environment immediately following
entry into the United States through one of the border crossing stations in El Paso is
made up of abandoned buildings or shops with boarded up windows, followed by a slew
of predatory loan servicers and plasma donation centers. Upon entry into Ciudad
Juárez, there are dozens dental offices scattered amongst the retail stores. It is
impossible to ignore the ever present force of capitalism amongst these two cities.
Rather than thriving off of what they can sell to the residents within their own city, they
thrive off of the deals they are able to provide to those across the border.
These findings further confirm that land use designations, as discussed in the
literature review, are not unbiased from motivations of control or money. However, the
manipulating force that decides how one gains control or money in a border city, is the
ENTRIKIN
37
federal government through international policy. The federal immigration policies affect
the market and demand for certain goods or services by controlling the ability and
desire to cross the border. This is shown specifically in the changes in commercial
space within close proximity of border crossing stations which are the spaces that
undergo the highest frequency of transfer between and across these societies of
control. The change in federal policy is therefore congruent with the change in economic
relationships between countries. When federal immigration policy plays such a key role
in the economic relationships of border cities, and the economic relationship is a driver
in land use decisions, local land use in border cities becomes the manifestation of
federal international policy.
Returning to the concepts introduced in the literature review, Foucault’s
governmentality and Deleuze’s boundaries of enclosure appear repeatedly in the
findings of this research. While one country does not have explicit control over the
neighboring country, they are still able to assert their control through exclusion and
access. Because land use decisions near the border are so based in the economic ties
to those on the other side of the border, the policies implemented on one side provoke a
reaction on the other. With the passing of two prohibitive policies in the United States at
the same time as NAFTA, the people of Mexico were invited right up to the border but
prohibited from crossing it. Because of the implementation of this mechanism of control,
the society on the opposite side of the enclosure is able to capitalize on the tool of
control that is enacted in order to exclude them. Thus, leading to the opening of
ENTRIKIN
38
Maquiladoras and the destruction of agricultural land to make space for development
right up to the border.
So much of commerce on either side of the border depends on how easy it is to
cross it as well as the outlook on the border at that time. Fortifying that border would
essentially lose the economic relationship of half of the city, as it is essentially one city
split in half. Juárez has grown because of the ability to sell goods across the border and
sell goods to people who cross the border. That is also why Juárez has grown in the
direction of the border, eating up agricultural land rather than expanding outward like El
Paso. While El Paso’s economy is not tied as closely to the border zone as Ciudad
Juárez, their economic growth and expansion of development is just as dependent on
being a border city. While El Paso’s sprawl is outward rather than toward the border, it
has also grown massively. The Maquiladoras in Mexico serve firms on the Texas side of
the border, so El Paso’s economy is still just as dependent on the border as Ciudad
Juárez’ is.
In present day, there are numerous policy proposals in the United States at the
federal level that are incredibly unstable and further threaten the openness of the border
with Mexico. While the pattern of development and the direction of development is
different on either side of the border, both sides benefit from their relationship to the city
on the other side. Therefore, destabilizing that border would threaten that benefit on
both sides.
The control and management of land within these cities is central to the role of
the planner. Land use is the tool in which planners have to designate and, thus,
ENTRIKIN
39
inherently control. It is imperative that the use of this powerful tool is examined in
relation to the massive enclosure that is the border, since land use is an enclosure
within itself. While land use decisions in border cities are definitely influenced by the
decision made at the federal level regarding immigration and trade, they are heavily
(and perhaps more) influenced by what decisions are being made on the other side of
the border. Engaging in a relationship with the neighboring cities opposite of us along
the border will only help planners understand how border cities on the United States
side will be affected. Thus, perhaps the least productive thing the United States could
do would be to try and physically cut off these border cities and pretend that the
success of cities on the United States side are autonomous of their relationship with
Mexican cities. Economic isolationism would only lead to the destruction of societies on
both sides of the border. El Paso would not exist without Ciudad Juárez and Ciudad
Juárez would not exist without El Paso. As long at the border is open to circulation, the
two will always be inevitably intertwined economically, socially and culturally.
LIMITATIONS & SUGGESTIONS FOR FURTHER RESEARCH:
In addition to the limitations addressed earlier in regard to the use of satellite
imagery, there are other areas that could be further explored. First, the parallelism of
federal policy and the change commercial space is illuminating, yet the scope of this
research cannot provide answers to exactly what is happening or why it is happening.
This calls for further research in these specific areas. Additional research that could aid
in expanding this study includes replicating the analysis in other border cities such as
ENTRIKIN
40
San Diego and Tijuana as well as small cities such as Laredo and Nuevo Laredo or
Matamoros and Brownsville. A comparative study would shed light on whether the
trends found in El Paso and Ciudad Juárez are site specific or if other cities have had
similar growth patterns. Expanding the analysis of commercialized space to include a
larger area of the city and adding additional analysis looking at other types of land use
such as industrial space would also be a beneficial addition to this research. Further,
this study includes very little on-the-ground research. In order to gain a more in depth
understanding of these trends and the conditions in El Paso and Ciudad Juárez, the
incorporation of semi-structured interviews as well as a comprehensive survey of the
urban landscape would be beneficial.
ENTRIKIN
41
VI: BIBLIOGRAPHY
THEORETICAL FRAMEWORK:
Deleuze, G. (1992). Postscript on the Societies of Control. October, 59 , 3-7. Retrieved from http://www.jstor.org/stable/778828
Elden, Stuart. 2007. “Governmentality, Calculation, Territory”. Environment and planning. D, Society & Space. Volume 25, Issue 3, pp 562-580. Retrieved from: https://journals-sagepub-com.ezproxy.cul.columbia.edu/doi/10.1068/d428t
“...”. 2010. “Land, terrain, territory”. Progress in Human Geography. Volume 34, Issue 6, pp 799 - 817. Retrieved from: https://search-proquest-com.ezproxy.cul.columbia.edu/docview/817318848?accountid=10226&pq-origsite=summon
“...”. 2013. “Secure the Volume: Vertical geopolitics and the depth of power”. Political Geography. Volume 34, pp 35-51. Retrieved from: https://www-sciencedirect-com.ezproxy.cul.columbia.edu/science/article/pii/S0962629812001655
Foucault, Michel. 1997 “Security, Territory, and Population”Michel Foucault, Ethics: Subjectivity and Truth, ed. by Paul Rabinow, New York: The New Press 1997.
“...”. 1997 ‘The Birth of Biopolitics’, in: Michel Foucault, Ethics: Subjectivity and Truth, ed. by Paul Rabinow, New York: The New Press 1997.
Fuentes, César M. 2006. “Globalization and the Transborder Metropolis: El Paso-Ciudad Juárez”. El Colegio de la Frontera Norte, Ciudad Juárez, Chihuahua. Retrieved from: http://citeseerx.ist.psu.edu/viewdoc/download?doi=10.1.1.557.9494&rep=rep1&type=pdf
Li, Tania Murray. 2007. “Governmentality”. Anthropologica, Volume 49, No. 2, pp 275-281. Retrieved from: http://www.jstor.org/stable/25605363
ENTRIKIN
42
BACKGROUND: Borunda, Daniel. 2018. “Murders in Mexico Border City of Juárez Continue to Rise as Deaths Top 160 in June Along”. El Paso Times. Retrieved from: www.elpasotimes.com/story/news/local/juarez/2018/06/29/juarez-mexico-border-city-murders-rise-violent-crime-june-2018/743653002/
Chishti, Muzaffar, Meissner, Doris and Bergeron, Claire. 2011. “At Its 25th Anniversary, IRCA’s Legacy Lives On”. Migration Policy Institute. Retrieved from: https://www.migrationpolicy.org/article/its-25th-anniversary-ircas-legacy-lives Doyle, Charles. 1996. “Antiterrorism and Effective Death Penalty Act of 1996: A Summary”. Library of Congress. Congressional Research Service. Retrieved from: https://www.hsdl.org/?abstract&did=14646 Herzog, Lawrence A. 1991. Cross-national Urban Structure in the Era of Global Cities: The US-Mexico Transfrontier Metropolis. Journal of Urban Studies, pp 519-533. Retrieved from: http://www.jstor.org/stable/43195797 “...”. 1991. “International Boundary Cities: The Debate on Transfrontier Planning in Two Border Regions”. Retrieved from: https://heinonline.org/HOL/LandingPage?handle=hein.journals/narj31&div=30&id=&page= Illegal Immigration Reform and Immigration Responsibility Act. 2018. Cornell Law School. Retrieved from: www.law.cornell.edu/wex/illegal_immigration_reform_and_immigration_responsibility_act Lambin, Eric F. December 2001. “The Causes of Land-Use and Land-Cover Change: moving beyond the myths”. Global Environmental Change, Volume 11, Issue 4, pp 261-269. Retrieved from: https://www.sciencedirect.com/science/article/abs/pii/S0959378001000073 Leiden, Warren R. and Neal, David L.. 1990. “Highlights of the U.S. Immigration Act of 1990”. Fordham International Law Journal, Volume 14, Issue 1, Article 14, pp 328-339. Retrieved from: https://ir.lawnet.fordham.edu/cgi/viewcontent.cgi?referer=&httpsredir=1&article=1270&context=ilj
ENTRIKIN
43
National Archives Foundation. 2019. “Refugee Act of 1980” Retrieved from: www.archivesfoundation.org/documents/refugee-act-1980/ Nieves, Rosalina. 2017. “The Places Where Thousands Cross the US-Mexico Border on Foot Each Day”. CNN. Retrieved from: www.cnn.com/2017/05/31/us/us-mexico-pedestrian-bridges/index.html
Office of the U.S. Trade Representative. 2019. “North American Free Trade Agreement (NAFTA)”. Retrieved from: https://ustr.gov/trade-agreements/free-trade-agreements/north-american-free-trade-agreement-nafta Peluso, Nancy Lee and Lund, Christian. 14 September 2011. “New Frontiers of Land Control”. The Journal of Peasant Studies, Volume 38, Issue 4, pp 667-681. Retrieved from: https://www.tandfonline.com/doi/full/10.1080/03066150.2011.607692?scroll=top&needAccess=true Buursink, Jan. May 2001. “The Binational Reality of Border-Crossing Cities”. GeoJournal, Volume 54, Issue 1, pp 7-19. Retrieved from: https://link.springer.com/article/10.1023/A:1021180329607 Antiterrorism and Effective Death Penalty Act of 1996, 104-132 USC § 301-330. Retrieved from: https://www.govinfo.gov/content/pkg/PLAW-104publ132/html/PLAW-104publ132.htm Rawlins, A. 2011. “Mexico’s Drug War”. The Council on Foreign Relations. Retrieved from: https://www.ftsd.org/cms/lib/MT01001165/Centricity/Domain/159/Mexican%20drug%20war%20-backgrounder.docx “Real ID”. 2018. Department of Homeland Security. Retrieved from: www.dhs.gov/real-id Refugee Act of 1980, 96-212 USC § 643-17. Retrieved from: https://www.archivesfoundation.org/documents/refugee-act-1980/
ENTRIKIN
44
Rodriguez, Marisol and Rivero, Hector. 2011. “ProNaF, Ciudad Juárez: Planning and urban transformation”. Ciudad Juárez Autonomous University. Retrieved from: https://www.journalagent.com/itujfa/pdfs/ITUJFA-55823-DOSSIER_ARTICLES-RODRIGUEZ.pdf Schechter, Cheryl and Brill, David Jr. 1992. “Maquiladoras: Will the Program Continue?” Retrieved from: https://heinonline.org/HOL/LandingPage?handle=hein.journals/stmlj23&div=32&id=&page= Sloan, J. and West, J. 1977. “The Role of Informal Policy Making in U.S.- Mexico Border Cities”. Social Science Quarterly, 58, pp 270-282. Retrieved from http://www.jstor.org/stable/42859798 Texas Department of Transportation. 31 October 2013. El Paso/Santa Teresa Chihuahua Border Master Plan. “Ch. 3. Demographic, Socio Economic, and Land Use Profile”. US Department of Transportation. Pp. 1-45. Retrieved from: https://www.fhwa.dot.gov/planning/border_planning/us_mexico/accomplishments/master_plans/el_paso_border_master_plan/elp_ch3.pdf US Citizenship and Immigration Services. 2016. “Immigration Reform and Control Act of 1986”. Retrieved from: https://www.uscis.gov/tools/glossary/immigration-reform-and-control-act-1986-irca U.S. Customs and Border Protection. 2018. “Border Patrol History”. U.S. Department of Homeland Security. Retrieved from: https://www.cbp.gov/border-security/along-us-borders/history DATASETS: Bureau of Transportation Statistics. Border Crossing/Entry Data. Monthly Statistics, 1996 - 2018. United States Department of Transportation. Retrieved from: https://www.bts.gov/content/border-crossingentry-data CBP Enforcement Statistics FY2018. Total CBP Enforcement Actions, October 1, 2017 - August 31, 2018. US Customs and Border Protection. Retrieved from: https://www.cbp.gov/newsroom/stats/cbp-enforcement-statistics
ENTRIKIN
45
Center for International Earth Science Information Network - CIESIN. 1994. “Georeferenced Population Datasets of Mexico (GEO-MEX): Urban Place Time-Series Population of Mexico”. Palisades, NY: NASA Socioeconomic Data and Applications Center (SEDAC). http://dx.doi.org/10.7927/H4S46PV7 . Infogroup, Inc. 2012. Hershey Company. ReferenceUSA database. Retrieved from: http://www.referenceusa.com.ezproxy.cul.columbia.edu/Home/Home United States Geological Survey. 1978 - 2018. Earth Explorer. Retrieved from: https://earthexplorer.usgs.gov/ University of Texas, El Paso: Center for Interdisciplinary Health Research and Evaluation. 2010. Demographic Data Juárez City and County. Retrieved from: https://www.utep.edu/chs/cihre/demographics/juarez-city-and-county.html
ENTRIKIN
46
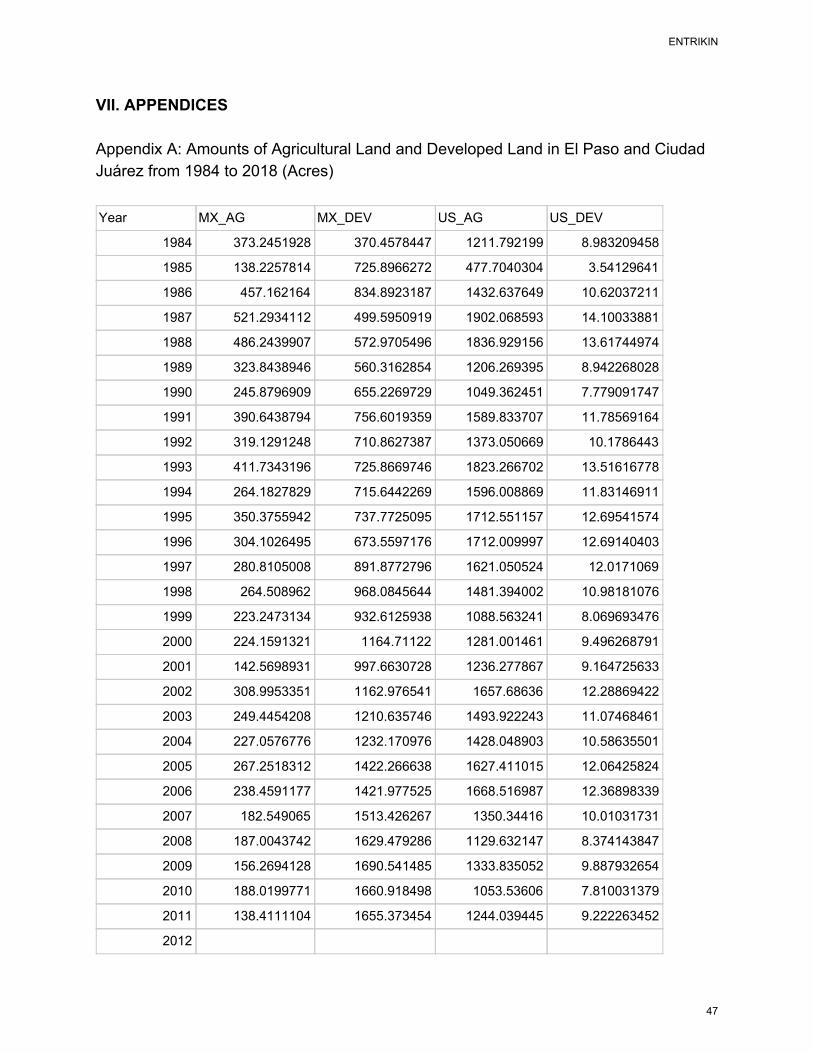
VII. APPENDICES
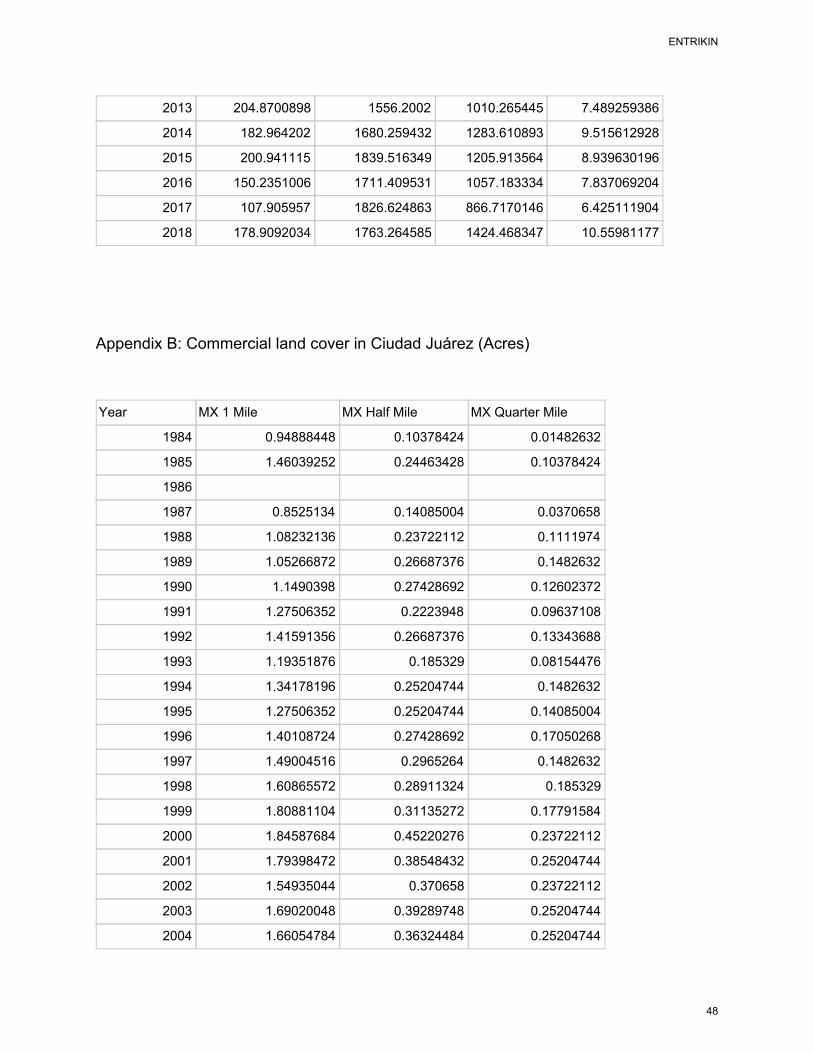
Appendix A: Amounts of Agricultural Land and Developed Land in El Paso and Ciudad Juárez from 1984 to 2018 (Acres)
Year MX_AG MX_DEV US_AG US_DEV
1984 373.2451928 370.4578447 1211.792199 8.983209458
1985 138.2257814 725.8966272 477.7040304 3.54129641
1986 457.162164 834.8923187 1432.637649 10.62037211
1987 521.2934112 499.5950919 1902.068593 14.10033881
1988 486.2439907 572.9705496 1836.929156 13.61744974
1989 323.8438946 560.3162854 1206.269395 8.942268028
1990 245.8796909 655.2269729 1049.362451 7.779091747
1991 390.6438794 756.6019359 1589.833707 11.78569164
1992 319.1291248 710.8627387 1373.050669 10.1786443
1993 411.7343196 725.8669746 1823.266702 13.51616778
1994 264.1827829 715.6442269 1596.008869 11.83146911
1995 350.3755942 737.7725095 1712.551157 12.69541574
1996 304.1026495 673.5597176 1712.009997 12.69140403
1997 280.8105008 891.8772796 1621.050524 12.0171069
1998 264.508962 968.0845644 1481.394002 10.98181076
1999 223.2473134 932.6125938 1088.563241 8.069693476
2000 224.1591321 1164.71122 1281.001461 9.496268791
2001 142.5698931 997.6630728 1236.277867 9.164725633
2002 308.9953351 1162.976541 1657.68636 12.28869422
2003 249.4454208 1210.635746 1493.922243 11.07468461
2004 227.0576776 1232.170976 1428.048903 10.58635501
2005 267.2518312 1422.266638 1627.411015 12.06425824
2006 238.4591177 1421.977525 1668.516987 12.36898339
2007 182.549065 1513.426267 1350.34416 10.01031731
2008 187.0043742 1629.479286 1129.632147 8.374143847
2009 156.2694128 1690.541485 1333.835052 9.887932654
2010 188.0199771 1660.918498 1053.53606 7.810031379
2011 138.4111104 1655.373454 1244.039445 9.222263452
2012
ENTRIKIN
47
2013 204.8700898 1556.2002 1010.265445 7.489259386
2014 182.964202 1680.259432 1283.610893 9.515612928
2015 200.941115 1839.516349 1205.913564 8.939630196
2016 150.2351006 1711.409531 1057.183334 7.837069204
2017 107.905957 1826.624863 866.7170146 6.425111904
2018 178.9092034 1763.264585 1424.468347 10.55981177
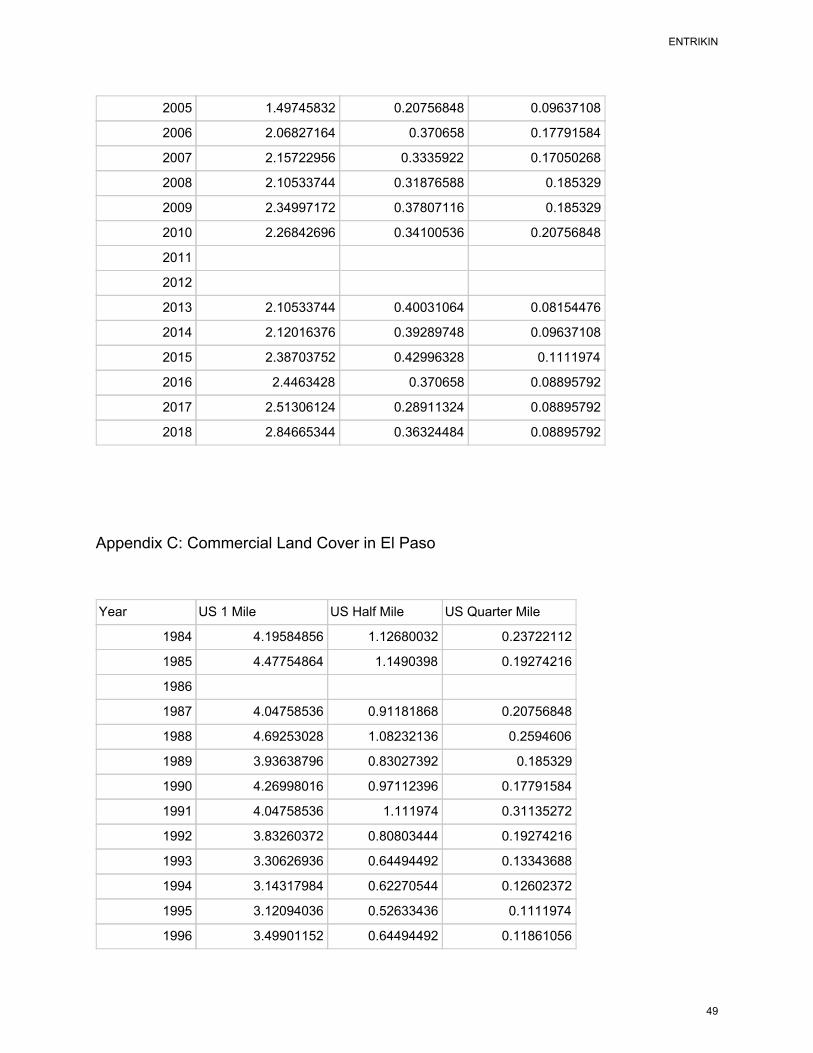
Appendix B: Commercial land cover in Ciudad Juárez (Acres) Year MX 1 Mile MX Half Mile MX Quarter Mile
1984 0.94888448 0.10378424 0.01482632
1985 1.46039252 0.24463428 0.10378424
1986
1987 0.8525134 0.14085004 0.0370658
1988 1.08232136 0.23722112 0.1111974
1989 1.05266872 0.26687376 0.1482632
1990 1.1490398 0.27428692 0.12602372
1991 1.27506352 0.2223948 0.09637108
1992 1.41591356 0.26687376 0.13343688
1993 1.19351876 0.185329 0.08154476
1994 1.34178196 0.25204744 0.1482632
1995 1.27506352 0.25204744 0.14085004
1996 1.40108724 0.27428692 0.17050268
1997 1.49004516 0.2965264 0.1482632
1998 1.60865572 0.28911324 0.185329
1999 1.80881104 0.31135272 0.17791584
2000 1.84587684 0.45220276 0.23722112
2001 1.79398472 0.38548432 0.25204744
2002 1.54935044 0.370658 0.23722112
2003 1.69020048 0.39289748 0.25204744
2004 1.66054784 0.36324484 0.25204744
ENTRIKIN
48
2005 1.49745832 0.20756848 0.09637108
2006 2.06827164 0.370658 0.17791584
2007 2.15722956 0.3335922 0.17050268
2008 2.10533744 0.31876588 0.185329
2009 2.34997172 0.37807116 0.185329
2010 2.26842696 0.34100536 0.20756848
2011
2012
2013 2.10533744 0.40031064 0.08154476
2014 2.12016376 0.39289748 0.09637108
2015 2.38703752 0.42996328 0.1111974
2016 2.4463428 0.370658 0.08895792
2017 2.51306124 0.28911324 0.08895792
2018 2.84665344 0.36324484 0.08895792
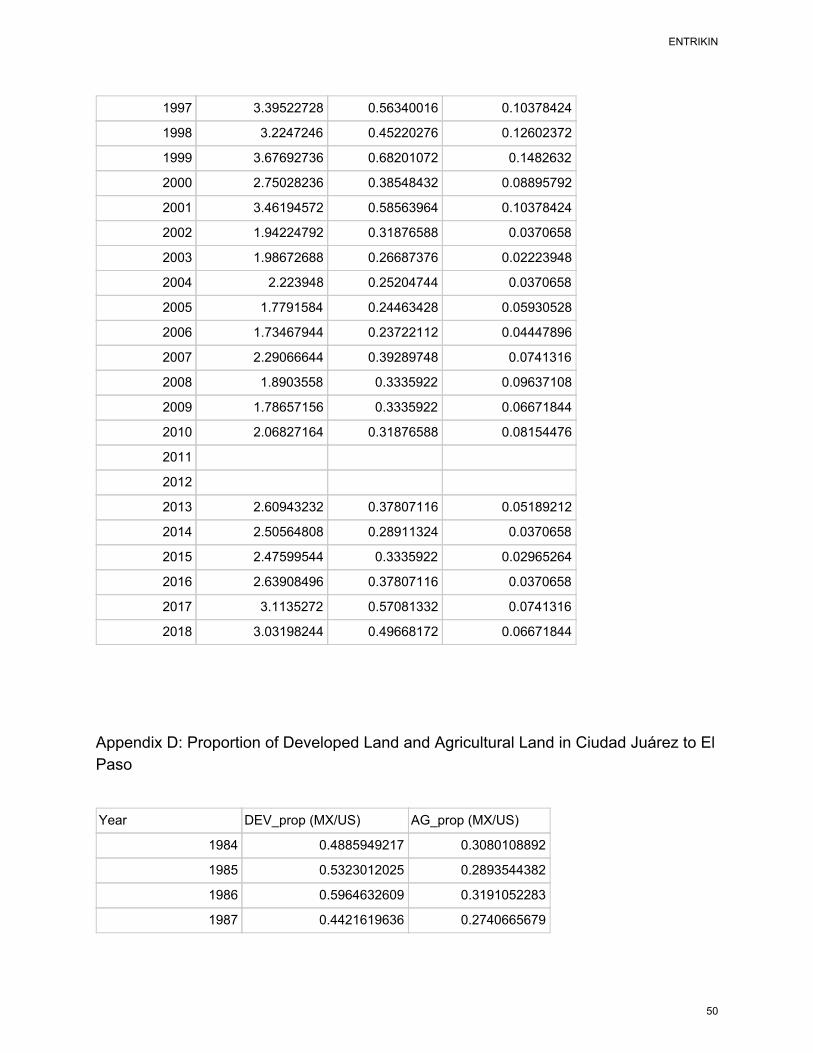
Appendix C: Commercial Land Cover in El Paso Year US 1 Mile US Half Mile US Quarter Mile
1984 4.19584856 1.12680032 0.23722112
1985 4.47754864 1.1490398 0.19274216
1986
1987 4.04758536 0.91181868 0.20756848
1988 4.69253028 1.08232136 0.2594606
1989 3.93638796 0.83027392 0.185329
1990 4.26998016 0.97112396 0.17791584
1991 4.04758536 1.111974 0.31135272
1992 3.83260372 0.80803444 0.19274216
1993 3.30626936 0.64494492 0.13343688
1994 3.14317984 0.62270544 0.12602372
1995 3.12094036 0.52633436 0.1111974
1996 3.49901152 0.64494492 0.11861056
ENTRIKIN
49
1997 3.39522728 0.56340016 0.10378424
1998 3.2247246 0.45220276 0.12602372
1999 3.67692736 0.68201072 0.1482632
2000 2.75028236 0.38548432 0.08895792
2001 3.46194572 0.58563964 0.10378424
2002 1.94224792 0.31876588 0.0370658
2003 1.98672688 0.26687376 0.02223948
2004 2.223948 0.25204744 0.0370658
2005 1.7791584 0.24463428 0.05930528
2006 1.73467944 0.23722112 0.04447896
2007 2.29066644 0.39289748 0.0741316
2008 1.8903558 0.3335922 0.09637108
2009 1.78657156 0.3335922 0.06671844
2010 2.06827164 0.31876588 0.08154476
2011
2012
2013 2.60943232 0.37807116 0.05189212
2014 2.50564808 0.28911324 0.0370658
2015 2.47599544 0.3335922 0.02965264
2016 2.63908496 0.37807116 0.0370658
2017 3.1135272 0.57081332 0.0741316
2018 3.03198244 0.49668172 0.06671844
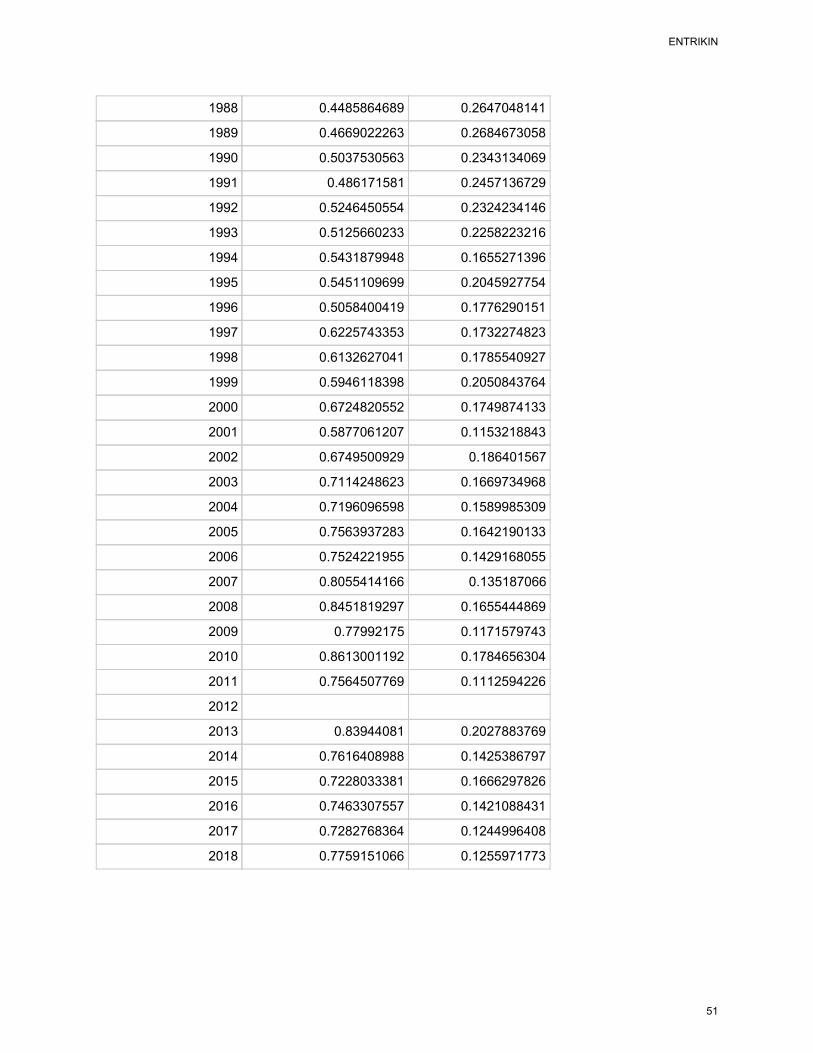
Appendix D: Proportion of Developed Land and Agricultural Land in Ciudad Juárez to El Paso
Year DEV_prop (MX/US) AG_prop (MX/US)
1984 0.4885949217 0.3080108892
1985 0.5323012025 0.2893544382
1986 0.5964632609 0.3191052283
1987 0.4421619636 0.2740665679
ENTRIKIN
50
1988 0.4485864689 0.2647048141
1989 0.4669022263 0.2684673058
1990 0.5037530563 0.2343134069
1991 0.486171581 0.2457136729
1992 0.5246450554 0.2324234146
1993 0.5125660233 0.2258223216
1994 0.5431879948 0.1655271396
1995 0.5451109699 0.2045927754
1996 0.5058400419 0.1776290151
1997 0.6225743353 0.1732274823
1998 0.6132627041 0.1785540927
1999 0.5946118398 0.2050843764
2000 0.6724820552 0.1749874133
2001 0.5877061207 0.1153218843
2002 0.6749500929 0.186401567
2003 0.7114248623 0.1669734968
2004 0.7196096598 0.1589985309
2005 0.7563937283 0.1642190133
2006 0.7524221955 0.1429168055
2007 0.8055414166 0.135187066
2008 0.8451819297 0.1655444869
2009 0.77992175 0.1171579743
2010 0.8613001192 0.1784656304
2011 0.7564507769 0.1112594226
2012
2013 0.83944081 0.2027883769
2014 0.7616408988 0.1425386797
2015 0.7228033381 0.1666297826
2016 0.7463307557 0.1421088431
2017 0.7282768364 0.1244996408
2018 0.7759151066 0.1255971773
ENTRIKIN
51
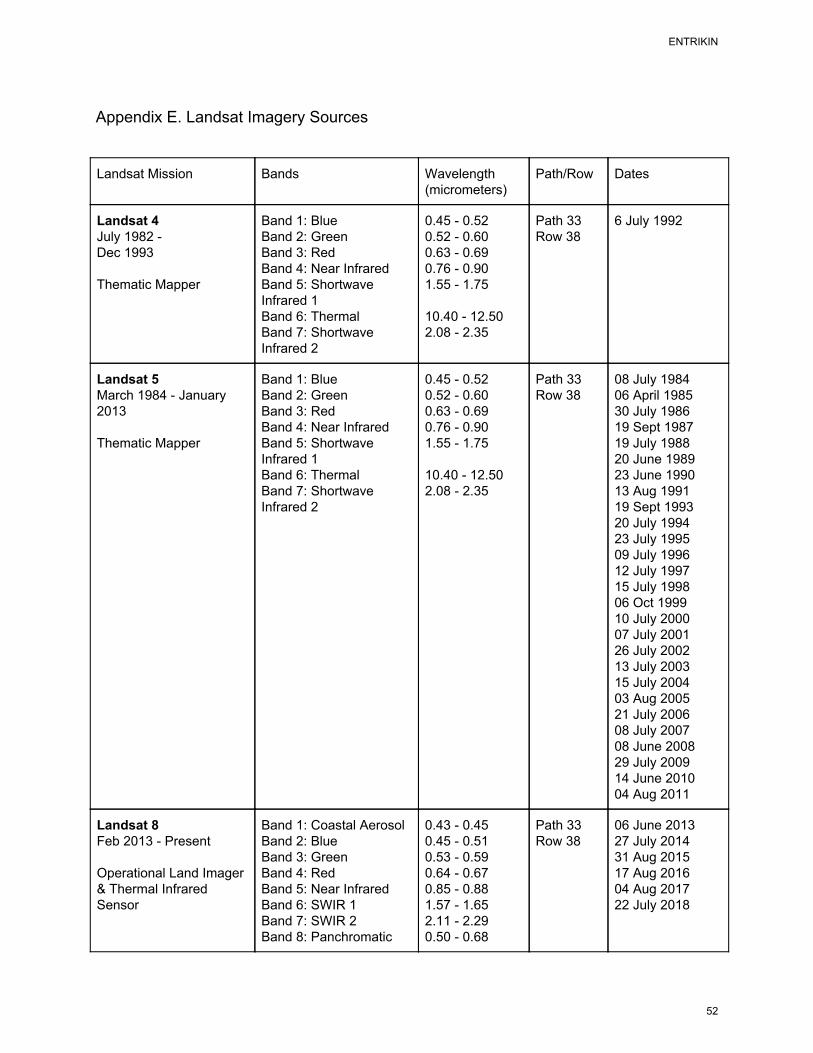
Appendix E. Landsat Imagery Sources
Landsat Mission Bands Wavelength (micrometers)
Path/Row Dates
Landsat 4 July 1982 - Dec 1993 Thematic Mapper
Band 1: Blue Band 2: Green Band 3: Red Band 4: Near Infrared Band 5: Shortwave Infrared 1 Band 6: Thermal Band 7: Shortwave Infrared 2
0.45 - 0.52 0.52 - 0.60 0.63 - 0.69 0.76 - 0.90 1.55 - 1.75 10.40 - 12.50 2.08 - 2.35
Path 33 Row 38
6 July 1992
Landsat 5 March 1984 - January 2013 Thematic Mapper
Band 1: Blue Band 2: Green Band 3: Red Band 4: Near Infrared Band 5: Shortwave Infrared 1 Band 6: Thermal Band 7: Shortwave Infrared 2
0.45 - 0.52 0.52 - 0.60 0.63 - 0.69 0.76 - 0.90 1.55 - 1.75 10.40 - 12.50 2.08 - 2.35
Path 33 Row 38
08 July 1984 06 April 1985 30 July 1986 19 Sept 1987 19 July 1988 20 June 1989 23 June 1990 13 Aug 1991 19 Sept 1993 20 July 1994 23 July 1995 09 July 1996 12 July 1997 15 July 1998 06 Oct 1999 10 July 2000 07 July 2001 26 July 2002 13 July 2003 15 July 2004 03 Aug 2005 21 July 2006 08 July 2007 08 June 2008 29 July 2009 14 June 2010 04 Aug 2011
Landsat 8 Feb 2013 - Present Operational Land Imager & Thermal Infrared Sensor
Band 1: Coastal Aerosol Band 2: Blue Band 3: Green Band 4: Red Band 5: Near Infrared Band 6: SWIR 1 Band 7: SWIR 2 Band 8: Panchromatic
0.43 - 0.45 0.45 - 0.51 0.53 - 0.59 0.64 - 0.67 0.85 - 0.88 1.57 - 1.65 2.11 - 2.29 0.50 - 0.68
Path 33 Row 38
06 June 2013 27 July 2014 31 Aug 2015 17 Aug 2016 04 Aug 2017 22 July 2018
ENTRIKIN
52
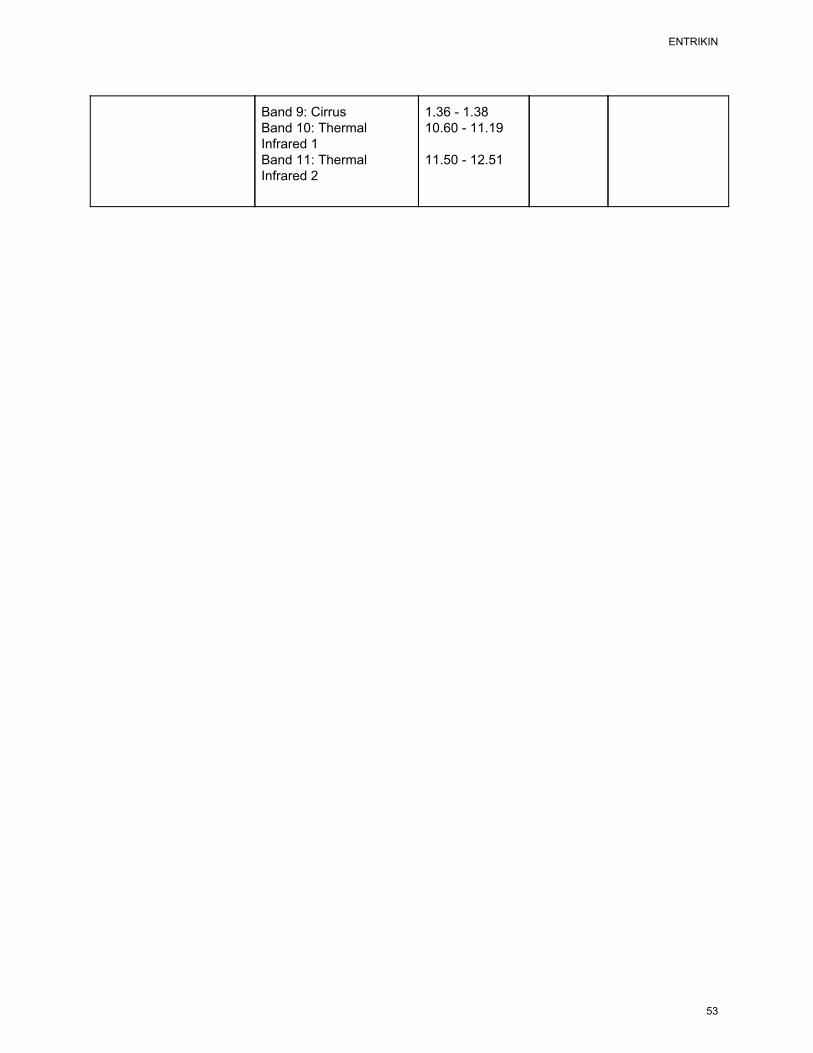
Band 9: Cirrus Band 10: Thermal Infrared 1 Band 11: Thermal Infrared 2
1.36 - 1.38 10.60 - 11.19 11.50 - 12.51
ENTRIKIN
53