Embed Size (px)
Citation preview
FIXED INCOME | EMERGING MARKETS DEBT TEAM | INVESTMENT INSIGHT | 2017
Border Adjustment Tax Analysis and Implications for Emerging Markets
AUTHORS
JENS NYSTEDT, PH.D.Managing Director
ARMANDO ROSSELLI, CFA®Vice President
The exact contours of a potential U.S. border adjustment tax (BAT) are still unclear and we believe the probability of the tax being passed through the Senate is currently in the 10-30% range. Nevertheless, were a 20% BAT imposed, U.S. inflation would likely increase by 0.5-1% in the short term, with an uncertain impact on U.S. growth. Within emerging markets (EM), a stronger U.S. dollar (USD) may offset some of the tariff impact on EM exports, but a stronger USD represents a headwind to global commodity prices and EM fundamentals. An analysis of EM exports to the U.S. and their price elasticity suggests that Mexico and Malaysia are the two countries most likely to be impacted by a BAT. Interestingly, since President Trump’s election, the Mexican peso and the Malaysian ringgit have been the second and third worst performers among EM currencies, respectively, suggesting that these currencies have priced in a significant risk premium in the face of a potential surge in U.S. trade protectionism. Other Asian currencies that would be expected to experience a significant impact from a BAT are back to pre-election levels, or even stronger, and look the most vulnerable to a strong USD rally.
The actual contours of a U.S. BAT proposal are still not clear, nor do we know if or when it will be approved. At this stage, the BAT proposal by the House Republican leadership suggests a 20% tax rate and it would mean that U.S. companies would not be able to deduct import costs nor include export revenues when calculating taxable income. Such a BAT would be economically equivalent to a value-added tax (VAT), but details matter, particularly with respect to World Trade Organization (WTO) compliance. Moreover, it seems likely that the proposed BAT would provide special exemptions from the tax for certain industries, such as the refinery industry importing oil. The more
KEY HIGHLIGHTS
We analyze the potential trade channel impact of a U.S. BAT system on Emerging Markets. The impact would depend on the extent of currency adjustment, net foreign assets, the amount of trade conducted with the U.S. and on the U.S. consumer demand price elasticity to the goods basket imported from a given emerging market.
Assuming no currency adjustment, we identify relative winners and losers in emerging markets based on two dimensions: exposure to U.S. market and demand elasticity.
We find that the two countries most negatively exposed to a BAT are Mexico and Malaysia. Countries least affected would be Nigeria, Russia, Turkey, Colombia, and Brazil.
The impact on China would come mostly from the strengthening of the USD and that it could trigger renewed pressures for a sharp adjustment in the CNY.
2
INVESTMENT INSIGHT
MORGAN STANLEY INVESTMENT MANAGEMENT | FIXED INCOME
the appreciation of the USD, such as Mexico. There is also a chance that a spike in policy uncertainty could be a drag on U.S. growth.
WHAT IS THE IMPACT ON EM?
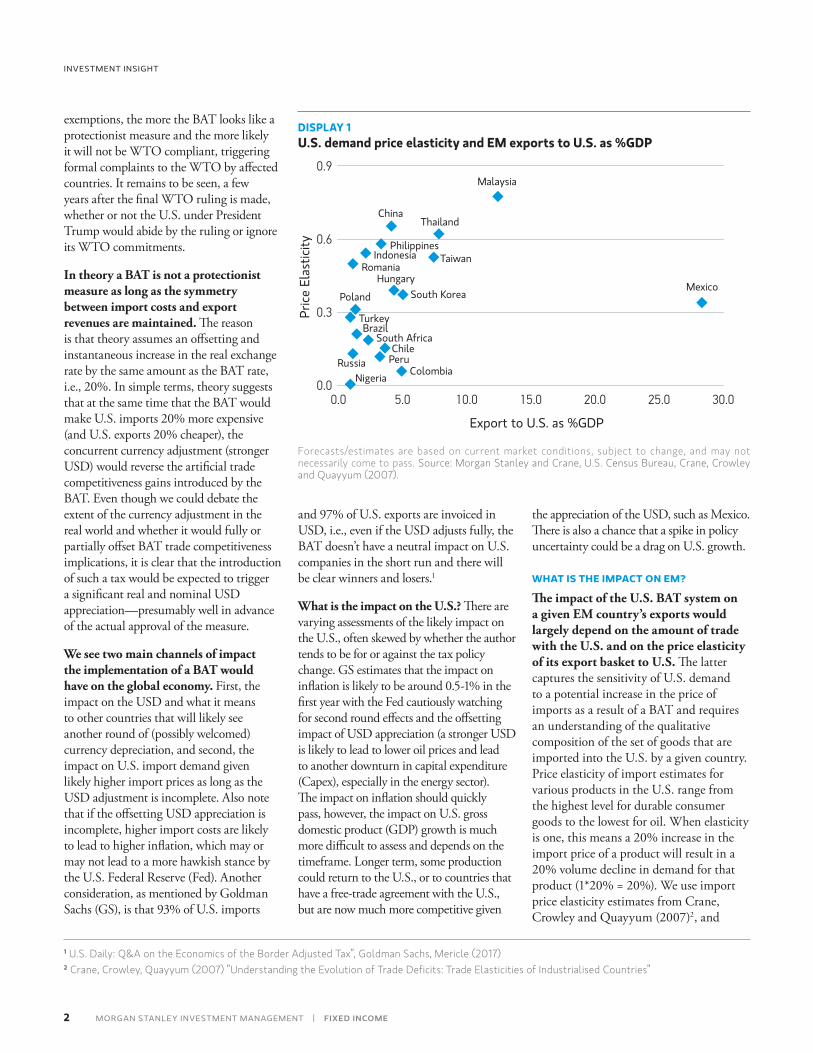
The impact of the U.S. BAT system on a given EM country’s exports would largely depend on the amount of trade with the U.S. and on the price elasticity of its export basket to U.S. The latter captures the sensitivity of U.S. demand to a potential increase in the price of imports as a result of a BAT and requires an understanding of the qualitative composition of the set of goods that are imported into the U.S. by a given country. Price elasticity of import estimates for various products in the U.S. range from the highest level for durable consumer goods to the lowest for oil. When elasticity is one, this means a 20% increase in the import price of a product will result in a 20% volume decline in demand for that product (1*20% = 20%). We use import price elasticity estimates from Crane, Crowley and Quayyum (2007)2, and
exemptions, the more the BAT looks like a protectionist measure and the more likely it will not be WTO compliant, triggering formal complaints to the WTO by affected countries. It remains to be seen, a few years after the final WTO ruling is made, whether or not the U.S. under President Trump would abide by the ruling or ignore its WTO commitments.
In theory a BAT is not a protectionist measure as long as the symmetry between import costs and export revenues are maintained. The reason is that theory assumes an offsetting and instantaneous increase in the real exchange rate by the same amount as the BAT rate, i.e., 20%. In simple terms, theory suggests that at the same time that the BAT would make U.S. imports 20% more expensive (and U.S. exports 20% cheaper), the concurrent currency adjustment (stronger USD) would reverse the artificial trade competitiveness gains introduced by the BAT. Even though we could debate the extent of the currency adjustment in the real world and whether it would fully or partially offset BAT trade competitiveness implications, it is clear that the introduction of such a tax would be expected to trigger a significant real and nominal USD appreciation—presumably well in advance of the actual approval of the measure.
We see two main channels of impact the implementation of a BAT would have on the global economy. First, the impact on the USD and what it means to other countries that will likely see another round of (possibly welcomed) currency depreciation, and second, the impact on U.S. import demand given likely higher import prices as long as the USD adjustment is incomplete. Also note that if the offsetting USD appreciation is incomplete, higher import costs are likely to lead to higher inflation, which may or may not lead to a more hawkish stance by the U.S. Federal Reserve (Fed). Another consideration, as mentioned by Goldman Sachs (GS), is that 93% of U.S. imports
and 97% of U.S. exports are invoiced in USD, i.e., even if the USD adjusts fully, the BAT doesn’t have a neutral impact on U.S. companies in the short run and there will be clear winners and losers.1
What is the impact on the U.S.? There are varying assessments of the likely impact on the U.S., often skewed by whether the author tends to be for or against the tax policy change. GS estimates that the impact on inflation is likely to be around 0.5-1% in the first year with the Fed cautiously watching for second round effects and the offsetting impact of USD appreciation (a stronger USD is likely to lead to lower oil prices and lead to another downturn in capital expenditure (Capex), especially in the energy sector). The impact on inflation should quickly pass, however, the impact on U.S. gross domestic product (GDP) growth is much more difficult to assess and depends on the timeframe. Longer term, some production could return to the U.S., or to countries that have a free-trade agreement with the U.S., but are now much more competitive given
DISPLAY 1U.S. demand price elasticity and EM exports to U.S. as %GDP
Brazil
Chile
Colombia
Hungary
Indonesia
China
0.0
South Korea
Malaysia
Mexico
Taiwan
South Africa
Russia
Romania
Poland
Philippines
Peru
Nigeria
Turkey
Thailand
Pric
e El
astic
ity
Export to U.S. as %GDP
0.3
0.9
0.6
0.0 5.0 20.010.0 15.0 25.0 30.0
Forecasts/estimates are based on current market conditions, subject to change, and may not necessarily come to pass. Source: Morgan Stanley and Crane, U.S. Census Bureau, Crane, Crowley and Quayyum (2007).
1 U.S. Daily: Q&A on the Economics of the Border Adjusted Tax”, Goldman Sachs, Mericle (2017)2 Crane, Crowley, Quayyum (2007) ”Understanding the Evolution of Trade Deficits: Trade Elasticities of Industrialised Countries”
3
BORDER ADJUSTMENT TAX ANALYSIS AND IMPLICATIONS FOR EMERGING MARKETS
FIXED INCOME | MORGAN STANLEY INVESTMENT MANAGEMENT
the qualitative composition of imports per country from U.S. Census Bureau. Display 1 provides a good snapshot of BAT sensitivity across emerging markets: The y-axis shows price elasticity and the x-axis shows country exports to the U.S. as percentage of GDP. The countries located in the northeast area of the quadrant are more vulnerable to a BAT introduction: their export baskets are more sensitive to price changes (y-axis) and rely more on the U.S. as market for their products (x-axis).
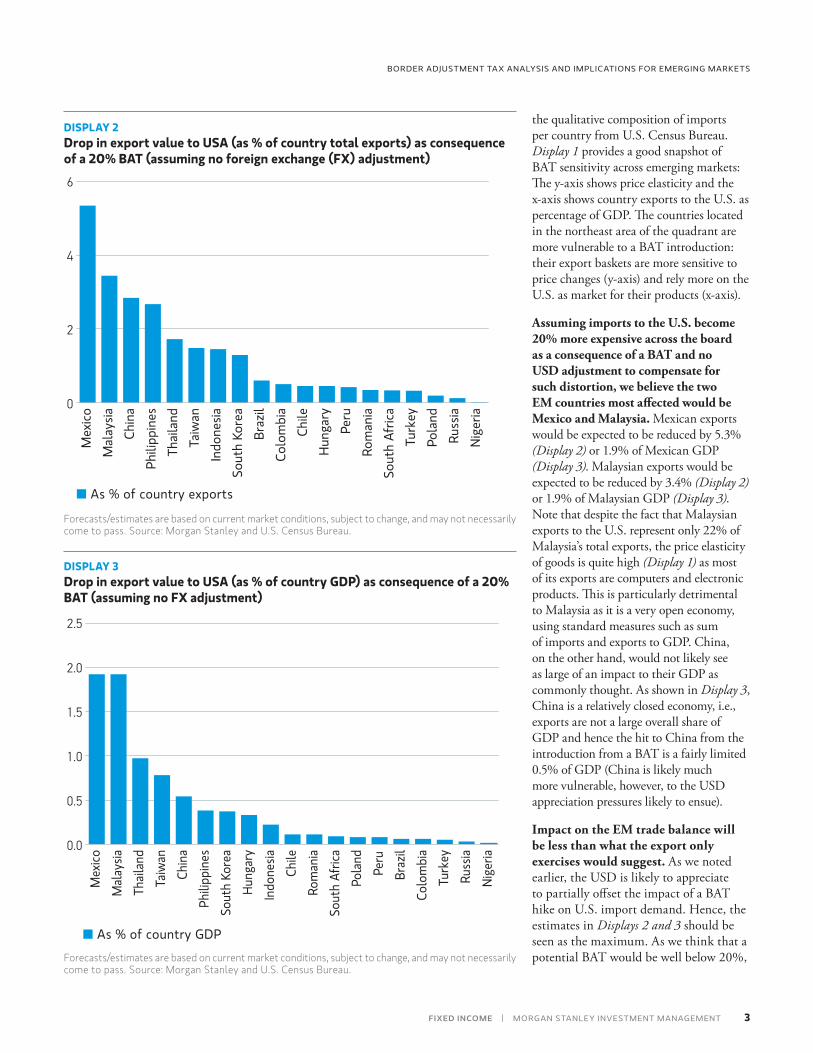
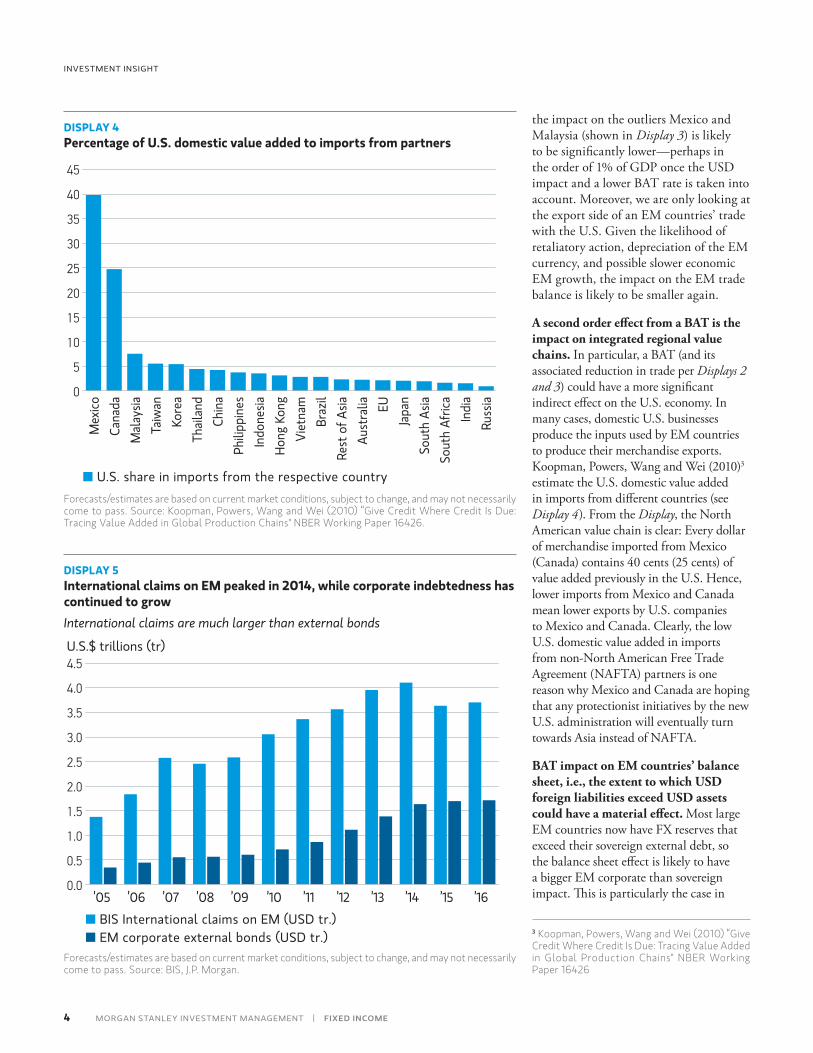
Assuming imports to the U.S. become 20% more expensive across the board as a consequence of a BAT and no USD adjustment to compensate for such distortion, we believe the two EM countries most affected would be Mexico and Malaysia. Mexican exports would be expected to be reduced by 5.3% (Display 2) or 1.9% of Mexican GDP (Display 3). Malaysian exports would be expected to be reduced by 3.4% (Display 2) or 1.9% of Malaysian GDP (Display 3). Note that despite the fact that Malaysian exports to the U.S. represent only 22% of Malaysia’s total exports, the price elasticity of goods is quite high (Display 1) as most of its exports are computers and electronic products. This is particularly detrimental to Malaysia as it is a very open economy, using standard measures such as sum of imports and exports to GDP. China, on the other hand, would not likely see as large of an impact to their GDP as commonly thought. As shown in Display 3, China is a relatively closed economy, i.e., exports are not a large overall share of GDP and hence the hit to China from the introduction from a BAT is a fairly limited 0.5% of GDP (China is likely much more vulnerable, however, to the USD appreciation pressures likely to ensue).
Impact on the EM trade balance will be less than what the export only exercises would suggest. As we noted earlier, the USD is likely to appreciate to partially offset the impact of a BAT hike on U.S. import demand. Hence, the estimates in Displays 2 and 3 should be seen as the maximum. As we think that a potential BAT would be well below 20%,
DISPLAY 2Drop in export value to USA (as % of country total exports) as consequence of a 20% BAT (assuming no foreign exchange (FX) adjustment)
Nig
eria
Russ
iaPo
land
Turk
eySo
uth
Afric
aRo
man
iaPe
ruH
unga
ryCh
ileCo
lom
bia
Braz
ilSo
uth
Kore
aIn
done
siaTa
iwan
Thai
land
Phili
ppin
esCh
ina
Mal
aysia
Mex
ico0
2
4
6
■ As % of country exports
Forecasts/estimates are based on current market conditions, subject to change, and may not necessarily come to pass. Source: Morgan Stanley and U.S. Census Bureau.
DISPLAY 3Drop in export value to USA (as % of country GDP) as consequence of a 20% BAT (assuming no FX adjustment)
0.0
0.5
1.0
2.5
Nige
riaRu
ssia
Turk
eyCo
lom
bia
Braz
ilPe
ruPo
land
Sout
h Af
rica
Rom
ania
Chile
Indo
nesia
Hung
ary
Sout
h Ko
rea
Phili
ppin
esCh
ina
Taiw
anTh
ailan
dM
alay
siaM
exico
1.5
2.0
■ As % of country GDP
Forecasts/estimates are based on current market conditions, subject to change, and may not necessarily come to pass. Source: Morgan Stanley and U.S. Census Bureau.
4
INVESTMENT INSIGHT
MORGAN STANLEY INVESTMENT MANAGEMENT | FIXED INCOME
the impact on the outliers Mexico and Malaysia (shown in Display 3) is likely to be significantly lower—perhaps in the order of 1% of GDP once the USD impact and a lower BAT rate is taken into account. Moreover, we are only looking at the export side of an EM countries’ trade with the U.S. Given the likelihood of retaliatory action, depreciation of the EM currency, and possible slower economic EM growth, the impact on the EM trade balance is likely to be smaller again.
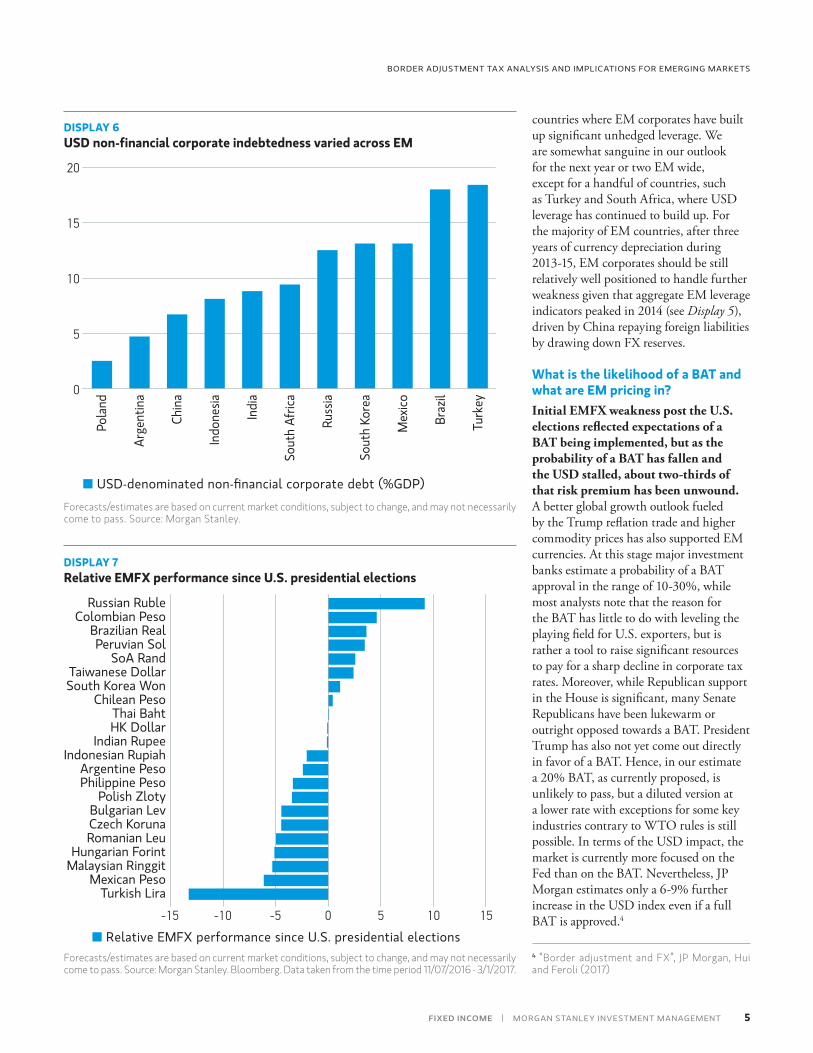
A second order effect from a BAT is the impact on integrated regional value chains. In particular, a BAT (and its associated reduction in trade per Displays 2 and 3) could have a more significant indirect effect on the U.S. economy. In many cases, domestic U.S. businesses produce the inputs used by EM countries to produce their merchandise exports. Koopman, Powers, Wang and Wei (2010)3 estimate the U.S. domestic value added in imports from different countries (see Display 4). From the Display, the North American value chain is clear: Every dollar of merchandise imported from Mexico (Canada) contains 40 cents (25 cents) of value added previously in the U.S. Hence, lower imports from Mexico and Canada mean lower exports by U.S. companies to Mexico and Canada. Clearly, the low U.S. domestic value added in imports from non-North American Free Trade Agreement (NAFTA) partners is one reason why Mexico and Canada are hoping that any protectionist initiatives by the new U.S. administration will eventually turn towards Asia instead of NAFTA.
BAT impact on EM countries’ balance sheet, i.e., the extent to which USD foreign liabilities exceed USD assets could have a material effect. Most large EM countries now have FX reserves that exceed their sovereign external debt, so the balance sheet effect is likely to have a bigger EM corporate than sovereign impact. This is particularly the case in
DISPLAY 4Percentage of U.S. domestic value added to imports from partners
0
5
10
45
Russ
iaIn
dia
Sout
h Af
rica
Sout
h As
iaJa
panEU
Aust
ralia
R est
of A
siaBr
azil
Viet
nam
Hong
Kon
gIn
done
siaPh
ilipp
ines
Chin
aTh
ailan
dKo
rea
Taiw
anM
alay
siaCa
nada
Mex
ico
40
35
30
25
20
15
■ U.S. share in imports from the respective country
Forecasts/estimates are based on current market conditions, subject to change, and may not necessarily come to pass. Source: Koopman, Powers, Wang and Wei (2010) “Give Credit Where Credit Is Due: Tracing Value Added in Global Production Chains" NBER Working Paper 16426.
3 Koopman, Powers, Wang and Wei (2010) “Give Credit Where Credit Is Due: Tracing Value Added in Global Production Chains" NBER Working Paper 16426
DISPLAY 5International claims on EM peaked in 2014, while corporate indebtedness has continued to growInternational claims are much larger than external bonds
0.0
0.5
1.0
4.5
4.0
3.5
3.0
2.5
2.0
1.5
’05 ’15’14’13’12’11’10’09’08’07’06 ’16 ■ BIS International claims on EM (USD tr.)
■ EM corporate external bonds (USD tr.)
U.S.$ trillions (tr)
Forecasts/estimates are based on current market conditions, subject to change, and may not necessarily come to pass. Source: BIS, J.P. Morgan.
5
BORDER ADJUSTMENT TAX ANALYSIS AND IMPLICATIONS FOR EMERGING MARKETS
FIXED INCOME | MORGAN STANLEY INVESTMENT MANAGEMENT
countries where EM corporates have built up significant unhedged leverage. We are somewhat sanguine in our outlook for the next year or two EM wide, except for a handful of countries, such as Turkey and South Africa, where USD leverage has continued to build up. For the majority of EM countries, after three years of currency depreciation during 2013-15, EM corporates should be still relatively well positioned to handle further weakness given that aggregate EM leverage indicators peaked in 2014 (see Display 5), driven by China repaying foreign liabilities by drawing down FX reserves.
What is the likelihood of a BAT and what are EM pricing in?Initial EMFX weakness post the U.S. elections reflected expectations of a BAT being implemented, but as the probability of a BAT has fallen and the USD stalled, about two-thirds of that risk premium has been unwound. A better global growth outlook fueled by the Trump reflation trade and higher commodity prices has also supported EM currencies. At this stage major investment banks estimate a probability of a BAT approval in the range of 10-30%, while most analysts note that the reason for the BAT has little to do with leveling the playing field for U.S. exporters, but is rather a tool to raise significant resources to pay for a sharp decline in corporate tax rates. Moreover, while Republican support in the House is significant, many Senate Republicans have been lukewarm or outright opposed towards a BAT. President Trump has also not yet come out directly in favor of a BAT. Hence, in our estimate a 20% BAT, as currently proposed, is unlikely to pass, but a diluted version at a lower rate with exceptions for some key industries contrary to WTO rules is still possible. In terms of the USD impact, the market is currently more focused on the Fed than on the BAT. Nevertheless, JP Morgan estimates only a 6-9% further increase in the USD index even if a full BAT is approved.4
DISPLAY 6USD non-financial corporate indebtedness varied across EM
0
5
10
20
15
Turk
ey
Braz
il
Mex
ico
Sout
h Ko
rea
Russ
ia
Sout
h Af
rica
Indi
a
Indo
nesia
Chin
a
Arge
ntin
a
Pola
nd
■ USD-denominated non-financial corporate debt (%GDP)
Forecasts/estimates are based on current market conditions, subject to change, and may not necessarily come to pass. Source: Morgan Stanley.
DISPLAY 7Relative EMFX performance since U.S. presidential elections
Turkish LiraMexican Peso
Malaysian RinggitHungarian Forint
Romanian LeuCzech KorunaBulgarian Lev
Polish ZlotyPhilippine PesoArgentine Peso
Indonesian RupiahIndian Rupee
HK DollarThai Baht
Chilean PesoSouth Korea WonTaiwanese Dollar
SoA RandPeruvian Sol
Brazilian RealColombian Peso
Russian Ruble
-15 -10 0-5 105 15
■ Relative EMFX performance since U.S. presidential electionsForecasts/estimates are based on current market conditions, subject to change, and may not necessarily come to pass. Source: Morgan Stanley. Bloomberg. Data taken from the time period 11/07/2016 - 3/1/2017.
4 “Border adjustment and FX”, JP Morgan, Hui and Feroli (2017)
6
INVESTMENT INSIGHT
MORGAN STANLEY INVESTMENT MANAGEMENT | FIXED INCOME
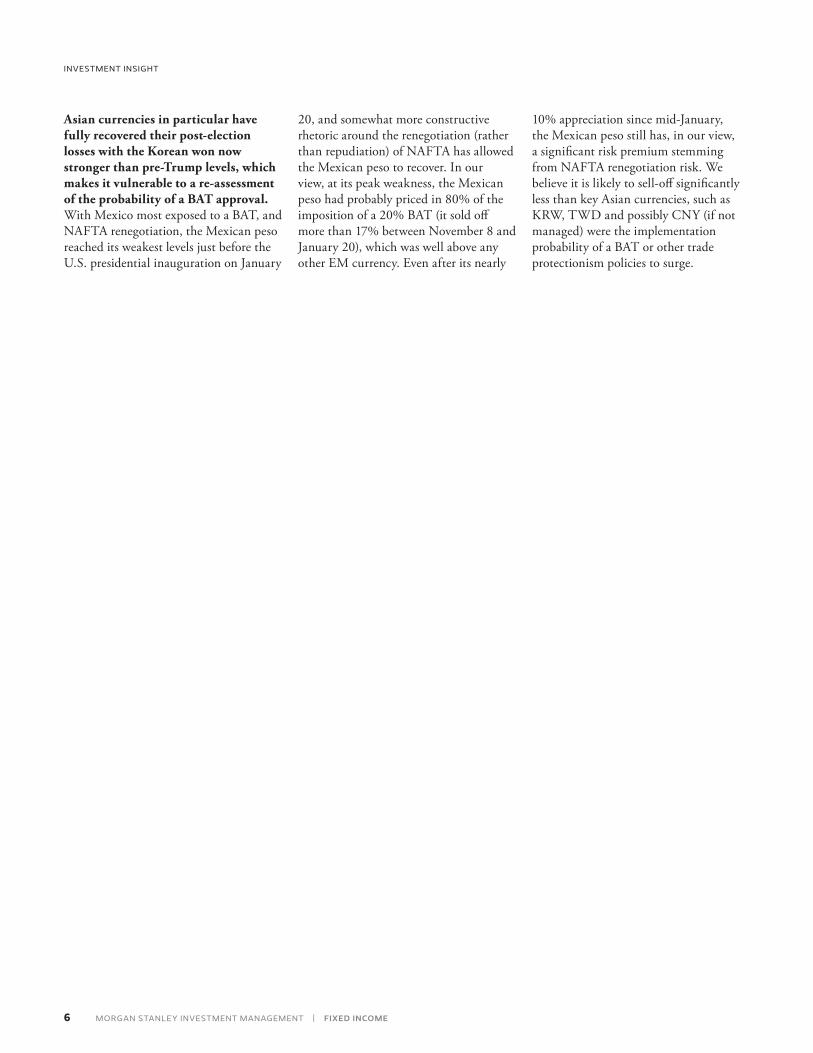
Asian currencies in particular have fully recovered their post-election losses with the Korean won now stronger than pre-Trump levels, which makes it vulnerable to a re-assessment of the probability of a BAT approval. With Mexico most exposed to a BAT, and NAFTA renegotiation, the Mexican peso reached its weakest levels just before the U.S. presidential inauguration on January
20, and somewhat more constructive rhetoric around the renegotiation (rather than repudiation) of NAFTA has allowed the Mexican peso to recover. In our view, at its peak weakness, the Mexican peso had probably priced in 80% of the imposition of a 20% BAT (it sold off more than 17% between November 8 and January 20), which was well above any other EM currency. Even after its nearly
10% appreciation since mid-January, the Mexican peso still has, in our view, a significant risk premium stemming from NAFTA renegotiation risk. We believe it is likely to sell-off significantly less than key Asian currencies, such as KRW, TWD and possibly CNY (if not managed) were the implementation probability of a BAT or other trade protectionism policies to surge.
7
BORDER ADJUSTMENT TAX ANALYSIS AND IMPLICATIONS FOR EMERGING MARKETS
FIXED INCOME | MORGAN STANLEY INVESTMENT MANAGEMENT
This material is for Professional Clients only, except in the U.S. where the material may be redistributed or used with the general public.The views and opinions are those of the authors as of the date presented and are subject to change at any time due to market or economic conditions and may not necessarily come to pass. Furthermore, the views will not be updated or otherwise revised to reflect information that subsequently becomes available or circumstances existing, or changes occurring, after the date of publication. The views expressed do not reflect the opinions of all portfolio managers at Morgan Stanley Investment Management (MSIM) or the views of the firm as a whole, and may not be reflected in all the strategies and products that the Firm offers.Forecasts and/or estimates provided herein are subject to change and may not actually come to pass. Information regarding expected market returns and market outlooks is based on the research, analysis and opinions of the authors. These conclusions are speculative in nature, may not come to pass and are not intended to predict the future performance of any specific Morgan Stanley Investment Management product.Certain information herein is based on data obtained from third party sources believed to be reliable. However, we have not verified this information, and we make no representations whatsoever as to its accuracy or completeness.All information provided has been prepared solely for information purposes and does not constitute an offer or a recommendation to buy or sell any particular security or to adopt any specific investment strategy. The information herein has not been based on a consideration of any individual investor circumstances and is not investment advice, nor should it be construed in any way as tax, accounting, legal or regulatory advice. To that end, investors should seek independent legal and financial advice, including advice as to tax consequences, before making any investment decision.Charts and graphs provided herein are for illustrative purposes only. Past performance is no guarantee of future results.Investing involves risks including the possible loss of principal. Investments in foreign markets entail special risks such as currency, political, economic, market and liquidity risks.Fixed-income securities are subject to the ability of an issuer to make timely principal and interest payments (credit risk), changes in interest rates (interest-rate risk), the creditworthiness of the issuer and general market liquidity (market risk). In the current rising interest-rate environment, bond prices may fall and may result in periods of volatility and increased portfolio redemptions. Longer-term securities may be more sensitive to interest rate changes. In a declining interest-rate environment, the portfolio may generate less income. Investments in foreign markets entail special risks such as currency, political, economic, and market risks. The risks of investing in emerging market countries are greater than the risks generally associated with investments in foreign developed countries.
This communication is not a product of Morgan Stanley’s Research Department and should not be regarded as a research recommendation. The information contained herein has not been prepared in accordance with legal requirements designed to promote the independence of investment research and is not subject to any prohibition on dealing ahead of the dissemination of investment research.This communication is only intended for and will be only distributed to persons resident in jurisdictions where such distribution or availability would not be contrary to local laws or regulations.EMEA:This communication was issued and approved in the United Kingdom by Morgan Stanley Investment Management Limited, 25 Cabot Square, Canary Wharf, London E14 4QA, authorized and regulated by the Financial Conduct Authority, for distribution to Professional Clients only and must not be relied upon or acted upon by Retail Clients (each as defined in the UK Financial Conduct Authority’s rules).U.S.:NOT FDIC INSURED | OFFER NO BANK GUARANTEE | MAY LOSE VALUE | NOT INSURED BY ANY FEDERAL GOVERNMENT AGENCY | NOT A DEPOSITHong Kong:This document has been issued by Morgan Stanley Asia Limited for use in Hong Kong and shall only be made available to “professional investors” as defined under the Securities and Futures Ordinance of Hong Kong (Cap 571). The contents of this document have not been reviewed nor approved by any regulatory authority including the Securities and Futures Commission in Hong Kong. Accordingly, save where an exemption is available under the relevant law, this document shall not be issued, circulated, distributed, directed at, or made available to, the public in Hong Kong.Singapore:This document may not be circulated or distributed, whether directly or indirectly, to persons in Singapore other than to (i) an accredited investor (ii) an expert investor or (iii) an institutional investor as defined in Section 4A of the Securities and Futures Act, Chapter 289 of Singapore (“SFA”); or (iv) otherwise pursuant to, and in accordance with the conditions of, any other applicable provision of the SFA.Australia:This publication is disseminated in Australia by Morgan Stanley Investment Management (Australia) Pty Limited ACN: 122040037, AFSL No. 314182, which accept responsibility for its contents. This publication, and any access to it, is intended only for “wholesale clients” within the meaning of the Australian Corporations Act.Morgan Stanley Investment Management is the asset management division of Morgan Stanley.All information contained herein is proprietary and is protected under copyright law.

© 2017 Morgan Stanley CRC 1730123 Exp. 03/09/2017 8846041_KC_0317 Lit-Link: INSIGHTGFI-0317
Explore our new site at www.morganstanley.com/im
INVESTMENT INSIGHT