Embed Size (px)
Citation preview

BOOTH CAMPUT 2015
Cost of Capital
Professor Laurence BoothCIT Chair in Structured FinanceRotman School of Management
University of Toronto

BOOTH CAMPUT 2015
Overview• Can not mechanically do much in finance
• Markets constantly changing• History “constrains” reasonable values
• Three iron laws of finance• Time value of money• Risk value of money• Tax value of money
• Business cycle effects • Bond and money market spreads • Equity risk “betas”
• Government intervention• Financial principles are “absent a government” • Fixed income markets have been dominated by
the “global policy maker” (monetary policy) since 2008
• What is the impact on equity markets?

BOOTH CAMPUT 2015
Graham and Harvey (JFE 2001) Survey

BOOTH CAMPUT 2015
Estimating Opportunity Costs
MRPRK F

BOOTH CAMPUT 2015
Estimating the Market Risk Premium: Equities over Bonds
• Suppose we assume that the market risk premium is constant
• Have to mimimise estimation risk
• Do not trust any short term equity market risk premium estimate!
tMRPEMRP )(
Equities LTC Bonds2000 7.41 13.642001 -12.57 3.922002 -12.44 10.092003 26.72 8.062004 14.48 8.462005 24.13 15.052006 17.26 3.222007 9.83 3.302008 -33.00 13.652009 35.05 -4.262010 17.61 11.452011 -8.71 18.622012 7.19 4.542013 13.00 -8.42

BOOTH CAMPUT 2015
Annual Returns 1926-2013
Arithmetic is simple average; geometric is compound and OLS is the least squares estimate.Approximately Geometric Mean = Arithmetic Mean - .5*varianceFor example, US variance is about 4%, so AM and GM diverge by about 2%
Canadian and U.S. Risk Premium Data 1926-2013
US Risk Premium estimatesOverall OLS AM GM StdevEquity 10.97 12.05 10.08 20.18Bonds 5.32 5.81 5.41 9.45
Risk Premium 5.65 6.24 4.67
Canadian Risk Premium estimatesOverall OLS AM GM StdevEquity 10.32 11.20 9.56 18.66Bonds 6.01 6.43 6.08 8.92
Risk Premium 4.31 4.77 3.48

BOOTH CAMPUT 2015
US & Canadian Risk Premium
U.S. vs Canada “Risk Premium Estimates”
Equity Bond Risk PremiumAM Returns
US 12.05 5.81 6.24CANADA 11.20 6.43 4.77
Difference 0.84 -0.63 1.47
GM Returns
US 10.08 5.41 4.67CANADA 9.56 6.08 3.48
Difference 0.52 -0.67 1.19

BOOTH CAMPUT 2015
Instead of Canadian long term bond yields and returns being 0.63% higher than the US, forecast yields are 0.75% lower.

BOOTH CAMPUT 2015
Currency Composition of Major Country Reserve Fund Holdings
http://www.imf.org/external/np/sta/cofer/eng/index.htm

BOOTH CAMPUT 2015
• Currently outstanding government of Canada treasury bills and bonds outstanding (June 2015) is $543.2 billion so foreign government official holdings are about 22% of the total.

BOOTH CAMPUT 2015
Fernandez Survey
.

BOOTH CAMPUT 2015
Fernandez 2015 Survey
Survey indicates lower Canadian yields are being offset by higher Canadian MRP

BOOTH CAMPUT 2015
Distribution of Market Return Estimates

BOOTH CAMPUT 2015
Utility Business Risk
• Short run• Ability to earn the allowed ROE• Return on capital
• Long run• Stranded asset risk• Return of capital• “I want my money back!”
(Greece!)• More important in low interest
rate environment

BOOTH CAMPUT 2015
Utility Risk
Union Actual vs Allowed ROE
8
9
10
11
12
13
14
15
1990 1991 1992 1993 1994 1995 1996 1997 1998 1999 2000 2001 2002 2003 2004 2005 2006 2007 2008 2009 2010 2011
Allow ed Actual
Weather normalised actual ROE: average over-earning 1.22%, or 2.34% while under settlement!

BOOTH CAMPUT 2015
EGDI Allowed vs Actual ROE
8
9
10
11
12
13
14
15
16
17
1985 1986 1987 1988 1989 1990 1991 1992 1993 1994 1995 1996 1997 1998 1999 2000 2001 2002 2003 2004 2005 2006 2007 2008 2009 2010 2011
Allowed Actual
Like Union Gas this is weather normalised

BOOTH CAMPUT 2015
Utility Business Risk
Very little business risk as they almost always earn their allowed ROE
– Forward test year– Annual rate hearings– Deferral accounts
Removal of commodity charge Weather deferral accounts (FEI, GMI, ATCO)
Major business risk for most utilities is long run capital recovery:
– Can they recover their investment in rate base?
– TransCanada 2011/12 Mainline hearing– Go back to regulator if unanticipated
events (risk) and risk may then be reallocated as long as there is underlying demand?

BOOTH CAMPUT 2015
Market Risk: Betas
• Beta measures the extent to which a security moves with the market.
• Low beta means it is low risk as its risk is mainly diversifiable
• High beta means it moves much more than the market both up and down
• Individual estimates are volatile• They reflect what happened over the estimation
period • They change as the impact of special events
pass out of the estimation window• Always easy to “poke holes” in individual
estimates, which is why we look across time and use averages
• Everyone “adjusts” to get forward estimates, but no mechanical adjustment works for utilities

BOOTH CAMPUT 2015
Utility Market Risk
Average Utility Betas
-0.100
0.000
0.100
0.200
0.300
0.400
0.500
0.600
Jan-
85
Jan-
86
Jan-
87
Jan-
88
Jan-
89
Jan-
90
Jan-
91
Jan-
92
Jan-
93
Jan-
94
Jan-
95
Jan-
96
Jan-
97
Jan-
98
Jan-
99
Jan-
00
Jan-
01
Jan-
02
Jan-
03
Jan-
04
Jan-
05
Jan-
06
Jan-
07
Jan-
08
Jan-
09
Jan-
10
Jan-
11
Jan-
12
Utility beta Utility (No TAU)

BOOTH CAMPUT 2015
Public Beta Estimates June 2015
Ticker RBC GoogleENBRIDGE ENB 0 -0.19TRANSCANADA TRP 0.23 0.1CANADIAN UTILITIESCU 0.15 0.09TRANSALTA TA 0.23 -0.11EMERA EMA 0.19 0.27FORTIS FTS 0.21 0.16VALENER VNR 0.38 0.21VERESEN VSN 0.4 0.16AVERAGE BETA 0.22 0.09

BOOTH CAMPUT 2015
Summary on CAPM Fair ROE
Current near term forecast LTC bond yields about 3.0%
Canadian market risk premium– Typical range 5-6% currently higher due to low
LTC yields Utility risk
– Very low business risk for utilities– Typical betas are usually in a range 0.45-0.55
Add flotation cost to get stock price above book value: 0.50%
Overall current fair ROE about 6.25% Current allowed ROEs in the 8.2-8.8% range
(except OEB)
Special factors?
BOOTH CAMPUT 2015
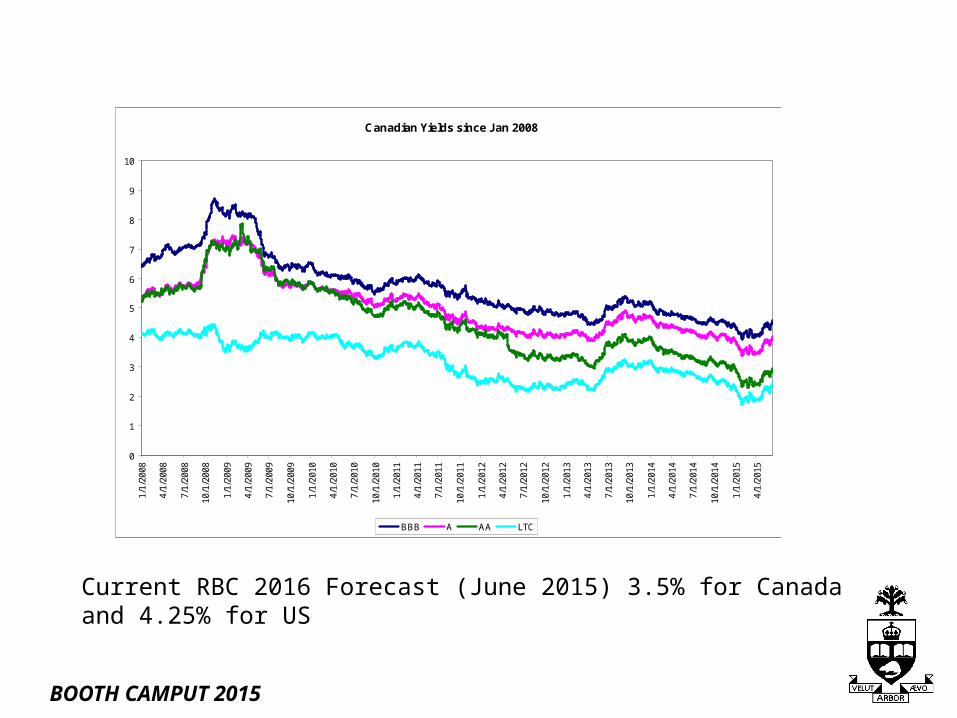
Current RBC 2016 Forecast (June 2015) 3.5% for Canada and 4.25% for US
Canadian Yields since Jan 2008
0
1
2
3
4
5
6
7
8
9
10
1/1/
2008
4/1/
2008
7/1/
2008
10/1
/200
8
1/1/
2009
4/1/
2009
7/1/
2009
10/1
/200
9
1/1/
2010
4/1/
2010
7/1/
2010
10/1
/201
0
1/1/
2011
4/1/
2011
7/1/
2011
10/1
/201
1
1/1/
2012
4/1/
2012
7/1/
2012
10/1
/201
2
1/1/
2013
4/1/
2013
7/1/
2013
10/1
/201
3
1/1/
2014
4/1/
2014
7/1/
2014
10/1
/201
4
1/1/
2015
4/1/
2015
BBB A AA LTC

BOOTH CAMPUT 2015
Discounted Cash Flow (DCF)
• Implied required rate of return
• Dividend yield plus growth in stock price (earnings/dividends)
• Dividend yield is easily estimated but what is the forecast growth rate?
• By looking at DCF we can check the CAPM fair ROE
• Easiest done by looking at the market: growth expectations constrained in terms of growth by GDP!

BOOTH CAMPUT 2015
DCF Checks
• Equality for the market (beta equals 1.0)
• We can accurately estimate the LTC bond yield and the dividend yield on the TSX
• Suppose we plug in average real growth of 3.5% and the actual inflation rate and an average market risk premium of 4% for naïve estimates for the market
MRPgPdRDCFCAPM F 1

BOOTH CAMPUT 2015
Negative real bond yields
Very high real bond yields
Difference between Naive DCF and Risk Premium estimates for the Market
-8.00
-6.00
-4.00
-2.00
0.00
2.00
4.00
6.00
8.00
10.00
12.00
1956
M01
1957
M10
1959
M07
1961
M04
1963
M01
1964
M10
1966
M07
1968
M04
1970
M01
1971
M10
1973
M07
1975
M04
1977
M01
1978
M10
1980
M07
1982
M04
1984
M01
1985
M10
1987
M07
1989
M04
1991
M01
1992
M10
1994
M07
1996
M04
1998
M01
1999
M10
2001
M07
2003
M04
2005
M01
2006
M10
2008
M07
2010
M04
2012
M01

BOOTH CAMPUT 2015
Insights
• DCF estimates exceed risk premium estimates during high inflation periods or low real bond yield periods
• CAPM estimates exceed DCF estimates during high real bond yield periods
• CAPM may under-estimate fair ROE if you use current forecast LTC yields, but not as bad as a year ago
• Fernandez indicates that survey respondents use rates higher than the 10 year forecast rate for their return estimates

BOOTH CAMPUT 2015
Adjustments: A Spreads
A bond yields are just over 1.50% over LTC yields, normally about 1.0%Credit spreads directly reflect the business cycle, plausibly changes in risk premiums and the change in the yield on government bonds
Default Spreads Since Dec 1979
0
50
100
150
200
250
300
350
400
450
500
12
/31
/19
79
12
/31
/19
80
12
/31
/19
81
12
/31
/19
82
12
/31
/19
83
12
/31
/19
84
12
/31
/19
85
12
/31
/19
86
12
/31
/19
87
12
/31
/19
88
12
/31
/19
89
12
/31
/19
90
12
/31
/19
91
12
/31
/19
92
12
/31
/19
93
12
/31
/19
94
12
/31
/19
95
12
/31
/19
96
12
/31
/19
97
12
/31
/19
98
12
/31
/19
99
12
/31
/20
00
12
/31
/20
01
12
/31
/20
02
12
/31
/20
03
12
/31
/20
04
12
/31
/20
05
12
/31
/20
06
12
/31
/20
07
12
/31
/20
08
12
/31
/20
09
12
/31
/20
10
12
/31
/20
11
12
/31
/20
12
12
/31
/20
13
12
/31
/20
14
AA A BBB

BOOTH CAMPUT 2015
Bank of Canada Research
60% of spread change for A bonds was driven by liquidity and market making changes. I use 50% of change in credit spreads as a change in the risk premium conditional on the state of the markets.

BOOTH CAMPUT 2015
Preferred Shares
• Importance:• Tax effects• Pre-tax spread with long Canadas
• Source: BMO Preferred Share Statistics May 31, 2004

BOOTH CAMPUT 2015
US Operation Twist started August 2011A spreads and preferred share spreads were about the same beforeAfter A spreads the same, but preferred spreads increased
Operation Twist
Preferred and A Spreads
100
150
200
250
300
350
1/1/
2010
2/1/
2010
3/1/
2010
4/1/
2010
5/1/
2010
6/1/
2010
7/1/
2010
8/1/
2010
9/1/
2010
10/1
/201
011
/1/2
010
12/1
/201
01/
1/20
112/
1/20
113/
1/20
114/
1/20
115/
1/20
116/
1/20
117/
1/20
118/
1/20
119/
1/20
1110
/1/2
011
11/1
/201
112
/1/2
011
1/1/
2012
2/1/
2012
3/1/
2012
4/1/
2012
5/1/
2012
6/1/
2012
7/1/
2012
8/1/
2012
9/1/
2012
10/1
/201
211
/1/2
012
12/1
/201
21/
1/20
132/
1/20
133/
1/20
134/
1/20
135/
1/20
136/
1/20
137/
1/20
138/
1/20
139/
1/20
1310
/1/2
013
11/1
/201
312
/1/2
013
1/1/
2014
2/1/
2014
3/1/
2014
4/1/
2014
5/1/
2014
6/1/
2014
7/1/
2014
8/1/
2014
9/1/
2014
10/1
/201
411
/1/2
014
12/1
/201
41/
1/20
152/
1/20
153/
1/20
154/
1/20
155/
1/20
156/
1/20
15
Pref A

BOOTH CAMPUT 2015
Pref-A Spread
-100
-50
0
50
100
150
200
1/1/
2010
3/1/
2010
5/1/
2010
7/1/
2010
9/1/
2010
11/1
/201
0
1/1/
2011
3/1/
2011
5/1/
2011
7/1/
2011
9/1/
2011
11/1
/201
1
1/1/
2012
3/1/
2012
5/1/
2012
7/1/
2012
9/1/
2012
11/1
/201
2
1/1/
2013
3/1/
2013
5/1/
2013
7/1/
2013
9/1/
2013
11/1
/201
3
1/1/
2014
3/1/
2014
5/1/
2014
7/1/
2014
9/1/
2014
11/1
/201
4
1/1/
2015
3/1/
2015
5/1/
2015
Preferred shares are equities and taxed the same Unlike Canada bonds they have not been affected by monetary policy to the same degree

BOOTH CAMPUT 2015
Current CAPM Adjustments
• “A” Spread Adjustment• Used by many boards• Add 50% of the change in the A spread to
adjust the utility risk premium• Adds about 0.30% at the moment
• Operation Twist• I use a minimum LTC forecast yield of
4.0% • Currently adds about 0.80% to the very
low forecast LTC yields. • Explicitly accepted by BCUC and
Newfoundland PUB

BOOTH CAMPUT 2015
Checks• TD Economics October 19, 2012
• Typical pension fund estimates• Add 1.5% to convert long run (geometric) to
arithmetic and equity market return is about 8.50%: limits the fair ROE for a utility to less than 8.50%
• If a DB pension fund could earn the current utility allowed ROE we wouldn’t have a pension problem in Canada!

BOOTH CAMPUT 2015
“The most the owners in aggregate can earn between now and judgment day is what their businesses in aggregate earn.(italics in original) True by buying and selling that is clever or lucky, investor A may take more than his share of the pie at the expense of investor B. And yes, all investors feel richer when stocks soar. But an owner can exit only by having someone take his place. If one investor sells high, another must buy high. For owners as a whole, there is simply no magic - no shower of money from outer space – that will enable them to extract wealth from their companies beyond that created by the companies themselves.”
Warren Buffet

BOOTH CAMPUT 2015
Final CheckInvestment and Speculative TSX Returns back to 1987
ROE Spec TSX1987 11.19 -5.31 5.881988 12.97 -1.89 11.081989 11.79 9.58 21.371990 7.48 -22.28 -14.801991 3.53 8.48 12.021992 1.56 -2.99 -1.431993 3.69 28.86 32.551994 6.57 -6.75 -0.181995 9.55 4.98 14.531996 10.29 18.06 28.351997 10.86 4.12 14.981998 8.83 -10.42 -1.581999 9.82 21.90 31.712000 10.92 -3.51 7.412001 7.41 -19.98 -12.572002 5.68 -18.12 -12.442003 9.64 17.08 26.722004 11.62 2.86 14.482005 12.70 11.43 24.132006 13.96 3.30 17.262007 12.86 -3.03 9.832008 9.44 -42.44 -33.002009 8.06 26.99 35.052010 9.90 7.71 17.612011 9.60 -18.31 -8.712012 10.28 -3.09 7.19
Average 9.24 0.28 9.52volatility 3.07 16.32 16.68

BOOTH CAMPUT 2015
Conclusions• Can not mechanically do much in finance
• Markets constantly changing• History “constrains” reasonable values
• Three iron laws of finance• Time value of money• Risk value of money• Tax value of money
• Business cycle effects • Bond and money market spreads • Equity risk “betas”
• Government intervention• Financial principles are “absent a government” • Fixed income markets have been dominated by
the “global policy maker” (monetary policy) since 2008
• What is the impact on equity markets?