Embed Size (px)
Citation preview

CHINESE JOURNAL OF GEOPHYSICS Vol.49, No.6, 2006, pp: 1658∼1664
BOOSTING SIGNAL TO NOISE RATIO OF SEISMIC SIGNALS USINGTHE PHASED-ARRAY VIBRATOR SYSTEM
JIANG Tao1,2 LIN Jun1,2 LI Tong-Lin3 CHEN Zu-Bin1,2 ZHANG Lin-Hang1,2
1 College of Instrument Science and Electrical Engineering, Jilin University, Changchun 130026, China
2 Key Laboratory of Geo- exploration Instrumentation of Ministry of Education, Jilin University,
Changchun 130026, China
3 College of GeoExploration Science and Technology, Jilin University, Changchun 130026, China
Abstract When noise in the field is very strong, we can not get data with proper signal to noise ratio (SNR) even
if combination vibroseis is used. To solve this problem we proposed to apply a phased-array vibrator, which can
form a directional seismic wave. We have made numerical simulation of multi-track seismograms and computed
reflected waves’ SNR for combination and phased-array sources on a given horizontal stratified model. The result
shows that the average SNR of reflected waves increases by 1.54∼9.90dB with respect to the combination source
when 4,8,15 and 20-unit phased-array vibrator are used. We conclude that phased-array source is competent to
improve seismic signal SNR. Moreover, the phased-array source can boost SNR obviously when more vibrators
are applied but there is no similar result for the combination source.
Key words Vibroseis, Combination, Phased-array, Signal to Noise Ratio (SNR), Numerical simulation.
1 INTRODUCTION
Since it is a nondestructive source, electrodynamic vibroseis[1∼3] is widely used in reflection seismicprospecting. Because of its low power, it is sometimes difficult to get high SNR (signal to noise ratio) seis-mic data, especially when noise in the fields is strong. Some techniques to improve SNR of data have beenstudied[4∼7]. Here, we propose a new PAVS (phased-array vibrator system) technique for acquisition of highSNR seismic signals.
The combination vibroseis[8], is a special vibrator array that vibrates simultaneously. It is often used toget high SNR seismic signals. Generally, the number of vibrators used in the combination source is less than 3or 4. It cannot reach obvious improvement of SNR of seismic signals, even though more vibrators are used. Thereason is that combination sources direct the seismic wave to a fixed direction (generally the vertical direction),whereas the reflected seismic waves received from seismometer groups are not close to that direction. Therefore,we have developed a PAVS, which can form different directional seismic waves and improve SNR of seismicsignals.
In PAVS, more concerns are focused on control parameters of PAVS, layout of the observation system andcomplex underground structure. Here, based on basic phased-array seismic theory and the principle of seismicwave propagation, we synthesize seismic records on a horizontal layered strata model by PAVS and combinationsource, and calculate seismic signal SNR. According to the results, we conclude that PAVS is feasible andsuperior for seismic prospecting.
2 THEORY
The phased-array technique originated from phased-array radar[9∼11], which can make electromagneticwaves concentrate in any direction. Now, the idea of beam forming is widely used in other wave areas, suchas microwave[12], ultrasonic[13] and light-wave[14]. Vibrator array[4] with solo frequency signals was used totestify the existence of directional seismic wave. Based on above research, we propose a method to make sweepfrequency seismic waves concentrate in certain direction.
E-mail: [email protected]

Jiang T et al.: Boosting Signal to noise Ratio of Seismic Signals Using the Phased-array Vibrator System 1659
PAVS[15] is composed of multi-vibrators and a phased-array control system. All units of the source andgeophones are kept in the line. Vibrators are labeled in ascending order. Distances between adjacent unitsare same. Because all units have different locations, reflected seismic waves from different units arrive at eachgeophone asynchronously. In order to eliminate wave path difference, we let vibrators vibrate one by one withthe regular interval τ . Therefore, reflected seismic signals at geophones are stacked in phase, and SNR isimproved.
In order to describe direction of seismic wave, the phased-array direction coefficient Fa(ϕ) is defined as:
Fa(ϕ) =sinn[(kd cos ϕ + β)/2]n sin[(kd cos ϕ + β)/2]
, ϕ ∈ [0◦, 180◦], (1)
where ϕ is horizontal angel of any underground observation spot, n is number of vibrators, k =2π
λ, d is distance
between vibrators, and β = 2πfτ is phase-difference due to the delay time τ . Extreme angle ϕ = ϕM is calledseismic wave direction, in which the strongest seismic wave is. According to the theory of phased array[9], wehave
ϕM = arccos(τv
d
). (2)
According to the direction characteristic of seismic wave, the amplitude of seismic wave of PAVS is Ap =n|F (ϕ)| times that of the single source.
3 METHOD
It is necessary to determine proper control signals[1,16] of PAVS, noise level and underground structure inthe field before seismic synthetic records are made.
First, let d=2m, τ=0.89ms, and PAVS have 4,8,15 and 20 units respectively in the experiment.Second, let sweep control signal s(t) in the first unit be
s(t) = A cos 2π
(f1 +
f2 − f1
2Tt
)t[1], (3)
where A is signal amplitude, starting frequency f1=50Hz, ending frequency f2=200Hz, T=4s, and t is a timevariate.
Because driving signals between adjacent vibrators are delayed successively τ , the driving signal of eachunit can be expressed as
si(t) = s[t− (i− 1)τ ], (i = 1, 2, · · · , n). (4)
We assume that noise in the field is random, and variance of noise is σ2=1. SNR can be adjusted bychanging amplitude A of driving signals when noise is constant. Here, we take A=0.003, which means SNR atthe source position is –28.23dB in a single source case.
Finally, we design a multi-layer model. The depth is 100m and velocity is 1000m·s−1 in the first layer, thedepth is 250m and velocity is 1700m·s−1 in the second layer, the depth is 180m and velocity is 1900m·s−1 inthe third layer, and velocity is 2200m·s−1 in the fourth layer.
Let seismic synthetic records for single source be rsi(t), (i = 1, 2, · · ·, number of track), where i is tracenumber. When noise is neglected, rsi(t) is composed of a direct wave ri,0(t) and three reflected waves ri,1(t),ri,2(t), and rsi,3(t), that means
rsi(t) =3∑
j=0
ri,j(t).
Thus, seismic waves in the track i can be written as
rpi(t) =3∑
j=0
n|Fa(ϕi,j)|ri,j(t), (5)

1660 Chinese J. Geophys. Vol.49, No.6
where ϕi,0 is the direction of direct wave, ϕi,1, ϕi,2, and ϕi,3 are directions of reflected waves, and Fa(ϕi,j) isfunction of frequency f which can be seen from Eq.(1). Because f is linearly related to t for chirp drivingsignals, naturally, Fa(ϕi,j) can be written as Fa(ϕi,j , t) and Eq.(5) can be expressed as:
rpi(t) =3∑
j=0
n|Fa(ϕi,j , t)|ri,j(t). (6)
Considering noise, real seismic signals for PAVS are
rmixpi(t) = rpi(t) + rN(t). (7)
After cross-correlation processing[17], seismic waves in pulse form are made. To PAVS, reference signal
ref(t) = s
(t− n− 1
2τ
)is chosen[15∼17]. Seismogram of track i is cross-correlation between ref(t) and rmixpi(t)
ri(t) = ref(t)⊗ rmixpi(t). (8)
So the seismic synthetic records for PAVS can be expressed as
[r1(t), r2(t), · · · , ri(t), · · · , rNUM(t)],
where NUM is the number of tracks.
Fig. 1 Direction graphs for combination and phased-array vibrator system
(a) Direction graph for combination source at f=125Hz; (b) Direction graph for combination source at f=200Hz;
(c) Direction graph for phased-array source at f=125Hz; (d) Direction graph for phased-array source at f=200Hz.
Jiang T et al.: Boosting Signal to noise Ratio of Seismic Signals Using the Phased-array Vibrator System 1661
Combination synthetic records can be got similarly to PAVS records. In fact, the combination source isa special case of PAVS, when τ=0. Direction graphs of the combination source and PAVS are shown in Fig. 1,where n=8, d=2m. From Fig. 1, we can see that the directions of seismic waves become much narrower whenthe frequency of driving signals increases.
4 RESULTS
4.1 Synthetic Records for Combination and PAVS Sources
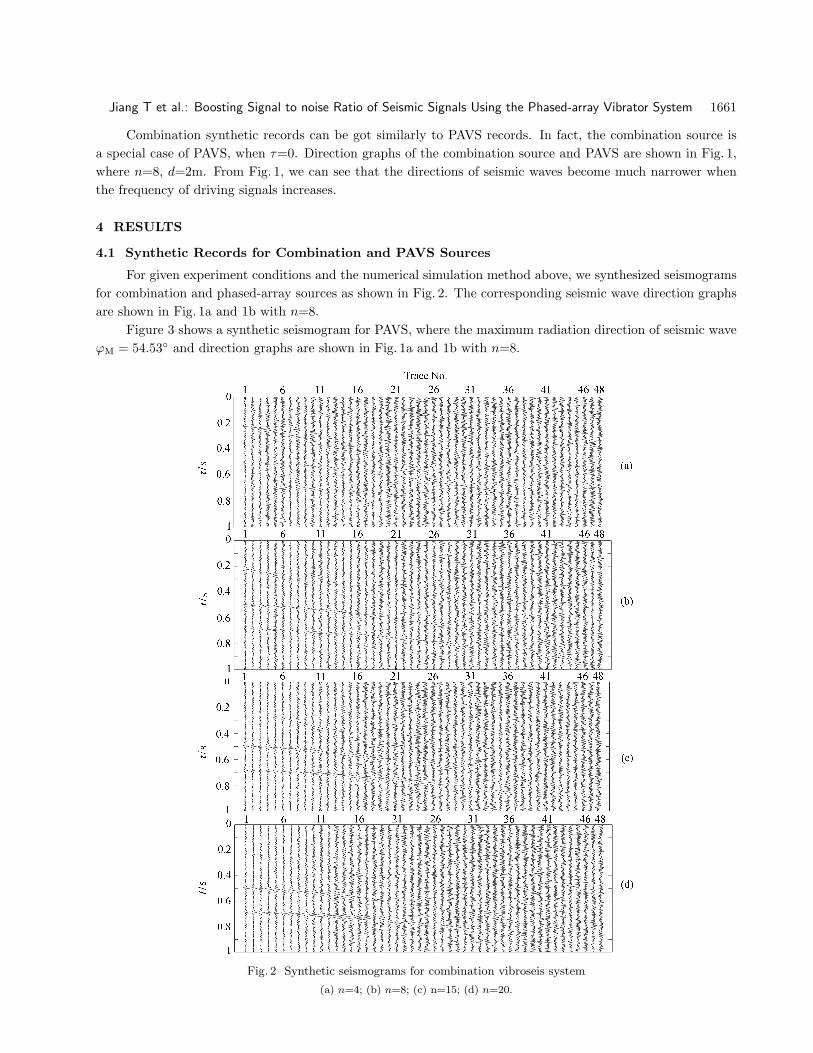
For given experiment conditions and the numerical simulation method above, we synthesized seismogramsfor combination and phased-array sources as shown in Fig. 2. The corresponding seismic wave direction graphsare shown in Fig. 1a and 1b with n=8.
Figure 3 shows a synthetic seismogram for PAVS, where the maximum radiation direction of seismic waveϕM = 54.53◦ and direction graphs are shown in Fig. 1a and 1b with n=8.
Fig. 2 Synthetic seismograms for combination vibroseis system
(a) n=4; (b) n=8; (c) n=15; (d) n=20.

1662 Chinese J. Geophys. Vol.49, No.6
Fig. 3 Synthetic seismograms for phased-array vibrator system
(a) n=4; (b) n=8; (c) n=15; (d) n=20.
4.2 Comparison of Synthetic Record SNR Between Combination and PAVS Sources
Using known signal and noise, we calculate SNR of seismic signals from different tracks and reflectors inFigs. 1 and 2. Results are shown in Tables 1 and 2. Furthermore, we can work out how many PAVS can improveSNR with respect to the combination case, which are shown in Table 3. As SNR values in different tracks arenot same, we use average SNR, which means arithmetic mean of SNR in all tracks.

Jiang T et al.: Boosting Signal to noise Ratio of Seismic Signals Using the Phased-array Vibrator System 1663
Table 1 Average SNR in synthetic seismograms for combination vibroseis system (dB)
Source Direct Reflected Reflected Reflected Mean of three Mean of direct wave and
position wave wave I wave II wave III reflected waves three reflected waves
n = 4 –16.19 –35.27 –34.94 –32.73 –34.75 –33.81 –34.10
n = 8 –10.17 –40.33 –39.28 –29.52 –30.10 –31.14 –32.20
n = 15 –4.71 –37.12 –36.52 –31.88 –29.06 –31.35 –32.21
n = 20 –2.21 –37.85 –38.02 –31.27 –30.59 –32.00 –32.86
Table 2 Average SNR in synthetic seismograms for phased–array vibrator system (dB)
Source Direct Reflected Reflected Reflected Mean of three Mean of direct wave and
position wave wave I wave II wave III reflected waves three reflected waves
n = 4 –16.19 –31.71 –31.86 –31.92 –34.51 –32.27 –32.05
n = 8 –10.17 –30.52 –29.09 –26.29 –29.08 –27.36 –27.93
n = 15 –4.71 –35.57 –32.76 –22.00 –25.49 –23.62 –24.74
n = 20 –2.21 –32.31 –31.63 –20.64 –24.86 –22.10 –23.15
Table 3 Average SNR improvement in synthetic seismograms using phased-array vibrator system
(Comparing with the situation of combination source) (dB)
Direct Reflected Reflected Reflected Mean of three Mean of direct wave and
wave wave I wave II wave III reflected waves three reflected waves
n = 4 3.56 3.08 0.81 0.24 1.54 2.05
n = 8 9.81 10.19 3.23 1.02 3.78 4.27
n = 15 1.55 3.76 9.88 3.57 7.73 7.47
n = 20 5.54 6.39 10.63 5.73 9.90 9.71
5 CONCLUSIONS
From the above seismic synthetic records, we can get following conclusions:Firstly, SNR of combination source is lower than that of PAVS.Secondly, the SNR of reflected waves from near-source-geophones increases and that from far-source-
geophones decreases with the increasing number of vibrators, which is accordant with the previous conclusionthat the number of vibrators in the combination source should be limited. In PAVS, the SNR values of reflectedwaves in all geophones are increased. Furthermore, more vibrators in PAVS can bring higher SNR, PAVS ishelpful for higher SNR and there is no limitation in unit number for PAVS.
Based on the quantitative results of SNR improvements in Tables 1,2, and 3, SNR values of all reflectedwave signals for PAVS are higher than those for the combination source case when the same number of vibratorsis used. For the combination system, there is little influence on SNR when vibrators are more than 4, and itgoes worse when 20 elements are used. For PAVS, there is great improvement to SNR when more vibrators areused. Moreover, there is a significant SNR improvement for the reflected wave from the second reflector. Thereason is that we controll the direction of the main beam to make reflected wave II strongest.
In general, PAVS is feasible to seismic survey; and it is more helpful for high SNR seismic signals than thecombination source. When SNR in the field is low, PAVS is a good choice.
ACKNOWLEDGEMENTS
This work was supported by the National Natural Science Foundation of China (40674096) and the Ministryof Science and Technology of the People’s Republic of China (A project of Hi-tech Research and DevelopmentProgram of China (2002AA135240).

1664 Chinese J. Geophys. Vol.49, No.6
REFERENCES
[1] Nigel A. Vibroseis. New Jersey: Prentice Hall PTR, 1991
[2] Lin J, Chen Z B. Study on modal on coupling for vibroseis with ground. Academic Periodical Abstracts of China.
(in Chinese), 1999, 5(6): 811∼812
[3] Chen Z B, Lin J. Design for vibrator field experiment based on vibrator-earth system. Journal of Geoscientific
Research in Northeast Asia, 2000, 3(1): 107∼113
[4] Hong F, Hu T Y, Zhang W P, et al. Attenuating multiples for low signal-to-noise ratio seismic data using optimal
beamforming. Chinese J. Geophys. (in Chinese), 2004, 47(6): 1106∼1110
[5] Hu T Y, Wang R Q, White R E. Beamforming in seismic data processing. Chinese J. Geophys. (in Chinese), 2000,
43(1): 105∼115
[6] Luo M Q, Cao J, Xie X B, et al. Comparison of illumination analyses using one-way and full-way propagators.
Expanded Abstract of 74th Annual International SEG Meeting, 2004. 67∼70
[7] Xie X B, Jin S W, Wu R S. Wave Equation based illumination analysis. Expanded Abstract of 74th Annual Interna-
tional SEG Meeting, 2004. 933∼936
[8] Arnold M E. Beam forming with vibrator arrays. Geophysics, 1977, 42(7): 1321∼1338
[9] Mosca S, Bilotti F, Toscano A, et al. A novel design method for Blass matrix beam-forming networks. Antennas and
Propagation, IEEE Transactions on, 2002, 50(2): 225∼232
[10] Miura R, Tanaka T, Chiba I, et al. Beamforming experiment with a DBF multibeam antenna in a mobile satellite
environment. Antennas and Propagation, IEEE Transactions on, 1997, 45(4): 707∼714
[11] Kraft U R. Gain and G/T of multielement receive antennas with active beamforming networks. Antennas and
Propagation, IEEE Transactions on, 2000, 48(12): 1818∼1829
[12] Denno S, Ohira T. Modified constant modulus algorithm for digital signal processing adaptive antennas with mi-
crowave analog beamforming. Antennas and Propagation, IEEE Transactions on, 2002, 50(6): 850∼857
[13] Hatfield J V, Chai K S. A beam-forming transmit ASIC for driving ultrasonic arrays. Sensors and Actuators, A:
Physical, 2001, 92(1-3): 273∼279
[14] Morgan S P. Detection performance of a diffusive wave phased array. Applied Optics, 2004, 43(10): 2071∼2078
[15] Jiang T, Lin J, Chen Z B, et al. Seismic beam-forming in phased array of vibroseis. Journal of Jilin University
(Information Science Edition) (in Chinese), 2004, 22(1): 181∼184
[16] Lin J, Chen P C, Jiang T, et al. The signal design of electrodynamic vibroseis for surface imaging. Progress in
Geophysics (in Chinese), 2004, 19(4): 807∼811
[17] Jiang T, Lin J, Chen Z B, et al. The correlation detect ion method of signals in phased array of vibroseis system.
Chinese Journal of Scientific Instrument (in Chinese), 2005, 26(4): 336∼339


![Delta Boosting Machine and its Application in Actuarial ... · (MARS), regression trees [22] and boosting. 1.1. The Boosting Algorithms. Boosting methods are based on an idea of com-bining](https://img.pdfslide.us/doc/110x75/5f39fd86e92ad51969114a8c/delta-boosting-machine-and-its-application-in-actuarial-mars-regression-trees.jpg)