Embed Size (px)
Citation preview
OECD Latin America & the CaribbeanRegional Programme
Boosting Productivity and Inclusive Growth in Latin America
B
OO
STING
PROD
UC
TIVITY A
ND
INCLU
SIVE G
ROW
TH IN
LATIN A
MERIC
A
BOOSTING PRODUCTIVITY AND INCLUSIVE GROWTH IN LATIN AMERICA
This publication was developed by the OECD and the IDB, in collaboration with the OECD Global Forum on Productivity, to support the discussions of the OECD Latin America and the Caribbean
Regional Programme’s Ministerial Meeting on Productivity and Inclusive Growth, which took place from 5-6 December 2016 in Santiago, Chile.
The OECD and IDB analysis included in this publication highlights that to reignite growth and
keep the momentum of social progress, governments in Latin America must focus on boosting productivity through the empowerment of all workers with skills and technology and the
unleashing of innovation and entrepreneurial dynamism. The publication portrays the situation of many Latin American countries and discusses best practices. It informs the debate on future
trends in Latin America towards higher productivity and more inclusive growth.
Launched at the OECD’s 2016 Ministerial Council Meeting by OECD Secretary General Angel Gurría and the President of Chile, Michelle Bachelet, the OECD LAC Regional Programme aims
to support the region in advancing its reform agenda along three key priorities: increasing productivity, advancing social inclusion, and strengthening institutions and governance. For
each of these priorities, the Programme, in partnership with regional international organisations, works to deliver greater availability of comparable statistics; the preparation of policy
assessments; policy dialogue at a high and technical level; and support for implementation with policy advice tailored to specific needs of countries or sub-regional contexts.
The Global Forum on Productivity (GFP) was launched by the OECD in 2015 to foster international co-operation between public bodies with responsibility for promoting
productivity-enhancing policies. The GFP is a platform where participants convene to exchange information and data, discuss best practices and frontier-research findings, and undertake joint
productivity analysis. The work programme of the GFP is guided by a Steering Committee of countries and supported by the work of the OECD Secretariat.
BOOSTING PRODUCTIVITY AND
INCLUSIVE GROWTH IN LATIN
AMERICA
2
This document has been drafted under the responsibility of the Secretary General of the OECD, and in
collaboration with the Research Department from the Inter-American Development Bank. The opinions
expressed and arguments employed herein do not necessarily reflect the official views of both
organizations or of the governments of its member and partner countries.
This document and any map included herein are without prejudice to the status of or sovereignty over any territory, to
the delimitation of international frontiers and boundaries and to the name of any territory, city or area.
The statistical data for Israel are supplied by and under the responsibility of the relevant Israeli authorities. The use of
such data by the OECD is without prejudice to the status of the Golan Heights, East Jerusalem and Israeli settlements
in the West Bank under the terms of international law.
You can copy, download or print OECD content for your own use, and you can include excerpts from OECD publications,
databases and multimedia products in your own documents, presentations, blogs, websites and teaching materials, provided that
suitable acknowledgment of OECD as source and copyright owner is given. All requests for public or commercial use and
translation rights should be submitted to [email protected]. Requests for permission to photocopy portions of this material for
public or commercial use shall be addressed directly to the Copyright Clearance Center (CCC) at [email protected] or the
Centre français d’exploitation du droit de copie (CFC) at [email protected].
FOREWORD
3
PROLOGUE
The Challenge of Productivity and Inclusiveness in Latin America
Eight years have passed since the beginning of the so-called Great Recession and the international
economic scenario continues to be complex. The modest economic growth of developed countries was
followed by a slowdown in the economic performance of most developing countries. Latin America is no
exception. The Chinese hard landing has had a negative impact on the price of commodities, affecting both
our exports and tax revenues. As a result, the economic scenario we are facing as a region is significantly
less favorable than earlier times.
However, the post-crisis cyclic context has not been the only relevant factor in the scenario of
international economy. From the beginning of the last decade, most OECD countries have presented a
downturn on productivity growth and a setback in terms of income distribution, with the richest 10% of the
population earning, on average, 10 times more than 10% of those with lower income.
These challenges are not foreign to the landscape faced by Latin America. Productivity and
inclusiveness are, precisely, part of the most critical challenges that we must face as a region. Productivity
is one of the determining factors of high and sustained growth. For that purpose, it is essential to design
and implement good policies that increase competitiveness among our smaller-sized enterprises, foster
diversification and sophistication of the productive structure of our economies and promote the
democratization of entrepreneurship and innovation opportunities. In this manner, we will contribute to the
reduction of inequality and increase our citizens’ well-being.
This was Chile’s premise when leading – for the first time – the OECD’s 2016 Ministerial Meeting.
As the host country and under the leadership of President Michelle Bachelet, Chile proposed as the main
topic of this meeting the nexus between productivity and inclusiveness. In doing so, we aim to expand the
analysis and debate regarding these variables and the relationship that emerges between them, thus inviting
to boost the relevance and visibility of productivity and inclusion as the main objectives for public policies.
This effort is, precisely, a direct reflection of what has been happening in Chile during the last few
years. The launch and implementation of the Chilean Government’s Productivity Agenda 2014-2018,
followed by the announcement of 2016 as the Year of Productivity show the high level of priority and
commitment that Chile has concerning these matters.
With this in mind, and in collaborative work with the Organization for Economic Cooperation and
Development (OECD) and the Inter-American Development Bank (IDB), we want to take this discussion
to our region and propose the goal of increasing productivity and inclusiveness as a central part of a
collaborative work between our countries.
This document, together with the 2016 Ministerial meeting for Productivity and Inclusive Growth
hosted in Santiago, Chile, are a great opportunity for that. We trust that this dialogue will be the first step
towards a continuous work that will allow us to create more and better opportunities for our citizens.
Luis Felipe Céspedes
Chilean Minister of Economy, Development and Tourism
FOREWORD
4
FOREWORD
Over the past two decades, most Latin American and Caribbean (LAC) countries have experienced
robust economic growth, with the region expanding at a pace exceeding 3% annually. This strong
performance was largely the result of high commodity prices, sound macroeconomic policies, innovative
social policies and structural reforms. In this supportive environment, countries were able to make growth
more inclusive, with significant reductions in extreme poverty and income inequality, while social
protection, education and health services improved. However, growth in the region has gradually slowed
since 2012 to eventually turn negative in 2015, with preliminary estimates for 2016 suggesting a similar
pattern.
Even before the recent slowdown, growth in the LAC region was not strong enough to converge
towards levels of per capita income observed in advanced OECD economies. An important part of this
underperformance can be explained by differences in the dynamism of productivity between LAC and
more advanced economies. Weak productivity, should it persist, will make it very difficult to achieve
better lives for the majority of Latin American families. In addition, many citizens lack access to public
services of high quality. Helping working families with better technical and vocational education, better
access to health care and better labour-market policies will spread the benefits of enhanced productivity by
bringing everyone on board.
To reignite growth and keep the momentum of social progress, we firmly believe that governments
must focus on boosting productivity through the empowerment of all workers and the unleashing of
innovation and entrepreneurial dynamism. In this respect, the business sector can be a strategic partner in
the pursuit of inclusive productivity, with the ability to have a profound impact on the well-being of
workers while improving firms’ financial performance.
Ensuring strong productivity growth across the economy is what fundamentally matters in the
medium term. It emanates from the efficient organisation of our economies: the dynamism of our
companies; the quality of our education and research systems; the investment made in innovative
technologies; the diffusion of knowledge to stakeholders; and the availability of adequate transport
infrastructure. These patterns are already well in place in the top layers of the region’s business sectors and
universities, but too many firms still lag behind and need to be provided with the means to become more
productive.
Among top firms, strong performance has come from the integration into world trade flows and
participation in global value chains. Thanks to trade openness, most countries increased their respective
shares in world trade and extended their relationships to other regions. Integration in the world economy
however, has had large effects on jobs, skills and territories – both positive and negative – and those left
behind need to be helped with retraining and activation policies. As shown by recent research, productivity
growth has been limited to selected top performers and thus translated into growing levels of disparities
across individuals and companies.
The key to gradually reducing disparities is not increased protectionism and a retreat from global
integration, but efforts to make growth more inclusive and improve social cohesion. Reforms that focus on
improving skills, upgrading schools and eliminating extreme poverty will close the gap between the top
performers and those that lag behind. This is very much needed.
FOREWORD
5
The present publication – “Boosting Productivity and Inclusive Growth in Latin America” – portrays
the situation of many Latin American countries and discusses best-practice policies. Several salient
features emerge:
International connections through trade and investment remain essential: participation in global value
chains enables knowledge spillovers and a process of learning by doing. Links with the frontier are
unquestionably important to absorb relevant knowledge, particularly for Latin America’s large SME
sector which remains pervasively informal and limited vis-à-vis its absorption capacity.
There are also benefits to be reaped from regional trade integration and research cooperation closer to
home. When measuring today’s extent of intra-regional integration, Latin America ranks very low and
remains a sizeable outlier.
The diffusion of knowledge and technology ought to be facilitated by making it easier to do business,
notably allowing new entrants that are facing high barriers to operate and grow. A smooth business
environment would allow for effective reallocation of workers and capital from low productivity to
high productivity activities.
LAC countries need to invest more and improve access to education, as well as boost innovation and
research and development, in order to create new skills and adapt existing ones. This holds particularly
true in a context of technological change, where Latin American countries face an ever-evolving
demand for skills.
The OECD and the IDB aim to support ambitious structural reforms to propel the region into a new
era of productivity, where individuals are incentivised and supported in working smarter as opposed to
working harder. To provide ad hoc recommendations and to be closest to the Latin American transition, we
have multiplied initiatives and relationships with the region and will continue to do so.
We trust that this publication will be useful to inform the debate on future trends in Latin America
towards higher productivity and more inclusive growth. The OECD has launched the Latin America and
the Caribbean Regional Programme, which aims to support the region in increasing productivity,
enhancing social inclusion and strengthening institutions and governance. We also welcome the interest of
countries of forming a Latin American Roundtable on Productivity in the context of the OECD Global
Forum on Productivity, which will leverage on the Forum’s work and extend the space for policy dialogue.
We are certain that these initiatives could represent a major milestone in the process of tailoring better
policies for the better lives we strive to create.
Angel Gurría
Secretary-General
Organisation for Economic
Co-operation and Development
Luis Alberto Moreno
President
Inter-American Development Bank
ACKNOWLEDGEMENTS
6
ACKNOWLEDGEMENTS
This document was jointly prepared by the OECD and the IDB, in collaboration with the Global
Forum on Productivity, at the occasion of the Ministerial Meeting on Productivity in Santiago de Chile, on
December 5-6, 2016. The drafting was supervised by Patrick Lenain, Assistant Director of the Economics
Department – Country studies Branch – with support from Adrien Moutel (OECD/ECO); Jose Antonio
Ardavin, Senior Advisor for the LAC Regional Programme with support from Anna Wiersma
(OECD/GRS), as well as Angel Melguizo, Head of the Latin American and Caribbean Unit, Sebastian
Nieto-Parra, Deputy Head, and the economists of the Development Centre; all under the guidance of
Alvaro Pereira, Director of the Country Studies Branch of the OECD’s Economics Department. IDB’s
contribution was led by Alejandro Izquierdo, Senior Advisor, Research Department of the IDB, and under
the guidance of José Juan Ruiz, Chief Economist. Statistical assistance was provided by Adrien Moutel and
editorial support by Brigitte Beyeler, Anthony Bolton, Sarah Michelson and Raquel Páramo.
This report benefited from the collaborative research and work of numerous authors across a variety
of OECD directorates: Müge Adalet McGowan, Rudiger Ahrend, Dorothée Allain-Dupré, Dan Andrews,
Sonia Araujo, Jens Arnold, Rolando Avendano, Juan Carlos Benitez, Charles Cadestin, Paula Cerutti,
Chiara Criscuolo, Elena Crivellaro, Koen de Backer, Sean Dougherty, Mabel Gabriel, Paula Garda, Peter
Gal, Alberto Gonzalez Pandiella, Nick Johnstone, Andreas Kappeler, Przemyslaw Kowalski, Patrick
Lenain, Alexander Lembcke, Ángel Melguizo, Giuseppe Nicoletti, Sebastián Nieto Parra, Dirk Pilat,
Eduardo Olaberría, Joaquim Oliveira Martins, José René Orozco, Julien Reynaud, Abel Schumann, Cyrille
Schwellnus, Alain de Serres, Jonathan Timmis, Juan Vazquez Zamora, Isidora Zapata, Pluvia Zuniga. José
Juan Ruiz, Alejandro Izquierdo and Esteban Verdugo, from the IDB, authored the introductory chapter
with the helpful contribution of Alberto Gonzalez Pandiella.
The country notes also benefited from constructive scrutiny and verification by delegations to the
OECD from Chile and Mexico, as well as the Embassies in France of Argentina, Brazil, Colombia, Costa
Rica, the Dominican Republic, Panama, Paraguay, Peru and Uruguay.
The authors also wish to express their sincere gratitude to the Government of Chile and the Ministry
of Economy for their financial contributions to this project.
7
TABLE OF CONTENTS
Time to act: productivity, investment priorities and public policy ........................................................... 9
Introduction ................................................................................................................................................ 11 Methodology .............................................................................................................................................. 15 Clusters, priority reforms and development ............................................................................................... 20 The path to takeoff ..................................................................................................................................... 22 Gaps, reforms and probability of jumping ................................................................................................. 23 A continent facing a middle income trap ................................................................................................... 26 Conclusions ................................................................................................................................................ 29
Thematic chapter 1 Setting framework conditions for productivity gains ......................................... 31
Education, skills and youth in Latin America and the Caribbean .............................................................. 33 Strengthening tax policy ............................................................................................................................ 37 Fighting informality ................................................................................................................................... 40 Tackling corruption, enhancing trust and strengthening judicial effectiveness ......................................... 44 Getting institutions right: Productivity Commissions ................................................................................ 47 Governance of public investment and infrastructure ................................................................................. 50 Cities as productivity hubs: enhancing net agglomeration economies ...................................................... 54
Thematic chapter 2 Unleashing private sector productivity ................................................................ 59
Competition Policy and Regulation ........................................................................................................... 61 Digitalisation and Productivity .................................................................................................................. 65 Fostering business dynamism .................................................................................................................... 69 Investments in Technology and Innovation ............................................................................................... 73 Doing well by doing good: How can the business sector help to achieve inclusive productivity ............. 77 Reducing skill mismatches ........................................................................................................................ 80
Thematic chapter 3 Facilitating the diffusion of productivity improvements .................................... 85
GVCs, Knowledge Spillovers and Productivity ........................................................................................ 87 More coherent trade agreements for a better GVC integration .................................................................. 93
Country notes ............................................................................................................................................... 97
Argentina ................................................................................................................................................... 99 Brazil ........................................................................................................................................................ 102 Chile ......................................................................................................................................................... 105 Colombia .................................................................................................................................................. 108 Costa Rica ................................................................................................................................................ 111 Dominican Republic ................................................................................................................................ 114 Mexico ..................................................................................................................................................... 118 Panama ..................................................................................................................................................... 121 Paraguay ................................................................................................................................................... 124 Peru .......................................................................................................................................................... 127 Uruguay ................................................................................................................................................... 130
8
Tables
1. Per capita income clusters - members and jumps ............................................................................... 22 2. Requirements to reach a 75% probability of jumping ........................................................................ 27 3. An institutional 'scorecard' for promoting productivity-enhancing policies ....................................... 48
Figures
1. Evolution of relative income, TFP and factor accumulation .............................................................. 12 2. Factor accumulation is not enough, successful countries also maintained relative TFP levels. ......... 13 3. Example of the selection of candidates for Going for Growth priorities ............................................ 17 4. Clusters of per capita income in 2000 and 2012 ................................................................................. 20 5. Investment priorities differ according to income per capita levels ..................................................... 21
6. Complementarity of priorities and impact on the probability of jumping: the case of Peru ............... 25
7. Differences in priority areas between LAC and OECD countries in cluster 3 ................................... 28
8. Firms identifying difficulty filling jobs, 2015 .................................................................................... 34
9. Total tax revenues as percentage of GDP (%), 2014 .......................................................................... 37
10. Tax structures in LAC and the OECD, 2013 (%) ........................................................................... 38
11. Informality rates in Latin America, by quintile of per capita family income, 2013........................ 40
12. Occupational status in the labour market and informality, by category (2013) .............................. 41
13. Perceived level of corruption and productivity ............................................................................... 45
14. The effectiveness of the legal system is still limited ....................................................................... 46
15. Subnational government’s share of public investment, 2014 ......................................................... 51
16. Urbanisation and economic development, 1960-2014 .................................................................... 54
17. There is room to make Latin America’s regulations more conducive to competition in
order to bridge the gap in productivity ........................................................................................... 63
18. Fixed and mobile penetration in LAC countries ............................................................................. 66
19. Declining share of start-ups in most countries ................................................................................ 69
20. Policy reform can increase the employment growth of start-ups .................................................... 71
21. Investment in knowledge-based capital is lagging .......................................................................... 73
22. PCT Patent Registrations per Million Inhabitants in Selected Countries in 2013 .......................... 74
23. ESG scores differ across regions..................................................................................................... 78
24. Large scope to boost productivity by reducing skill mismatch ....................................................... 81
25. Policy reforms can help reduce skills mismatches .......................................................................... 82
26. GVC backward and forward participation in 2011 ......................................................................... 89
27. International co-invention intensity: mining and quarrying (ISIC 10 to 14), 2008-11 ................... 89
28. Firms engaged in international collaboration for innovation, by firm size, 2010-12 ...................... 90
29. Intra and extra-regional participation in GVCs ............................................................................... 93
Boxes
1. Going for growth and how to choose policy priorities ....................................................................... 16 2. Broadband Policies for Latin America and the Caribbean – A Digital Economy Toolkit .................. 67 3. Measuring skill mismatch from the OECD Survey of Adult Skills .................................................... 82

9
TIME TO ACT: PRODUCTIVITY,
INVESTMENT PRIORITIES AND
PUBLIC POLICY

10
TIME TO ACT: PRODUCTIVITY, INVESTMENT PRIORITIES AND PUBLIC POLICY
11
INTRODUCTION
In 1960, the average per capita income of the representative country in Latin America amounted to
US $ 3.130 1990 international constant Geary-Khamis dollars1. In 2010, the average per capita income of
the region exceeded $6,776 US international constant dollars and, despite the economic recession that the
region has since suffered, IDB estimates suggest that by end-2016 median per capita income in Latin
America and the Caribbean was around US $ 8,916 Geary-Khamis constant international dollars. There is
no doubt that in recent decades the region, despite its more than considerable macroeconomic volatility,
has managed to substantially increase median income levels.
Improving welfare not only has resulted in an increase in per capita income. Recent work at the Social
Department of the Inter-American Development Bank, especially the recent monograph "Realities and
Perspectives: Social Pulse of Latin America and the Caribbean 2016"2, documents social improvements
that the region has made in the last quarter century: extreme poverty has been halved (ECLAC, 2016),
infant mortality fell by 65% (World Bank, 2016), life expectancy at birth increased by almost eight years,
primary school attendance is almost universal, treated water supply now reaches 96% of households, and
two-thirds of women of working age are active in the labor market.
However, when the ability of the region to converge to per capita income levels of the most developed
economies is used as a yardstick, the balance is less encouraging. Fernández-Arias (2014) documents that
between 1960 and 2010, the per capita income gap between the representative country of the region and
the US has increased by 8%3. A decomposition of the increase in the relative income gap made by the same
author identifies low relative growth in total factor productivity as the main cause of failed real
convergence in Latin America (see Figure 1).
1 Bolt, J. and J. L. Van Zanden (2014). “The Maddison Project: Collaborative Research on Historical National Accounts.” The Economic History Review 67 (3): 627–651. http://www.ggdc.net/maddison/maddison-project/data.htm
2 Duryea, S. and M. Robles (2016). “Realities & Perspectives. Social Pulse in Latin America and the Caribbean 2016.” IDB Monograph 462.
https://publications.iadb.org/handle/11319/7863?locale-attribute=en
3 Fernández-Arias, E. (2014). “Productivity and Factor Accumulation in Latin America and the Caribbean: A Database (2014 Update).”
TIME TO ACT: PRODUCTIVITY, INVESTMENT PRIORITIES AND PUBLIC POLICY
12
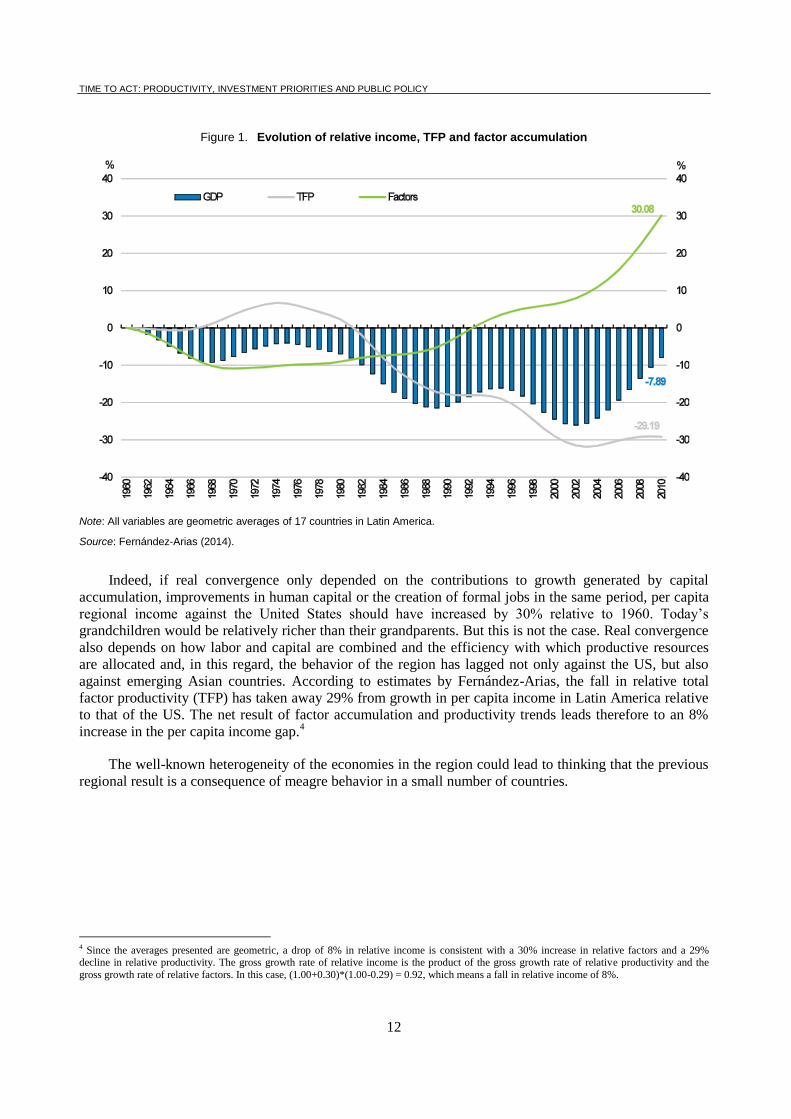
Figure 1. Evolution of relative income, TFP and factor accumulation
Note: All variables are geometric averages of 17 countries in Latin America.
Source: Fernández-Arias (2014).
Indeed, if real convergence only depended on the contributions to growth generated by capital
accumulation, improvements in human capital or the creation of formal jobs in the same period, per capita
regional income against the United States should have increased by 30% relative to 1960. Today’s
grandchildren would be relatively richer than their grandparents. But this is not the case. Real convergence
also depends on how labor and capital are combined and the efficiency with which productive resources
are allocated and, in this regard, the behavior of the region has lagged not only against the US, but also
against emerging Asian countries. According to estimates by Fernández-Arias, the fall in relative total
factor productivity (TFP) has taken away 29% from growth in per capita income in Latin America relative
to that of the US. The net result of factor accumulation and productivity trends leads therefore to an 8%
increase in the per capita income gap.4
The well-known heterogeneity of the economies in the region could lead to thinking that the previous
regional result is a consequence of meagre behavior in a small number of countries.
4 Since the averages presented are geometric, a drop of 8% in relative income is consistent with a 30% increase in relative factors and a 29% decline in relative productivity. The gross growth rate of relative income is the product of the gross growth rate of relative productivity and the
gross growth rate of relative factors. In this case, (1.00+0.30)*(1.00-0.29) = 0.92, which means a fall in relative income of 8%.
TIME TO ACT: PRODUCTIVITY, INVESTMENT PRIORITIES AND PUBLIC POLICY
13
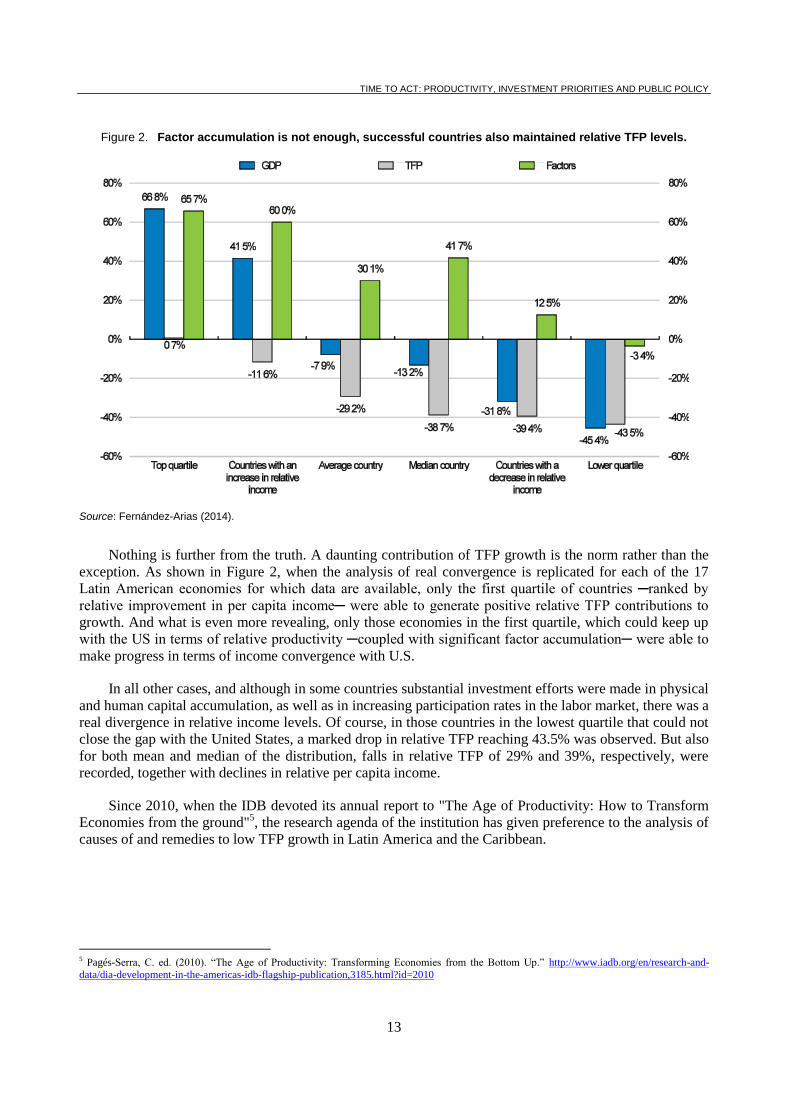
Figure 2. Factor accumulation is not enough, successful countries also maintained relative TFP levels.
Source: Fernández-Arias (2014).
Nothing is further from the truth. A daunting contribution of TFP growth is the norm rather than the
exception. As shown in Figure 2, when the analysis of real convergence is replicated for each of the 17
Latin American economies for which data are available, only the first quartile of countries ─ranked by
relative improvement in per capita income─ were able to generate positive relative TFP contributions to
growth. And what is even more revealing, only those economies in the first quartile, which could keep up
with the US in terms of relative productivity ─coupled with significant factor accumulation─ were able to
make progress in terms of income convergence with U.S.
In all other cases, and although in some countries substantial investment efforts were made in physical
and human capital accumulation, as well as in increasing participation rates in the labor market, there was a
real divergence in relative income levels. Of course, in those countries in the lowest quartile that could not
close the gap with the United States, a marked drop in relative TFP reaching 43.5% was observed. But also
for both mean and median of the distribution, falls in relative TFP of 29% and 39%, respectively, were
recorded, together with declines in relative per capita income.
Since 2010, when the IDB devoted its annual report to "The Age of Productivity: How to Transform
Economies from the ground"5, the research agenda of the institution has given preference to the analysis of
causes of and remedies to low TFP growth in Latin America and the Caribbean.
5 Pagés-Serra, C. ed. (2010). “The Age of Productivity: Transforming Economies from the Bottom Up.” http://www.iadb.org/en/research-and-
data/dia-development-in-the-americas-idb-flagship-publication,3185.html?id=2010
TIME TO ACT: PRODUCTIVITY, INVESTMENT PRIORITIES AND PUBLIC POLICY
14
The search engine of the Research Department of the IDB6 turns out 119 analytical pieces which,
from multiple macro and microeconomic prisms address TFP growth and propose mitigation policies.
These studies have established causal links between low TFP growth and, among others, labor markets
informality, firm size, low savings rates, infrastructure gaps or insufficient integration to the global
economy and in value chains.
Our analytical and operational experience has led us to consider the development of a new
methodology for identifying investment priorities and reform in countries seeking to improve their total
factor productivity. Building on lessons learned and on the analysis of the experience of successful
countries that were able to jump into development, our hypothesis is that the transition path to development
and sequencing of reforms is subject to the very different starting points that countries have in such a
diverse region as Latin America and the Caribbean.
The reference to "heterogeneity" extends not only to the different levels of per capita income of the
partner countries of the institution -for 2015, the range went from 1,750 US $ PPP in Haiti to US $ 32.635
PPP in Trinidad & Tobago7 - but especially to what the literature has called productive "capabilities". By
them we mean levels of development that countries have reached in eight sectors that constitute key
players in our priority identification strategy, as well as the interactions between each of these sectors.
These eight areas are capabilities on which governments can work horizontally and which the literature has
identified as clear determinants of productivity. We are the first to recognize that much work remains to be
done to further identify those sectors which are relevant to accelerate TFP growth, and that what we
present here is just the beginning of a potentially useful research agenda. Macro stability, security,
inequality and other "capabilities" may also play a role which, either for lack of data common to a large
sample of countries, or problems with data quality, has not been covered8.
The analysis of countries that have managed to leap to development seems to suggest, on the one
hand, that there are a number of "sectors" that must be fostered to make the leap to higher levels of welfare.
Among them are education, health, infrastructure, innovation, development of the financial system, labor
markets, trade integration and telecommunications. Based on this widely shared idea, our strategy has been
to identify those "capabilities" or sectoral priority developments in which investments are needed before
the leap takes place.
The second core idea was to explore whether in addition to capacity “levels", the probability of
jumping to higher levels of well-being depends - for better or worse - on the interactions that occur
between the different "sectoral reforms"9.
6 http://www.iadb.org/en/about-us/departments/research-department-researchers,3777.html 7 https://www.imf.org/external/pubs/ft/weo/2016/01/weodata/index.aspx 8 A very interesting discussion of the interactions between culture, science and technology can be found in Joel Mokyr, “The Gifts of Athena: Historical Origins of the Knowledge Economy”. Kindle Edition. Amazon Digital Services LLC 9 Throughout the text, the terms investments, reforms or policies are used interchangeably to designate the adoption of a horizontal public policy
that seeks to change restriction levels that a sector or group of sectors imposes over TFP growth.
TIME TO ACT: PRODUCTIVITY, INVESTMENT PRIORITIES AND PUBLIC POLICY
15
METHODOLOGY10
Based on the fact that much of the relative income gap prevailing in most countries in the Region is
explained by slow TFP growth, the question we want to answer is in which sectors and through which
policies governments could help accelerate productivity growth and therefore income.
The question is complex because, as we have anticipated, the impact on income that certain “reforms"
may have could be conditional on "capabilities" accumulated in other sectors of the economy. Hausmann,
Rodrik and Velasco (2005) have highlighted the existence of nonlinear effects between "reforms" and,
more specifically, that the elimination of constraints in one sector may not always lead to improvements in
overall productivity if other constraints persist in other segments of the economy11
.
Identifying constraints to growth has been mostly an empirical matter. Our identification rests on what
we have learned from analyzing what successful countries did in the past to become higher income
economies. Among the approaches most commonly used in recent times are Growth Diagnostics by
Hausmann, Rodrik and Velasco (2005), which associate slow economic growth with persistently low
investment rates that are explained by the existence of low investment returns, inappropriate property
rights that prevent the appropriation of returns, or inadequate access to financing.
The OECD uses its own methodology, Going for Growth (2005), to identify reform recommendations
to member countries12
. In this case, the methodology identifies for each member country policy and
outcome gaps that a country has against de OECD average in a broad spectrum of sectors related to
productivity (see box)13
. Using this approach since 2005, Going for Growth has been offering five priority
reforms both for OECD countries as well as for an increasing number of emerging markets, as shown in
the country profiles to be presented later in the text.
10 A full description of the methodology can be found in Izquierdo et al (2016). The complete database used in this paper can be accessed at “Database Priorities for Productivity and Income (PPIs)” https://publications.iadb.org/handle/11319/7407. At http://www.iadb.org/ppi an
application can be downloaded to simulate results for all countries included in the study, understand which are the gaps of any country with respect
to the next per capita income group, and study how the probability of jumping changes at different investments levels of any investment priority
11 Hausmann, R., D. Rodrik, and A. Velasco (2005). “Growth Diagnostics.” Cambridge, United States: Harvard University, John F. Kennedy School of Government. Available at: http://ksghome.harvard.edu/~drodrik/barcelonafinalmarch2005.pdf
12 Organisation for Economic Co-operation and Development (OECD) (2005). “Economic Policy Reforms 2005: Going for Growth.” Paris, France:
OECD. See also the box in this section explaining the methodology in more detail
13 In fact, this approach has been the starting point to define the selection of sectors that determine productivity in IDB’s methodology.
TIME TO ACT: PRODUCTIVITY, INVESTMENT PRIORITIES AND PUBLIC POLICY
16
Box 1. Going for growth and how to choose policy priorities
Going for growth is one of the OECD flagship publications and it aims at providing countries with an exhaustive review of policies and performances, with the goal of helping government design policy packages to achieve higher standards of living for all citizens (OECD, 2015). To do so, the Going for Growth exercise seeks to identify the key reforms and priorities to increase real wages and employment, both for advanced and emerging economies. The policy areas considered include product and labour market regulation, human capital, tax and benefits systems, trade and investment rules and innovation policies.
Five priorities are identified for each country. The starting point is a detailed examination of the labour utilisation and productivity performance archived by each country, along with some of their underlying components (e.g. the labour force situation of specific groups – young or women – as concerns labour utilisation, or investment in information and communications technology in the case of productivity). This enables to uncover specific areas of relative strength and weaknesses for individual countries. The next step in the process is to juxtapose these performance indicators with the corresponding policy indicators. This is done based on empirical analysis, where clear and robust links between performance and policy weaknesses have been established. For instance, based on Bourles et al. (2010) and Arnold et al. (2008), the multifactor productivity (performance indicator) is matched with product market regulation indicators such as administrative burdens to business entrepreneurship or barriers to entry in the professional services (policy indicators).
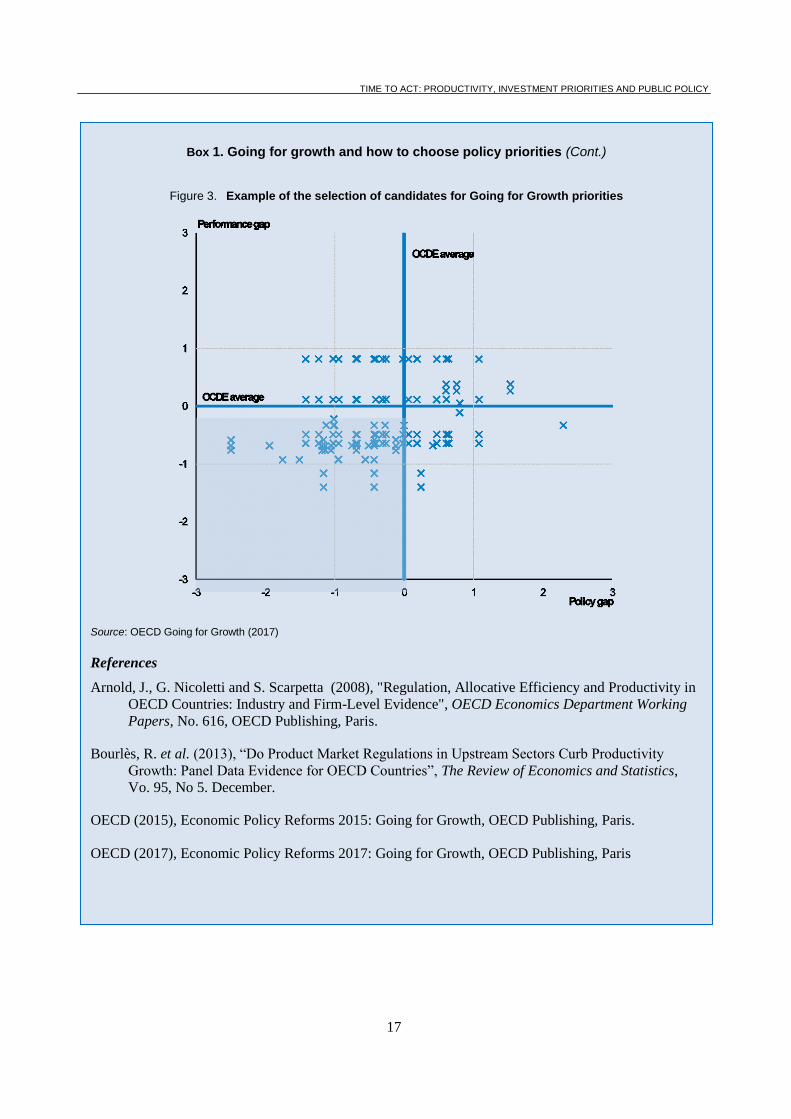
Figure 3 shows an example for an OECD country. Through a scatter plot, we display the pairing of policy indicators (horizontal axis) with corresponding performance indicators (vertical axis). The indicators are standardized and re-scaled so that each has a mean of zero and a cross country standard deviation of one. Positive numbers represent positions more growth –friendly than the OECD average. The plot can be divided in four quadrants, depending on whether the policy-performance pairing is above or below the average policy or performance score. Policy areas that are located within the lower-left quadrant (shaded area) are candidates for recommendations.
This quantitative analysis, carried out for the more than 50 areas covered by OECD indicators, leads to a list of policy areas that qualify as potential priorities. The quantitative analysis is then complemented by a qualitative analysis, whose objective is to take into account country-specific characteristics and which relies on expertise provided by country specialists through their continuous monitoring of each country. Thus, five policy priorities are finally identified for each country based on theoretical and empirical considerations and taken into account particular country circumstances.
The empirical body on which Going for Growth is based has been progressively expanded as new evidence becomes available. The need to achieve more inclusive growth patterns has also been gradually incorporated into the framework (OECD, 2017). Going for Growth, has also been increasing its coverage of Latin American countries. Brazil, Chile, Colombia and Mexico have featured in several issues of Going for Growth. Argentina and Costa Rica feature for the first time in the 2017 edition.
(Cont…)
TIME TO ACT: PRODUCTIVITY, INVESTMENT PRIORITIES AND PUBLIC POLICY
17
Box 1. Going for growth and how to choose policy priorities (Cont.)
Figure 3. Example of the selection of candidates for Going for Growth priorities
Source: OECD Going for Growth (2017)
References
Arnold, J., G. Nicoletti and S. Scarpetta (2008), "Regulation, Allocative Efficiency and Productivity in
OECD Countries: Industry and Firm-Level Evidence", OECD Economics Department Working
Papers, No. 616, OECD Publishing, Paris.
Bourlès, R. et al. (2013), “Do Product Market Regulations in Upstream Sectors Curb Productivity
Growth: Panel Data Evidence for OECD Countries”, The Review of Economics and Statistics,
Vo. 95, No 5. December.
OECD (2015), Economic Policy Reforms 2015: Going for Growth, OECD Publishing, Paris.
OECD (2017), Economic Policy Reforms 2017: Going for Growth, OECD Publishing, Paris
TIME TO ACT: PRODUCTIVITY, INVESTMENT PRIORITIES AND PUBLIC POLICY
18
Finally, country strategies carried out by the IDB have used the Gap Approach (Borensztein et al (2014))
which, after controlling for income-per-capita levels, identifies sectoral social and economic indicators that
diverge notoriously from the levels they should attain given the per-capita income level of the country
under analysis.14
The new IDB approach ─also known as priorities for Productivity and Income, or PPI─ builds on the
abovementioned foundations and makes progress in solving three outstanding issues in the previous
literature:
Wider gaps do not necessarily imply restrictions on development: There are several cases in
which very significant "gaps" have not prevented certain countries from achieving and sustaining
high growth rates over time to reach new levels of development.
While other methodologies try to find out why the rate of factor accumulation - investment
efforts, job creation, and quality of human capital - is inappropriate, they do not focus directly on
what is of interest to us: slow TFP growth.
Previous work does not explicitly model interactions between determinants of productivity,
which can be very useful when deciding on how to address accumulation of capabilities.
These reasons led us to build a new approach aimed at analyzing determinants of TFP growth and the
impact that each of these determinants has -alone and together- on the likelihood that a country will jump
to a higher level of per capita income, following the methodology used in Izquierdo et al (2016)15
. A
prominent feature of this methodology is that it implicitly allows for evaluation of the potential
contribution of each of the sectors involved in increasing per capita income.
Specifically, our goal was to attempt answering four basic questions:
What separates successful countries from those that lag behind?
Do investment priorities change as a country’s level of development changes?
Which reforms affecting productivity have the greatest impact on per capita income levels in the
medium term?
Are there any interactions between the various reforms that may shorten the transition period
towards development?
To carry out the analysis16
we estimated a Generalized Ordered Probit model that "learns" from
differences between groups of countries at different income per capita levels and identifies which sectoral
enhancements or reforms lead to higher income levels and maximize chances of jumping to the next
income group.
14 Borensztein, E., S. Miller, G. Sánchez, and P. Valenzuela (2014). “Development Diagnostics for the Southern Cone.” Working Paper IDB-WP-516. Washington, DC, United States: Inter-American Development Bank.
15 Izquierdo, A., J. Llopis, U. Muratori, and J. Ruiz (2016). “In Search of Larger Per Capita Incomes: How To Prioritize across Productivity
Determinants?” Working Paper IDB-WP-680. Washington, DC, United States: Inter-American Development Bank.
16 For details see Izquierdo et al (2016).
TIME TO ACT: PRODUCTIVITY, INVESTMENT PRIORITIES AND PUBLIC POLICY
19
The empirical strategy pursued here -conditioned by limited data availability- focused on Latin
America and the Caribbean and OECD countries, leaving aside recent experiences in Africa and Asia
(except for the case of South Korea, current member of the OECD), as well as those European experiences
going further back in time -between 1950 and 1999. Applying this methodology to all of these cases would
require close collaboration between multilateral institutions - Asian Development Bank, African
Development Bank, World Bank and OECD – indeed a very high added value product.
The sample used to identify successful cases includes 30 OECD member countries and 19 countries in
Latin America and the Caribbean17
. For all of them, a database containing 34 indicators18
was compiled to
take the pulse of performance in 8 sectors: Innovation, Capital Markets, Infrastructure, Health,
Telecommunications, Labor Markets, Education and Integration and Trade. The period covered by these
time series runs from 2000 to 2012.
Countries were grouped into different income per capita clusters. That is, in each cluster we include
countries that share similar levels of per capita income. The chosen number of clusters was obtained by
minimizing the distance within members of a cluster, and maximizing the distance between clusters19
.
Four clusters were identified in our analysis.
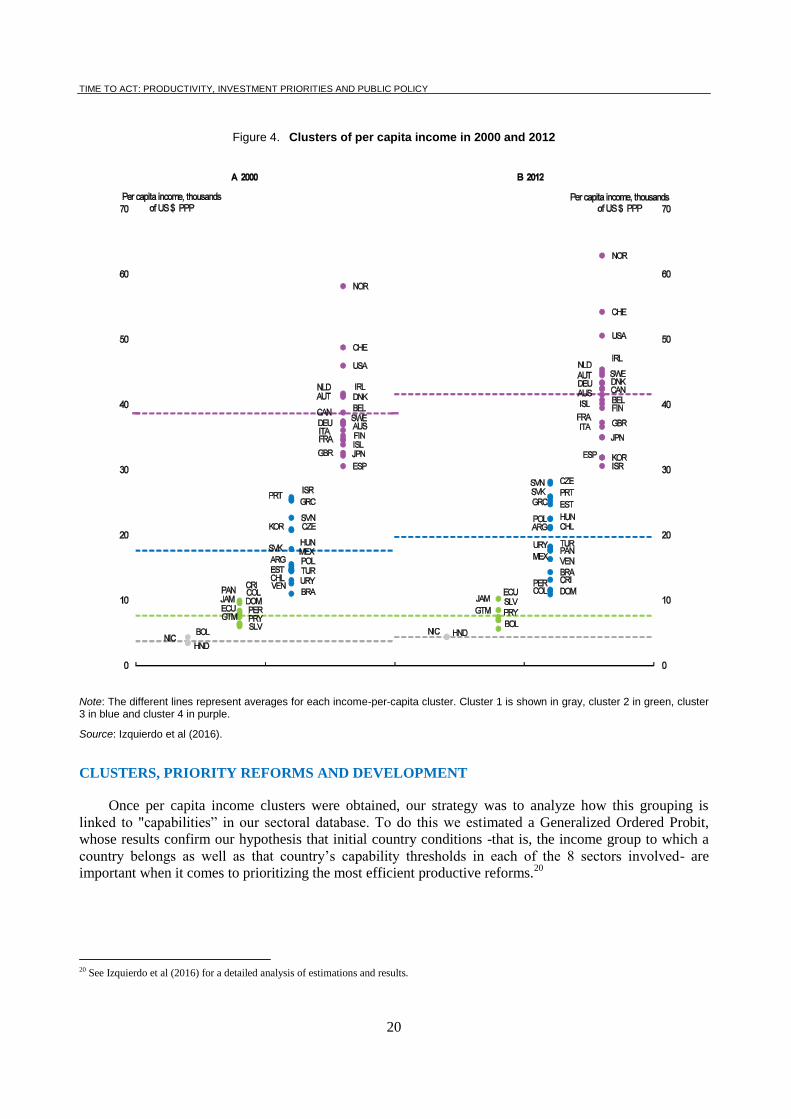
Cluster 1 has a peak of US$ 5,278 PPP which corresponds to Bolivia’s income in 2010. The range of
cluster 2 goes from US $ 5,461 PPP ─representing Bolivia in 2011─ and US$ 10,779 PPP ─marked by
Colombia’s income in 2010. The range for cluster 3 goes from Peru’s US$ 10,912 PPP in 2012 to the
Czech Republic’s US$ 28.976 PPP in 2008. The lower bound for cluster 4 is US$ 29.337 PPP, which
corresponds to Israel in 2010.
Figure 4 shows countries classified by clusters. As can be seen, all Latin American and Caribbean
countries are located either in cluster 1 (lowest income) cluster 2, or 3 (highest Latin American income).
Regarding OECD countries, most of them belong to cluster 4 -which can be considered the developed
country cluster- except for Slovakia, Slovenia, Estonia, Greece, Hungary, Poland, Portugal, Czech
Republic and Turkey, which belong to cluster 3.
17 The 19 countries of Latin America and the Caribbean are Argentina, Bolivia, Brazil, Chile, Colombia, Costa Rica, Dominican Republic,
Ecuador, El Salvador, Guatemala, Honduras, Jamaica, Mexico, Nicaragua, Panama, Paraguay, Peru, Uruguay and Venezuela. The 30 OECD countries are Australia, Austria, Belgium, Canada, Czech Republic, Denmark, Estonia, Finland, France, Germany, Greece, Hungary, Iceland,
Ireland, Israel, Italy, Japan, Korea, Netherlands, Norway, Poland, Portugal, Slovak Republic, Slovenia, Spain, Sweden, Switzerland, Turkey,
United Kingdom and United States. The absence of sectoral data in Caribbean countries forced us to exclude most of these economies, except for the Dominican Republic and Jamaica. However, the methodology can be used for those countries excluded with out-of-sample predictions.
18 Initially, we started with a list of 83 indicators that were identified by the IDB Sector Divisions. Unfortunately, not all of them were available for
the entire sample and we had to discard many of them. See Izquierdo et al (2016) for details on the indicators used, which are the basis on which
sectoral indicators were constructed. These indicators are available at http://www.iadb.org/en/databases/res-ppis/ppis-individual-indicators-comparison,20134.html Currently, the IDB is working on the construction of additional indicators for innovation, formality in labor markets,
market regulation of goods and factors, and competition. At a later stage we will try to incorporate indicators of public safety, crime and
corruption, as well as institutional strength and responsiveness to internal and external macroeconomic shocks.
19 The use of clusters has two objectives: first, it allows for the existence of discontinuities and/or nonlinearities in the process of increases in per capita income that will be exploited in Probit estimates. Second, it offers precise jump goals as it clearly identifies the next contiguous group to
reach. This lets the comparison of productivity determinants be both precise and realistic, since instead of using sample averages to establish
whether a country is lagging in a particular sector -as other methodologies do- our methodology exploits differences between a particular cluster and the following clusters. This allows for the existence of strong heterogeneity in the group of countries to be analyzed -a fundamental
characteristic of Latin American economies- without problems in the identification of priorities, something that may be more difficult to achieve
with methodologies that use sample means for the identification of priorities, given that there may be cases of high sample heterogeneity in which low-income countries within a sample of rich countries may find themselves below average in a large number of sectors. See Izquierdo et al (2016)
for details.
TIME TO ACT: PRODUCTIVITY, INVESTMENT PRIORITIES AND PUBLIC POLICY
20
Figure 4. Clusters of per capita income in 2000 and 2012
Note: The different lines represent averages for each income-per-capita cluster. Cluster 1 is shown in gray, cluster 2 in green, cluster 3 in blue and cluster 4 in purple.
Source: Izquierdo et al (2016).
CLUSTERS, PRIORITY REFORMS AND DEVELOPMENT
Once per capita income clusters were obtained, our strategy was to analyze how this grouping is
linked to "capabilities” in our sectoral database. To do this we estimated a Generalized Ordered Probit,
whose results confirm our hypothesis that initial country conditions -that is, the income group to which a
country belongs as well as that country’s capability thresholds in each of the 8 sectors involved- are
important when it comes to prioritizing the most efficient productive reforms.20
20 See Izquierdo et al (2016) for a detailed analysis of estimations and results.
TIME TO ACT: PRODUCTIVITY, INVESTMENT PRIORITIES AND PUBLIC POLICY
21
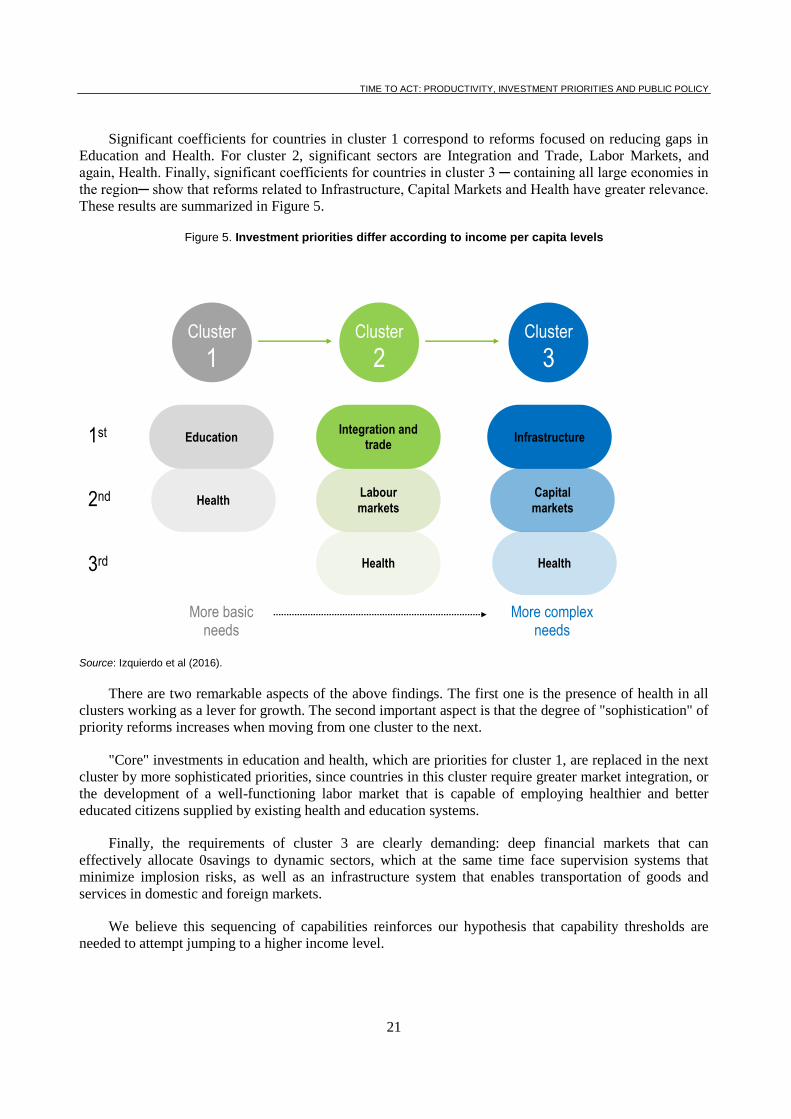
Significant coefficients for countries in cluster 1 correspond to reforms focused on reducing gaps in
Education and Health. For cluster 2, significant sectors are Integration and Trade, Labor Markets, and
again, Health. Finally, significant coefficients for countries in cluster 3 ─ containing all large economies in
the region─ show that reforms related to Infrastructure, Capital Markets and Health have greater relevance.
These results are summarized in Figure 5.
Figure 5. Investment priorities differ according to income per capita levels
Source: Izquierdo et al (2016).
There are two remarkable aspects of the above findings. The first one is the presence of health in all
clusters working as a lever for growth. The second important aspect is that the degree of "sophistication" of
priority reforms increases when moving from one cluster to the next.
"Core" investments in education and health, which are priorities for cluster 1, are replaced in the next
cluster by more sophisticated priorities, since countries in this cluster require greater market integration, or
the development of a well-functioning labor market that is capable of employing healthier and better
educated citizens supplied by existing health and education systems.
Finally, the requirements of cluster 3 are clearly demanding: deep financial markets that can
effectively allocate 0savings to dynamic sectors, which at the same time face supervision systems that
minimize implosion risks, as well as an infrastructure system that enables transportation of goods and
services in domestic and foreign markets.
We believe this sequencing of capabilities reinforces our hypothesis that capability thresholds are
needed to attempt jumping to a higher income level.
Cluster
2
More basic needs
More complex needs
Cluster
1
Cluster
3
Health
Education
Health
Capital
markets
Infrastructure
Health
Labour
markets
Integration and trade
1st
2nd
3rd
TIME TO ACT: PRODUCTIVITY, INVESTMENT PRIORITIES AND PUBLIC POLICY
22
THE PATH TO TAKEOFF
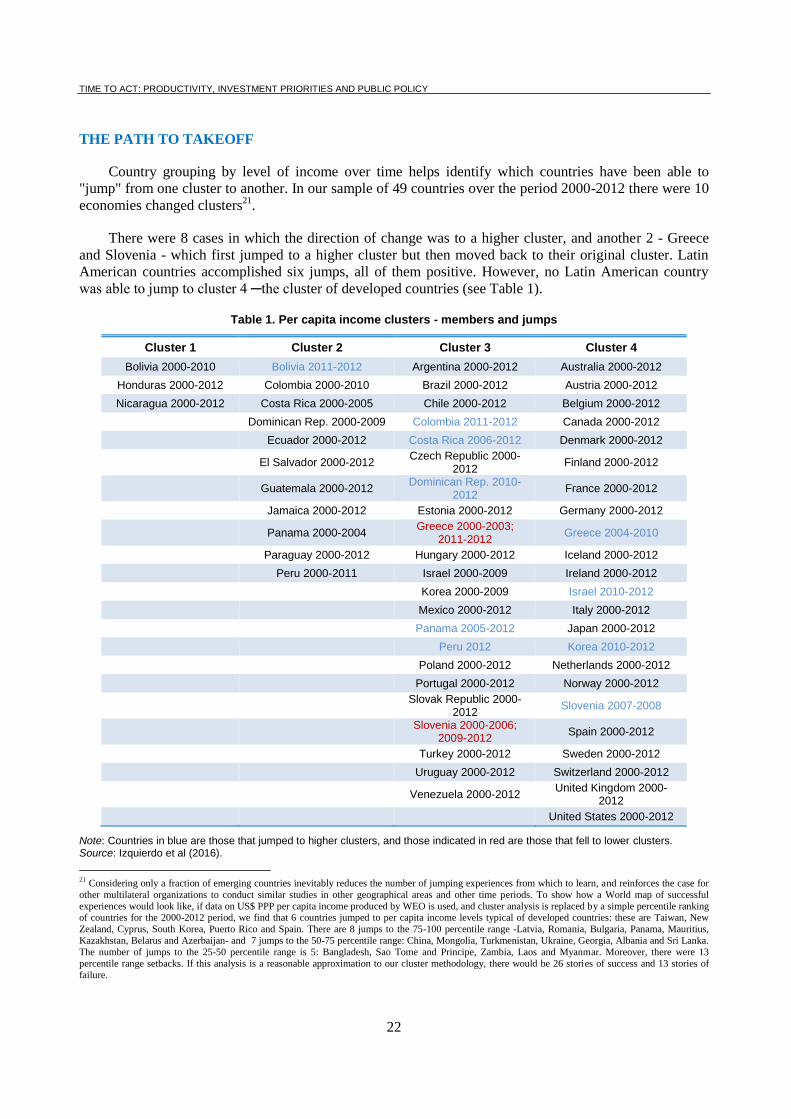
Country grouping by level of income over time helps identify which countries have been able to
"jump" from one cluster to another. In our sample of 49 countries over the period 2000-2012 there were 10
economies changed clusters21
.
There were 8 cases in which the direction of change was to a higher cluster, and another 2 - Greece
and Slovenia - which first jumped to a higher cluster but then moved back to their original cluster. Latin
American countries accomplished six jumps, all of them positive. However, no Latin American country
was able to jump to cluster 4 ─the cluster of developed countries (see Table 1).
Table 1. Per capita income clusters - members and jumps
Cluster 1 Cluster 2 Cluster 3 Cluster 4
Bolivia 2000-2010 Bolivia 2011-2012 Argentina 2000-2012 Australia 2000-2012
Honduras 2000-2012 Colombia 2000-2010 Brazil 2000-2012 Austria 2000-2012
Nicaragua 2000-2012 Costa Rica 2000-2005 Chile 2000-2012 Belgium 2000-2012
Dominican Rep. 2000-2009 Colombia 2011-2012 Canada 2000-2012
Ecuador 2000-2012 Costa Rica 2006-2012 Denmark 2000-2012
El Salvador 2000-2012
Czech Republic 2000-2012
Finland 2000-2012
Guatemala 2000-2012
Dominican Rep. 2010-2012
France 2000-2012
Jamaica 2000-2012 Estonia 2000-2012 Germany 2000-2012
Panama 2000-2004
Greece 2000-2003; 2011-2012
Greece 2004-2010
Paraguay 2000-2012 Hungary 2000-2012 Iceland 2000-2012
Peru 2000-2011 Israel 2000-2009 Ireland 2000-2012
Korea 2000-2009 Israel 2010-2012
Mexico 2000-2012 Italy 2000-2012
Panama 2005-2012 Japan 2000-2012
Peru 2012 Korea 2010-2012
Poland 2000-2012 Netherlands 2000-2012
Portugal 2000-2012 Norway 2000-2012
Slovak Republic 2000-
2012 Slovenia 2007-2008
Slovenia 2000-2006;
2009-2012 Spain 2000-2012
Turkey 2000-2012 Sweden 2000-2012
Uruguay 2000-2012 Switzerland 2000-2012
Venezuela 2000-2012
United Kingdom 2000-2012
United States 2000-2012
Note: Countries in blue are those that jumped to higher clusters, and those indicated in red are those that fell to lower clusters. Source: Izquierdo et al (2016).
21
Considering only a fraction of emerging countries inevitably reduces the number of jumping experiences from which to learn, and reinforces the case for
other multilateral organizations to conduct similar studies in other geographical areas and other time periods. To show how a World map of successful
experiences would look like, if data on US$ PPP per capita income produced by WEO is used, and cluster analysis is replaced by a simple percentile ranking of countries for the 2000-2012 period, we find that 6 countries jumped to per capita income levels typical of developed countries: these are Taiwan, New
Zealand, Cyprus, South Korea, Puerto Rico and Spain. There are 8 jumps to the 75-100 percentile range -Latvia, Romania, Bulgaria, Panama, Mauritius,
Kazakhstan, Belarus and Azerbaijan- and 7 jumps to the 50-75 percentile range: China, Mongolia, Turkmenistan, Ukraine, Georgia, Albania and Sri Lanka.
The number of jumps to the 25-50 percentile range is 5: Bangladesh, Sao Tome and Principe, Zambia, Laos and Myanmar. Moreover, there were 13
percentile range setbacks. If this analysis is a reasonable approximation to our cluster methodology, there would be 26 stories of success and 13 stories of
failure.
TIME TO ACT: PRODUCTIVITY, INVESTMENT PRIORITIES AND PUBLIC POLICY
23
The analysis of Latin American economies suggests that between 2000 and 2012 there were two types
of experiences:
On the one hand, countries like Bolivia, Peru, Colombia, Costa Rica, Dominican Republic and
Panama made the leap to higher income clusters,
On the other hand, countries that ─even though they closed some of the gap separating them from
the next cluster─ were not able to leave their starting cluster behind. In this category are:
Honduras and Nicaragua in cluster 1; Ecuador, El Salvador, Guatemala, Jamaica and Paraguay in
cluster 2; and most of the large economies in the region, namely Argentina, Brazil, Chile,
Mexico, Uruguay and Venezuela in cluster 3.
In the next section we discuss the cases of successful countries and how they "played" their game in
the sectors identified as priorities to achieve success. All data presented are normalized and gaps are
expressed in standard deviations. The effort required to close any of the gaps is not quantified in terms of
the time required for reforms to reach their objective, or in terms of economic cost. That goal is beyond the
scope of this methodology. Our objective is more limited: to provide a uniform approach to identify the
distance in priority sectors that separates a country from reaching the next cluster.
GAPS, REFORMS AND PROBABILITY OF JUMPING
Bolivia was the only country in cluster 1 that was able to make the leap to cluster 2. Bolivia is an
economy of about 11 million citizens and a GDP that in 2016 stood at around US$78 billion PPP.
Throughout the analyzed period its per capita income grew at a cumulative average rate of 2.3%, nearly
triple the size of its historical average.
In terms of its sectoral synthetic indicator (calculated as the average of sectoral indicators), Bolivia
was in 2000 in a slightly worse departure point than Honduras, one of its two cluster companions. In terms
of the two priority sectors for cluster 1 countries -education and health- the situation was quite different:
while Education was much better than in Nicaragua and Honduras, the situation in terms of Health was
clearly unsatisfactory. The evolution of sectoral indicators suggests that Bolivia’s strategy -implicitly or
explicitly- in the next 13 years was to close the gap in Health and maintain its comparative advantage in
Education. At the end of the period, Bolivia had been able to reduce the gap in health by more than 50%.
There are two possible lessons stemming from the Bolivian case. The first one is that the country
jumped to an upper echelon of income without its synthetic aggregate indicator being above the average of
the income cluster it was leaving. In fact, by 2012 the gap in this indicator had increased slightly from that
recorded in 2000. The second lesson is that although the priority was investment in Health, at the time of
its jump Bolivia was already relatively well positioned in those priorities belonging to cluster 2. Bolivia
now stands next to the cluster average in terms of Integration and Trade, and has better indicators in Labor
Markets. Probably this circumstance helps explain why Bolivia’s probability of jumping to cluster 3 is
similar to that of other economies that have belonged to cluster 2 for some time -for example, Jamaica- but
that seem to have had more diffuse reform strategies.
TIME TO ACT: PRODUCTIVITY, INVESTMENT PRIORITIES AND PUBLIC POLICY
24
Our model predicts that Bolivia’s probability of jumping to cluster 3 is low for now, which makes
sense because Bolivia just entered cluster 2. To take that chance to 50%, Bolivia would need to reduce
either its Health gap by more than 2 standard deviations, or its Integration and Trade gap by just over 1.25
deviations, and a similar amount would be needed for Labor Markets. Taken one by one, all these reforms
seem very demanding challenges. Hence the relevance of the question posed about the possibility that
interaction between reforms could reduce the "severity" of the development strategy. In the case of Bolivia,
our model predicts that reforms of just half a standard deviation in all three priorities (Integration and
Trade, Labor Markets and Health) tackled simultaneously ─indeed an easier outcome to attain─ would
also increase Bolivia’s likelihood of jumping to around 50%. In order for that probability to reach 75%,
gaps in priority sectors should close by 1, 0.5 and 0.5 standard deviations respectively.22
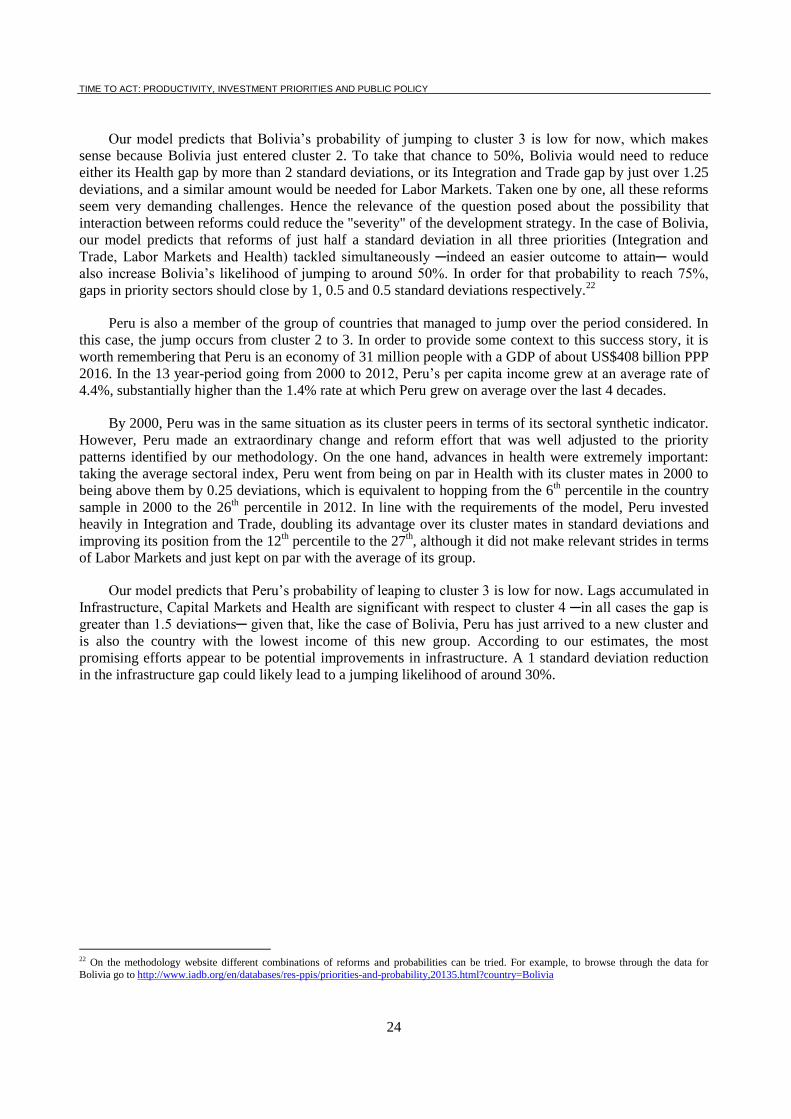
Peru is also a member of the group of countries that managed to jump over the period considered. In
this case, the jump occurs from cluster 2 to 3. In order to provide some context to this success story, it is
worth remembering that Peru is an economy of 31 million people with a GDP of about US$408 billion PPP
2016. In the 13 year-period going from 2000 to 2012, Peru’s per capita income grew at an average rate of
4.4%, substantially higher than the 1.4% rate at which Peru grew on average over the last 4 decades.
By 2000, Peru was in the same situation as its cluster peers in terms of its sectoral synthetic indicator.
However, Peru made an extraordinary change and reform effort that was well adjusted to the priority
patterns identified by our methodology. On the one hand, advances in health were extremely important:
taking the average sectoral index, Peru went from being on par in Health with its cluster mates in 2000 to
being above them by 0.25 deviations, which is equivalent to hopping from the 6th percentile in the country
sample in 2000 to the 26th percentile in 2012. In line with the requirements of the model, Peru invested
heavily in Integration and Trade, doubling its advantage over its cluster mates in standard deviations and
improving its position from the 12th percentile to the 27
th, although it did not make relevant strides in terms
of Labor Markets and just kept on par with the average of its group.
Our model predicts that Peru’s probability of leaping to cluster 3 is low for now. Lags accumulated in
Infrastructure, Capital Markets and Health are significant with respect to cluster 4 ─in all cases the gap is
greater than 1.5 deviations─ given that, like the case of Bolivia, Peru has just arrived to a new cluster and
is also the country with the lowest income of this new group. According to our estimates, the most
promising efforts appear to be potential improvements in infrastructure. A 1 standard deviation reduction
in the infrastructure gap could likely lead to a jumping likelihood of around 30%.
22 On the methodology website different combinations of reforms and probabilities can be tried. For example, to browse through the data for
Bolivia go to http://www.iadb.org/en/databases/res-ppis/priorities-and-probability,20135.html?country=Bolivia
TIME TO ACT: PRODUCTIVITY, INVESTMENT PRIORITIES AND PUBLIC POLICY
25
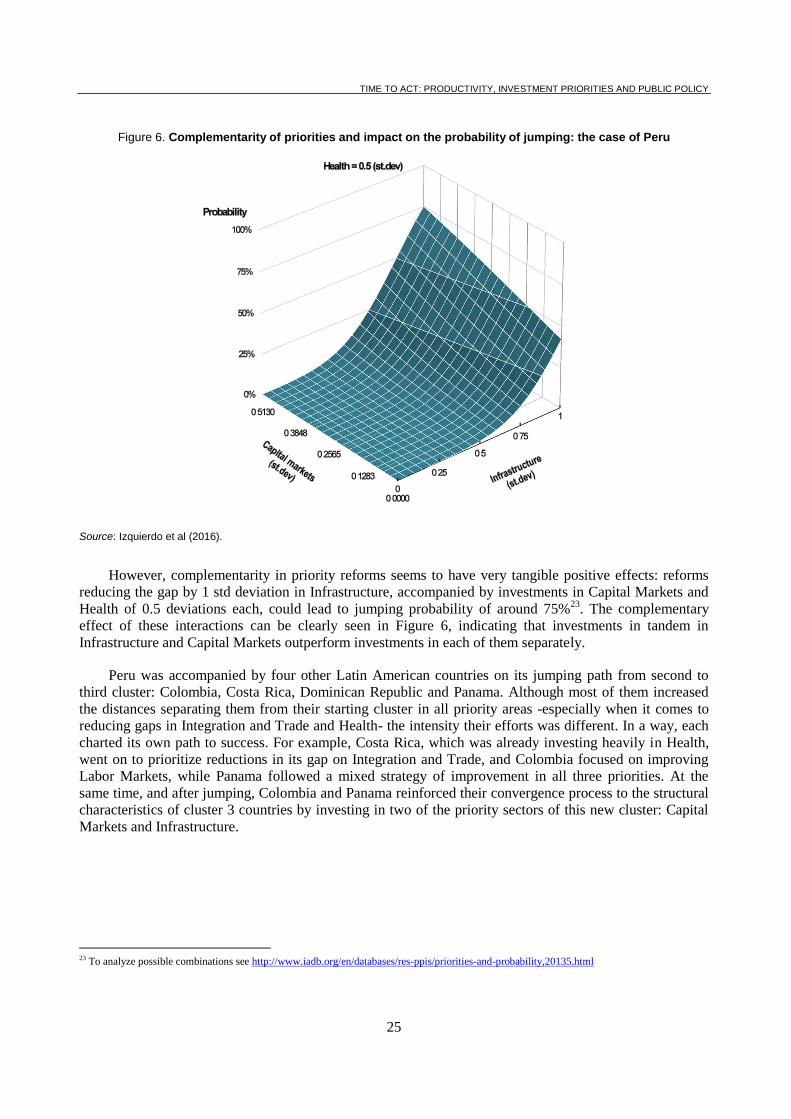
Figure 6. Complementarity of priorities and impact on the probability of jumping: the case of Peru
Source: Izquierdo et al (2016).
However, complementarity in priority reforms seems to have very tangible positive effects: reforms
reducing the gap by 1 std deviation in Infrastructure, accompanied by investments in Capital Markets and
Health of 0.5 deviations each, could lead to jumping probability of around 75%23
. The complementary
effect of these interactions can be clearly seen in Figure 6, indicating that investments in tandem in
Infrastructure and Capital Markets outperform investments in each of them separately.
Peru was accompanied by four other Latin American countries on its jumping path from second to
third cluster: Colombia, Costa Rica, Dominican Republic and Panama. Although most of them increased
the distances separating them from their starting cluster in all priority areas -especially when it comes to
reducing gaps in Integration and Trade and Health- the intensity their efforts was different. In a way, each
charted its own path to success. For example, Costa Rica, which was already investing heavily in Health,
went on to prioritize reductions in its gap on Integration and Trade, and Colombia focused on improving
Labor Markets, while Panama followed a mixed strategy of improvement in all three priorities. At the
same time, and after jumping, Colombia and Panama reinforced their convergence process to the structural
characteristics of cluster 3 countries by investing in two of the priority sectors of this new cluster: Capital
Markets and Infrastructure.
23 To analyze possible combinations see http://www.iadb.org/en/databases/res-ppis/priorities-and-probability,20135.html
TIME TO ACT: PRODUCTIVITY, INVESTMENT PRIORITIES AND PUBLIC POLICY
26
A CONTINENT FACING A MIDDLE INCOME TRAP
The cluster hops described above have led to the fact that by 2012 11 out of the 19 countries of Latin
America and the Caribbean analyzed here are now included in cluster 3, which groups together middle-
income countries on the entryway to the developed country cluster. This third cluster includes not only the
aforementioned Latin American countries, but also economies such as the Czech Republic, Greece, Poland
and Portugal.
Latin America's uniqueness is that its largest economies -Brazil, Mexico, Argentina and Chile- have
belonged to this cluster for more than a decade, and despite advances in shortening their distance to the
frontier, they have not yet been able to jump to development. This has popularized the idea -and fears- that
much of the continent is caught in a sort of Middle Income Trap.
This becomes evident when estimating the odds of jumping of the different countries of Latin
America without any additional investments in priorities, as shown in Table 2. While for countries in the
first and second clusters the probability of jumping ranges from 5.6% to 95% without additional
investments ─and is 39.9% on average─ for all Latin American countries in the third cluster the likelihood
of jumping is practically nil, except for Chile ─whose probability is 24%─ which brings the average
probability of this third group to only 2.4%.
Another way to see the middle-income country trap is the strong need for investment that Latin
American countries in the third cluster face if they wanted to increase their chances of jumping to fourth
cluster of developed countries to 75%. While countries in the first cluster are already at high levels in their
likelihood of jumping to the next group even without major reforms, and countries in the second cluster
need between 0.45 and 2.1 deviations in investments in priority areas to take increase their chance of
jumping to 75%, Latin American countries in the third cluster need between 0.35 and 4.725 deviations to
meet the same objective. In several cases of the third cluster, these values are much higher than those of the
lowest income groups, revealing the hard work ahead for cluster 3 countries to jump to development.
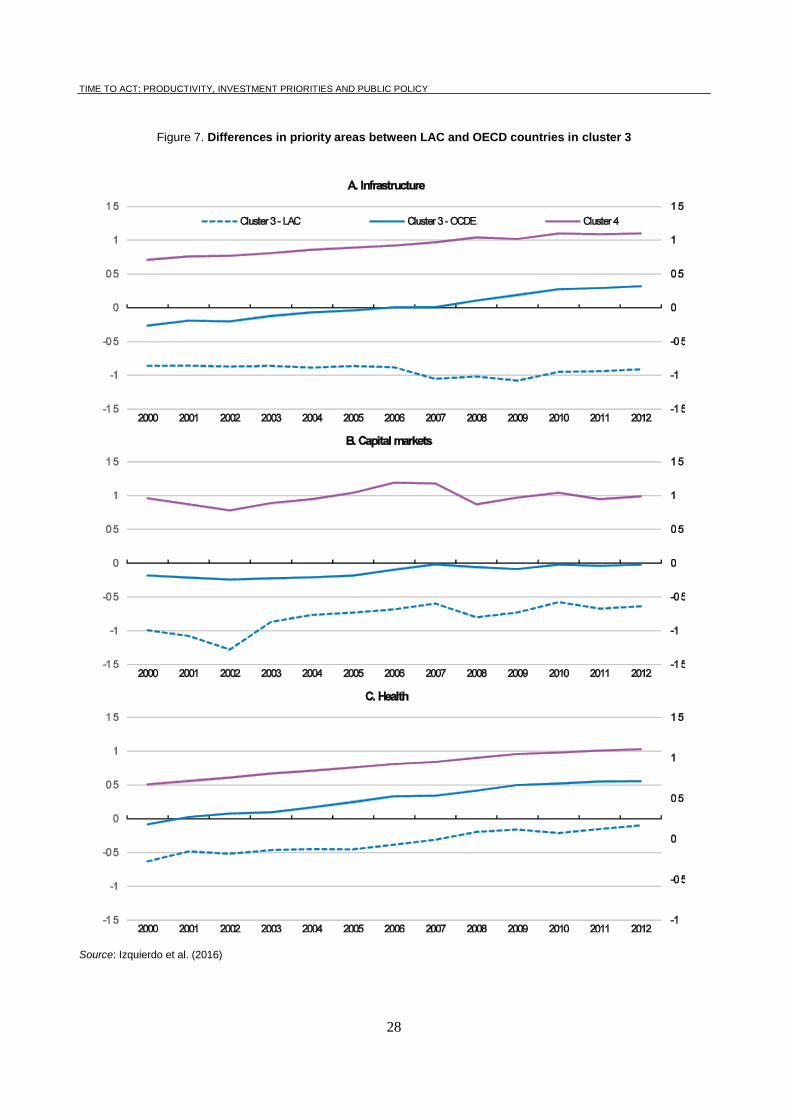
Perhaps most important yet is the difference within countries that make up cluster 3. Using the three
priorities of this group as a yardstick, countries in Latin America and the Caribbean (LAC) are, on average,
a great distance from OECD countries that also belong to this group. This is evident in Figure 7, which
clearly shows the existence of a gap of 1.23 deviations between LAC and OECD countries in
Infrastructure, a gap of 0.61 deviations in Capital Markets, as well as a gap of 0.65 deviations in Health.
Gaps between LAC and the average of group 4 are even greater: 2 standard deviations in Infrastructure,
1.63 deviations in Capital Markets, and 1.13 deviations in Health. This indicates that even within Group 3,
chances of jumping for LAC countries are significantly lower than for OECD countries. Moreover, the
distance separating LAC countries in cluster 3 from the group of developed countries in these priority areas
calls for significant investments in the coming years.
TIME TO ACT: PRODUCTIVITY, INVESTMENT PRIORITIES AND PUBLIC POLICY
27
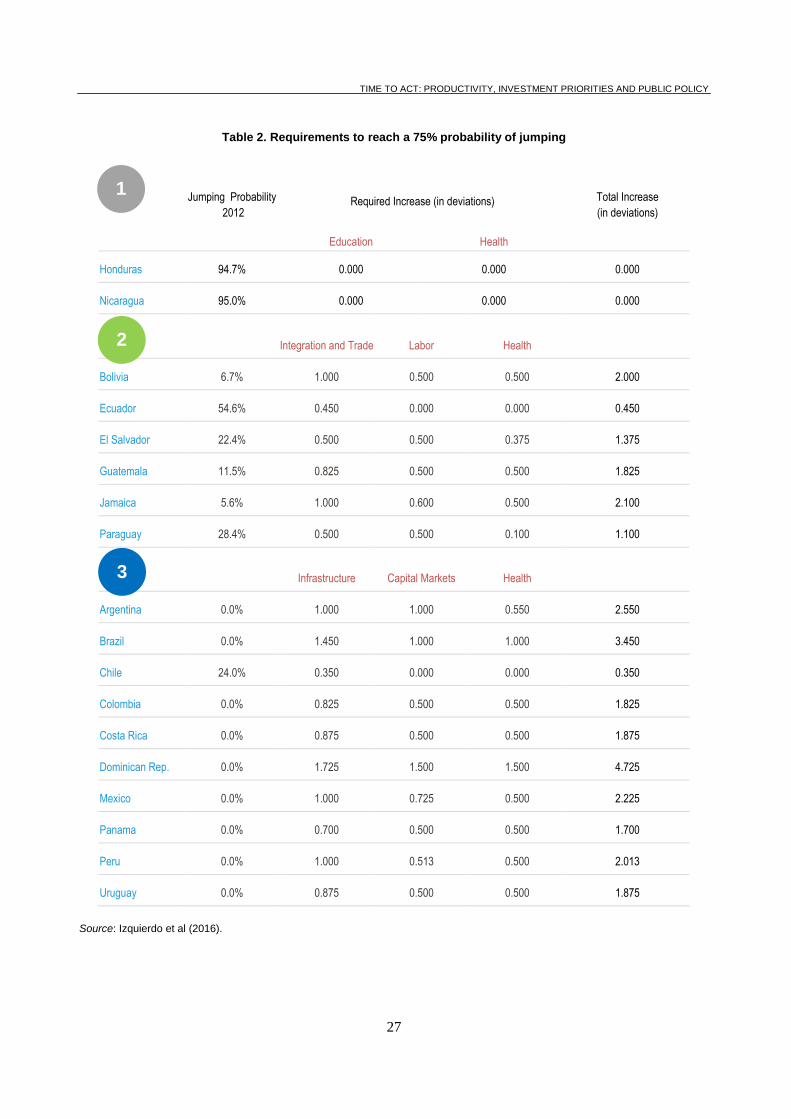
Table 2. Requirements to reach a 75% probability of jumping
Jumping Probability
2012 Required Increase (in deviations) Total Increase
(in deviations)
Education Health
Honduras 94.7% 0.000 0.000 0.000
Nicaragua 95.0% 0.000 0.000 0.000
Integration and Trade Labor Health
Bolivia 6.7% 1.000 0.500 0.500 2.000
Ecuador 54.6% 0.450 0.000 0.000 0.450
El Salvador 22.4% 0.500 0.500 0.375 1.375
Guatemala 11.5% 0.825 0.500 0.500 1.825
Jamaica 5.6% 1.000 0.600 0.500 2.100
Paraguay 28.4% 0.500 0.500 0.100 1.100
Infrastructure Capital Markets Health
Argentina 0.0% 1.000 1.000 0.550 2.550
Brazil 0.0% 1.450 1.000 1.000 3.450
Chile 24.0% 0.350 0.000 0.000 0.350
Colombia 0.0% 0.825 0.500 0.500 1.825
Costa Rica 0.0% 0.875 0.500 0.500 1.875
Dominican Rep. 0.0% 1.725 1.500 1.500 4.725
Mexico 0.0% 1.000 0.725 0.500 2.225
Panama 0.0% 0.700 0.500 0.500 1.700
Peru 0.0% 1.000 0.513 0.500 2.013
Uruguay 0.0% 0.875 0.500 0.500 1.875
Source: Izquierdo et al (2016).
2
3
1
TIME TO ACT: PRODUCTIVITY, INVESTMENT PRIORITIES AND PUBLIC POLICY
28
Figure 7. Differences in priority areas between LAC and OECD countries in cluster 3
Source: Izquierdo et al. (2016)
TIME TO ACT: PRODUCTIVITY, INVESTMENT PRIORITIES AND PUBLIC POLICY
29
CONCLUSIONS
Latin America has had 5 years of slowing growth, and is expected to face negative growth in 2015
and 2016. The end of the commodity super-cycle, low growth in the industrialized world and expectations
of rising borrowing costs all indicate that the tailwind the region was enjoying has ended, meaning no
recovery in growth is in sight in the near future stemming from these external factors.
In this context, today more than ever urgent reforms leading to increases in productivity are needed.
But in a context of limited resources, it is very important that policy makers have tools at hand to prioritize
their investments. Priority selection is difficult because development is a very complex process, in which
several interactions and nonlinearities coexist, and these need to be taken into account. Starting levels on
the development ladder should also be considered, since conditioning variables appear to be specific to a
country’s income per capita level.
From the above analysis different capacities emerge that can be considered priorities to guide the
investment process, all of them horizontal tools that governments have in their budget arsenal. That said,
these priorities should not be taken as the only means of improving productivity. In particular, there are
other areas which are difficult to quantify, such as the relationship between governments and the private
sector through its productive development policies and innovation support, as well as the quality of
different capabilities, which should not be ignored because they are not directly measurable.
Therefore, in the following sections, attention will be paid not only to those capabilities discussed
above, but also to other areas such as investment in innovation and technology, the digital economy,
inclusive management, competition and regulation, informality, institutions and governance and city
planning.

30

31
THEMATIC CHAPTER 1
SETTING FRAMEWORK CONDITIONS
FOR PRODUCTIVITY GAINS

32
THEMATIC CHAPTER 1: SETTING FRAMEWORK CONDITIONS FOR PRODUCTIVITY GAINS
33
Education, skills and youth in Latin America and the Caribbean
Education and skills are widely recognised as key elements to support youth transition from school to
work and inclusive development. Education is central to improve LAC’s current low productivity and find
new engines to foster long-term growth, reduce poverty, bridge inequalities, and build social stability and
cohesion. Despite significant progress, overall education and skills endowment of the population in LAC
remain poor. Quality and pertinence of education and skills offered by educational systems in the region
are still a major issue. While traditional education lags behind in terms of basic reading, mathematics and
science skills, there is a lack of linkages between tertiary education and skills demanded by the labour
markets, while technical and vocational education is still too underdeveloped, focused on outdated sectors
and of low quality. Improving Latin American youth’s skills involves strengthening the coverage and
quality of the education system and promoting lifelong comprehensive skills-enhancing policies.
Education and skills at a glance
Skills levels are poor in the region, due to the low quality of primary and secondary education and
structural barriers. Young Latin Americans perform poorly in reading, mathematics and science compared
to their counterparts in OECD countries. More than half of young Latin Americans enrolled in school do
not acquire basic-level proficiency in reading, mathematics and science, according to PISA results (OECD,
2015). Less than 1% of LAC students perform among the highest levels of proficiency in mathematics,
reading or science. In contrast, 12% of students in OECD countries perform in the top two levels in
mathematics, and 8.5% reach these levels in reading and science (OECD, 2016). This constitutes an
obstacle to further develop more specific skills and may hamper innovation.
More than two-thirds of LAC youth are low-skilled without college, university or high level technical
school education, representing a challenge for structural transformation of LAC countries that are
transitioning into knowledge-based economies where citizens need to innovate, adapt and leverage
advanced human capital. Many young Latin Americans leave school too early, as shown by the region’s
high drop-out and low completion rates for school. As a result, 43 million young Latin Americans aged 15
to 29, or 31% of the youth population, have not completed secondary education and are not enrolled in
school. Even those who graduate suffer from poor quality education and transition into adult life with skills
far down the ranks in comparative international evaluations such as PISA (OECD, 2015;
OECD/CAF/ECLAC, 2014).
Quality higher education provides young individuals with tools to better integrate into the productive,
political and social life of their countries. A more skilled workforce is crucial for LAC countries to enjoy
strong and sustainable economic growth and social development.
Labour market outcomes of youth are linked to educational attainment
Educational attainment often determines labour market participation, employment, job quality
prospects and earnings. As in OECD countries, education increases the chances of being employed in Latin
American countries. Moreover, more highly educated youth are more likely to be employed formally, and
education plays a much larger role in determining earnings in LAC countries than in OECD countries.
Differences in earning are both a reflection of and a source of high unequal distribution of income in LAC
countries. However, they are also a consequence of a low supply of highly educated workers, particularly
with tertiary education, and demonstrate that broader investment in education is highly desirable.
Access to higher education has expanded in LAC during the last decade, but remains below OECD
levels. Between 2004 and 2014, enrolment in higher education increased from 29% to 44% of the
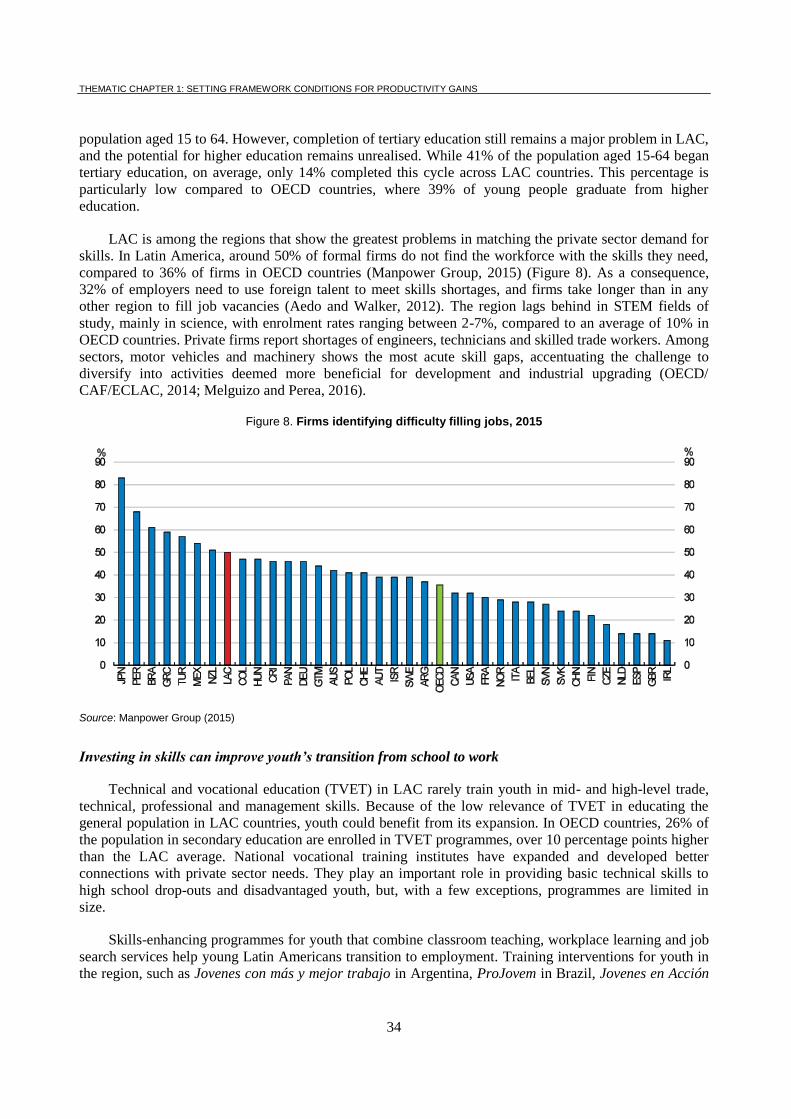
THEMATIC CHAPTER 1: SETTING FRAMEWORK CONDITIONS FOR PRODUCTIVITY GAINS
34
population aged 15 to 64. However, completion of tertiary education still remains a major problem in LAC,
and the potential for higher education remains unrealised. While 41% of the population aged 15-64 began
tertiary education, on average, only 14% completed this cycle across LAC countries. This percentage is
particularly low compared to OECD countries, where 39% of young people graduate from higher
education.
LAC is among the regions that show the greatest problems in matching the private sector demand for
skills. In Latin America, around 50% of formal firms do not find the workforce with the skills they need,
compared to 36% of firms in OECD countries (Manpower Group, 2015) (Figure 8). As a consequence,
32% of employers need to use foreign talent to meet skills shortages, and firms take longer than in any
other region to fill job vacancies (Aedo and Walker, 2012). The region lags behind in STEM fields of
study, mainly in science, with enrolment rates ranging between 2-7%, compared to an average of 10% in
OECD countries. Private firms report shortages of engineers, technicians and skilled trade workers. Among
sectors, motor vehicles and machinery shows the most acute skill gaps, accentuating the challenge to
diversify into activities deemed more beneficial for development and industrial upgrading (OECD/
CAF/ECLAC, 2014; Melguizo and Perea, 2016).
Figure 8. Firms identifying difficulty filling jobs, 2015
Source: Manpower Group (2015)
Investing in skills can improve youth’s transition from school to work
Technical and vocational education (TVET) in LAC rarely train youth in mid- and high-level trade,
technical, professional and management skills. Because of the low relevance of TVET in educating the
general population in LAC countries, youth could benefit from its expansion. In OECD countries, 26% of
the population in secondary education are enrolled in TVET programmes, over 10 percentage points higher
than the LAC average. National vocational training institutes have expanded and developed better
connections with private sector needs. They play an important role in providing basic technical skills to
high school drop-outs and disadvantaged youth, but, with a few exceptions, programmes are limited in
size.
Skills-enhancing programmes for youth that combine classroom teaching, workplace learning and job
search services help young Latin Americans transition to employment. Training interventions for youth in
the region, such as Jovenes con más y mejor trabajo in Argentina, ProJovem in Brazil, Jovenes en Acción
THEMATIC CHAPTER 1: SETTING FRAMEWORK CONDITIONS FOR PRODUCTIVITY GAINS
35
in Colombia and ProJoven in Peru, prove that comprehensive interventions have positive results on youth
employability, earnings and especially job quality (ILO, 2016). Public spending in training programmes in
LAC ranges from 0.02% of GDP in Peru to more than 0.30% in Colombia and Costa Rica, compared to an
OECD average of 0.14%. At secondary and tertiary levels, Argentina, Brazil, Chile, Colombia, Costa Rica,
Mexico and Peru are making significant advances in coverage, quality and adequacy of the programmes to
meet the needs of the private sector.
Training programmes that respond to the needs of the marketplace, thanks to private sector
participation in their design and implementation, facilitate youth’s transition into quality jobs and better
earnings. Impact evaluations of the early experiences of these programmes in LAC show that coordinating
course content with the private sector as well as providing participants with a stipend, are central for
programmes to work well. Although foundational skills are important, individuals should be trained to
participate in knowledge-based and skills-based economies. General education and TVET should expand
their links with the region’s productive sector to underpin on-the-job-training systems, which should be a
cornerstone of education and training across the life cycle. Upgrading human capital by boosting formal
education, training programmes and “learning-by-doing” is paramount, and needs to be paired with
organisational and productive structures changes to maximise the benefits of technology for productivity.
Policy implications
Improving Latin American youth’s skills involves strengthening the coverage and quality of the
education system and promoting lifelong comprehensive skills-enhancing policies. Broader reforms of the
education system are expected to increase access to, and quality and pertinence of, primary, secondary and
tertiary education. As they do, alternative human capital policies such as the existing training and
productive inclusion programmes should support the current generation of low-skilled youth and provide
all future adults with training options.
Enforcement of clear quality standards for education, investment and better training for teachers, and
improvement of mechanisms to identify students who are low performers and those who are struggling
academically, economically and socially would help close learning gaps and avoid early exit. Moreover,
countries need to expand access to high-quality education and also improve coherence and links between
secondary and tertiary education to facilitate the transition from school to higher education.
Quality vocational and technical education is crucial to develop a highly skilled labour force.
Academic education curricula and skills-enhancing programmes should combine classroom teaching with
practical training for productive inclusion and foundational skills. Vocational and technical education
should be strengthened by investing in better and more modern infrastructure, teacher training and
mechanisms to identify labour market needs. Both traditional and TVET education should be more
responsive to the needs of the marketplace and provide channels for the business sector to participate in the
curriculum content.
Countries need more efficient ways to collect information on the skills individuals have and those
skills businesses need to design national skills-enhancing strategies. This information helps countries
identify skills shortages and gaps but also to plan for future skills needs to become more productive and
competitive. It is essential to encourage public-private work that allows identifying future areas of
knowledge and skills that will be needed in the long term, to be promoted today.
THEMATIC CHAPTER 1: SETTING FRAMEWORK CONDITIONS FOR PRODUCTIVITY GAINS
36
REFERENCES
OECD/CAF/ECLAC (2016), Latin American Economic Outlook 2017: Youth, Skills and
Entrepreneurship, OECD Publishing, Paris. DOI: http://dx.doi.org/10.1787/leo-2017-en
OECD (2016), A Skills Beyond School Review of Peru, OECD Reviews of Vocational Education and
Training, OECD Publishing, Paris, http://dx.doi.org/10.1787/9789264265400-en.
Melguizo, A. and J.R. Perea (2016), “Mind the skills gap! Regional and industry patterns in emerging
economies”, OECD Development Centre Working Papers, No. 329, Éditions OCDE, Paris,
http://dx.doi.org/10.1787/5jm5hkp7v145-en.
ILO (2016), Soluciones eficaces: Políticas activas del mercado de trabajo en América Latina y el Caribe
[Efficient Solutions: Active Labour Market Policies in Latin America and the Caribbean],
International Labour Organization, Geneva.
OECD (2015), Education at a Glance 2015: OECD Indicators, OECD Publishing, Paris,
http://dx.doi.org/10.1787/eag-2015-en.
Manpower Group (2015), Talent Shortage Survey Research Results, Milwaukee.
OECD/CAF/ECLAC (2014), Latin American Economic Outlook 2015: Education, Skills and Innovation
for Development, OECD Publishing, Paris, http://dx.doi.org/10.1787/leo-2015-en.
Aedo, C. and I. Walker (2012), Skills for the 21st Century in Latin America and the Caribbean, Directions
in Development, Human Development, World Bank Group, Washington, DC,
https://openknowledge.worldbank.org/handle/10986/2236 License: CC BY 3.0 IGO.
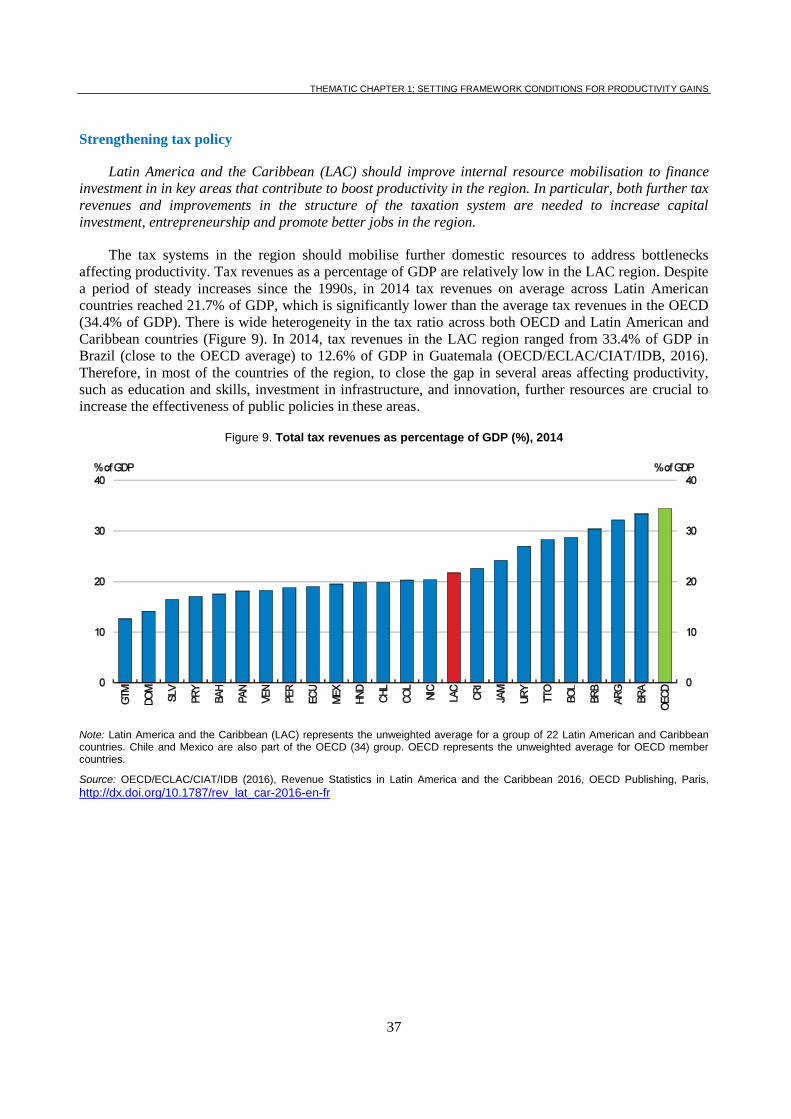
THEMATIC CHAPTER 1: SETTING FRAMEWORK CONDITIONS FOR PRODUCTIVITY GAINS
37
Strengthening tax policy
Latin America and the Caribbean (LAC) should improve internal resource mobilisation to finance
investment in in key areas that contribute to boost productivity in the region. In particular, both further tax
revenues and improvements in the structure of the taxation system are needed to increase capital
investment, entrepreneurship and promote better jobs in the region.
The tax systems in the region should mobilise further domestic resources to address bottlenecks
affecting productivity. Tax revenues as a percentage of GDP are relatively low in the LAC region. Despite
a period of steady increases since the 1990s, in 2014 tax revenues on average across Latin American
countries reached 21.7% of GDP, which is significantly lower than the average tax revenues in the OECD
(34.4% of GDP). There is wide heterogeneity in the tax ratio across both OECD and Latin American and
Caribbean countries (Figure 9). In 2014, tax revenues in the LAC region ranged from 33.4% of GDP in
Brazil (close to the OECD average) to 12.6% of GDP in Guatemala (OECD/ECLAC/CIAT/IDB, 2016).
Therefore, in most of the countries of the region, to close the gap in several areas affecting productivity,
such as education and skills, investment in infrastructure, and innovation, further resources are crucial to
increase the effectiveness of public policies in these areas.
Figure 9. Total tax revenues as percentage of GDP (%), 2014
Note: Latin America and the Caribbean (LAC) represents the unweighted average for a group of 22 Latin American and Caribbean countries. Chile and Mexico are also part of the OECD (34) group. OECD represents the unweighted average for OECD member countries.
Source: OECD/ECLAC/CIAT/IDB (2016), Revenue Statistics in Latin America and the Caribbean 2016, OECD Publishing, Paris,
http://dx.doi.org/10.1787/rev_lat_car-2016-en-fr
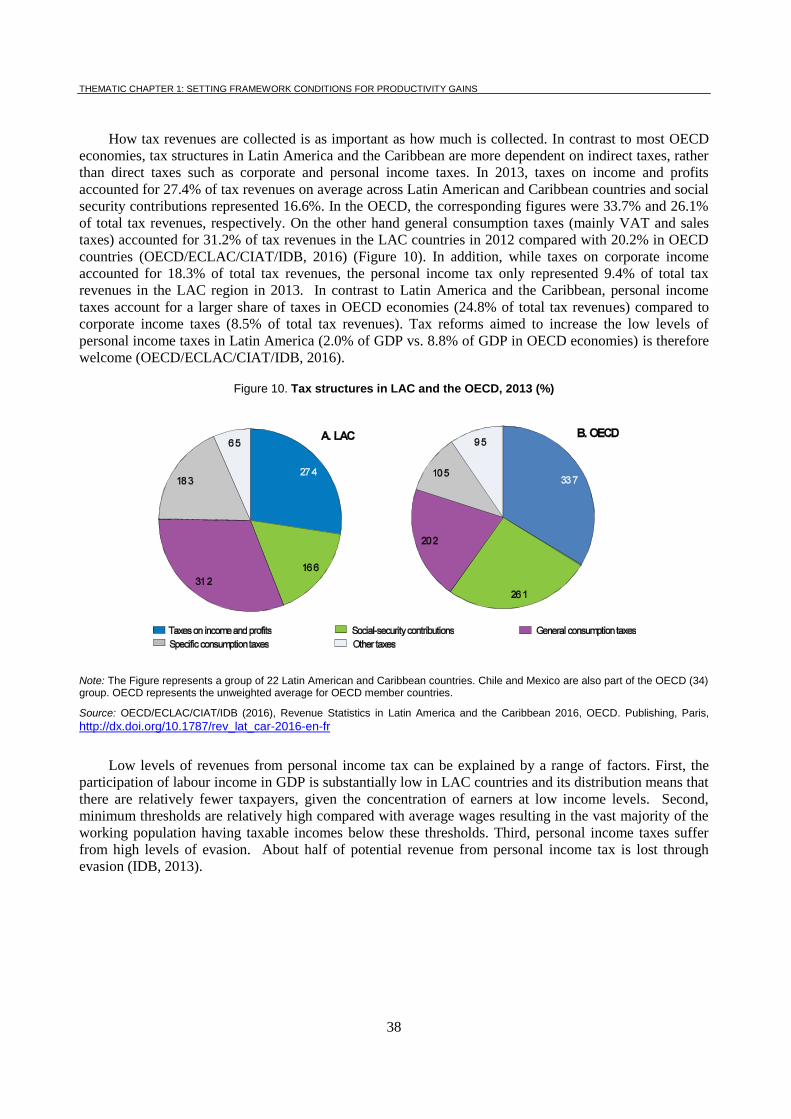
THEMATIC CHAPTER 1: SETTING FRAMEWORK CONDITIONS FOR PRODUCTIVITY GAINS
38
How tax revenues are collected is as important as how much is collected. In contrast to most OECD
economies, tax structures in Latin America and the Caribbean are more dependent on indirect taxes, rather
than direct taxes such as corporate and personal income taxes. In 2013, taxes on income and profits
accounted for 27.4% of tax revenues on average across Latin American and Caribbean countries and social
security contributions represented 16.6%. In the OECD, the corresponding figures were 33.7% and 26.1%
of total tax revenues, respectively. On the other hand general consumption taxes (mainly VAT and sales
taxes) accounted for 31.2% of tax revenues in the LAC countries in 2012 compared with 20.2% in OECD
countries (OECD/ECLAC/CIAT/IDB, 2016) (Figure 10). In addition, while taxes on corporate income
accounted for 18.3% of total tax revenues, the personal income tax only represented 9.4% of total tax
revenues in the LAC region in 2013. In contrast to Latin America and the Caribbean, personal income
taxes account for a larger share of taxes in OECD economies (24.8% of total tax revenues) compared to
corporate income taxes (8.5% of total tax revenues). Tax reforms aimed to increase the low levels of
personal income taxes in Latin America (2.0% of GDP vs. 8.8% of GDP in OECD economies) is therefore
welcome (OECD/ECLAC/CIAT/IDB, 2016).
Figure 10. Tax structures in LAC and the OECD, 2013 (%)
Note: The Figure represents a group of 22 Latin American and Caribbean countries. Chile and Mexico are also part of the OECD (34) group. OECD represents the unweighted average for OECD member countries.
Source: OECD/ECLAC/CIAT/IDB (2016), Revenue Statistics in Latin America and the Caribbean 2016, OECD. Publishing, Paris,
http://dx.doi.org/10.1787/rev_lat_car-2016-en-fr
Low levels of revenues from personal income tax can be explained by a range of factors. First, the
participation of labour income in GDP is substantially low in LAC countries and its distribution means that
there are relatively fewer taxpayers, given the concentration of earners at low income levels. Second,
minimum thresholds are relatively high compared with average wages resulting in the vast majority of the
working population having taxable incomes below these thresholds. Third, personal income taxes suffer
from high levels of evasion. About half of potential revenue from personal income tax is lost through
evasion (IDB, 2013).
THEMATIC CHAPTER 1: SETTING FRAMEWORK CONDITIONS FOR PRODUCTIVITY GAINS
39
In some LAC countries, there is room to increase fiscal revenues to close the gap in public policy
areas highlighted in this report. Almost all countries would benefit from a comprehensive tax reform.
Changes in the tax mix and broader tax reforms will not only strengthen incentives for entrepreneurship,
innovation and productivity, but will also help reduce income inequality. LAC countries should broaden
their tax bases, eliminate or phase out those tax expenditures which are especially beneficial to higher-
income households and evaluate increases in the marginal personal income tax rate for some countries.
LAC countries could shift the tax mix away from taxes that result in an excessively high tax burden on
businesses in the formal economy. Most LAC countries’ domestic resource mobilisation efforts suffer from
the fact that a large segment of their economy is informal. The tax system can play a useful role in
incentivising businesses to become formal.
Strengthening the international tax rules of LAC countries, including through the implementation of
the recommendations of the OECD/G20 Base Erosion and Profit Shifting (BEPS) project will help create a
more even playing field, which will increase overall economic productivity and growth in the region. The
recent move towards Automatic Exchange of Information for Tax Purposes will help fight tax evasion and
give countries greater scope to tax both domestic and foreign-source income earned by tax-resident
businesses and households. Finally, LAC countries may also want to strengthen their tax administration in
order to reduce tax evasion as part of a broader tax reform strategy that aims at increasing productivity and
reducing inequality.
REFERENCES
IDB (2013), More than revenues, Taxation as a development tool, Inter-American Development Bank,
Washington, DC.
OECD/CIAT/IDB (2016), Taxing Wages in Latin America and the Caribbean, OECD Publishing,
Paris. http://dx.doi.org/10.1787/9789264262607-en
OECD/ECLAC/CIAT/IDB (2016), Revenue Statistics in Latin America and the Caribbean 2016, OECD
Publishing, Paris. http://dx.doi.org/10.1787/rev_lat_car-2016-en-fr
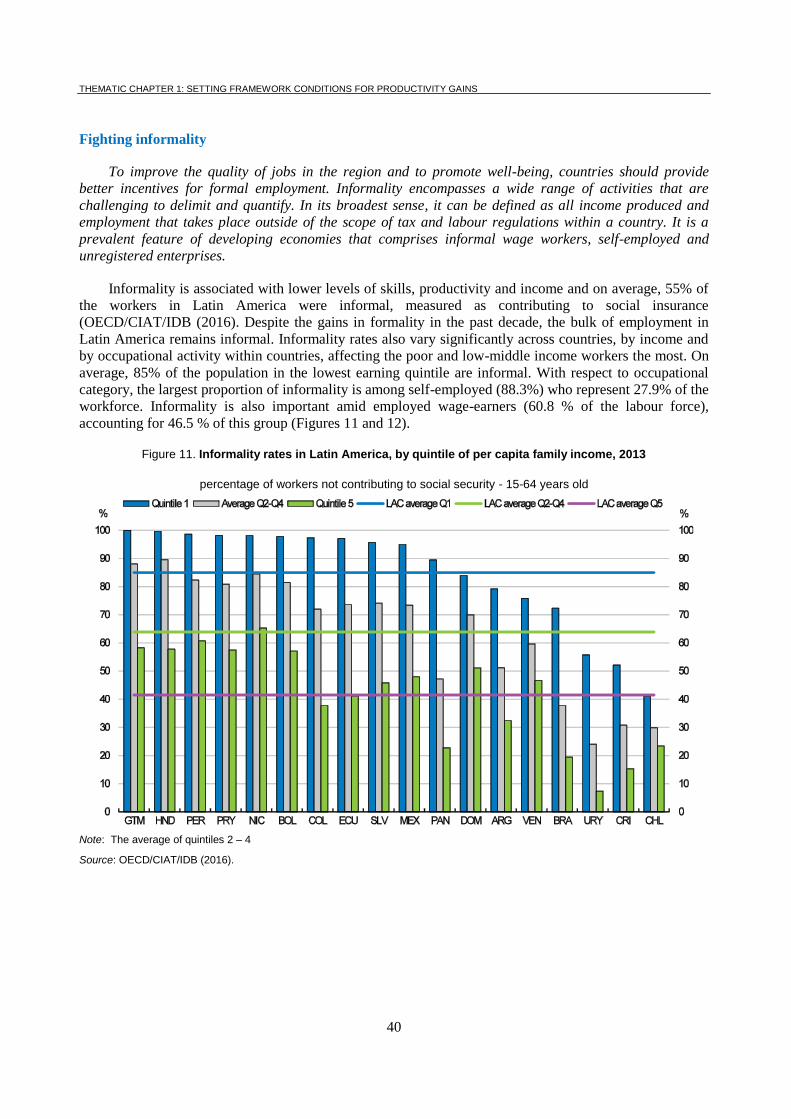
THEMATIC CHAPTER 1: SETTING FRAMEWORK CONDITIONS FOR PRODUCTIVITY GAINS
40
Fighting informality
To improve the quality of jobs in the region and to promote well-being, countries should provide
better incentives for formal employment. Informality encompasses a wide range of activities that are
challenging to delimit and quantify. In its broadest sense, it can be defined as all income produced and
employment that takes place outside of the scope of tax and labour regulations within a country. It is a
prevalent feature of developing economies that comprises informal wage workers, self-employed and
unregistered enterprises.
Informality is associated with lower levels of skills, productivity and income and on average, 55% of
the workers in Latin America were informal, measured as contributing to social insurance
(OECD/CIAT/IDB (2016). Despite the gains in formality in the past decade, the bulk of employment in
Latin America remains informal. Informality rates also vary significantly across countries, by income and
by occupational activity within countries, affecting the poor and low-middle income workers the most. On
average, 85% of the population in the lowest earning quintile are informal. With respect to occupational
category, the largest proportion of informality is among self-employed (88.3%) who represent 27.9% of the
workforce. Informality is also important amid employed wage-earners (60.8 % of the labour force),
accounting for 46.5 % of this group (Figures 11 and 12).
Figure 11. Informality rates in Latin America, by quintile of per capita family income, 2013
percentage of workers not contributing to social security - 15-64 years old
Note: The average of quintiles 2 – 4
Source: OECD/CIAT/IDB (2016).
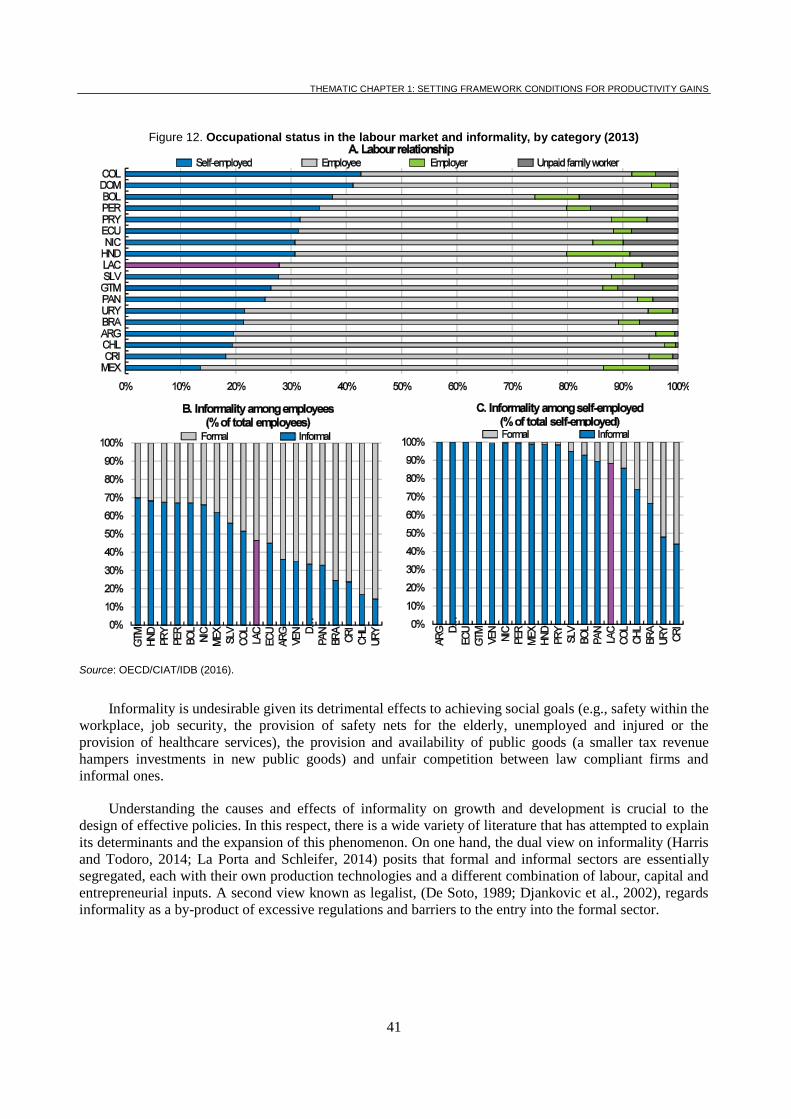
THEMATIC CHAPTER 1: SETTING FRAMEWORK CONDITIONS FOR PRODUCTIVITY GAINS
41
Figure 12. Occupational status in the labour market and informality, by category (2013)
Source: OECD/CIAT/IDB (2016).
Informality is undesirable given its detrimental effects to achieving social goals (e.g., safety within the
workplace, job security, the provision of safety nets for the elderly, unemployed and injured or the
provision of healthcare services), the provision and availability of public goods (a smaller tax revenue
hampers investments in new public goods) and unfair competition between law compliant firms and
informal ones.
Understanding the causes and effects of informality on growth and development is crucial to the
design of effective policies. In this respect, there is a wide variety of literature that has attempted to explain
its determinants and the expansion of this phenomenon. On one hand, the dual view on informality (Harris
and Todoro, 2014; La Porta and Schleifer, 2014) posits that formal and informal sectors are essentially
segregated, each with their own production technologies and a different combination of labour, capital and
entrepreneurial inputs. A second view known as legalist, (De Soto, 1989; Djankovic et al., 2002), regards
informality as a by-product of excessive regulations and barriers to the entry into the formal sector.
THEMATIC CHAPTER 1: SETTING FRAMEWORK CONDITIONS FOR PRODUCTIVITY GAINS
42
Finally, the structuralism theory views informality as a way in which the formal economy can reduce
costs and tap into an inelastic reserve of low productivity workforce.
The high levels of informality in the region stem from diverse causes revealing the need to adopt a
comprehensive approach. For workers and firms, the decision between formality and informality can be
determined by several reasons, such as tax burdens, wage levels, job security, excessive labour regulations,
the value of the programme or services to the worker or firm, lack of expectations of receiving future
benefits to formalisation, skills mismatches and fragile institutions to perform inspections and enforcement
mechanisms. In addition, factors affecting the productive structure of countries in the region affect the lack
of opportunity to promote formal jobs.
Taxation impacts labour market outcomes. Data from Taxing Wages in Latin America and the
Caribbean (OECD/CIAT/IDB, 2016) shows that the cost of adhering to social security programmes as a
percentage of earned income is considerably high in some countries of the region, especially for the lower
and middle income deciles, and strongly correlates to high informality levels. The interaction of lower
contributory thresholds (usually minimum wages) and social security programme rates exclude them from
these services. From the employer’s perspective, high non labour costs might affect also play a detrimental
role in the supply of formal jobs. This adds to the many other non-tax factors that explain individual
decisions to become or remain informal.
Policy efforts have been achieved to promote formalisation in the region. For instance, Mexico’s new
Regimen de Incorporación Fiscal includes incentives to join the formal sector, such as reduced personal,
social security, value added and excise tax obligations in the initial decade of operation (Dougherty, 2015).
Brazil also adopted a number of policy measures to reduce the costs of formality, such as the Simples
Nacional that introduced a more progressive tax structure and simplified the collection of taxes and social
security contributions. It is estimated that these measures contributed to the formalisation of 500 000
microenterprises accounting for 2 million jobs from 2000 to 2005 (Delgado et al., 2007). Finally,
Colombia’s 2012 tax reform that reduced taxes and contributions (Parafiscales) on labour has had a
positive impact on formal job creation.
Moving forward, formal and quality job creation should be at the centre of the agenda for inclusive
growth. To this end, governments should improve the quality of the public services they deliver. Improving
opportunities of formal employment so that workers and companies can fully enjoy not only the benefits of
social insurance, but also the capacity for personal growth and added value that comes from formal
economies is critical in LAC. Evidence in countries such as Mexico and Peru suggest that there is no
“silver bullet" to combat informality, yet a package of policies promoting formalisation, including labour
skills, encouraging investment in productive areas, enhancing the tax system and the labour regulation, and
deterring corruption (Dougherty and Escobar, 2016; OECD, 2016).
Focusing on taxation and social insurance, an appraisal on lower thresholds of social security
programmes, progressive social security cuts, and matching contributions pension schemes that increase
the returns from becoming formal are good avenues to achieve this end (Bosch et al., 2013). Promoting
productive job stability to lay the foundation for longer lasting and productive employment relationships is
key to ensure growth in long-term and to consolidate a stronger and more vibrant middle class.
THEMATIC CHAPTER 1: SETTING FRAMEWORK CONDITIONS FOR PRODUCTIVITY GAINS
43
REFERENCES
Bosch, M., A. Melguizo and C. Pages (2013), Better pensions, better jobs. Towards universal coverage in
Latin America and the Caribbean, Inter-American Development Bank, Washington DC.
Delgado, G. et al. (2007), “Avaliação do Simples: Implicações à Formalização Previdenciária”, para
Discussão, No. 1277, Instituto de Pesquisa Econômica Aplicada [Institute for Applied Economic
Research] (IPEA), Brasilia, http://www.ipea.gov.br/portal/images/stories/PDFs/TDs/td_1277.pdf.
Dougherty S. and O. Escobar (2016), “What Policies to Combat Labour Informality? Evidence from
Mexico”, OECD Economics Department, May. Revised version of Working Paper No. 1043,
http://dx.doi.org/10.1787/5k483jrvnjq2-en.
Dougherty, S. (2015), "Boosting Growth and Reducing Informality in Mexico", OECD Economics
Department Working Papers, No. 1188, OECD Publishing, Paris.
DOI: http://dx.doi.org/10.1787/5js4w28dnn28-en
OECD (2016), Multi-dimensional Review of Peru: Volume 2. In-depth Analysis and Recommendations,
OECD Development Pathways, OECD Publishing, Paris. http://dx.doi.org/10.1787/9789264264670-
en
OECD/IDB/CIAT (2016), Taxing Wages in Latin America and the Caribbean 2016, OECD Publishing,
Paris.
DOI: http://dx.doi.org/10.1787/9789264262607-en
THEMATIC CHAPTER 1: SETTING FRAMEWORK CONDITIONS FOR PRODUCTIVITY GAINS
44
Tackling corruption, enhancing trust and strengthening judicial effectiveness
Institutions provide the underpinnings for businesses to operate and markets to function. Ensuring
that trust is sufficient for investors to commit their resources requires that corruption is limited and
judicial institutions operate effectively. Otherwise laws, regulations and framework policies cannot be
relied upon by firms, and markets may cease to function. Weak governance is a problem in some Latin
American countries, as is a weak rule of law. Improving these institutions is essential to help support
growth.
Corruption and Trust
Corruption is a particularly vexing policy challenge. Systemic corruption distorts incentives,
undermines confidence in institutions and fair competition in markets, erodes public services, and
undercuts democracy and social trust. In both developed and developing countries, corruption not only
deprives people of the resources needed for effective services, it is also bad for business and undermines
productivity, sustainable growth, and social inclusion (OECD, 2016).
Therefore, corruption, understood as the abuse of entrusted power for private gain, creates major
impediments to inclusive growth; it leads to unequal opportunities to participate in social, economic
and political life, as well as unequal distribution of income, wealth and social well-being.
Corruption fuels inequality as corrupt actors can use corruption to maintain their power and interests,
and because access to markets and public services are restrained and disadvantages perpetuated.
Corruption thus aggravates and perpetuates existing inequalities at all levels of government.
Corruption undermines productivity in both the public and the private sector. Integrity is crucial to
productivity growth and inclusiveness. Laws, regulations, and public policies, as well as internal policies
and procedures, are the rules of the game that constitute the formal governance framework of a
country or an organisation. This framework determines whether resources are invested into productivity-
enhancing activities or into unproductive activities – albeit lucrative for a few – such as rent-seeking or
straightforward corruption to the detriment of the public interest, and sustainable and inclusive
growth. By providing the right positive and negative incentives, the formal governance framework
supports an environment where inclusive growth and sustainable development can be achieved (see
Acemoglu and Robinson, 2012 and Olson et al., 2000 in OECD, 2016).
In contrast, weak governance frameworks undermine productivity gains by creating transaction costs,
opportunities for corruption, and incentives for unproductive rent-seeking activities. The importance of
quality of governance in explaining the differences in productivity across countries is well-documented.
Figure 13 plots the inverted Corruption Perception Index from Transparency International against labour
productivity, as measured by GDP per hour worked, for the 34 OECD countries.
Without making any inference with respect to causality, figure 13 nevertheless helps to demonstrate
that higher levels of perceived corruption are indeed observed together with lower levels of productivity, a
relationship confirmed by a number of econometric studies controlling for other causal variables.
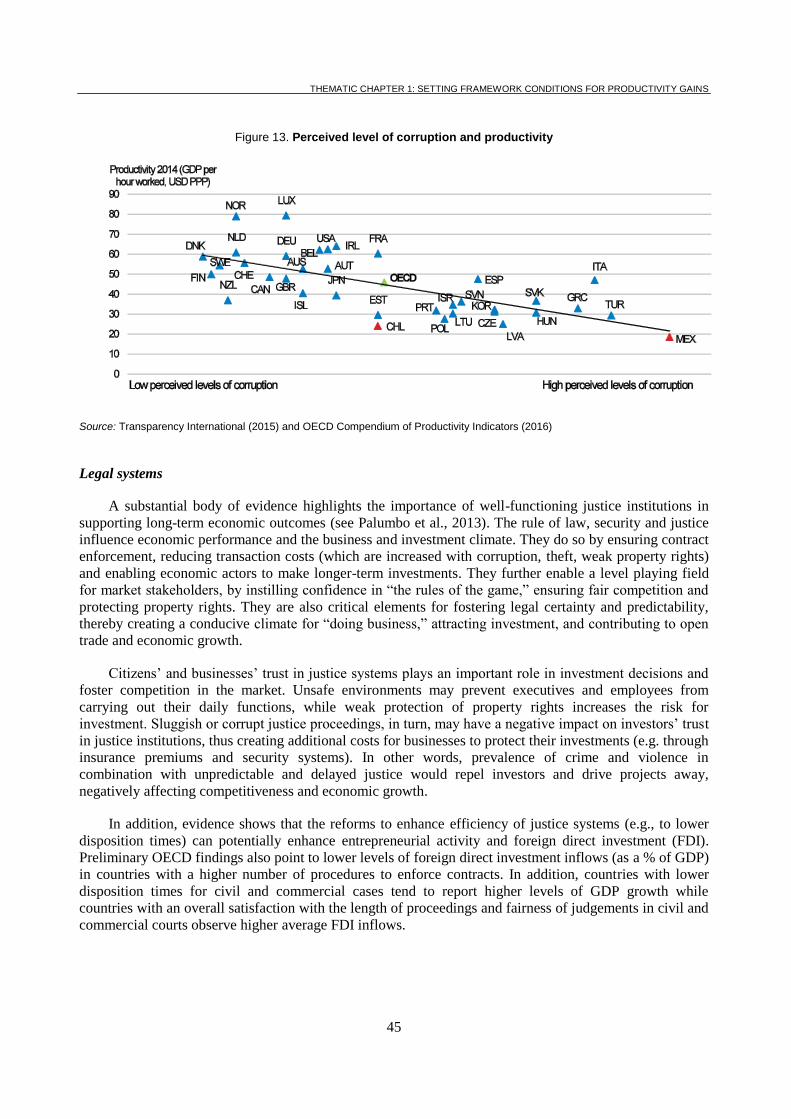
THEMATIC CHAPTER 1: SETTING FRAMEWORK CONDITIONS FOR PRODUCTIVITY GAINS
45
Figure 13. Perceived level of corruption and productivity
Source: Transparency International (2015) and OECD Compendium of Productivity Indicators (2016)
Legal systems
A substantial body of evidence highlights the importance of well-functioning justice institutions in
supporting long-term economic outcomes (see Palumbo et al., 2013). The rule of law, security and justice
influence economic performance and the business and investment climate. They do so by ensuring contract
enforcement, reducing transaction costs (which are increased with corruption, theft, weak property rights)
and enabling economic actors to make longer-term investments. They further enable a level playing field
for market stakeholders, by instilling confidence in “the rules of the game,” ensuring fair competition and
protecting property rights. They are also critical elements for fostering legal certainty and predictability,
thereby creating a conducive climate for “doing business,” attracting investment, and contributing to open
trade and economic growth.
Citizens’ and businesses’ trust in justice systems plays an important role in investment decisions and
foster competition in the market. Unsafe environments may prevent executives and employees from
carrying out their daily functions, while weak protection of property rights increases the risk for
investment. Sluggish or corrupt justice proceedings, in turn, may have a negative impact on investors’ trust
in justice institutions, thus creating additional costs for businesses to protect their investments (e.g. through
insurance premiums and security systems). In other words, prevalence of crime and violence in
combination with unpredictable and delayed justice would repel investors and drive projects away,
negatively affecting competitiveness and economic growth.
In addition, evidence shows that the reforms to enhance efficiency of justice systems (e.g., to lower
disposition times) can potentially enhance entrepreneurial activity and foreign direct investment (FDI).
Preliminary OECD findings also point to lower levels of foreign direct investment inflows (as a % of GDP)
in countries with a higher number of procedures to enforce contracts. In addition, countries with lower
disposition times for civil and commercial cases tend to report higher levels of GDP growth while
countries with an overall satisfaction with the length of proceedings and fairness of judgements in civil and
commercial courts observe higher average FDI inflows.
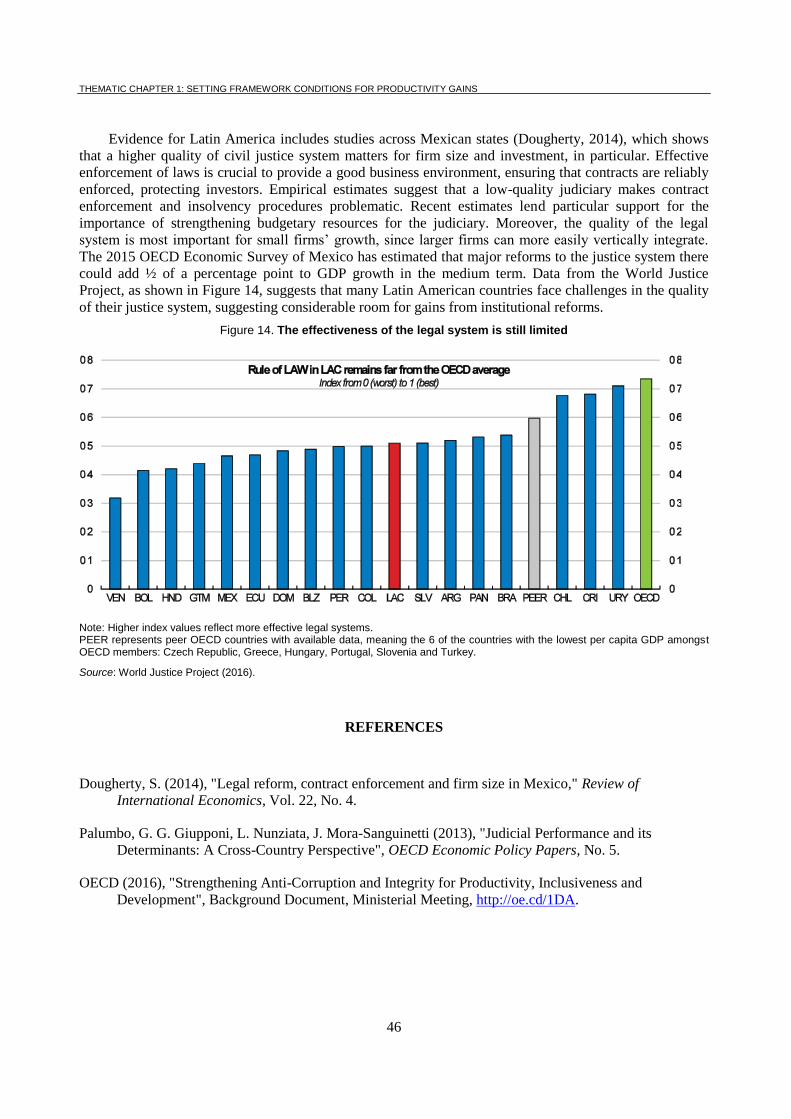
THEMATIC CHAPTER 1: SETTING FRAMEWORK CONDITIONS FOR PRODUCTIVITY GAINS
46
Evidence for Latin America includes studies across Mexican states (Dougherty, 2014), which shows
that a higher quality of civil justice system matters for firm size and investment, in particular. Effective
enforcement of laws is crucial to provide a good business environment, ensuring that contracts are reliably
enforced, protecting investors. Empirical estimates suggest that a low-quality judiciary makes contract
enforcement and insolvency procedures problematic. Recent estimates lend particular support for the
importance of strengthening budgetary resources for the judiciary. Moreover, the quality of the legal
system is most important for small firms’ growth, since larger firms can more easily vertically integrate.
The 2015 OECD Economic Survey of Mexico has estimated that major reforms to the justice system there
could add ½ of a percentage point to GDP growth in the medium term. Data from the World Justice
Project, as shown in Figure 14, suggests that many Latin American countries face challenges in the quality
of their justice system, suggesting considerable room for gains from institutional reforms.
Figure 14. The effectiveness of the legal system is still limited
Note: Higher index values reflect more effective legal systems. PEER represents peer OECD countries with available data, meaning the 6 of the countries with the lowest per capita GDP amongst OECD members: Czech Republic, Greece, Hungary, Portugal, Slovenia and Turkey.
Source: World Justice Project (2016).
REFERENCES
Dougherty, S. (2014), "Legal reform, contract enforcement and firm size in Mexico," Review of
International Economics, Vol. 22, No. 4.
Palumbo, G. G. Giupponi, L. Nunziata, J. Mora-Sanguinetti (2013), "Judicial Performance and its
Determinants: A Cross-Country Perspective", OECD Economic Policy Papers, No. 5.
OECD (2016), "Strengthening Anti-Corruption and Integrity for Productivity, Inclusiveness and
Development", Background Document, Ministerial Meeting, http://oe.cd/1DA.
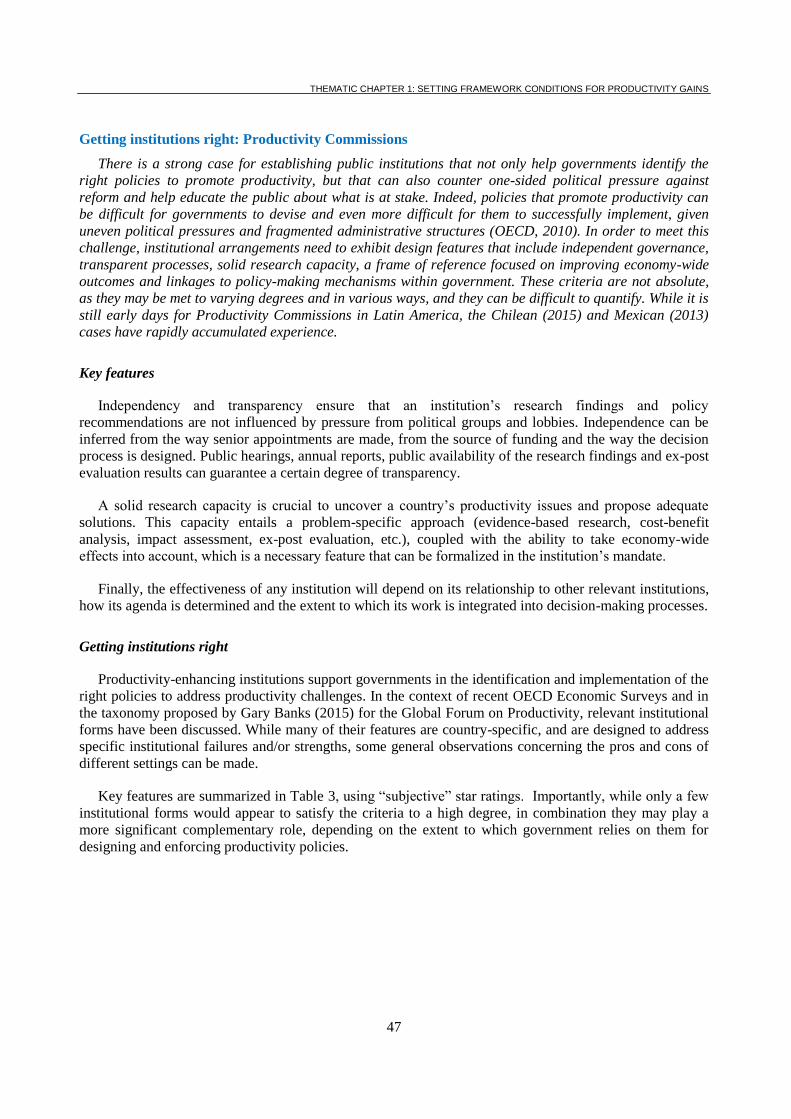
THEMATIC CHAPTER 1: SETTING FRAMEWORK CONDITIONS FOR PRODUCTIVITY GAINS
47
Getting institutions right: Productivity Commissions
There is a strong case for establishing public institutions that not only help governments identify the
right policies to promote productivity, but that can also counter one-sided political pressure against
reform and help educate the public about what is at stake. Indeed, policies that promote productivity can
be difficult for governments to devise and even more difficult for them to successfully implement, given
uneven political pressures and fragmented administrative structures (OECD, 2010). In order to meet this
challenge, institutional arrangements need to exhibit design features that include independent governance,
transparent processes, solid research capacity, a frame of reference focused on improving economy-wide
outcomes and linkages to policy-making mechanisms within government. These criteria are not absolute,
as they may be met to varying degrees and in various ways, and they can be difficult to quantify. While it is
still early days for Productivity Commissions in Latin America, the Chilean (2015) and Mexican (2013)
cases have rapidly accumulated experience.
Key features
Independency and transparency ensure that an institution’s research findings and policy
recommendations are not influenced by pressure from political groups and lobbies. Independence can be
inferred from the way senior appointments are made, from the source of funding and the way the decision
process is designed. Public hearings, annual reports, public availability of the research findings and ex-post
evaluation results can guarantee a certain degree of transparency.
A solid research capacity is crucial to uncover a country’s productivity issues and propose adequate
solutions. This capacity entails a problem-specific approach (evidence-based research, cost-benefit
analysis, impact assessment, ex-post evaluation, etc.), coupled with the ability to take economy-wide
effects into account, which is a necessary feature that can be formalized in the institution’s mandate.
Finally, the effectiveness of any institution will depend on its relationship to other relevant institutions,
how its agenda is determined and the extent to which its work is integrated into decision-making processes.
Getting institutions right
Productivity-enhancing institutions support governments in the identification and implementation of the
right policies to address productivity challenges. In the context of recent OECD Economic Surveys and in
the taxonomy proposed by Gary Banks (2015) for the Global Forum on Productivity, relevant institutional
forms have been discussed. While many of their features are country-specific, and are designed to address
specific institutional failures and/or strengths, some general observations concerning the pros and cons of
different settings can be made.
Key features are summarized in Table 3, using “subjective” star ratings. Importantly, while only a few
institutional forms would appear to satisfy the criteria to a high degree, in combination they may play a
more significant complementary role, depending on the extent to which government relies on them for
designing and enforcing productivity policies.
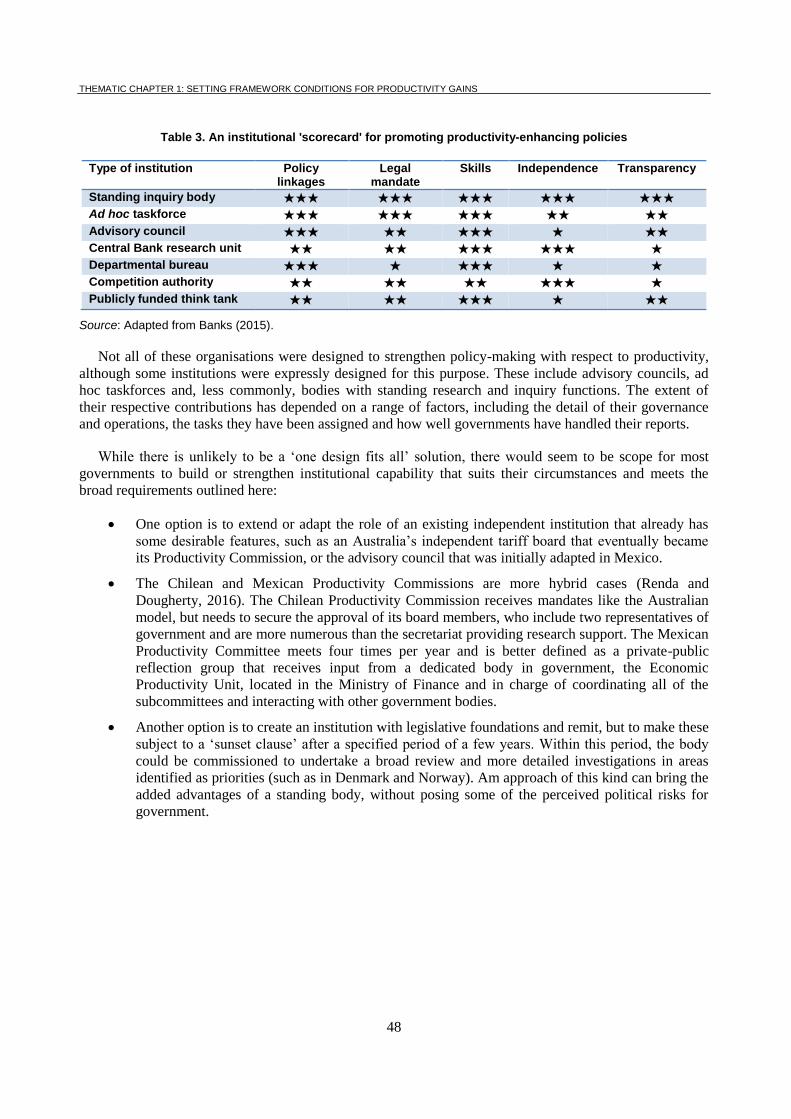
THEMATIC CHAPTER 1: SETTING FRAMEWORK CONDITIONS FOR PRODUCTIVITY GAINS
48
Table 3. An institutional 'scorecard' for promoting productivity-enhancing policies
Type of institution Policy linkages
Legal mandate
Skills Independence Transparency
Standing inquiry body ★★★ ★★★ ★★★ ★★★ ★★★
Ad hoc taskforce ★★★ ★★★ ★★★ ★★ ★★
Advisory council ★★★ ★★ ★★★ ★ ★★
Central Bank research unit ★★ ★★ ★★★ ★★★ ★
Departmental bureau ★★★ ★ ★★★ ★ ★
Competition authority ★★ ★★ ★★ ★★★ ★
Publicly funded think tank ★★ ★★ ★★★ ★ ★★
Source: Adapted from Banks (2015).
Not all of these organisations were designed to strengthen policy-making with respect to productivity,
although some institutions were expressly designed for this purpose. These include advisory councils, ad
hoc taskforces and, less commonly, bodies with standing research and inquiry functions. The extent of
their respective contributions has depended on a range of factors, including the detail of their governance
and operations, the tasks they have been assigned and how well governments have handled their reports.
While there is unlikely to be a ‘one design fits all’ solution, there would seem to be scope for most
governments to build or strengthen institutional capability that suits their circumstances and meets the
broad requirements outlined here:
One option is to extend or adapt the role of an existing independent institution that already has
some desirable features, such as an Australia’s independent tariff board that eventually became
its Productivity Commission, or the advisory council that was initially adapted in Mexico.
The Chilean and Mexican Productivity Commissions are more hybrid cases (Renda and
Dougherty, 2016). The Chilean Productivity Commission receives mandates like the Australian
model, but needs to secure the approval of its board members, who include two representatives of
government and are more numerous than the secretariat providing research support. The Mexican
Productivity Committee meets four times per year and is better defined as a private-public
reflection group that receives input from a dedicated body in government, the Economic
Productivity Unit, located in the Ministry of Finance and in charge of coordinating all of the
subcommittees and interacting with other government bodies.
Another option is to create an institution with legislative foundations and remit, but to make these
subject to a ‘sunset clause’ after a specified period of a few years. Within this period, the body
could be commissioned to undertake a broad review and more detailed investigations in areas
identified as priorities (such as in Denmark and Norway). Am approach of this kind can bring the
added advantages of a standing body, without posing some of the perceived political risks for
government.
THEMATIC CHAPTER 1: SETTING FRAMEWORK CONDITIONS FOR PRODUCTIVITY GAINS
49
There is accordingly also considerable potential for governments to learn from each other about the
relative merits of different institutional approaches, and for existing institutions themselves to build
capability by drawing on the experience of others. The Global Forum on Productivity is well placed to
facilitate such mutual engagement and learning, which could ultimately see governments becoming better
equipped to secure the pro-productivity policies that are crucial to sustained improvements in living
standards.
REFERENCES
Gary Banks (2015), Institutions to Promote Pro-Productivity Policies, Productivity Working Paper No. 1,
OECD Publishing, Paris, http://dx.doi.org/10.1787/5jrql2tsvh41-en
OECD (2010), Making Reform Happen: Structural Priorities in Times of Crisis, OECD Publishing, Paris,
www.oecd.org/site/sgemrh/46159159.pdf
Renda, A. and S. Dougherty (2016), Pro-Productivity Institutions: Learning from National Experience,
Background Paper for the Lisbon Conference of the Global Forum on Productivity,
www.oecd.org/global-forum-productivity/events/Draft_pro_productivity_institutions.pdf
THEMATIC CHAPTER 1: SETTING FRAMEWORK CONDITIONS FOR PRODUCTIVITY GAINS
50
Governance of public investment and infrastructure
Infrastructure investment is the backbone of productivity, supporting the delivery of effective public
services in a myriad of policy areas that affect people’s lives. High-quality infrastructure is key to both
raising productivity levels and improving social inclusion.
Various econometric studies from the OECD, IMF and World Bank show that investment spending
has a significant multiplier effect. Recent analysis from the OECD show that the first-year effect of a ½ per
cent of GDP public investment stimulus by all OECD economies is significant and translates for example
in 0.6% of GDP increase in the United States, and 0.5% in the Euro area (OECD, 2016). The IMF in 2015
showed that an unanticipated 1 percentage point of GDP increase in government investment spending
increases the level of output by about 0.4 percent in the same year. Four years after an unanticipated shock
to government investment spending of 1 percentage point of GDP, the level of real output is 1.5 percent
higher, which corresponds to a medium-term fiscal multiplier of about 1.4. This finding likely reflects the
expansion of the productive capacity of the economy as public investment augments the physical
infrastructure stock (IMF, 2015).
The impact of infrastructure investment depends on how it is managed. While the financing
dimension of infrastructure investments is important, the broader public governance dimension is equally
important. OECD evidence has shown that substantial benefits can be realised by better managing public
investment throughout its “life cycle” and across levels of government; and that the quality of public
governance correlates with public investment and growth outcomes, at both national and subnational levels
(OECD, 2013). One calculation estimates that globally USD 1 trillion per year could be saved from better
governance of expected public infrastructure investment needs (McKinsey, 2013).
Subnational governments are key actors in public investment being responsible for almost 60% of
public investment in the OECD on average (Fig. 15). Most of this public investment goes to infrastructure
in sectors of key importance for economic growth and citizen’s well-being. Whether through shared policy
competencies or joint funding arrangements, public investment typically involves different levels of
government at some stage of the investment process. This makes its governance particularly complex.
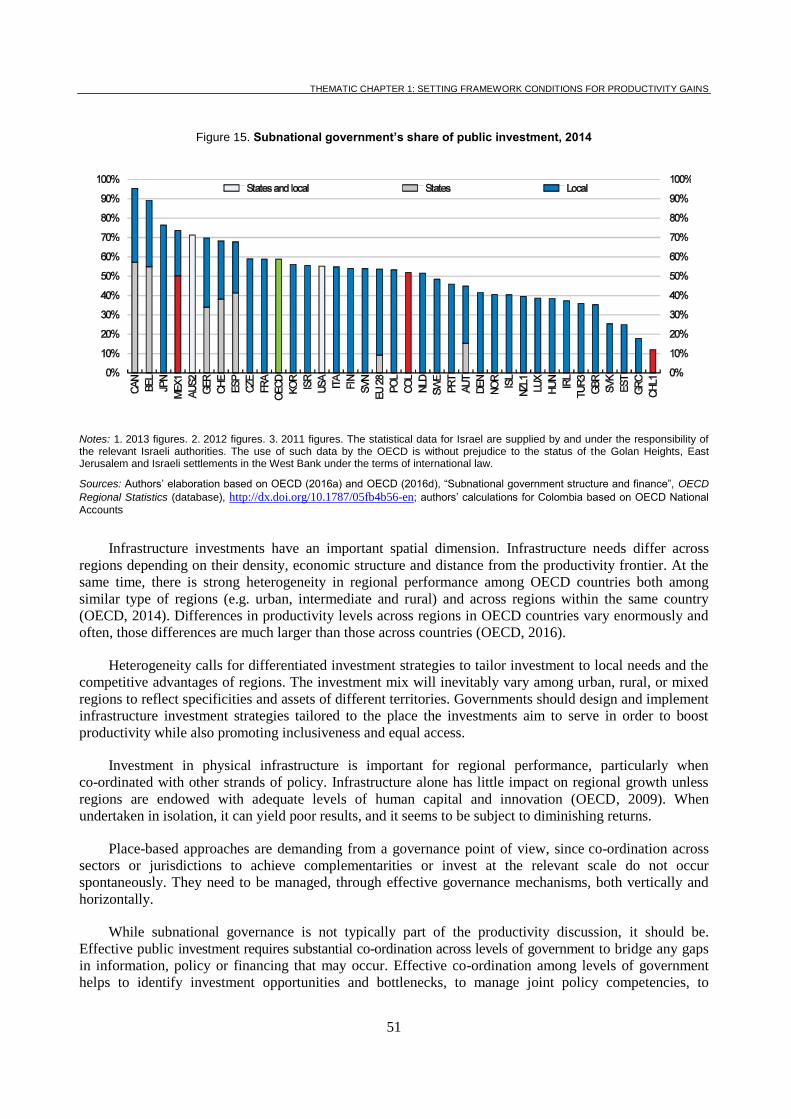
THEMATIC CHAPTER 1: SETTING FRAMEWORK CONDITIONS FOR PRODUCTIVITY GAINS
51
Figure 15. Subnational government’s share of public investment, 2014
Notes: 1. 2013 figures. 2. 2012 figures. 3. 2011 figures. The statistical data for Israel are supplied by and under the responsibility of the relevant Israeli authorities. The use of such data by the OECD is without prejudice to the status of the Golan Heights, East Jerusalem and Israeli settlements in the West Bank under the terms of international law.
Sources: Authors’ elaboration based on OECD (2016a) and OECD (2016d), “Subnational government structure and finance”, OECD
Regional Statistics (database), http://dx.doi.org/10.1787/05fb4b56-en; authors’ calculations for Colombia based on OECD National
Accounts
Infrastructure investments have an important spatial dimension. Infrastructure needs differ across
regions depending on their density, economic structure and distance from the productivity frontier. At the
same time, there is strong heterogeneity in regional performance among OECD countries both among
similar type of regions (e.g. urban, intermediate and rural) and across regions within the same country
(OECD, 2014). Differences in productivity levels across regions in OECD countries vary enormously and
often, those differences are much larger than those across countries (OECD, 2016).
Heterogeneity calls for differentiated investment strategies to tailor investment to local needs and the
competitive advantages of regions. The investment mix will inevitably vary among urban, rural, or mixed
regions to reflect specificities and assets of different territories. Governments should design and implement
infrastructure investment strategies tailored to the place the investments aim to serve in order to boost
productivity while also promoting inclusiveness and equal access.
Investment in physical infrastructure is important for regional performance, particularly when
co-ordinated with other strands of policy. Infrastructure alone has little impact on regional growth unless
regions are endowed with adequate levels of human capital and innovation (OECD, 2009). When
undertaken in isolation, it can yield poor results, and it seems to be subject to diminishing returns.
Place-based approaches are demanding from a governance point of view, since co-ordination across
sectors or jurisdictions to achieve complementarities or invest at the relevant scale do not occur
spontaneously. They need to be managed, through effective governance mechanisms, both vertically and
horizontally.
While subnational governance is not typically part of the productivity discussion, it should be.
Effective public investment requires substantial co-ordination across levels of government to bridge any gaps
in information, policy or financing that may occur. Effective co-ordination among levels of government
helps to identify investment opportunities and bottlenecks, to manage joint policy competencies, to
THEMATIC CHAPTER 1: SETTING FRAMEWORK CONDITIONS FOR PRODUCTIVITY GAINS
52
minimize the potential for investments to work at cross-purposes, to ensure adequate resources and
sufficient capacity to undertake investment, to resolve conflict and to create trust (OECD, 2015b).
Governance instruments to support coordination include for example financial incentives to support
cooperation, co-financing mechanisms, joint investment strategies, conditionalities, platforms of dialogue,
or specific instruments such as contractual arrangements.
Incentives are needed to promote cooperation to invest at a relevant scale – in particular in functional
urban areas. Less fragmented governance structures favour growth and productivity in cities. There is
indeed a productivity penalty associated with administrative fragmentation, as measured by the number of
jurisdictions. A doubling of the degree of fragmentation results in a penalty of 6% for productivity. That
penalty is halved when there is a governance body for the metropolitan area (Ahrend et al., 2014). Out of
the 281 metropolitan areas of 500 000+ inhabitants in the OECD, one-quarter contain at least 100
municipalities (OECD, 2016).
Effective investments also require critical governance capacities at different levels to design and
implement public investment strategies and projects targeted to local needs. A key obstacle at the
subnational level for effective public investment is the lack of capacities to design and implement the right
investment-mix. The OECD and the EU Committee of the Regions conducted a survey in 2015 with EU
subnational governments to assess the challenges linked to infrastructure investment at the local level. The
results show that the capacity challenge is prominent, even in most advanced countries. Two thirds of
subnational governments surveyed reported that the capacity to design long-term public investment
strategies was lacking in their locality (OECD- CoR survey, 2016).
All countries are confronted by these challenges, whatever the institutional context (in federal
countries, or highly centralised countries) given the mutual dependency across levels of government. The
OECD Recommendation on Effective Public Investment across Levels of Government adopted in 2014
target the systematic obstacles that countries, regions and cities face when managing public investment,
notably challenges in vertical and horizontal coordination, across sectors, and bottlenecks in sub-national
capacities. An Implementation Toolkit provides guidance for its use. The OECD is developing indicators
on multi-level co-ordination of public investment, to help codify information and facilitate benchmarks and
peer-learning.
THEMATIC CHAPTER 1: SETTING FRAMEWORK CONDITIONS FOR PRODUCTIVITY GAINS
53
REFERENCES
Ahrend, R., E. Farchy, I. Kaplanis and A.C. Lembcke (2014), “What makes cities more productive?
Evidence on the role of urban governance from five OECD countries”, OECD Regional
Development Working Papers, No. 2014/05, OECD Publishing, Paris,
http://dx.doi.org/10.1787/5jz432cf2d8p-en
Garcilazo, E. and Oliveira Martins, J. (2013), “The Contribution of Regions to Aggregate Growth”, OECD
Regional Development Working Papers, OECD Publishing, Paris,
http://dx.doi.org/10.1787/5k3tt0zzp932-en.
IMF (2015), “The Macroeconomic Effects of Public Investment: Evidence from Advanced Economies”,
IMF Working Paper, Research Department,
https://www.imf.org/external/pubs/ft/wp/2015/wp1595.pdf
McKinsey (2013), Infrastructure productivity: How to save $1 trillion a year, McKinsey & Company,
January 2013, www.mckinsey.com/industries/infrastructure/our-insights/infrastructure-productivity
OECD-COR Survey (2016) – Policy highlights Infrastructure planning and investment across levels of
government: current challenges and possible solutions: http://www.oecd.org/effective-public-
investment-toolkit/oecd-eu-survey.htm
OECD (2016a), OECD Regional Outlook 2016: Productive Regions for Inclusive Societies, OECD
Publishing, Paris, http://dx.doi.org/10.1787/9789264260245-en
OECD (2016b), Stronger Growth Remains Elusive: Urgent Policy Response is needed, Interim Economic
Outlook http://pac-files.oecd.org/acrobatebook/1215071e.pdf
OECD (2015a), Recommendation on Effective Public Investment Across Levels of Government –
Implementation Toolkit -- http://www.oecd.org/effective-public-investment-toolkit/
OECD (2015b), Recommendation on Effective Public Investment Across Levels of Government
http://www.oecd.org/gov/regional-policy/recommendation-effective-public-investment-across-levels-
of-government.htm
OECD (2015c), Towards a Framework for the Governance of Infrastructure, OECD Publishing, Paris
OECD (2014), OECD Regional Outlook 2014: Regions and Cities: Where Policies and People Meet,
OECD Publishing, http://dx.doi.org/ 10.1787/9789264201415-en
OECD (2013) Investing Together: Working Effectively across Levels of Government, OECD Publishing
http://dx.doi.org/10.1787/9789264197022-en
OECD (2011), Making the Most of Public Investment in a Tight Fiscal Environment: Multi-Level
Governance Lessons from the Crisis, OECD Publishing, http://dx.doi.org/10.1787/9789264114470-
en.
OECD (2009), How Regions Grow: Trends and Analysis, OECD Publishing, Paris,
http://dx.doi.org/10.1787/9789264039469-en
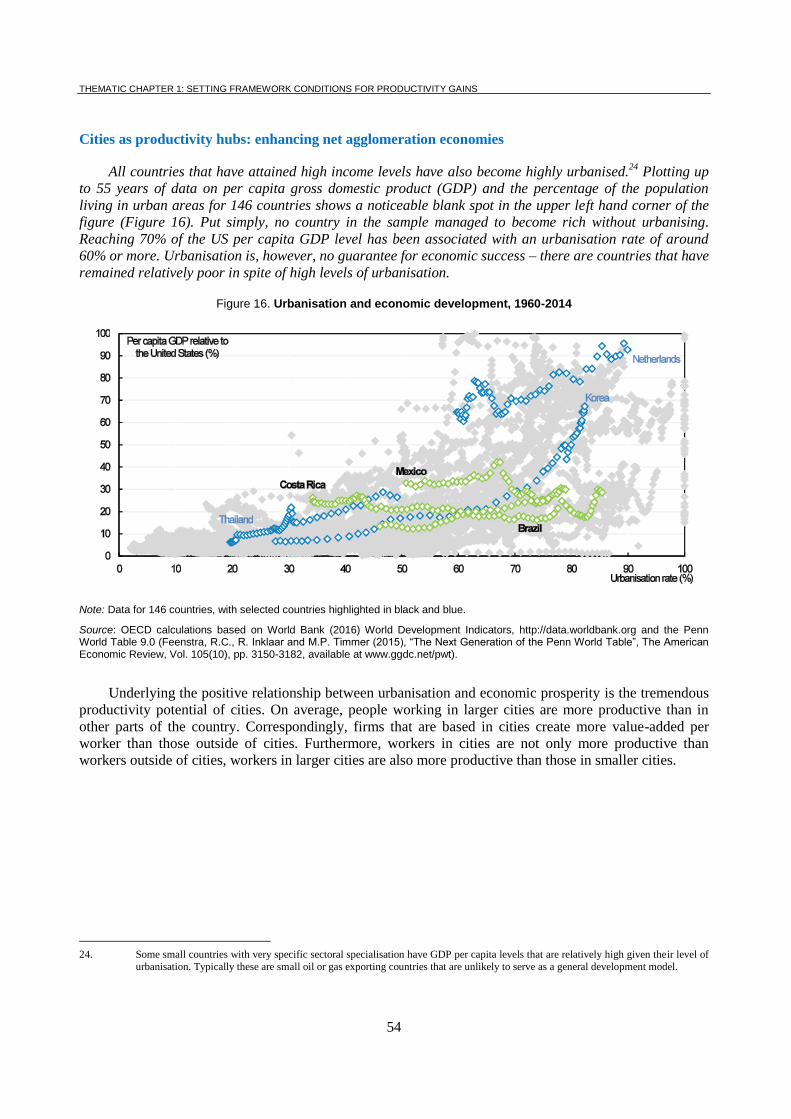
THEMATIC CHAPTER 1: SETTING FRAMEWORK CONDITIONS FOR PRODUCTIVITY GAINS
54
Cities as productivity hubs: enhancing net agglomeration economies
All countries that have attained high income levels have also become highly urbanised.24
Plotting up
to 55 years of data on per capita gross domestic product (GDP) and the percentage of the population
living in urban areas for 146 countries shows a noticeable blank spot in the upper left hand corner of the
figure (Figure 16). Put simply, no country in the sample managed to become rich without urbanising.
Reaching 70% of the US per capita GDP level has been associated with an urbanisation rate of around
60% or more. Urbanisation is, however, no guarantee for economic success – there are countries that have
remained relatively poor in spite of high levels of urbanisation.
Figure 16. Urbanisation and economic development, 1960-2014
Note: Data for 146 countries, with selected countries highlighted in black and blue.
Source: OECD calculations based on World Bank (2016) World Development Indicators, http://data.worldbank.org and the Penn World Table 9.0 (Feenstra, R.C., R. Inklaar and M.P. Timmer (2015), “The Next Generation of the Penn World Table”, The American Economic Review, Vol. 105(10), pp. 3150-3182, available at www.ggdc.net/pwt).
Underlying the positive relationship between urbanisation and economic prosperity is the tremendous
productivity potential of cities. On average, people working in larger cities are more productive than in
other parts of the country. Correspondingly, firms that are based in cities create more value-added per
worker than those outside of cities. Furthermore, workers in cities are not only more productive than
workers outside of cities, workers in larger cities are also more productive than those in smaller cities.
24. Some small countries with very specific sectoral specialisation have GDP per capita levels that are relatively high given their level of
urbanisation. Typically these are small oil or gas exporting countries that are unlikely to serve as a general development model.
THEMATIC CHAPTER 1: SETTING FRAMEWORK CONDITIONS FOR PRODUCTIVITY GAINS
55
Two factors are responsible for the economic prowess of cities. The first is education, training and
skills. Cities, and especially larger cities, have more highly educated inhabitants than other regions.
Residents of cities get more education because the presence of higher education institutions makes it easier
for them to obtain it. Furthermore, cities and the opportunities for work and consumption, as well as the
amenities they provide, attract educated people from other parts of a country. Since a more educated
workforce is also more productive, cities outperform other areas. But this factor is not unique to cities. If
workers were to move to other parts of a country, they would retain their education and skills and therefore
also their level of productivity.
But cities provide more than a home to a relatively more educated workforce. Cities create
“agglomeration economies”, the second factor contributing to higher productivity in larger cities.
Agglomeration economies occur when people live and work in close distance to each other and if firms
operate in close proximity. To illustrate the effect, it is helpful to think of a hypothetical example. If it were
possible to randomly pick a person and move the person from one location to another, the same person
would on average be more productive in a larger city. While this is the case for workers of all skill levels,
the effects are stronger for high-skilled workers than for low-skilled ones.
Estimates that explicitly distinguish between the contribution of people’s skills and agglomeration
economies support the important role of agglomeration economies for a city’s productivity. Typical
estimates of the total magnitude imply that, on average, a doubling in city size increases worker
productivity by 2%-5% (Ahrend, Farchy, Kaplanis and Lembcke, forthcoming; OECD, 2015a). However,
the exact magnitude of agglomeration economies can vary around this average and depends on
characteristics of a place, such as the sectoral composition of its economy.
Three forces are thought to create agglomeration economies (Duranton and Puga, 2004). First, by
locating in close proximity, firms can share suppliers, thereby allowing them to specialise and through that
specialisation become more productive. Second, large cities are home to a variety of workers and firms,
which creates more opportunities for workers to find the ideal job and for firms to find the “best matching”
– most productive – employee for a job. Third, informal interaction and learning from others is facilitated
by proximity. This creates knowledge spillovers and therefore better diffusion of ideas and technologies.
Especially in economies that move further into knowledge intensive production, the availability of skilled
workers and the knowledge that can be shared locally is becoming increasingly important.
But there is a flipside to agglomeration economies: agglomeration costs. As any city dweller can
attest, prices for housing and local services are significantly higher in larger cities. And there are
additional, non-pecuniary costs: congestion reduces life satisfaction and economic productivity because of
the time that workers spend stuck in traffic. Air pollution decreases the health of the population, which – in
addition to being undesirable in its own right – translates into higher health care costs and economic losses
due to missed days of work. Especially in rapidly growing cities these costs can be a drag on productivity,
as infrastructure and public services fail to keep up with growing demand.
A recent OECD review of the Valle de México metropolitan area that has Mexico City as its core
exemplifies many of the challenges Latin American cities face (OECD, 2015b). For example in the field of
transport, the Valle de México routinely ranks among the most congested metro areas and often tops the
rankings (e.g. TomTom, 2016). Despite significant investment in road infrastructure, the increase in the
number of cars and the length of trips people travel has reduced average speeds on the roads of the
metropolitan area from 38.5 km/h in 1990 to 17 km/h in 2007 (Tarriba and Alarcón, 2012). The associated
direct costs are substantial, for 2009 alone congestion was estimated to create an economic burden of about
USD 6.1 billion (MXN 82 163 million, ITDP, 2012). The social cost are likely to be even higher, as the
estimates only account for the time travellers lose in traffic, but not for the loss of public space associated
with crowded streets or the impact the lost time has on personal relationships.
THEMATIC CHAPTER 1: SETTING FRAMEWORK CONDITIONS FOR PRODUCTIVITY GAINS
56
Agglomeration costs are often easier to address for governments than agglomeration economies
because they fall more directly within the domain of public policy. Congestion levels, for example, are a
direct consequence of transport policies. Housing costs are largely determined by land use and building
code regulations. Pollution levels can be directly influenced by environmental regulations. In contrast, the
factors causing agglomeration economies are mostly related to private sector activity and public policy has
fewer tools to intervene directly. As agglomeration costs significantly lower the economic performance of
cities, policy makers should aim to reduce them as much as possible. In fact, reducing agglomeration costs
is often a more promising strategy to improve the economic performance of cities than increasing
agglomeration economies. Crucially, agglomeration costs or economies need to be tackled at the right
scale. This requires a co-ordinated metropolitan approach, often across the boundaries of local
governments (OECD, 2015c). At the national level it requires setting a sound governance framework for
metropolitan areas and co-ordination of policies across all levels of government.
THEMATIC CHAPTER 1: SETTING FRAMEWORK CONDITIONS FOR PRODUCTIVITY GAINS
57
REFERENCES
Ahrend, R., E. Farchy, I. Kaplanis and A.C. Lembcke (forthcoming), “What Makes Cities More
Productive? Evidence from 5 OECD Countries on the Role of Urban Governance”, Journal of
Regional Science.
Duranton, G. and D. Puga (2004), “Micro-foundations of urban agglomeration economies”, in:
Henderson, J.V. and J.F. Thisse (eds.), Handbook of Regional and Urban Economics, Vol. 4, Ch. 48,
pp 2 063-2 117.
Feenstra, R.C., R. Inklaar and M.P. Timmer (2015), “The Next Generation of the Penn World Table”, The
American Economic Review, Vol. 105(10), pp. 3150-3182, www.ggdc.net/pwt.
ITDP (2012), Transforming Urban Mobility in Mexico: Towards Accessible Cities Less Reliant on Cars,
Institute for Transport and Development Policy.
OECD (2015a), The Metropolitan Century: Understanding Urbanisation and its Consequences, OECD
Publishing, Paris. http://dx.doi.org/10.1787/9789264228733-en.
OECD (2015b), OECD Territorial Reviews: Valle de México, Mexico, OECD Publishing, Paris.
http://dx.doi.org/10.1787/9789264245174-en.
OECD (2015c), Governing the City, OECD Publishing, Paris. http://dx.doi.org/10.1787/9789264226500-
en.
Tarriba, G. and G. Alarcón (2012), “Movilidad competitiva en la Zona Metropolitana de la Ciudad de
México: Diagnóstico y soluciones factibles”, Instituto Mexicano para la Competitividad, Mexico,
D.F. available at http://imco.org.mx/wp-
content/uploads/2012/1/costos_congestion_en_zmvm2_final_abril.pdf.
TomTom (2016), TomTom Traffic Index 2016, available at http://www.tomtom.com/en_gb/trafficindex/
(accessed 28 September 2016).
World Bank (2016) World Development Indicators, http://data.worldbank.org.

58

59
THEMATIC CHAPTER 2
UNLEASHING PRIVATE SECTOR
PRODUCTIVITY

60
THEMATIC CHAPTER 2: UNLEASHING PRIVATE SECTOR PRODUCTIVITY
61
Competition Policy and Regulation
Making Latin America’s regulations more conducive to competition can help bridge the large gap in
productivity levels in relation to advanced economies. Competition can raise output per capita by
increasing investment and employment as well as by encouraging companies to be more innovative and
efficient, thereby lifting productivity (Bourlès et al. 2013; Conway et al., 2006; Nicoletti and Scarpetta,
2005, and Syverson, 2011). Evidence suggests that the medium-term impact on job creation and
employment of a competitive market environment – in particular one that facilitates the entry of new
suppliers – is clearly positive (Kitzmuller and Licetti,2013). Well-designed pro-competition product market
reforms can also improve social inclusion, directly by reducing the prices poorer people pay for basic
goods, as well as indirectly through stronger economic growth that boosts the incomes of all households.
The OECD indicator of product market regulation (PMR) measures a country’s regulatory stance in
an internationally comparable way to assess the degree to which policy settings promote or inhibit
competition in areas of the product market where competition is viable (Koske et al, 2015). Product market
regulations tend to be significantly more restrictive in Latin America than is typically the case in OECD
countries.
Barriers to entrepreneurship
The extent to which regulations facilitate or inhibit the entry of new firms is measured by the
component "barriers to entrepreneurship", which captures the complexity of regulatory procedures related
to the license and permit systems, the administrative burdens on start-ups (e.g. number of procedures and
bodies to contact to register a company) and the regulatory protection of incumbents through legal barriers
to entry and antitrust exemptions. Figure 17a shows that barriers to entrepreneurship are substantially
higher on average across Latin America than among OECD economies, although with substantial
variations across countries. Regulation is most friendly to competition in Chile, Colombia and Panama,
whereas barriers to firm entry are particularly high in Bolivia, Ecuador, Honduras or Venezuela.
Insofar as it is mainly young firms that bring growth in jobs and employment, regulatory and other
forms of obstacles to new firm entry are particularly damaging to growth prospects. Furthermore, by
limiting product market competition, high barriers to entry also weaken incentives among incumbents to
invest in innovative products and services. In addition, high barriers to entrepreneurship hinder the creation
of formal business and encourage micro and small enterprises to operate informally (Capelleras and Kantis,
2009).
State control
There is also substantial variation across countries in the extent to which state-induced distortions to
competitive neutrality create barriers to competition (Figure 17b). According to indicators assessing the
state control of business operations, regulation is relatively competition-friendly – even in comparison to
advanced economies - in Chile, Mexico and Peru, while it is significantly less so in Argentina, Bolivia,
Costa Rica, Ecuador and Venezuela. Within the state control component, the relatively high scores are
primarily driven by the extensive presence of state-owned enterprises (SOEs) in the business sector and,
most importantly, by the governance of such enterprises which tends to insulate them from market
discipline. A system of governance that induces SOEs to operate on a commercial basis is necessary to
preserve the level playing field and to promote a more efficient allocation of capital and labour resources.
THEMATIC CHAPTER 2: UNLEASHING PRIVATE SECTOR PRODUCTIVITY
62
Barriers to trade and investment
In addition to promoting stronger competition, the openness of domestic markets to foreign products
and suppliers is essential for the diffusion of productivity gains from firms operating at the frontier to
lagging domestic firms. Regulations in this area are particularly stringent relative to the stance observed in
advanced economies (Figure 17c). Implicit barriers to trade are relatively low in Chile and Nicaragua. At
the other side of the spectrum the scope of barriers is largest in Argentina, Bolivia or Honduras.
Reducing barriers to international trade would contribute to stronger productivity because competition
with foreign suppliers would encourage firms to become more efficient. Improvements in the areas of trade
facilitation and logistics performance and in the quality of infrastructure, which tends to be lower in Latin
America than in competitors, would support GVC integration. Similarly strengthening intellectual property
protection and the creation of an efficient services sector and innovation-friendly business environment
would be highly beneficial for Latin America in order to move up the value chain.
Barriers to competition in network industries and professional services
Beyond economy-wide barriers to competition, it is important to assess also regulations in key
sectors, such as energy, transport or telecommunications. One reason is that the presence of a network
component at the heart of these industries means that one segment of the production chain is a natural
monopoly (e.g. transmission grid in electricity, or mobile networks in telecommunications). Another
reason is that the output from these industries often constitutes a major input in the production of firms in
downstream sectors. Hence, regulation that does not adequately stimulate competitive outcomes in network
industries means higher prices for energy, telecommunications and transport with significant knock-on
effects on the competitiveness of firms producing final goods and services, as highlighted in OECD
reviews of Telecommunication Policy and Regulation in a number of Latin American countries (OECD,
2012 and OECD, 2014) .
In the same vein, the strength of competition in professional series, such as legal, accounting or
engineering, can have significant knock-on effects on the performance of firms relying on theses for their
own production. While the scope for action in both areas varies across countries (Figure 17d), fostering
competition in these key sectors would boost productivity and lower prices. It would improve social
cohesion as the negative effect of monopoly power tends to be greatest among poor households (Urzúa,
2013). To limit the incidence or exercise of monopoly power, prevent restrictive trade practice and protect
consumers from unfair commercial dealings, it is fundamental that competition authorities are granted
decisional, administrative and budgetary independence. In Latin America only some competition agencies
have express powers to perform market studies, and only some of them have sufficient resources (OECD,
2015).
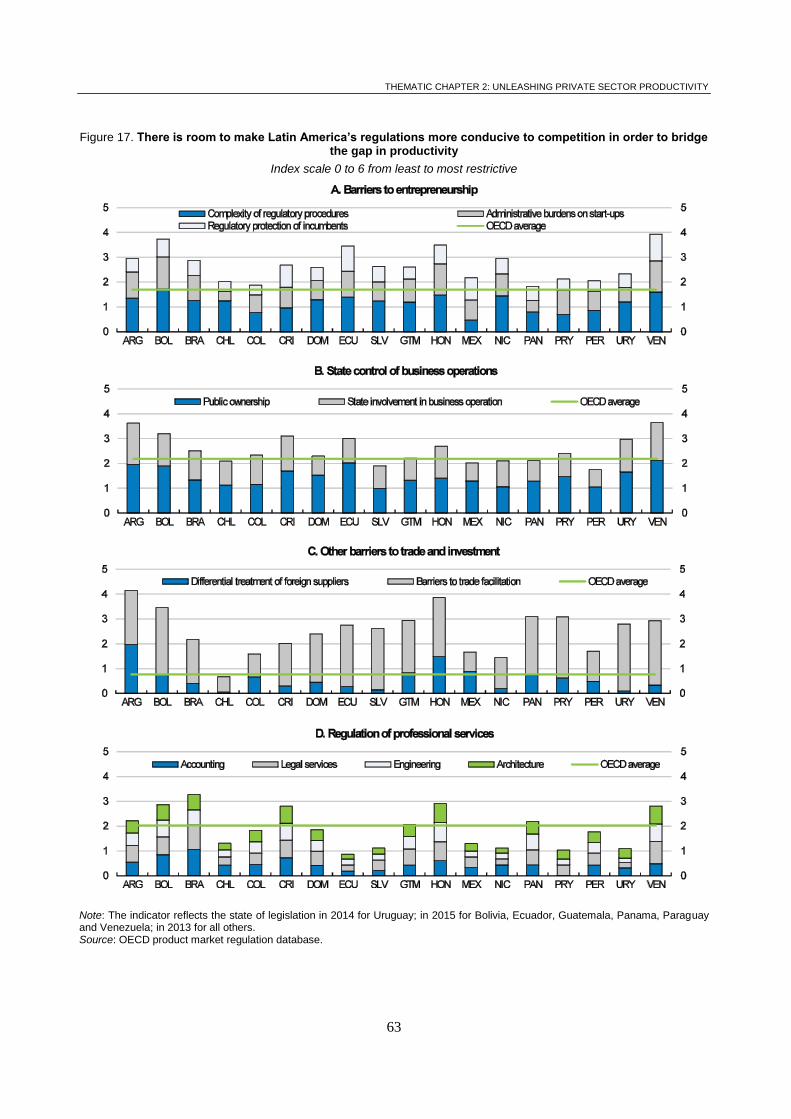
THEMATIC CHAPTER 2: UNLEASHING PRIVATE SECTOR PRODUCTIVITY
63
Figure 17. There is room to make Latin America’s regulations more conducive to competition in order to bridge the gap in productivity
Index scale 0 to 6 from least to most restrictive
Note: The indicator reflects the state of legislation in 2014 for Uruguay; in 2015 for Bolivia, Ecuador, Guatemala, Panama, Paraguay and Venezuela; in 2013 for all others. Source: OECD product market regulation database.
THEMATIC CHAPTER 2: UNLEASHING PRIVATE SECTOR PRODUCTIVITY
64
REFERENCES
Bourlès, R. et al. (2013), “Do Product Market Regulations in Upstream Sectors Curb Productivity Growth:
Panel Data Evidence for OECD Countries”, The Review of Economics and Statistics, Vo. 95, No 5.
December.
Capelleras, J. and H. Kantis, (2009), “Nuevas empresas en América Latina: factores que favorecen su
rápido crecimiento” [New Firms in Latin America: High-growth Enhancing Factors], Departament
d’Economia de l’Empresa Universitat Autònoma de Barcelona, Barcelona.
Conway, P., D. de Rosa, G. Nicoletti, and F. Steiner (2006), “Regulation, Competition and Productivity
Convergence”, OECD Economics Department Working Papers, No. 509.
Kitzmuller, M., and M. M. Licetti, (2013), “Competition Policy: Encouraging Thriving Markets for
Development”, ViewPoint Public Policy for the Private Sector Series, (331).
Koske, I., I., Wanner, R., Bitetti and O. Barbiero (2015), “The 2013 Up-date of the OECD Product Market
Regulation Indicators – Policy Insights for OECD and non-OECD countries”, OECD Economics
Department Working Paper, No. 1200.
Nicoletti, G. and S. Scarpetta (2005), “Product Market Reforms and Employment in OECD Countries”,
OECD Economics Department Working Papers, No. 472.
OECD (2015), Competition and Market Studies in Latin America. The case of Chile, Colombia, Costa
Rica, Mexico, Panama and Peru.OECD Publishing, Paris.
OECD (2014), OECD Review of Telecommunication Policy and Regulation in Colombia, OECD
Publishing, Paris. DOI: http://dx.doi.org/10.1787/9789264208131-en
OECD (2012), OECD Review of Telecommunication Policy and Regulation in Mexico, OECD Publishing,
Paris. DOI: http://dx.doi.org/10.1787/9789264060111-en
Syverson, C. (2011), “What Determines Productivity?” Journal of Economic Literature, 49(2), 326-365.
Urzúa, C.M. (2013), “Distributive and Regional Effects of Monopoly Power”, Economía Mexicana Nueva
Época, Vol. XXII, No. 2, http://www.economiamexicana.cide.edu/num_anteriores/XXII-2/02-
EM_Carlos_M_Urzua.pdf
.
THEMATIC CHAPTER 2: UNLEASHING PRIVATE SECTOR PRODUCTIVITY
65
Digitalisation and Productivity
Digitalisation is transforming the global economy, changing the manner in which production is
organised, the characteristics of market transactions, and the very nature of the goods and services
consumed. While growing evidence on the productivity gains from increased digitalisation is emerging, it
has also become clear that in order for firms to fully exploit the potential productivity gains from
digitalisation, they need to invest in both organisational and human capital. Key policy challenges for
increasing ICT adoption by firms in the LAC region include: expanding the broadband infrastructure;
strengthening competition in telecom markets; promoting Internet openness so that firms can benefit from
the full breadth of digital services and applications; developing policies to increase ICT adoption in firms,
with a focus on small and young firms; increasing human capital, particularly skills required for to the
effective of digital technologies at work; and increasing firms' awareness on the possibilities of electronic
commerce and its potential to increase business performance. Perhaps most importantly, LAC countries
need to review legacy regulations which may be inhibiting digitalisation.
Latin America and Digitalisation Today
Digitalisation has revolutionised the global economy. Continued advances in information
communication technology (ICT) are influencing the nature of production, the organisational structure of
firms as well as their ability to interact with consumers and suppliers. ICTs not only allow greater access to
foreign markets, but they also enable real-time communication across devices facilitating automated
decision making via the Internet of Things (OECD 2016a). Advanced manufacturing using digital
technologies has the potential to increase the range of products produced by firms, lowering the cost of
innovation and decreasing the number of production stages (OECD 2016a). In addition, access to the cloud
can in some cases negate the need for substantial investment in hardware infrastructure while at the same
time providing firms with storage facilities, processing power, and a range of application services (OECD
2015a and OECD 2015b). Furthermore, the diffusion of advanced Data Management and Enterprise
resource planning (EPR) applications, allow firms to better understand the day-to-day performance of
various business functions potentially leading to greater efficiency and innovation (McAfee et al 2012).
Such developments should lead to productivity gains, and there is now a substantial body of research
which demonstrates that ICTs reduce production time, increase innovation and specialization, improve
accuracy and enable firms to replicate processes faster, all of which generate productivity gains.25
However, reaping the productivity benefits of investment in digital technologies requires investment in
organisational, managerial and human capital.26
Moreover, the precise role that ICTs (and digitalisation
more generally) can play in firm performance varies across sectors and bundles of technologies in which
firms invest.27
25 For a review of recent evidence see OECD (2016d). One of the few studies to look at these issues in a Latin American context is Aboal and
Tacsir (2015).
26 See Bloom et al. (2012) and OECD (2016c).
27 Bloom et al. (2009) and Garicano and Rossi-Hansberg (2006).
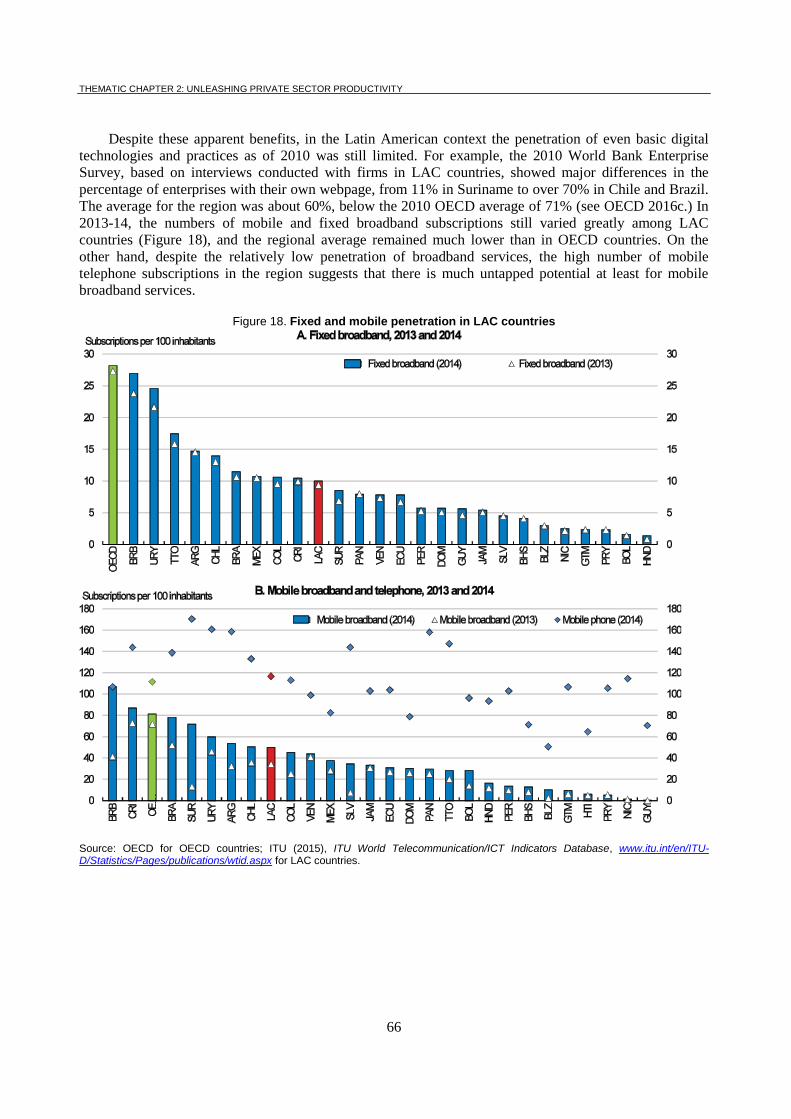
THEMATIC CHAPTER 2: UNLEASHING PRIVATE SECTOR PRODUCTIVITY
66
Despite these apparent benefits, in the Latin American context the penetration of even basic digital
technologies and practices as of 2010 was still limited. For example, the 2010 World Bank Enterprise
Survey, based on interviews conducted with firms in LAC countries, showed major differences in the
percentage of enterprises with their own webpage, from 11% in Suriname to over 70% in Chile and Brazil.
The average for the region was about 60%, below the 2010 OECD average of 71% (see OECD 2016c.) In
2013-14, the numbers of mobile and fixed broadband subscriptions still varied greatly among LAC
countries (Figure 18), and the regional average remained much lower than in OECD countries. On the
other hand, despite the relatively low penetration of broadband services, the high number of mobile
telephone subscriptions in the region suggests that there is much untapped potential at least for mobile
broadband services.
Figure 18. Fixed and mobile penetration in LAC countries
Source: OECD for OECD countries; ITU (2015), ITU World Telecommunication/ICT Indicators Database, www.itu.int/en/ITU-D/Statistics/Pages/publications/wtid.aspx for LAC countries.
THEMATIC CHAPTER 2: UNLEASHING PRIVATE SECTOR PRODUCTIVITY
67
Policy Implications
In order to fully reap the productivity benefits from digitalisation, policy settings need to ensure
access and competition, preserve the openness of the Internet, and address privacy concerns. Digitally-
enabled innovation also requires new infrastructure such as broadband, spectrum and new Internet
addresses. Significant public resources have gone into investment in broadband infrastructure.
Ensuring that digitalisation does not reduce competition is a particular challenge. Never before have
leading firms grown so large so quickly. Some experts have observed, furthermore, that unlike traditional
manufacturing sectors, the digital economy’s most meaningful competition takes place among platforms
created by companies that use very different business models, rather than among companies that all follow
more or less the same model. Moreover, the biases and misperceptions that often shape consumer decisions
in the offline environment are particularly harmful in the more distant online context. Provision of
information to consumers acquiring digital content products is key to ensure widespread digitalisation.
In order to maximise the benefits of the digital economy, the LAC region needs to ensure that
broadband services are affordable and accessible. This requires investment in networks and supply of
broadband services by private investors, which is predicated upon a stable and predictable regulatory
framework. However, private investment may have to be complemented by public sector investment,
particularly in more remote regions. Irrespective of the source of financing for initial investment, an
effective regulatory framework is required to ensure competition in the market. (OECD 2016c)
Equally importantly, the LAC region needs to develop policies to increase ICT adoption by firms,
specifically by small and young firms, while ensuring that the diffusion of digital technologies is
accompanied by the development of the skills needed for their effective use (OECD, 2016d) These policies
should include increasing firms' awareness on the possibilities of electronic commerce and its potential to
increase business performance, and ensuring that “legacy” regulations do not inhibit digitalisation by
undermining competition in the market.
Box 2. Broadband Policies for Latin America and the Caribbean – A Digital Economy Toolkit
Broadband networks are the foundation of digital economies. Increased availability and effective use of the services enabled by broadband can advance social inclusion, productivity and good governance. A range of challenges has to be overcome, however, in providing readily accessible, universal and locally relevant broadband-based services in many parts of the world. In the Latin American and Caribbean (LAC) region, some 300 million people have no access to the Internet. While new generations of broadband networks are rapidly emerging, much remains to be done to expand the necessary infrastructure and to encourage individuals, business and governments to make the most of what broadband has to offer.
Increasing connectivity and the use of digital services in the LAC region will require policies and practices that address major supply and demand issues in a holistic and coherent manner. The OECD-IDB report Broadband Policies for Latin America and the Caribbean: A Digital Economy Toolkit (OECD 2016b) sheds light on good practices and case studies, based on a whole-of-government approach. Its aim is to offer public authorities an overview of the policies, regulatory practices and options that can maximise the potential of broadband as a driver of economic and social development. The 15 chapters of the Toolkit cover a broad array of topics on broadband policy making, from digital strategies, regulatory frameworks and spectrum management, to competition, access, affordability and taxation, including education, skills and business uptake, as well digital security and privacy.
THEMATIC CHAPTER 2: UNLEASHING PRIVATE SECTOR PRODUCTIVITY
68
REFERENCES
Aboal D. and Tacsir E., (2015). "Innovation and productivity in services and manufacturing : The role of
ICT investment," MERIT Working Papers 012, United Nations University - Maastricht Economic
and Social Research Institute on Innovation and Technology (MERIT)
Bloom, N, Garicano, L, Sadun, R, and John Van Reenen. (2012). “Americans Do IT Better: US
Multinationals and the Productivity Miracle.” The American Economic Review 102 (1): 167–201.
Garicano, L, and Esteban Rossi-Hansberg. (2006). “Organization and Inequality in a Knowledge
Economy.” The Quarterly Journal of Economics 121 (4): 1383–1435.
McAfee, A, Brynjolfsson, E, Davenport, T, Patil, D and Dominic Barton. (2012). “Big Data.” The
Management Revolution. Harvard Bus Rev 90 (10): 61–67.
OECD (2016a). “Background Report for Panel 2.2 of the 2016 Ministerial Meeting on the Digital
Economy – Tomorrow’s Internet of Things, DSTI/ICCP/CISP(2015)6/REV2.”
OECD (2016b) Broadband Policies for Latin America and the Caribbean, Paris, OECD Publishing.
OECD (2016c) “Having the right mix: The role of skill bundles for comparative advantage and industry
performance in GVCs” (DSTI/IND/WPIA(2016)4).
OECD (2016d). “The Role of Policy in Digital Adoption and Usage by Firms”
(DSTI/IND(2016)7).OECD (2016), "Skills for a Digital World: 2016 Ministerial Meeting on the
Digital Economy Background Report", OECD Digital Economy Papers, No. 250, OECD
Publishing, Paris. DOI: http://dx.doi.org/10.1787/5jlwz83z3wnw-en
OECD (2015a). OECD Digital Economy Outlook 2015. Paris: Organisation for Economic Co-operation
and Development.
OECD (2015b). Data-Driven Innovation. Paris: Organisation for Economic Co-operation and
Development.
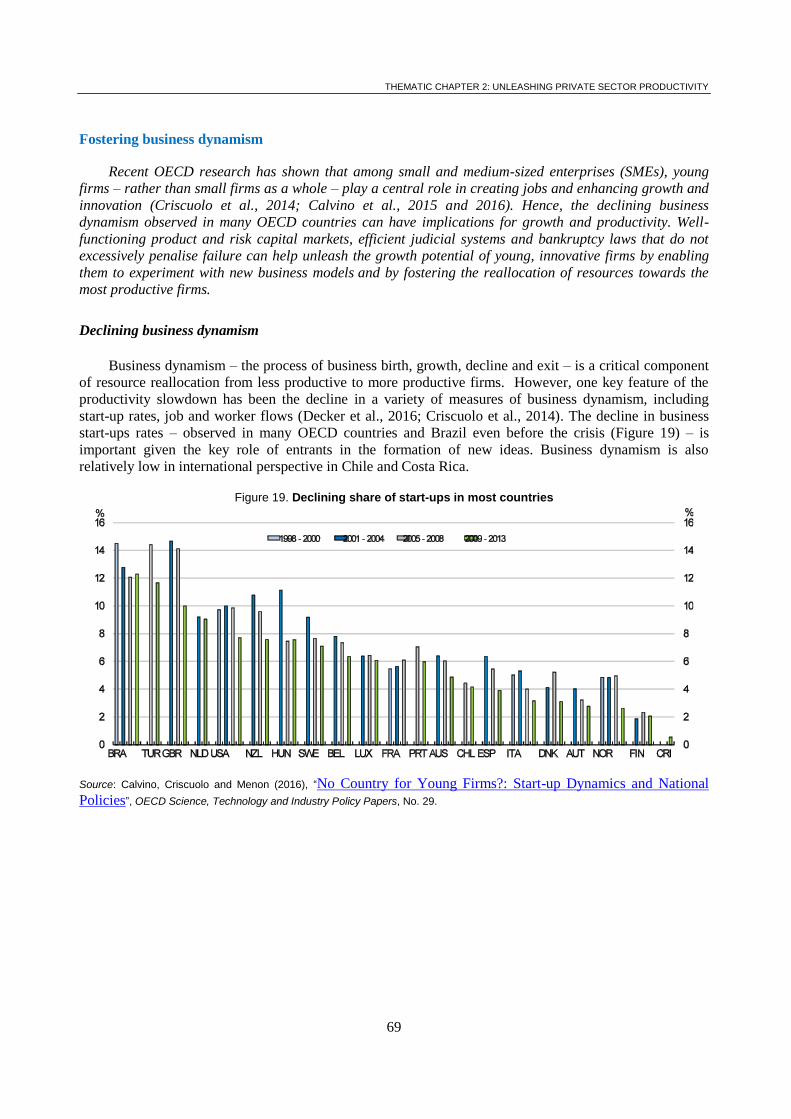
THEMATIC CHAPTER 2: UNLEASHING PRIVATE SECTOR PRODUCTIVITY
69
Fostering business dynamism
Recent OECD research has shown that among small and medium-sized enterprises (SMEs), young
firms – rather than small firms as a whole – play a central role in creating jobs and enhancing growth and
innovation (Criscuolo et al., 2014; Calvino et al., 2015 and 2016). Hence, the declining business
dynamism observed in many OECD countries can have implications for growth and productivity. Well-
functioning product and risk capital markets, efficient judicial systems and bankruptcy laws that do not
excessively penalise failure can help unleash the growth potential of young, innovative firms by enabling
them to experiment with new business models and by fostering the reallocation of resources towards the
most productive firms.
Declining business dynamism
Business dynamism – the process of business birth, growth, decline and exit – is a critical component
of resource reallocation from less productive to more productive firms. However, one key feature of the
productivity slowdown has been the decline in a variety of measures of business dynamism, including
start-up rates, job and worker flows (Decker et al., 2016; Criscuolo et al., 2014). The decline in business
start-ups rates – observed in many OECD countries and Brazil even before the crisis (Figure 19) – is
important given the key role of entrants in the formation of new ideas. Business dynamism is also
relatively low in international perspective in Chile and Costa Rica.
Figure 19. Declining share of start-ups in most countries
Source: Calvino, Criscuolo and Menon (2016), “No Country for Young Firms?: Start-up Dynamics and National
Policies”, OECD Science, Technology and Industry Policy Papers, No. 29.
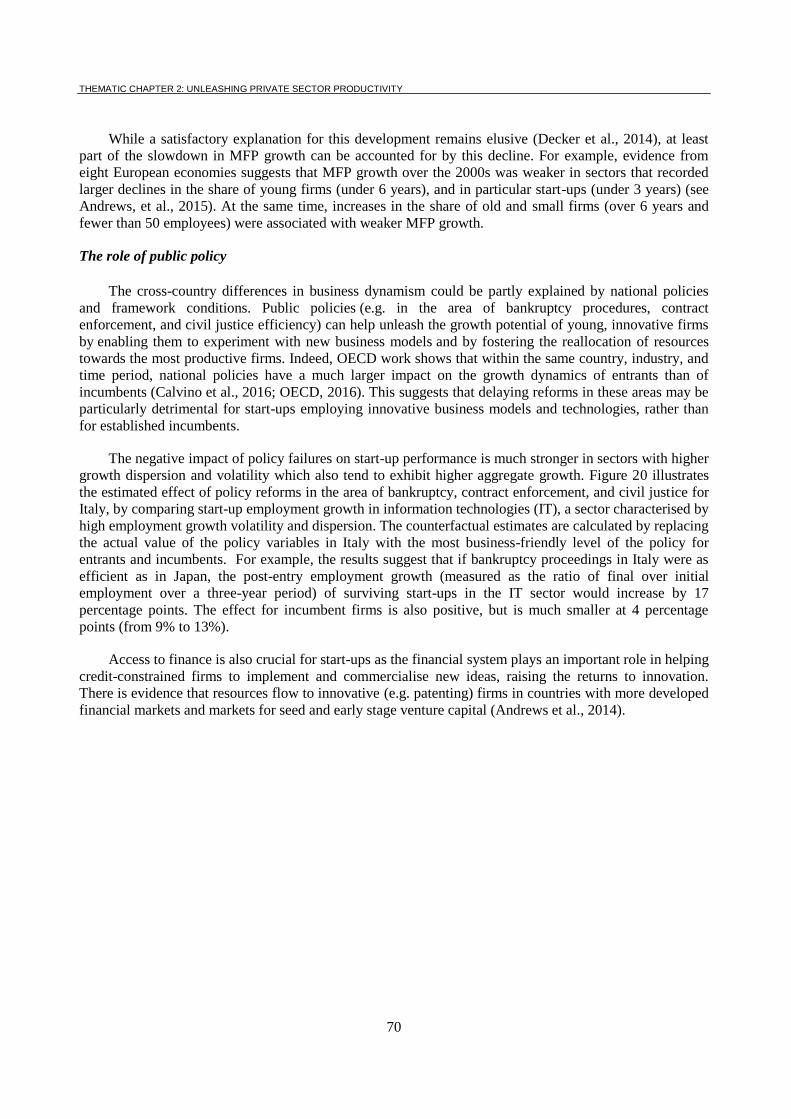
THEMATIC CHAPTER 2: UNLEASHING PRIVATE SECTOR PRODUCTIVITY
70
While a satisfactory explanation for this development remains elusive (Decker et al., 2014), at least
part of the slowdown in MFP growth can be accounted for by this decline. For example, evidence from
eight European economies suggests that MFP growth over the 2000s was weaker in sectors that recorded
larger declines in the share of young firms (under 6 years), and in particular start-ups (under 3 years) (see
Andrews, et al., 2015). At the same time, increases in the share of old and small firms (over 6 years and
fewer than 50 employees) were associated with weaker MFP growth.
The role of public policy
The cross-country differences in business dynamism could be partly explained by national policies
and framework conditions. Public policies (e.g. in the area of bankruptcy procedures, contract
enforcement, and civil justice efficiency) can help unleash the growth potential of young, innovative firms
by enabling them to experiment with new business models and by fostering the reallocation of resources
towards the most productive firms. Indeed, OECD work shows that within the same country, industry, and
time period, national policies have a much larger impact on the growth dynamics of entrants than of
incumbents (Calvino et al., 2016; OECD, 2016). This suggests that delaying reforms in these areas may be
particularly detrimental for start-ups employing innovative business models and technologies, rather than
for established incumbents.
The negative impact of policy failures on start-up performance is much stronger in sectors with higher
growth dispersion and volatility which also tend to exhibit higher aggregate growth. Figure 20 illustrates
the estimated effect of policy reforms in the area of bankruptcy, contract enforcement, and civil justice for
Italy, by comparing start-up employment growth in information technologies (IT), a sector characterised by
high employment growth volatility and dispersion. The counterfactual estimates are calculated by replacing
the actual value of the policy variables in Italy with the most business-friendly level of the policy for
entrants and incumbents. For example, the results suggest that if bankruptcy proceedings in Italy were as
efficient as in Japan, the post-entry employment growth (measured as the ratio of final over initial
employment over a three-year period) of surviving start-ups in the IT sector would increase by 17
percentage points. The effect for incumbent firms is also positive, but is much smaller at 4 percentage
points (from 9% to 13%).
Access to finance is also crucial for start-ups as the financial system plays an important role in helping
credit-constrained firms to implement and commercialise new ideas, raising the returns to innovation.
There is evidence that resources flow to innovative (e.g. patenting) firms in countries with more developed
financial markets and markets for seed and early stage venture capital (Andrews et al., 2014).
THEMATIC CHAPTER 2: UNLEASHING PRIVATE SECTOR PRODUCTIVITY
71
Lifting anti-competitive product market regulations can also spur productivity growth via by
facilitating more entry, given that young firms have a comparative advantage in radical innovations.
Recent OECD research also suggests that the rising prevalence of “zombie” firms – defined as old firms
that have persistent problems meeting their interest payments – could create barriers to entry and constrain
the post-entry growth of young firms (Adalet McGowan et al., 2016). Hence, policies to address the
declining efficiency of the exit margin such as efficient bankruptcy regimes and judicial systems would
also address the barriers young firms face due to the increasing survival of low productivity firms at the
margins of exit.
Finally, it is possible that "regulatory incumbency" could play a role in hampering the opportunities
and growth prospects for start-ups since incumbents tend to have more lobbying power compared to young
firms and prospective entrants. This may generate additional barriers for entrants seeking to bring new and
disruptive technologies or business models to market.
Figure 20. Policy reform can increase the employment growth of start-ups
Italy: estimated effect in the information technology and other information services sector
Note: The bars show the estimated value if the policy indicator would shift to the most business-friendly level in the country sample, all else being equal, for entrants and incumbents. Dashed lines show 95% confidence intervals. The response variable is post entry growth, measured as the ratio of final over initial employment over a three-year period.
Source: Calvino, Criscuolo and Menon (2016), “No Country for Young Firms?: Start-up Dynamics and National Policies”, OECD
Science, Technology and Industry Policy Papers, No. 29.
THEMATIC CHAPTER 2: UNLEASHING PRIVATE SECTOR PRODUCTIVITY
72
REFERENCES
Adalet McGowan, M., D. Andrews and V. Millot (2016), “The Walking Dead?: Zombie Firms and
Productivity Performance in OECD Countries”, OECD Economics Department Working Papers,
forthcoming.
Andrews, D., C. Criscuolo and P. Gal (2016), “The Global Productivity Slowdown, Technology
Divergence and Public Policy: A Firm Level Perspective”, OECD Productivity Working Papers,
forthcoming.
Andrews, D., E. Bartelsman and C. Criscuolo (2015), “Firm Dynamics and Productivity Growth in
Europe”, mimeo, OECD.
Andrews, D., C. Criscuolo and C. Menon (2014), “Do Resources Flow to Patenting Firms?: Cross-Country
Evidence from Firm Level Data”, OECD Economics Department Working Papers, No. 1127.
Calvino, F., C. Criscuolo and C. Menon (2015), “Cross-country Analysis of Small Entrant Dynamics: The
Role of Policy”, OECD Science, Technology and Industry Policy Paper, No.5.
Calvino, F., C. Criscuolo and C. Menon (2016), “No Country for Young Firms?: Start-up Dynamics and
National Policies”, OECD Science, Technology and Industry Policy Papers, No. 29.
Criscuolo, C., P. Gal and C. Menon (2014), “The Dynamics of Employment Growth: New Evidence from
18 Countries”, OECD Science, Technology and Industry Policy Papers, No. 14.
Decker, R., J. Haltiwanger, R. Jarmin and J. Miranda (2016), “Changing Business Dynamism: Volatility of
Shocks vs. Responsiveness to Shocks”, mimeo.
Decker, R., J. Haltiwanger, R. Jarmin and J. Miranda (2014), “The Role of Entrepreneurship in US Job
Creation and Economic Dynamism”, Journal of Economic Perspectives, Vol. 28(3), pp. 3-24.
OECD (2016), “No Country for Young Firms?”, Directorate for Science, Technology and Innovation
Policy Note, June 2016.
For more information, see: http://www.oecd.org/sti/dynemp.htm
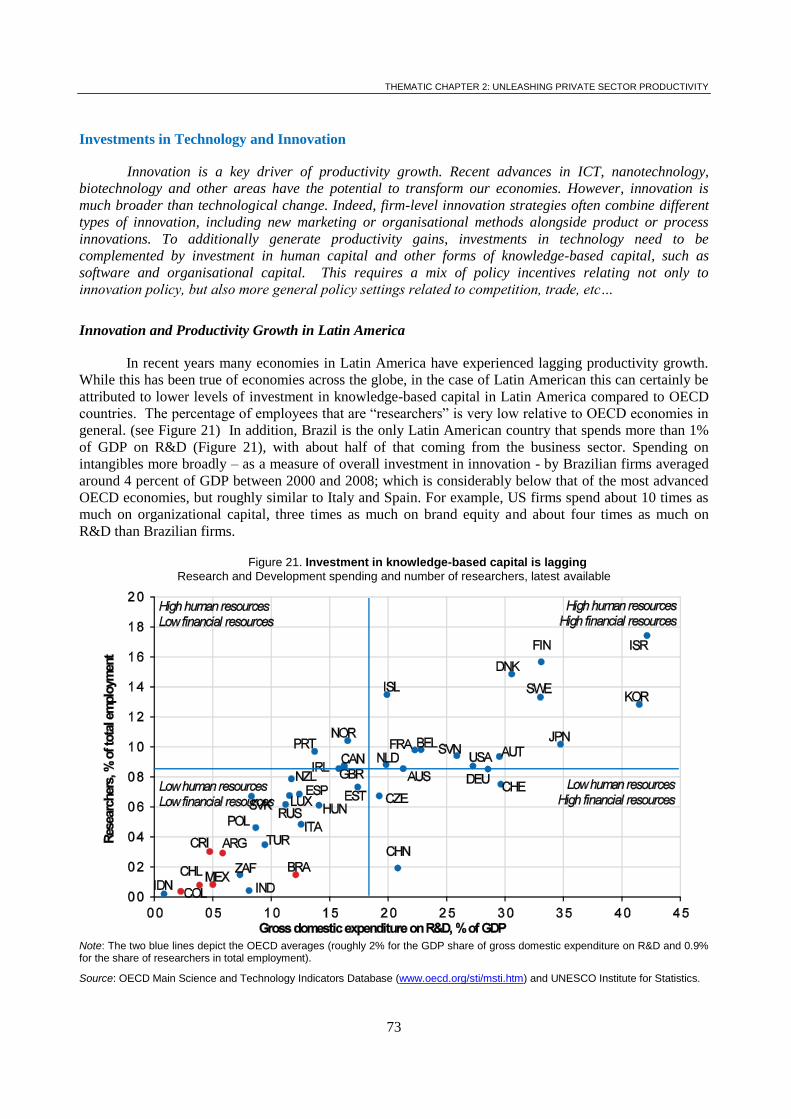
THEMATIC CHAPTER 2: UNLEASHING PRIVATE SECTOR PRODUCTIVITY
73
Investments in Technology and Innovation
Innovation is a key driver of productivity growth. Recent advances in ICT, nanotechnology,
biotechnology and other areas have the potential to transform our economies. However, innovation is
much broader than technological change. Indeed, firm-level innovation strategies often combine different
types of innovation, including new marketing or organisational methods alongside product or process
innovations. To additionally generate productivity gains, investments in technology need to be
complemented by investment in human capital and other forms of knowledge-based capital, such as
software and organisational capital. This requires a mix of policy incentives relating not only to
innovation policy, but also more general policy settings related to competition, trade, etc…
Innovation and Productivity Growth in Latin America
In recent years many economies in Latin America have experienced lagging productivity growth.
While this has been true of economies across the globe, in the case of Latin American this can certainly be
attributed to lower levels of investment in knowledge-based capital in Latin America compared to OECD
countries. The percentage of employees that are “researchers” is very low relative to OECD economies in
general. (see Figure 21) In addition, Brazil is the only Latin American country that spends more than 1%
of GDP on R&D (Figure 21), with about half of that coming from the business sector. Spending on
intangibles more broadly – as a measure of overall investment in innovation - by Brazilian firms averaged
around 4 percent of GDP between 2000 and 2008; which is considerably below that of the most advanced
OECD economies, but roughly similar to Italy and Spain. For example, US firms spend about 10 times as
much on organizational capital, three times as much on brand equity and about four times as much on
R&D than Brazilian firms.
Figure 21. Investment in knowledge-based capital is lagging
Research and Development spending and number of researchers, latest available
Note: The two blue lines depict the OECD averages (roughly 2% for the GDP share of gross domestic expenditure on R&D and 0.9% for the share of researchers in total employment).
Source: OECD Main Science and Technology Indicators Database (www.oecd.org/sti/msti.htm) and UNESCO Institute for Statistics.
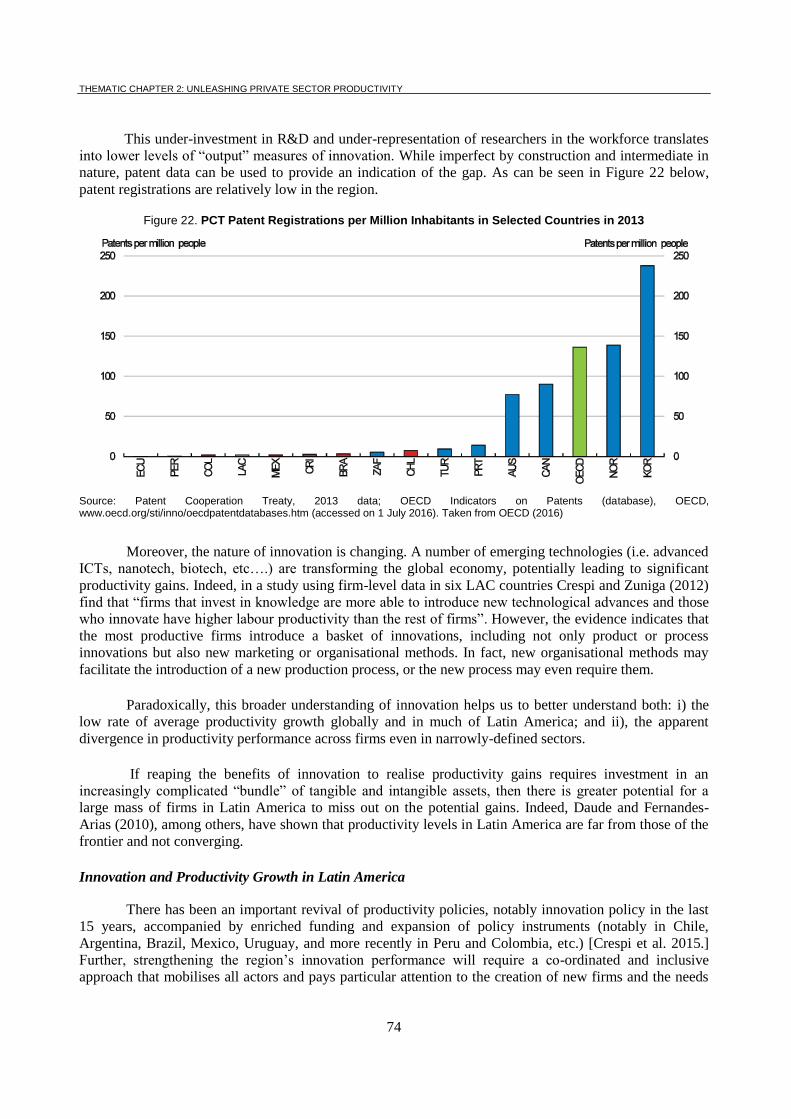
THEMATIC CHAPTER 2: UNLEASHING PRIVATE SECTOR PRODUCTIVITY
74
This under-investment in R&D and under-representation of researchers in the workforce translates
into lower levels of “output” measures of innovation. While imperfect by construction and intermediate in
nature, patent data can be used to provide an indication of the gap. As can be seen in Figure 22 below,
patent registrations are relatively low in the region.
Figure 22. PCT Patent Registrations per Million Inhabitants in Selected Countries in 2013
Source: Patent Cooperation Treaty, 2013 data; OECD Indicators on Patents (database), OECD, www.oecd.org/sti/inno/oecdpatentdatabases.htm (accessed on 1 July 2016). Taken from OECD (2016)
Moreover, the nature of innovation is changing. A number of emerging technologies (i.e. advanced
ICTs, nanotech, biotech, etc….) are transforming the global economy, potentially leading to significant
productivity gains. Indeed, in a study using firm-level data in six LAC countries Crespi and Zuniga (2012)
find that “firms that invest in knowledge are more able to introduce new technological advances and those
who innovate have higher labour productivity than the rest of firms”. However, the evidence indicates that
the most productive firms introduce a basket of innovations, including not only product or process
innovations but also new marketing or organisational methods. In fact, new organisational methods may
facilitate the introduction of a new production process, or the new process may even require them.
Paradoxically, this broader understanding of innovation helps us to better understand both: i) the
low rate of average productivity growth globally and in much of Latin America; and ii), the apparent
divergence in productivity performance across firms even in narrowly-defined sectors.
If reaping the benefits of innovation to realise productivity gains requires investment in an
increasingly complicated “bundle” of tangible and intangible assets, then there is greater potential for a
large mass of firms in Latin America to miss out on the potential gains. Indeed, Daude and Fernandes-
Arias (2010), among others, have shown that productivity levels in Latin America are far from those of the
frontier and not converging.
Innovation and Productivity Growth in Latin America
There has been an important revival of productivity policies, notably innovation policy in the last
15 years, accompanied by enriched funding and expansion of policy instruments (notably in Chile,
Argentina, Brazil, Mexico, Uruguay, and more recently in Peru and Colombia, etc.) [Crespi et al. 2015.]
Further, strengthening the region’s innovation performance will require a co-ordinated and inclusive
approach that mobilises all actors and pays particular attention to the creation of new firms and the needs
THEMATIC CHAPTER 2: UNLEASHING PRIVATE SECTOR PRODUCTIVITY
75
of SMEs, whose productivity and innovation gaps with regards to large firms are larger on average than in
OECD countries. Support for business innovation should be well balanced and not rely only on tax
incentives, as these often tend to favour large established incumbent firms. Well-designed, competitive
grants can be used to complement tax incentives and are better suited to the needs of young innovative
firms. Other important measures include public procurement, tax incentives for venture capital, innovation-
oriented standards, etc…The diversity in policy approaches places a premium on the evaluation of the
efficiency of different instruments, and more importantly on the policy mix. Yet, while there is evidence
that the complementarities and trade-offs among policy instruments are significant for assessing a
country’s STI policy and its impact on economic performance, they remain poorly understood. A strong
commitment to monitoring and evaluating policies to foster innovation is therefore crucial, together with
appropriate structures to ensure that the lessons learned from experience translate into more efficient
government actions.
A strong and efficient system for knowledge creation and diffusion that engages in the systematic
pursuit of fundamental knowledge is also essential to ensure that the frontier continues to shift outward.
This requires strong and well-governed universities and public research institutes, as well as mechanisms
that support and facilitate the interaction among knowledge institutions and the rest of the economy. As a
consequence, investment in knowledge infrastructure, notably broadband and other digital networks, have
become critical tools to enable co-operation and to provide new platforms that bolster innovation.
Regardless, these innovation policies are likely to have limited impact unless more is done to
simultaneously strengthen market competition in Latin America. International experience and
microeconomic research suggest that market competition and international openness are essential to
pressure entrepreneurs to allocate their talent and investment resources to continuously upgrade products
and processes, and to enable businesses to learn from the evolving global technology frontier and
commercialize that learning through larger markets. For example, differences in the role played by FDI in
different countries the region have significant implications for accessing the frontier. (see
OECD/CAF/ECLAC (2014).)
The importance of market competition as a necessary pre-condition for state support to innovation
to succeed is not always fully appreciated in some Latin American countries. Indeed, competition,
particularly from abroad, is sometimes seen as detrimental to the development of domestic enterprise.
However, Schumpeterian growth theory suggests that technical progress is driven by creative destruction,
whereby new innovations spurred by market competition replace older technologies. Indeed, the effect of
competition on innovation may depend on a given firm’s status: when existing firms are far away from the
technology frontier, increasing competition could actually discourage them from innovating because they
do not feel they have a chance to win and survive. For firms that are close enough to the frontier, the effect
is the opposite, since the exposure to competition spurs them to innovate and pull the rest of the economy
along. Therefore, failure to subject such firms to competitive pressures may lead them to get complacent,
or alternatively spend resources on lobbying government to keep their protected status intact.
Transforming innovation into productivity gains requires the diffusion of advances at the frontier
throughout the economy. Well-designed policy settings which relate to competition, employment, product
markets, etc… are required to encourage both experimentation and diffusion. The opportunity cost of
poorly designed structural policy in terms of lost productivity gains is both high and rising. As such,
structural policy is the necessary handmaiden to innovation policy.
THEMATIC CHAPTER 2: UNLEASHING PRIVATE SECTOR PRODUCTIVITY
76
REFERENCES
Christian Daude & Eduardo Fernandez-Arias, 2010. "On the Role of Productivity and Factor
Accumulation in Economic Development in Latin America and the Caribbean," Research
Department Publications 4653, Inter-American Development Bank, Research Department
Crespi, G., and P. Zuñiga. 2012. Innovation and Productivity: Evidence from Six Latin American
Countries. World Development 40(2): 273–290.
Crespi, G., Arias, F. and Stein, E. (2014), Development in the Americas (DIA) : Rethinking Productive
Development –Sound policies and Institutions for Economic Transformation
OECD (2016), Multi-dimensional Review of Peru: Volume 2. In-depth Analysis and Recommendations,
OECD Development Pathways, OECD Publishing, Paris. http://dx.doi.org/10.1787/9789264264670-
en
OECD/CAF/ECLAC (2014), Latin American Economic Outlook 2015: Education, Skills and Innovation
for Development, OECD Publishing, Paris.
DOI: http://dx.doi.org/10.1787/leo-2015-en
THEMATIC CHAPTER 2: UNLEASHING PRIVATE SECTOR PRODUCTIVITY
77
Doing well by doing good: How can the business sector help to achieve inclusive productivity
Latin American countries face challenges to foster productivity in an inclusive manner, i.e. combining
higher productivity with better health, education, quality jobs, formalisation, financial inclusion and work-
family balances. The business sector can be a strategic partner in the pursuit of inclusive productivity, with
the ability to have a profound impact on the well-being of workers together with an improving in the firms’
financial performance.
Improving the work-life balance of families
The corporate sector plays a role in shaping the daily lives of working families. Enabling a family-
friendly work-life balance is important for firms looking for skilled workers among the pool of talents.
Business communities and society as a whole can be open to more flexible work environments, promoting
work-life balance and diversity, notably for working parents providing care to young children or dependant
family members. Governments and employers can work together to address the issue by encouraging
flexible practices and arranging childcare facilities.
For women, reconciling family responsibilities and work assignments can be particularly challenging,
particularly in countries where they perform more hours of unpaid work at home than men. When children
are born, parental leave is often taken by mothers; however, if men and women are roughly equally likely
to take leave, employers will be less reluctant to hire women of childbearing-age. More OECD countries
are turning towards reserving non-transferable periods of paid parental leave exclusively for use by fathers
(OECD, 2016). A more gender-equitable use of parental leave entitlements by extending the length of
father specific leave can level the playing field, reduce the traditional role of women as caregivers, and
increase women’s working hours.
Women in leadership positions
Research shows that increasing the number of women in business leadership positions can pay off in
terms of financial performance. Companies with three or more women in top management score higher on
organisational criteria than companies with no female executives. Likewise, the return on equity is
consistently higher for companies with women on the executive board than for companies without women
on the executive board. A higher degree of diversity on members of executive boards gives a positive
signal to potential employees, raising competition among candidates applying for jobs. These results call
for measures to counter the negative bias in the perception of female leaders.
In many Latin American countries, the share of women with a seat at the executive board is limited
compared to OECD countries. Gender quotas to narrow the gender gap in corporate boards are in place in
several countries (e.g. Norway, Belgium, France, Canada (Quebec), etc.), ranging mostly from 30% to
50%, and varying for public and private companies. Governments can start with state-owned enterprises
and firms that rely on the government, and give incentives to other companies to reduce the gender gaps,
and not just in the boardroom. For instance, more broadly, companies could be required to report their
wage gender gaps and encouraged to set specific goals to reach equal pay for equal work and reduce
gender inequalities.
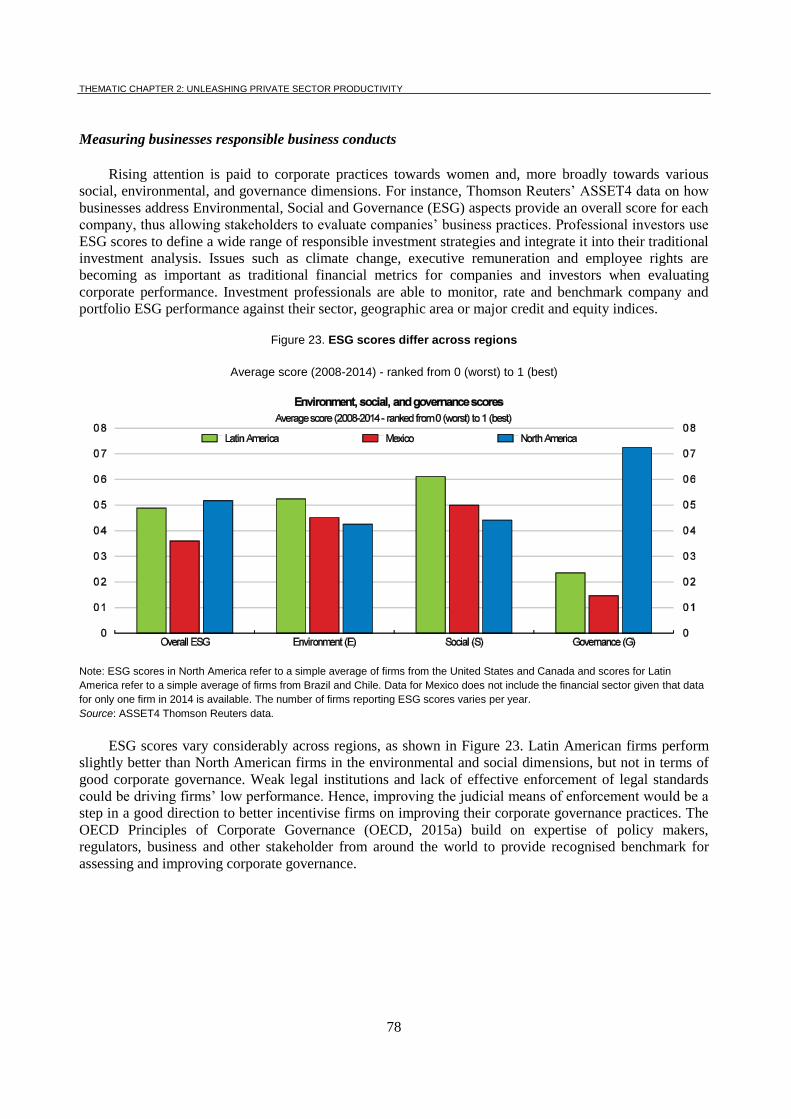
THEMATIC CHAPTER 2: UNLEASHING PRIVATE SECTOR PRODUCTIVITY
78
Measuring businesses responsible business conducts
Rising attention is paid to corporate practices towards women and, more broadly towards various
social, environmental, and governance dimensions. For instance, Thomson Reuters’ ASSET4 data on how
businesses address Environmental, Social and Governance (ESG) aspects provide an overall score for each
company, thus allowing stakeholders to evaluate companies’ business practices. Professional investors use
ESG scores to define a wide range of responsible investment strategies and integrate it into their traditional
investment analysis. Issues such as climate change, executive remuneration and employee rights are
becoming as important as traditional financial metrics for companies and investors when evaluating
corporate performance. Investment professionals are able to monitor, rate and benchmark company and
portfolio ESG performance against their sector, geographic area or major credit and equity indices.
Figure 23. ESG scores differ across regions
Average score (2008-2014) - ranked from 0 (worst) to 1 (best)
Note: ESG scores in North America refer to a simple average of firms from the United States and Canada and scores for Latin
America refer to a simple average of firms from Brazil and Chile. Data for Mexico does not include the financial sector given that data
for only one firm in 2014 is available. The number of firms reporting ESG scores varies per year.
Source: ASSET4 Thomson Reuters data.
ESG scores vary considerably across regions, as shown in Figure 23. Latin American firms perform
slightly better than North American firms in the environmental and social dimensions, but not in terms of
good corporate governance. Weak legal institutions and lack of effective enforcement of legal standards
could be driving firms’ low performance. Hence, improving the judicial means of enforcement would be a
step in a good direction to better incentivise firms on improving their corporate governance practices. The
OECD Principles of Corporate Governance (OECD, 2015a) build on expertise of policy makers,
regulators, business and other stakeholder from around the world to provide recognised benchmark for
assessing and improving corporate governance.
THEMATIC CHAPTER 2: UNLEASHING PRIVATE SECTOR PRODUCTIVITY
79
How does corporate social responsibility impact inclusive growth?
Research suggests that responsible business practices result in win-win outcomes, both for capital
owners and for society. Communities often respond positively to ESG-friendly firms, valuing their
practices and willing to pay more for the products of such firms, thus improving their sales and revenues.
Likewise, a company that offers its employees trainings, bonuses, compensation, good health insurance
and leaves might be rewarded with higher labour productivity as result of higher motivation.
Using panel data on the behaviour of 35 Mexican firms, 1457 North American firms, and 111 Latin
American firms spanning over a period of 2008 to 2015, Daubanes et al. (forthcoming) find a positive
association between overall ESG scores and firms’ return on equity, asset turnover, and labour
productivity. Firms’ revenues are positively associated with all three scores (E, S, and G) independently,
while labour productivity is also positively associated with the social and environmental score. These
results highlight the benefits of a comprehensive environment, social and corporate governance
management approach. Governments and business associations should work together to motivate firms to
set targets and action plans to increasingly adopt ESG-friendly practices as a way to incentive firms to do
well by being good.
REFERENCES
Daubanes.J, Lenain.P, Mehrez.M, Reynaud.J and Soneya.P (2016); “Doing well by doing good”,
forthcoming.
McKinsey (2010) “A tale of two Mexicos: Growth and prosperity in a two-speed economy”.
OECD (2016). OECD Economic Surveys: Mexico 2017, forthcoming.
OECD (2015), G20/OECD Principles of Corporate Governance, OECD Publishing, Paris.
DOI: http://dx.doi.org/10.1787/9789264236882-en
THEMATIC CHAPTER 2: UNLEASHING PRIVATE SECTOR PRODUCTIVITY
80
Reducing skill mismatches
Raising productivity growth is highly dependent on a country’s ability to innovate and adopt
technologies, which requires an effective supply of human capital, which can be achieved by both
increasing the stock of human capital and allocating the existing stock of human capital more efficiently.
The latter takes heightened importance in OECD countries, where the rate of increase in the stock of
human capital is projected to slow (Braconier et al., 2014). While there is much room to improve human
capital accumulation in Latin American countries through education policies (OECD/CAF/ECLAC, 2016),
the benefits to growth of these policies can take a long time to be realised. In this context, improving the
ability of economies to efficiently deploy their existing stock of human capital, i.e. reducing skill mismatch,
may be beneficial to growth in the short-to-medium term. However, some countries are more effective at
channeling skills to productive uses than others, and these differences can be partly explained by public
policies.
Skill mismatch and labour productivity
The efficiency of human capital allocation in OECD countries can be proxied by indicators of skill
mismatch, which combine information on self-reported skill mismatch and quantitative information on
skill proficiency from the 2012 Survey of Adult Skills (PIAAC) (see Box 3). While the effect of mismatch
on individual labour market outcomes is well understood, the potential gains to aggregate productivity
from improving the efficiency of human capital allocation is unclear. Mismatch indicators and firm-level
data can be used to better understand the sources of cross-country differences in living standards by
directly linking mismatch with labour productivity (Adalet-McGowan and Andrews, 2015). A key finding
to emerge is that high rates of skill mismatch – particularly over-skilling – tends to lower aggregate
productivity by constraining the growth of innovative firms.
On average across countries, roughly one-quarter of workers report a mismatch between their existing
skills and those required for their job – i.e. they are either over or under-skilled – but this figure reaches
43% in Chile, where skill mismatch is highest amongst the OECD countries in the sample (Figure 24).
Over-skilling is generally more common than under-skilling, with the average likelihood of being over-
skilled roughly two and a half times greater than that of being under-skilled. In Chile, both the percentage
of over-skilled and under-skilled workers are high at 28% and 15%, respectively and there is much scope
to improve the allocation of skills (Ollaberia, 2016).
Using an industry-level analysis, Adalet McGowan and Andrews (2015) show that higher skill
mismatch is associated with lower labour productivity performance, with over-skilling being particularly
costly. The negative association between over-skilling and labour productivity is driven through the
channel of a less efficient resource allocation. From the perspective of any given firm, hiring an over-
skilled worker may be beneficial for productivity, assuming there are no adverse effects on job satisfaction
and the higher wages do not more than offset any associated productivity gains. From the perspective of
the economy as a whole, however, the impacts may be very different. Assuming that wages do not adjust to
these frictions in the short-run, mismatch could have reallocation effects, if skilled labour is clogged up in
low productivity firms. In this case, the more productive firms remain smaller than otherwise, lowering
aggregate productivity relative to a situation where workers are reallocated to achieve a more efficient
match.
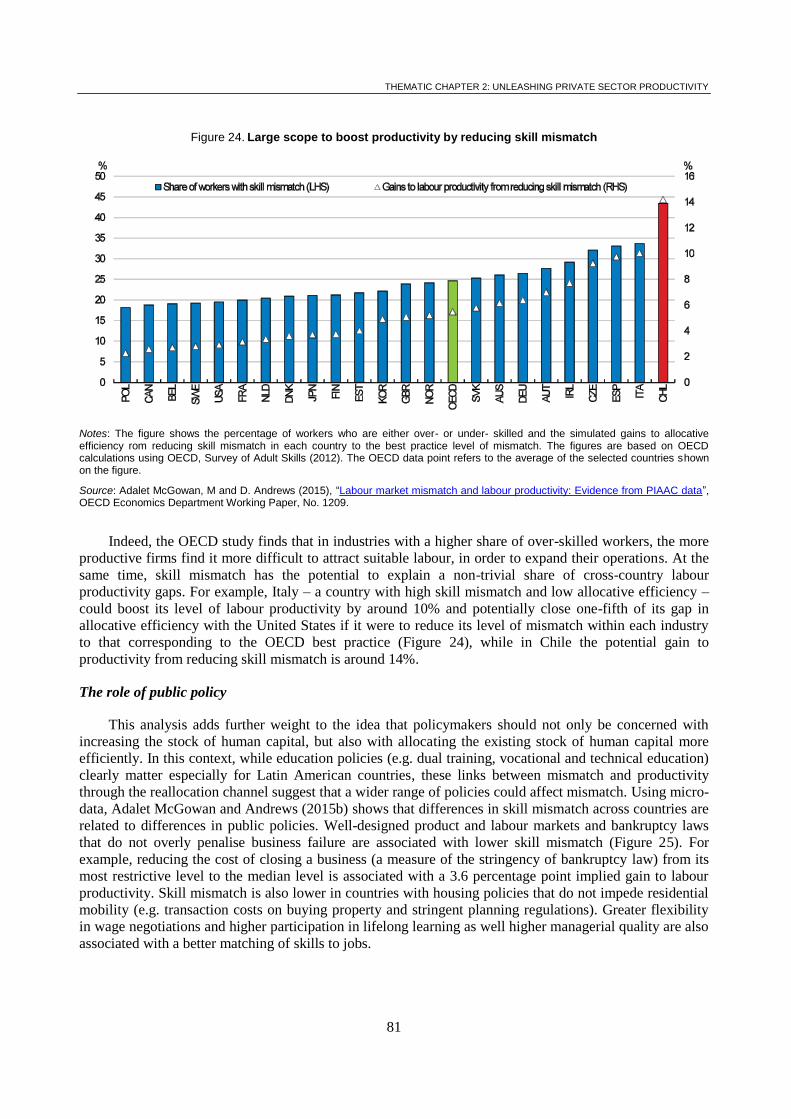
THEMATIC CHAPTER 2: UNLEASHING PRIVATE SECTOR PRODUCTIVITY
81
Figure 24. Large scope to boost productivity by reducing skill mismatch
Notes: The figure shows the percentage of workers who are either over- or under- skilled and the simulated gains to allocative efficiency rom reducing skill mismatch in each country to the best practice level of mismatch. The figures are based on OECD calculations using OECD, Survey of Adult Skills (2012). The OECD data point refers to the average of the selected countries shown on the figure.
Source: Adalet McGowan, M and D. Andrews (2015), “Labour market mismatch and labour productivity: Evidence from PIAAC data”, OECD Economics Department Working Paper, No. 1209.
Indeed, the OECD study finds that in industries with a higher share of over-skilled workers, the more
productive firms find it more difficult to attract suitable labour, in order to expand their operations. At the
same time, skill mismatch has the potential to explain a non-trivial share of cross-country labour
productivity gaps. For example, Italy – a country with high skill mismatch and low allocative efficiency –
could boost its level of labour productivity by around 10% and potentially close one-fifth of its gap in
allocative efficiency with the United States if it were to reduce its level of mismatch within each industry
to that corresponding to the OECD best practice (Figure 24), while in Chile the potential gain to
productivity from reducing skill mismatch is around 14%.
The role of public policy
This analysis adds further weight to the idea that policymakers should not only be concerned with
increasing the stock of human capital, but also with allocating the existing stock of human capital more
efficiently. In this context, while education policies (e.g. dual training, vocational and technical education)
clearly matter especially for Latin American countries, these links between mismatch and productivity
through the reallocation channel suggest that a wider range of policies could affect mismatch. Using micro-
data, Adalet McGowan and Andrews (2015b) shows that differences in skill mismatch across countries are
related to differences in public policies. Well-designed product and labour markets and bankruptcy laws
that do not overly penalise business failure are associated with lower skill mismatch (Figure 25). For
example, reducing the cost of closing a business (a measure of the stringency of bankruptcy law) from its
most restrictive level to the median level is associated with a 3.6 percentage point implied gain to labour
productivity. Skill mismatch is also lower in countries with housing policies that do not impede residential
mobility (e.g. transaction costs on buying property and stringent planning regulations). Greater flexibility
in wage negotiations and higher participation in lifelong learning as well higher managerial quality are also
associated with a better matching of skills to jobs.
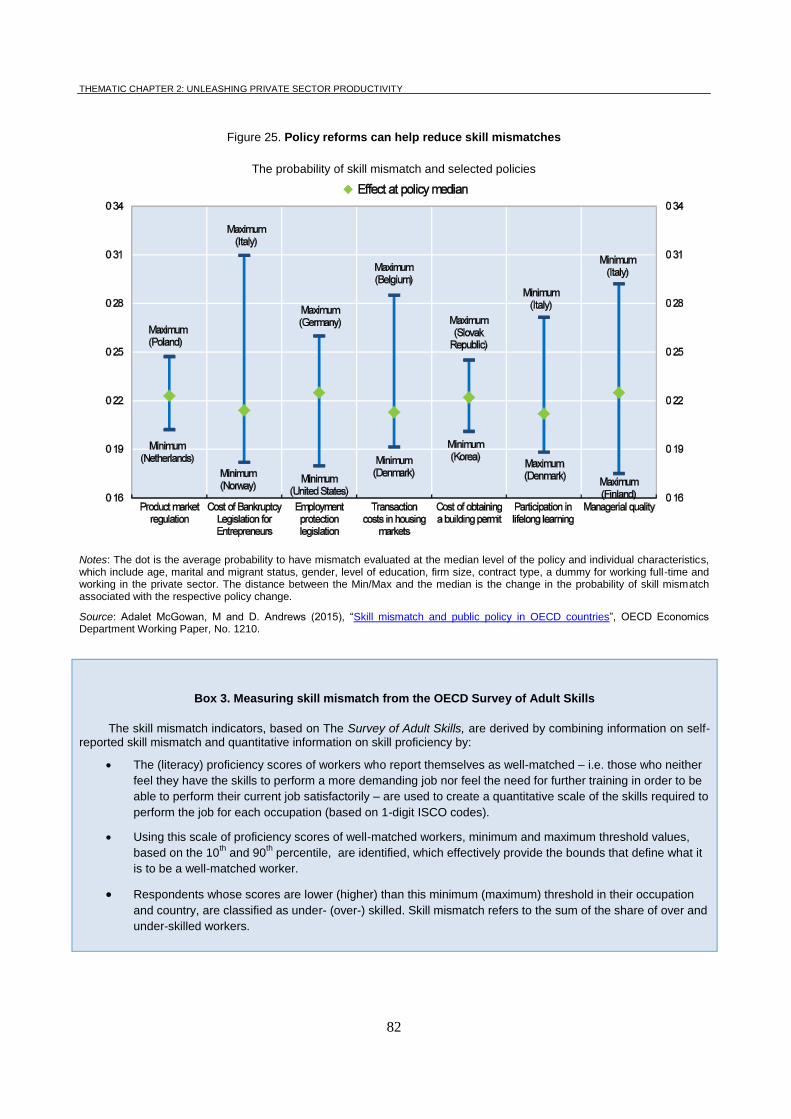
THEMATIC CHAPTER 2: UNLEASHING PRIVATE SECTOR PRODUCTIVITY
82
Figure 25. Policy reforms can help reduce skill mismatches
The probability of skill mismatch and selected policies
Notes: The dot is the average probability to have mismatch evaluated at the median level of the policy and individual characteristics, which include age, marital and migrant status, gender, level of education, firm size, contract type, a dummy for working full-time and working in the private sector. The distance between the Min/Max and the median is the change in the probability of skill mismatch associated with the respective policy change.
Source: Adalet McGowan, M and D. Andrews (2015), “Skill mismatch and public policy in OECD countries”, OECD Economics Department Working Paper, No. 1210.
Box 3. Measuring skill mismatch from the OECD Survey of Adult Skills
The skill mismatch indicators, based on The Survey of Adult Skills, are derived by combining information on self-reported skill mismatch and quantitative information on skill proficiency by:
The (literacy) proficiency scores of workers who report themselves as well-matched – i.e. those who neither
feel they have the skills to perform a more demanding job nor feel the need for further training in order to be
able to perform their current job satisfactorily – are used to create a quantitative scale of the skills required to
perform the job for each occupation (based on 1-digit ISCO codes).
Using this scale of proficiency scores of well-matched workers, minimum and maximum threshold values,
based on the 10th
and 90th
percentile, are identified, which effectively provide the bounds that define what it
is to be a well-matched worker.
Respondents whose scores are lower (higher) than this minimum (maximum) threshold in their occupation
and country, are classified as under- (over-) skilled. Skill mismatch refers to the sum of the share of over and
under-skilled workers.
THEMATIC CHAPTER 2: UNLEASHING PRIVATE SECTOR PRODUCTIVITY
83
REFERENCES
Adalet McGowan, M. and D. Andrews (2015a), "Labour Market Mismatch and Labour Productivity:
Evidence from PIAAC Data”, OECD Economics Department Working Papers, No. 1209.
Adalet McGowan, M and D. Andrews (2015b), “Skill mismatch and public policy in OECD countries”,
OECD Economics Department Working Papers, No. 1210.
Braconier, H., G. Nicoletti and B. Westmore (2014), “Policy Challenges for the Next 50 Years”, OECD
Economics Department Policy Papers, No. 9.
OECD/CAF/ECLAC (2016), Latin American Economic Outlook 2017: Youth, Skills and Entrepreneurship,
OECD Publishing, Paris. DOI: http://dx.doi.org/10.1787/leo-2017-en.
OECD/IDB/CIAT (2016), Taxing Wages in Latin America and the Caribbean 2016, OECD Publishing,
Paris. DOI: http://dx.doi.org/10.1787/9789264262607-en.
Olaberría, E. (2016), "Chile: Better Skills for Inclusive Growth", OECD Economics Department Working
Papers, No. 1290.

84

85
THEMATIC CHAPTER 3
FACILITATING THE DIFFUSION OF
PRODUCTIVITY IMPROVEMENTS

86
THEMATIC CHAPTER 3: FACILITATING THE DIFFUSION OF PRODUCTIVITY IMPROVEMENT
87
GVCs, Knowledge Spillovers and Productivity
Global production is increasingly fragmented into various activities spread across country borders.
The access to global markets, inputs and knowledge through GVCs presents new opportunities to benefit
from knowledge spillovers and productivity growth. However, many Latin American economies are not
well integrated within global value chains and regional value chains are also not highly developed,
suggesting they may be missing out on many of these opportunities. This suggests a bundle of policy
measures is required to address the barriers and leverage the benefits of integration; including
harmonisation of trade policy and product standards, addressing barriers to competition and
entrepreneurship and promoting investment in human capital.
GVCs, Knowledge Spillovers and Productivity in Latin America
GVCs have transformed the world economy, and are both a driver and reflection of structural change,
with various parts of the production process, from design to distribution, increasingly fragmented across
country borders. Accordingly, several new avenues are available for knowledge spillovers and productivity
growth. Firms can join the global production network by specialising in specific activities within the value
chain, focusing on those core tasks they are most efficient at (OECD, 2013). Access to global markets
incentivises the realisation of economies of scale through productive investments, and allows importing
new varieties of cheaper, higher quality, or higher technology inputs (e.g. Amiti and Konings, 2007;
Goldberg et al., 2010; Topalova and Khandelwal, 2011). The presence of multinationals also provides
firms an opportunity to learn from the frontier, and may even directly share knowledge, technology and
new practices with their suppliers (Saia et al., 2015).
However, many Latin American economies are not well integrated within global value chains. A
prerequisite to reaping the knowledge spillovers and productivity potential of GVCs is participation in
them. Economies can participate in GVCs by using imported inputs in their exports (so-called backward
linkages) or by supplying intermediates to third country exports (forward linkages). GVC participation
varies substantially across different Latin American countries (see Figure 26). Chile has the highest level
of total GVC participation of the Latin American economies in the OECD TiVA database, accounting for
52% of gross exports (which is mainly driven by forward participation because of its copper exports, see
below). However, many other Latin American economies are not well integrated within GVCs compared
to other developing Asian and Eastern European economies. For example, total GVC participation
represents only 31% of gross exports in Argentina and 35% in Brazil.
The nature of GVC integration differs substantially between different Latin American economies
depending upon whether viewed through the lens of forward or backward linkages. On the one hand,
limited forward linkages and strong backward linkages suggest specialisation in downstream assembly
sectors that use foreign inputs intensively, such as Mexico for auto, electrical and optical equipment and
Costa Rica for computer, electronics and optical equipment (see Figure 26 and Cadestin et al., 2016). On
the other hand, limited backward linkages and strong forward linkages suggest a specialisation in upstream
natural resource activities, such as copper and copper-based materials for Chile (OECD, 2015). This trend
is mirrored in FDI flows for the region as a whole, which although relatively high, have been concentrated
disproportionately in upstream natural resource sectors (OECD, 2016).
THEMATIC CHAPTER 3: FACILITATING THE DIFFUSION OF PRODUCTIVITY IMPROVEMENTS
88
Regional value chains within Latin America are also not particularly developed. Firms in South-East
Asia and Europe, for example, integrate into well-established regional value chains. In both these regions
nearly half of the foreign value added used in exports, comes from foreign suppliers in the same region
(Cadestin et al., 2016). Similarly, in terms of forward participation, more than half of the intermediates
supplied to third country exports are exported from within the same region. Comparable figures for Latin
America are problematic due to the limited country coverage within TiVA. However, intra-regional
backward and forward linkage figures using available data for Latin America, suggest a far lower28
level of
regional value chain integration. Indeed, Latin American economies are more integrated with external
actors (e.g. China) than intra-regionally. While the region’s intra-regional share of backward linkages
almost doubled between 2000 and 2011, China’s share increased more than ten-fold.
Accordingly, Latin American firms seem to be missing out on opportunities for knowledge spillovers
and productivity gains (Lederman et al., 2014). As noted earlier, access to and diffusion of advanced
foreign technologies is one of the mechanisms through which GVCs can realise productivity gains. The
MNEs that drive GVCs are also responsible for the bulk of global innovation, for instance, as proxied by
patents (De Backer and De Stefano, 2016). The Latin American data for some natural resource sectors
indicates a high propensity for there to be inventors residing in multiple countries (see Figure 27).
However, this is not true of Latin American economies more generally. Overall, firms in Brazil and Chile
show a very low propensity to innovate through international collaborations, with 21% of Brazilian and 8%
of Chilean large firms and only 2% of Brazilian and 3% of Chilean small firms doing so (see Figure 28).
These figures are much lower than in OECD economies. For example, the share of SMEs collaborating on
innovation with higher education or research institutions in OECD economies is 14.5%, and for large firms
it is 37%.
This is consistent with the findings of recent OECD research, highlighting that GVC integration can
be the conduit for participation in global innovation networks (De Backer and De Stefano, 2016). Foreign
firms operating within the region do show consistently higher productivity than domestic firms, suggesting
there is untapped potential for further knowledge diffusion (e.g. OECD, 2015). Indeed, evidence suggests
that increasing the presence of MNEs has the potential to raise aggregate productivity in Latin America
much more so than increasing the presence in China or Europe and Central Asia (Alfaro and Chen, 2013).
The limited presence of MNEs may also explain the low level of R&D expenditure in the region, around
1.0% of GDP in comparison with OECD countries at 2.3%. On average Latin American businesses only
spent around 0.17% of GDP on R&D, significantly below the 1.47% spent on average in OECD
countries.29
Limited integration with GVCs therefore seems to be translating to into missed opportunities
for knowledge spillovers and productivity growth.
28 Cadestin et al. (2016) report using available Latin American TiVA data figures of around 10% for intra-regional backward and forward linkages
in 2011. However, the limited TiVA coverage of Latin American countries means that regional integration is likely understated, as
countries outside the sample are grouped within the Rest of the World. A rough calculation from this author suggests that a
theoretical upper bound, assuming the entire Rest of the World was actually Latin America, would lead to figures around 20%, still far below levels of South-East Asia and Europe regional integration.
29 Based on OECD data and Red de Indicadores de Ciencia y Tecnología -Iberoamericana e Interamericana (RICYT)
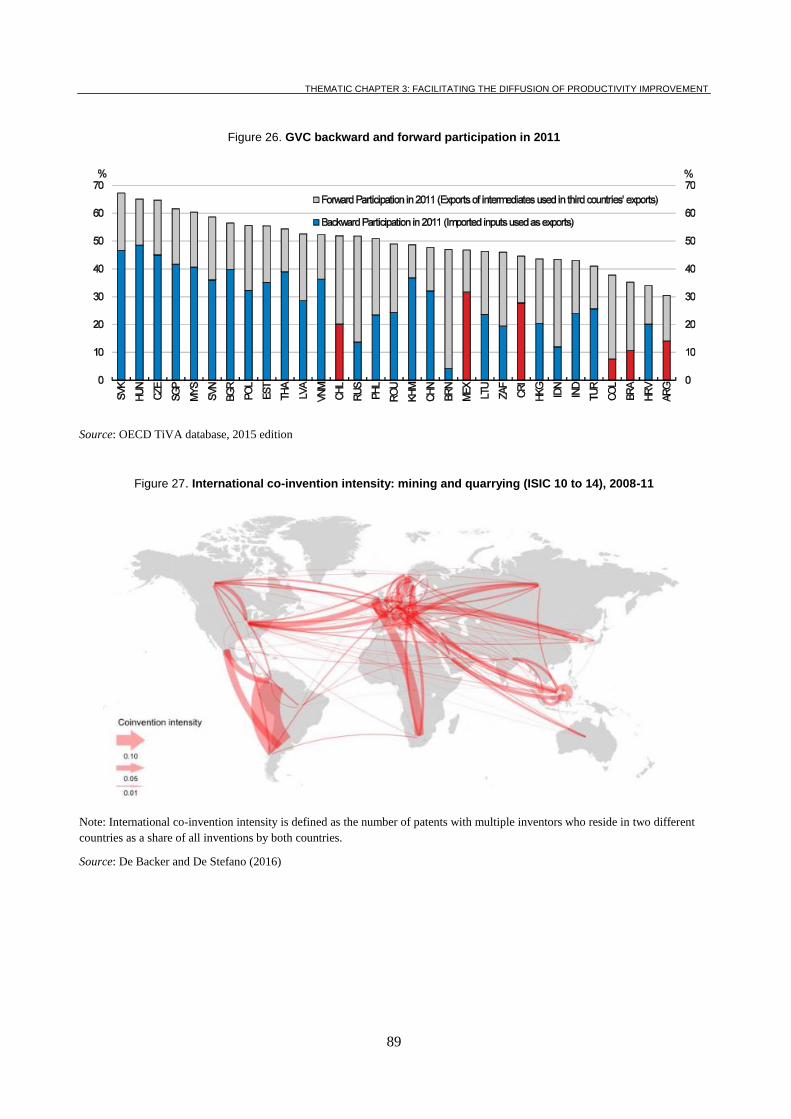
THEMATIC CHAPTER 3: FACILITATING THE DIFFUSION OF PRODUCTIVITY IMPROVEMENT
89
Figure 26. GVC backward and forward participation in 2011
Source: OECD TiVA database, 2015 edition
Figure 27. International co-invention intensity: mining and quarrying (ISIC 10 to 14), 2008-11
Note: International co-invention intensity is defined as the number of patents with multiple inventors who reside in two different
countries as a share of all inventions by both countries.
Source: De Backer and De Stefano (2016)
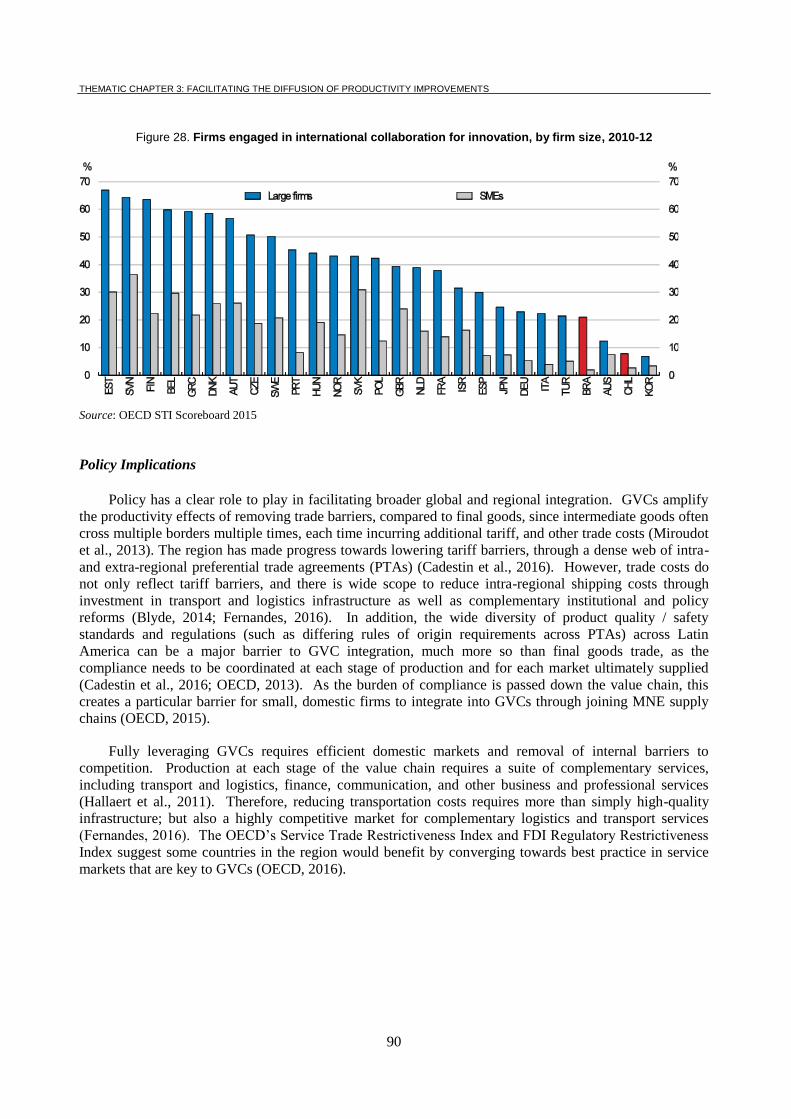
THEMATIC CHAPTER 3: FACILITATING THE DIFFUSION OF PRODUCTIVITY IMPROVEMENTS
90
Figure 28. Firms engaged in international collaboration for innovation, by firm size, 2010-12
Source: OECD STI Scoreboard 2015
Policy Implications
Policy has a clear role to play in facilitating broader global and regional integration. GVCs amplify
the productivity effects of removing trade barriers, compared to final goods, since intermediate goods often
cross multiple borders multiple times, each time incurring additional tariff, and other trade costs (Miroudot
et al., 2013). The region has made progress towards lowering tariff barriers, through a dense web of intra-
and extra-regional preferential trade agreements (PTAs) (Cadestin et al., 2016). However, trade costs do
not only reflect tariff barriers, and there is wide scope to reduce intra-regional shipping costs through
investment in transport and logistics infrastructure as well as complementary institutional and policy
reforms (Blyde, 2014; Fernandes, 2016). In addition, the wide diversity of product quality / safety
standards and regulations (such as differing rules of origin requirements across PTAs) across Latin
America can be a major barrier to GVC integration, much more so than final goods trade, as the
compliance needs to be coordinated at each stage of production and for each market ultimately supplied
(Cadestin et al., 2016; OECD, 2013). As the burden of compliance is passed down the value chain, this
creates a particular barrier for small, domestic firms to integrate into GVCs through joining MNE supply
chains (OECD, 2015).
Fully leveraging GVCs requires efficient domestic markets and removal of internal barriers to
competition. Production at each stage of the value chain requires a suite of complementary services,
including transport and logistics, finance, communication, and other business and professional services
(Hallaert et al., 2011). Therefore, reducing transportation costs requires more than simply high-quality
infrastructure; but also a highly competitive market for complementary logistics and transport services
(Fernandes, 2016). The OECD’s Service Trade Restrictiveness Index and FDI Regulatory Restrictiveness
Index suggest some countries in the region would benefit by converging towards best practice in service
markets that are key to GVCs (OECD, 2016).
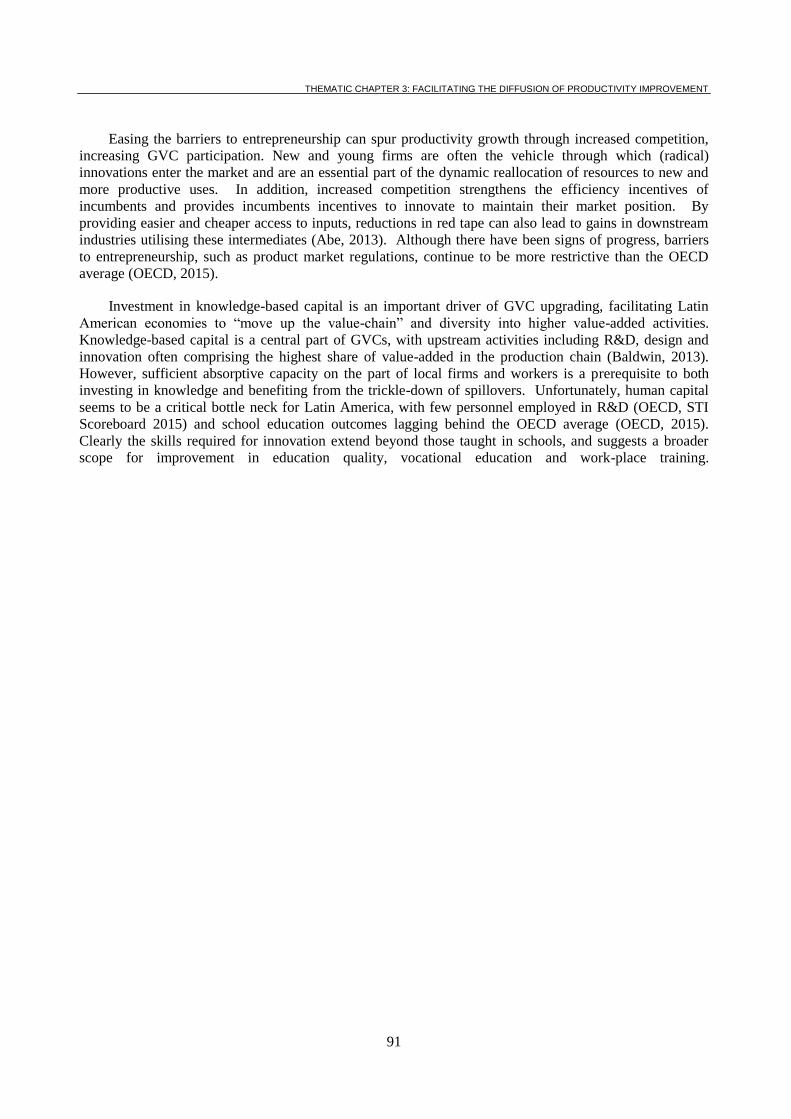
THEMATIC CHAPTER 3: FACILITATING THE DIFFUSION OF PRODUCTIVITY IMPROVEMENT
91
Easing the barriers to entrepreneurship can spur productivity growth through increased competition,
increasing GVC participation. New and young firms are often the vehicle through which (radical)
innovations enter the market and are an essential part of the dynamic reallocation of resources to new and
more productive uses. In addition, increased competition strengthens the efficiency incentives of
incumbents and provides incumbents incentives to innovate to maintain their market position. By
providing easier and cheaper access to inputs, reductions in red tape can also lead to gains in downstream
industries utilising these intermediates (Abe, 2013). Although there have been signs of progress, barriers
to entrepreneurship, such as product market regulations, continue to be more restrictive than the OECD
average (OECD, 2015).
Investment in knowledge-based capital is an important driver of GVC upgrading, facilitating Latin
American economies to “move up the value-chain” and diversity into higher value-added activities.
Knowledge-based capital is a central part of GVCs, with upstream activities including R&D, design and
innovation often comprising the highest share of value-added in the production chain (Baldwin, 2013).
However, sufficient absorptive capacity on the part of local firms and workers is a prerequisite to both
investing in knowledge and benefiting from the trickle-down of spillovers. Unfortunately, human capital
seems to be a critical bottle neck for Latin America, with few personnel employed in R&D (OECD, STI
Scoreboard 2015) and school education outcomes lagging behind the OECD average (OECD, 2015).
Clearly the skills required for innovation extend beyond those taught in schools, and suggests a broader
scope for improvement in education quality, vocational education and work-place training.
THEMATIC CHAPTER 3: FACILITATING THE DIFFUSION OF PRODUCTIVITY IMPROVEMENTS
92
REFERENCES
Alfaro, L., and M. X. Chen (2013), “Market Reallocation and Knowledge Spillovers: The Gains from
Multinational Production” NBER Working Paper 18207.
Amiti, M. and J. Konings (2007), “Trade Liberalization, Intermediate Inputs, and Productivity: Evidence from
Indonesia”, American Economic Review, Vol. 97, No. 5, pp. 1611–38.
Baldwin, R. (2013), “Global supply chains: why they emerged, why they matter, and where they are going”, in
D.K. Elms and P. Low (eds.), Global value chains in a changing world, WTO Publications.
Blyde, J. S. (ed.) (2014), “Synchronised Factories, Latin America and the Caribbean in the Era of Global Value
Chains”, Springer.
Cadestin, C., J. Gourdon and P. Kowalski (2016), “Participation in Global Value Chains in Latin America:
Implications for Trade and Trade-Related Policy”, OECD Trade Policy Papers, No. 192, OECD
Publishing, Paris. DOI: http://dx.doi.org/10.1787/5jlpq80ts8f2-en
De Backer, K. and T. De Stefano (2016), “The Links between Global Value Chains and Global Innovation
Networks: An Exploration”, DSTI/IND(2016)8, OECD Publishing.
Fernandes, J. A. C. (2016), “Why Latin America needs a new approach to trade”, available at:
https://www.weforum.org/agenda/2016/05/why-latin-america-needs-a-new-approach-to-trade/
Goldberg, P.K., A.K. Khandelwal, N. Pavcnik and P. Topalova (2010), “Imported Intermediate Inputs and
Domestic Product Growth: Evidence from India” Quarterly Journal of Economics, Vol. 125, No. 4, pp.
1727–67.
Hallaert, J., R. Cavazos Cepeda and G. Kang (2011), “Estimating the Constraints to Trade of Developing
Countries”, OECD Trade Policy Papers, No. 116, OECD Publishing. DOI:
http://dx.doi.org/10.1787/5kg9mq8mx9tc-en
Lederman, D., J. Messina, S. Pienknagura and J. Rigolini (2014), “Latin American Entrepreneurs: Many Firms
but Little Innovation”, World Bank Publishing.
Miroudot, S., D. Rouzet and F. Spinelli (2013), “Trade Policy Implications of Global Value Chains: Case
Studies”, OECD Trade Policy Papers, No. 161, OECD Publishing. DOI:
http://dx.doi.org/10.1787/5k3tpt2t0zs1-en
OECD (2013), “Interconnected Economies: Benefiting from Global Value Chains”, OECD Publishing, Paris.
DOI: http://dx.doi.org/10.1787/9789264189560-en
OECD (2015), “Diagnostic of Chile’s Engagement in Global Value Chains”, OECD Publishing, Paris.
OECD (2016), “Promoting Productivity for Inclusive Growth in Latin America”, OECD Publishing, Paris. DOI:
http://dx.doi.org/10.1787/9789264258389-en
Saia, A., D. Andrews and S. Albrizio (2015), “Productivity Spillovers from the Global Frontier and Public
Policy: Industry-Level Evidence”, OECD Economics Department Working Papers, No. 1238, OECD
Publishing. DOI: http://dx.doi.org/10.1787/5js03hkvxhmr-en
Topalova, P. and A.K. Khandelwal (2011), “Trade Liberalization and Firm Productivity: The Case of India”
Review of Economics and Statistics, Vol. 93, No. 3, pp. 995–1009.
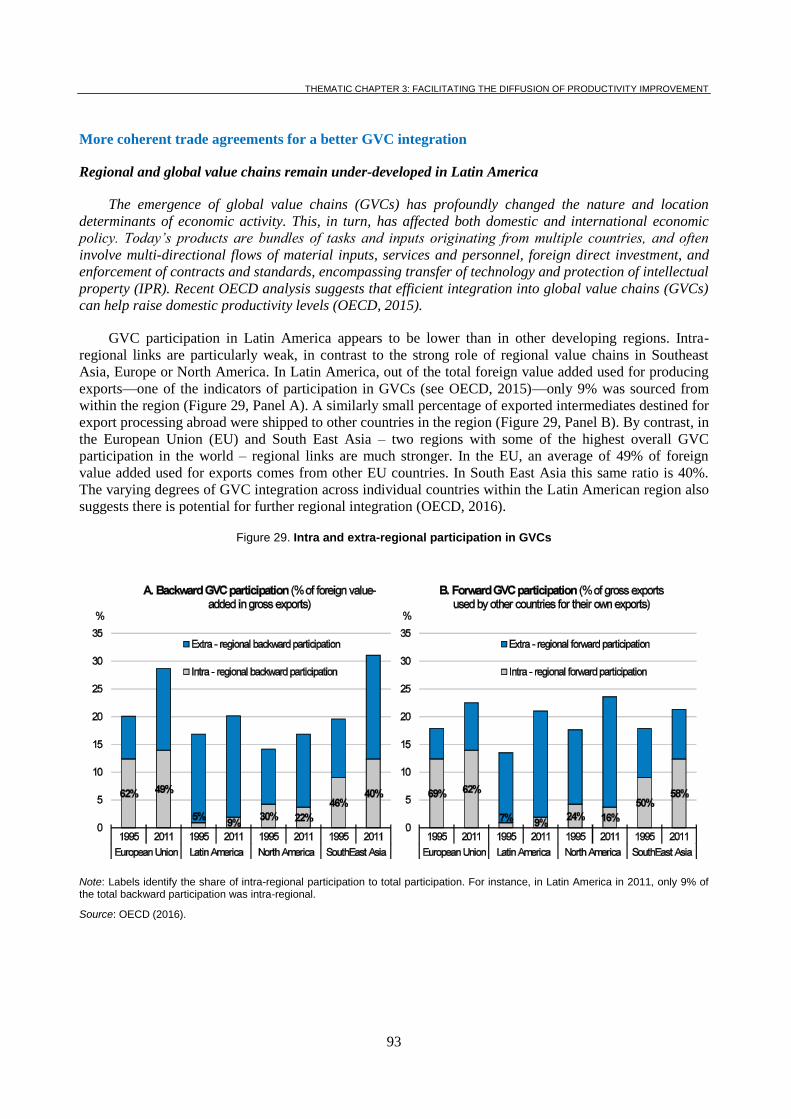
THEMATIC CHAPTER 3: FACILITATING THE DIFFUSION OF PRODUCTIVITY IMPROVEMENT
93
More coherent trade agreements for a better GVC integration
Regional and global value chains remain under-developed in Latin America
The emergence of global value chains (GVCs) has profoundly changed the nature and location
determinants of economic activity. This, in turn, has affected both domestic and international economic
policy. Today’s products are bundles of tasks and inputs originating from multiple countries, and often
involve multi-directional flows of material inputs, services and personnel, foreign direct investment, and
enforcement of contracts and standards, encompassing transfer of technology and protection of intellectual
property (IPR). Recent OECD analysis suggests that efficient integration into global value chains (GVCs)
can help raise domestic productivity levels (OECD, 2015).
GVC participation in Latin America appears to be lower than in other developing regions. Intra-
regional links are particularly weak, in contrast to the strong role of regional value chains in Southeast
Asia, Europe or North America. In Latin America, out of the total foreign value added used for producing
exports—one of the indicators of participation in GVCs (see OECD, 2015)—only 9% was sourced from
within the region (Figure 29, Panel A). A similarly small percentage of exported intermediates destined for
export processing abroad were shipped to other countries in the region (Figure 29, Panel B). By contrast, in
the European Union (EU) and South East Asia – two regions with some of the highest overall GVC
participation in the world – regional links are much stronger. In the EU, an average of 49% of foreign
value added used for exports comes from other EU countries. In South East Asia this same ratio is 40%.
The varying degrees of GVC integration across individual countries within the Latin American region also
suggests there is potential for further regional integration (OECD, 2016).
Figure 29. Intra and extra-regional participation in GVCs
Note: Labels identify the share of intra-regional participation to total participation. For instance, in Latin America in 2011, only 9% of the total backward participation was intra-regional.
Source: OECD (2016).
THEMATIC CHAPTER 3: FACILITATING THE DIFFUSION OF PRODUCTIVITY IMPROVEMENTS
94
Trade agreements can play a role in promoting greater integration into GVCs
Countries are better able to participate in GVCs if fragmentation-related costs of production (costs
arising from moving inputs in and out of the country) are reduced. Some of these costs accumulate long
before country borders are reached (e.g. costs related to quality of national infrastructure and logistics
services, as well as regulatory burdens). Other fragmentation-related costs of production accrue at the
border (e.g. tariffs, costs related to customs inefficiencies). In both these areas, there is scope for countries
in the region to improve and catch-up with the best performing countries (OECD, 2016).
Opportunities for Latin American firms to trade and engage with international supply chains crucially
depend on the network of preferential trade agreements (PTAs) involving countries in the region as well as
trading partners in Europe, North America and Asia.
Latin American countries are among the most active signatories of PTAs. Currently, 68 PTAs
involving at least one Latin American country have been notified to the World Trade Organisation. These
comprise 9 agreements of different Latin American countries with the United States or Canada, 7
agreements with either the EU or EFTA, 15 with partners in East and South East Asia and 32 intra-regional
agreements. Each of the countries in the region has at least 10 PTAs and some have as many as 26. These
agreements vary with respect to scope and depth. They include more traditional treaties, such as the
Andean Community or Mercosur (which cover mainly conventional areas such as market access) and other
“second-generation” agreements, such as the Central American Free Trade Agreement (which includes
more GVC-compatible provisions related to, for example, competition policy or services). The most recent
trade integration initiatives include the Pacific Alliance Agreement between Mexico, Colombia, Peru and
Chile (in force since July 2015) and the finalisation of negotiations on the Trans-Pacific Partnership (TPP)
Agreement, by Chile, Mexico and Peru and 9 other countries in Asia Pacific, in October 2015. The dense
network of PTAs in Latin America should, in principle, mean that much of trade faces low border barriers.
However, the benefits of these PTAs appear to be reduced by overlap, duplication and conflicts among the
different rules of origin and standards governing trade under the respective agreements. This is prompting
renewed interest in the idea of linking or harmonising the various Latin American PTAs.
Consolidation of existing agreements or negotiation of new, more flexible and ambitious ones could
hold promise for a more economically integrated continent, with increasing integration of various domestic
and regional supply chains, and the establishment of regional investment poles. In principle, as countries
continue to pursue preferential integration and the geographical fragmentation of production processes
increases, there should be greater incentives to consolidate rules of origin and product standards. However,
this anticipated consolidation and standardisation has not yet happened. For example, more than half of the
PTAs involving Mexico, Chile and Peru do not apply the same rules to the majority of traded goods
covered. Also, despite the increasing tendency to include clauses dealing with regulatory standards in the
new generation of PTAs, less than 20 of the 62 FTAs involving Latin American countries feature such
provisions. That said, recently, attempts to link or harmonise the various Latin American PTAs are
gathering strength, as demonstrated by initiatives of the Pacific Alliance countries.
To support and inform this approach, the OECD recently analysed the impact of rules of origin (RoO)
and non-tariff measures (NTMs) on GVC integration in the region (OECD, 2016). The OECD took stock
of the progress and impact of the relevant harmonisation initiatives, and discussed some options for future
policy initiatives.
THEMATIC CHAPTER 3: FACILITATING THE DIFFUSION OF PRODUCTIVITY IMPROVEMENT
95
But differing approaches to rules of origin and non-tariff measures undermine potential gains
RoO establish the conditions a product must satisfy to be deemed eligible for preferential access to
member countries’ markets and thus are integral elements of PTAs. However, in the world of GVCs, where
products from countries outside of the PTA can serve as inputs into products of participating countries,
RoO can have negative consequences for both extra- and intra-PTA value chain formation. The OECD
estimates that RoO in PTAs of Latin American countries undo more than 15 % of the positive trade effect
of these agreements, and this effect is particularly strong for trade in intermediate products (30%).
NTMs should also be considered in efforts to promote greater participation in GVCs. NTMs include
standards, technical regulations and conformity assessment procedures. They traditionally aim to protect
consumers. They are not targeted at discriminating against imports, and they apply the same standards and
requirements to both domestically produced and imported products. Nevertheless, these measures can have
unintended effects on trade, creating restrictions beyond what is necessary to achieve their policy
objective, and in effect acting as hidden protection.
In addition, while countries may legitimately apply different standards and approaches, use of
diverging national standards may impose particular costs on GVCs, which involve operations across
multiple countries. The importance of timeliness and quality in global trade, and the sensitivity of value
chain operations to trade costs, mean NTMs, and the variation between them, can prove particularly
problematic for GVC trade. We estimate that, on average, NTMs used by Latin American countries impose
additional costs equivalent to a tariff of 20% for primary intermediate products and 12% for processed
intermediates. Their incidence is found to be negatively correlated with GVC participation. Latin American
countries where intermediate trade is highly restricted by NTMs and where these issues are not addressed
under their PTA are generally less integrated into GVCs.
Overall the OECD study shows that convergence on rules of origin and regulatory standards could
significantly reduce the burden of complying with competing or overlapping rules and regulations -- and
this in turn, reduces the costs and increases the attractiveness of integrating countries in the region into
regional or global value chains. While convergence is not necessarily straightforward and can involve
some upfront costs (e.g. in terms of negotiation), these costs need to be set against the costs of inaction in
terms of the ability of Latin American countries to increase their integration into regional and global value
chains, with gains to trade, productivity and growth.
Options exist to address these costs
There are various options to address costs arising from conflicting or overlapping RoOs.
In many cases the average protection that Most-Favoured Nation (MFN) tariffs is estimated to afford
to intra-PTA input providers may be less than the cost of administering preferential market access through
RoO. On average, RoO are estimated to have tariff equivalents of around 9% for intra-PTA imports of
intermediate products. Average MFN tariffs on intermediate products are below the 9% threshold in more
than 60% of Latin American countries. MFN liberalisation of tariffs on intermediate products could thus be
a cost-efficient way of alleviating RoO problems and stimulating intra- and extra-PTA value chains.
Other viable – although arguably more costly – initiatives could include renegotiation or
harmonisation of existing product-specific RoO, or improvements to overall RoO architecture such as
amendments to certification, de minimis or cumulation rules. Indeed, Latin American countries which have
adopted some of the more flexible approaches to RoO (such as Chile, Costa Rica and Mexico) also tend to
be better integrated into GVCs. There is still, however, scope to do more. Negotiation of more inclusive
cumulation schemes is particularly promising and is already being pursued in many newer agreements in
THEMATIC CHAPTER 3: FACILITATING THE DIFFUSION OF PRODUCTIVITY IMPROVEMENTS
96
the region, including the Pacific Alliance and the Trans-Pacific Partnership. Such schemes include
those that allow full cumulation across PTA partners, cross-cumulation of RoO between overlapping PTAs
or flexible sourcing from extra-PTA partners.
The Pacific Alliance established provisions for cumulation among its four member countries,
essentially merging the six existing bilateral relationships into a single framework (Estevadeordal et al.,
2013). In the recently finalised Trans Pacific Partnership (TPP) Agreement, involving three Latin
American countries (Chile, Mexico and Peru), the agreed common set of RoO and full cumulation will
mean that all regional content at every step of the production process can be cumulated in the calculation
of local content.
For NTMs, there are also ways that countries can ensure quality standards and appropriate consumer
protection, while reducing the costs that differing regulatory approaches impose. For example, there is
benefit in considering mutual recognition, or harmonisation of technical regulations or conformity-
assessment procedures. An empirical assessment of the effect of these measures on NTM-compliance costs
shows that, on average, such provisions can reduce the cost of NTMs by approximately one fifth. Of these
methods, mutual recognition – especially for conformity assessment – is responsible for much of the
reduction in NTM costs and is the most effective facilitation method. While not without administrative
costs and challenges, mutual recognition of conformity assessment appears more feasible than
harmonisation for promoting the convergence of standards over the medium term, because it allows
countries to retain their own standards and process of certification.
REFERENCES
OECD (2016): Cadestin, C., Gourdon, J. and P. Kowalski, “Participation in Global value Chains in Latin
America—Implications for Trade and Trade-related Policy”, OECD Trade Policy Paper No. 192,
OECD Publishing.
OECD (2015): Kowalski, P., Lopez Gonzalez, J., Ragoussis, A. and C. Ugarte, “Developing countries
participation in global value chains and its implications for trade and trade related policies”,
OECD Trade Policy Paper No. 179, OECD Publishing. Available at:
http://dx.doi.org/10.1787/5js33lfw0xxn-en
On-line resources: http://www.oecd.org/tad/global-value-chains-trade-policy.htm

97
COUNTRY NOTES

98
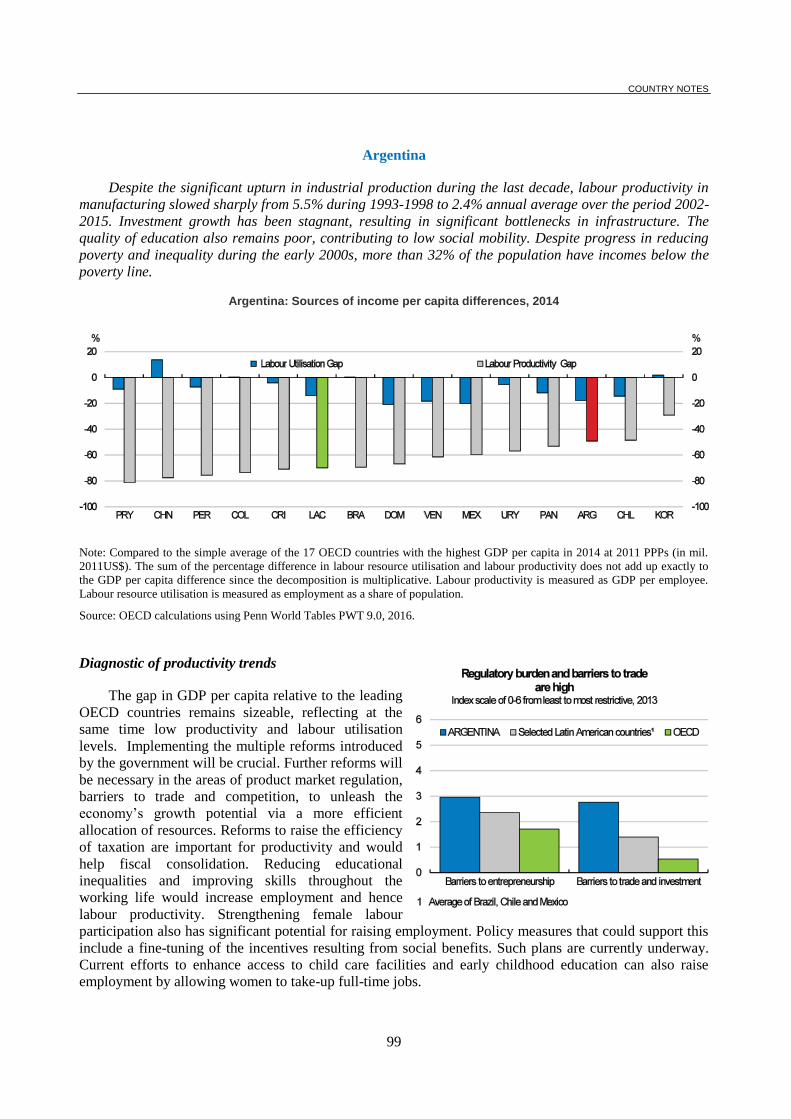
COUNTRY NOTES
99
Argentina
Despite the significant upturn in industrial production during the last decade, labour productivity in
manufacturing slowed sharply from 5.5% during 1993-1998 to 2.4% annual average over the period 2002-
2015. Investment growth has been stagnant, resulting in significant bottlenecks in infrastructure. The
quality of education also remains poor, contributing to low social mobility. Despite progress in reducing
poverty and inequality during the early 2000s, more than 32% of the population have incomes below the
poverty line.
Argentina: Sources of income per capita differences, 2014
Note: Compared to the simple average of the 17 OECD countries with the highest GDP per capita in 2014 at 2011 PPPs (in mil.
2011US$). The sum of the percentage difference in labour resource utilisation and labour productivity does not add up exactly to
the GDP per capita difference since the decomposition is multiplicative. Labour productivity is measured as GDP per employee.
Labour resource utilisation is measured as employment as a share of population.
Source: OECD calculations using Penn World Tables PWT 9.0, 2016.
Diagnostic of productivity trends
The gap in GDP per capita relative to the leading
OECD countries remains sizeable, reflecting at the
same time low productivity and labour utilisation
levels. Implementing the multiple reforms introduced
by the government will be crucial. Further reforms will
be necessary in the areas of product market regulation,
barriers to trade and competition, to unleash the
economy’s growth potential via a more efficient
allocation of resources. Reforms to raise the efficiency
of taxation are important for productivity and would
help fiscal consolidation. Reducing educational
inequalities and improving skills throughout the
working life would increase employment and hence
labour productivity. Strengthening female labour
participation also has significant potential for raising employment. Policy measures that could support this
include a fine-tuning of the incentives resulting from social benefits. Such plans are currently underway.
Current efforts to enhance access to child care facilities and early childhood education can also raise
employment by allowing women to take-up full-time jobs.
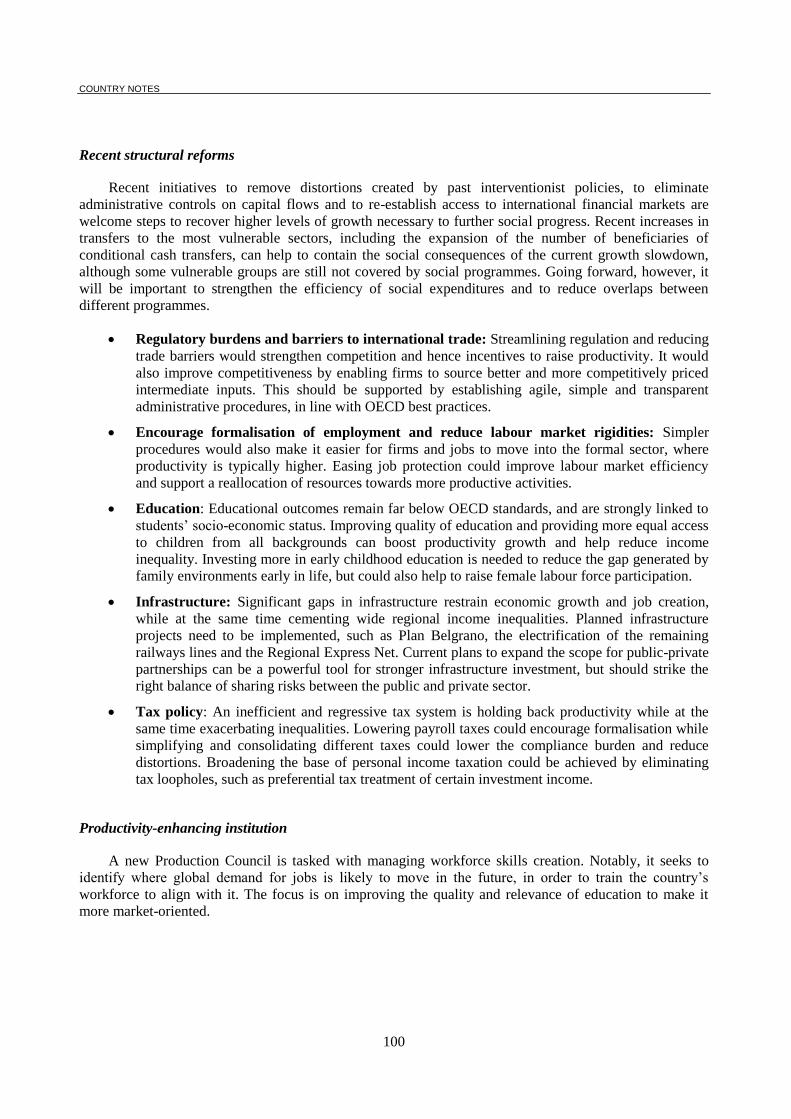
COUNTRY NOTES
100
Recent structural reforms
Recent initiatives to remove distortions created by past interventionist policies, to eliminate
administrative controls on capital flows and to re-establish access to international financial markets are
welcome steps to recover higher levels of growth necessary to further social progress. Recent increases in
transfers to the most vulnerable sectors, including the expansion of the number of beneficiaries of
conditional cash transfers, can help to contain the social consequences of the current growth slowdown,
although some vulnerable groups are still not covered by social programmes. Going forward, however, it
will be important to strengthen the efficiency of social expenditures and to reduce overlaps between
different programmes.
Regulatory burdens and barriers to international trade: Streamlining regulation and reducing
trade barriers would strengthen competition and hence incentives to raise productivity. It would
also improve competitiveness by enabling firms to source better and more competitively priced
intermediate inputs. This should be supported by establishing agile, simple and transparent
administrative procedures, in line with OECD best practices.
Encourage formalisation of employment and reduce labour market rigidities: Simpler
procedures would also make it easier for firms and jobs to move into the formal sector, where
productivity is typically higher. Easing job protection could improve labour market efficiency
and support a reallocation of resources towards more productive activities.
Education: Educational outcomes remain far below OECD standards, and are strongly linked to
students’ socio-economic status. Improving quality of education and providing more equal access
to children from all backgrounds can boost productivity growth and help reduce income
inequality. Investing more in early childhood education is needed to reduce the gap generated by
family environments early in life, but could also help to raise female labour force participation.
Infrastructure: Significant gaps in infrastructure restrain economic growth and job creation,
while at the same time cementing wide regional income inequalities. Planned infrastructure
projects need to be implemented, such as Plan Belgrano, the electrification of the remaining
railways lines and the Regional Express Net. Current plans to expand the scope for public-private
partnerships can be a powerful tool for stronger infrastructure investment, but should strike the
right balance of sharing risks between the public and private sector.
Tax policy: An inefficient and regressive tax system is holding back productivity while at the
same time exacerbating inequalities. Lowering payroll taxes could encourage formalisation while
simplifying and consolidating different taxes could lower the compliance burden and reduce
distortions. Broadening the base of personal income taxation could be achieved by eliminating
tax loopholes, such as preferential tax treatment of certain investment income.
Productivity-enhancing institution
A new Production Council is tasked with managing workforce skills creation. Notably, it seeks to
identify where global demand for jobs is likely to move in the future, in order to train the country’s
workforce to align with it. The focus is on improving the quality and relevance of education to make it
more market-oriented.
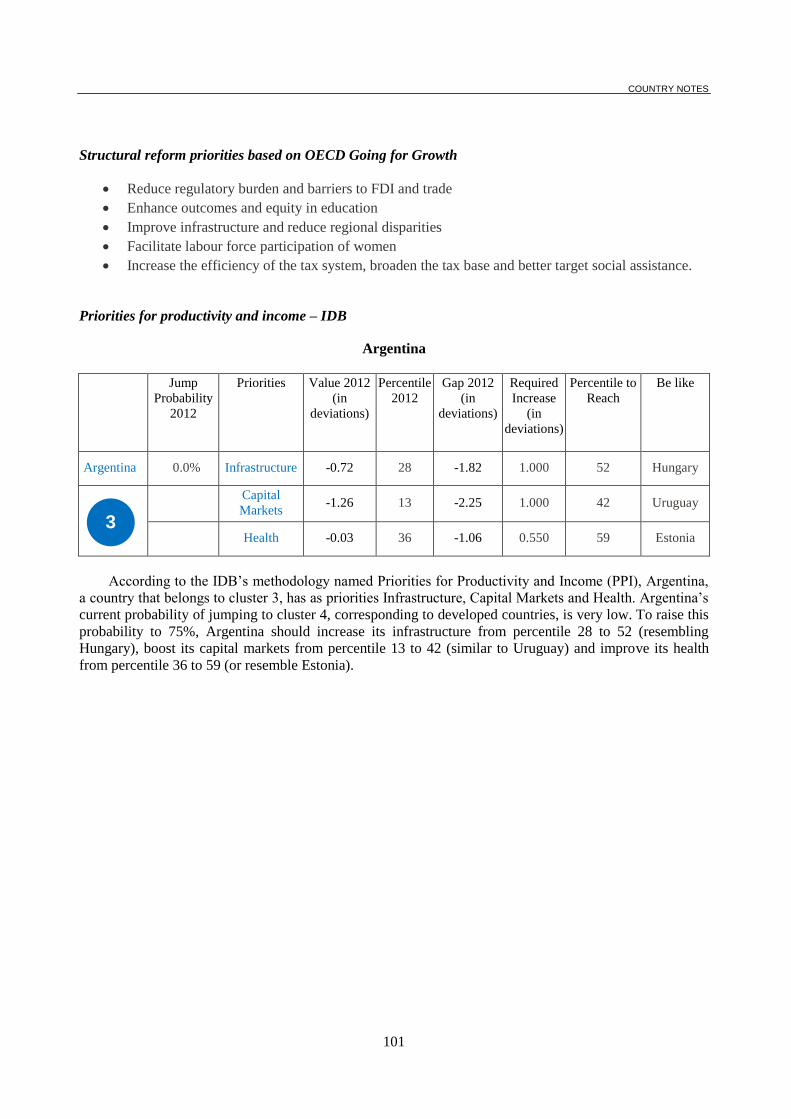
COUNTRY NOTES
101
Structural reform priorities based on OECD Going for Growth
Reduce regulatory burden and barriers to FDI and trade
Enhance outcomes and equity in education
Improve infrastructure and reduce regional disparities
Facilitate labour force participation of women
Increase the efficiency of the tax system, broaden the tax base and better target social assistance.
Priorities for productivity and income – IDB
Argentina
Jump
Probability
2012
Priorities Value 2012
(in
deviations)
Percentile
2012
Gap 2012
(in
deviations)
Required
Increase
(in
deviations)
Percentile to
Reach
Be like
Argentina 0.0% Infrastructure -0.72 28 -1.82 1.000 52 Hungary
Capital
Markets -1.26 13 -2.25 1.000 42 Uruguay
Health -0.03 36 -1.06 0.550 59 Estonia
According to the IDB’s methodology named Priorities for Productivity and Income (PPI), Argentina,
a country that belongs to cluster 3, has as priorities Infrastructure, Capital Markets and Health. Argentina’s
current probability of jumping to cluster 4, corresponding to developed countries, is very low. To raise this
probability to 75%, Argentina should increase its infrastructure from percentile 28 to 52 (resembling
Hungary), boost its capital markets from percentile 13 to 42 (similar to Uruguay) and improve its health
from percentile 36 to 59 (or resemble Estonia).
3
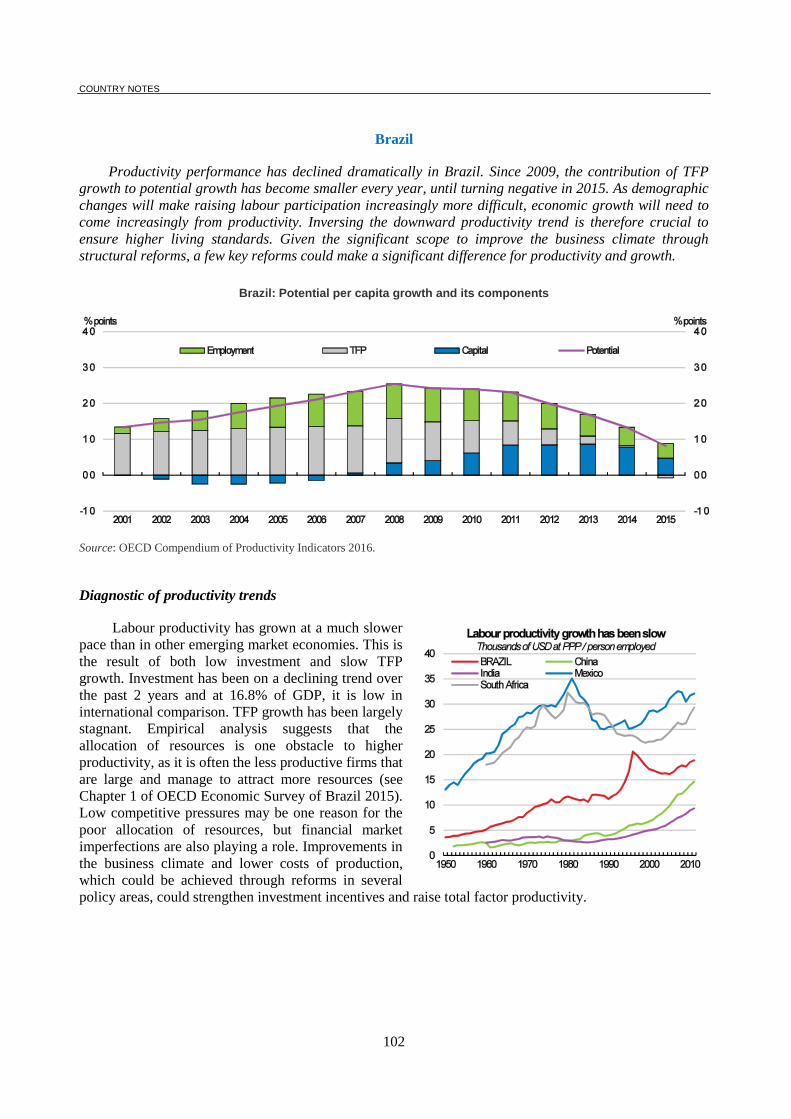
COUNTRY NOTES
102
Brazil
Productivity performance has declined dramatically in Brazil. Since 2009, the contribution of TFP
growth to potential growth has become smaller every year, until turning negative in 2015. As demographic
changes will make raising labour participation increasingly more difficult, economic growth will need to
come increasingly from productivity. Inversing the downward productivity trend is therefore crucial to
ensure higher living standards. Given the significant scope to improve the business climate through
structural reforms, a few key reforms could make a significant difference for productivity and growth.
Brazil: Potential per capita growth and its components
Source: OECD Compendium of Productivity Indicators 2016.
Diagnostic of productivity trends
Labour productivity has grown at a much slower
pace than in other emerging market economies. This is
the result of both low investment and slow TFP
growth. Investment has been on a declining trend over
the past 2 years and at 16.8% of GDP, it is low in
international comparison. TFP growth has been largely
stagnant. Empirical analysis suggests that the
allocation of resources is one obstacle to higher
productivity, as it is often the less productive firms that
are large and manage to attract more resources (see
Chapter 1 of OECD Economic Survey of Brazil 2015).
Low competitive pressures may be one reason for the
poor allocation of resources, but financial market
imperfections are also playing a role. Improvements in
the business climate and lower costs of production,
which could be achieved through reforms in several
policy areas, could strengthen investment incentives and raise total factor productivity.
COUNTRY NOTES
103
Structural reforms are key to higher productivity growth
The structural reform momentum has picked up recently and a number of reform proposals are being
discussed, but much remains to be done. Given the significant scope to improve the business climate, a few
key reforms could make a significant difference for productivity and growth:
Competition and trade policy reform: Reducing barriers to market entry and opening up
international trade could unleash competitive pressures required to raise productivity and reduce
the costs of imported intermediate inputs. Reductions in tariffs and local content rules could
allow Brazil to build on recent progress in the area of trade facilitation.
Financial market reform: Better functioning financial markets, including a larger share of credit
allocated according to market criteria, could improve the allocation of resources. The
development of private long-term credit markets will be instrumental in this context.
Tax reform: Taxes are high and compliance costs generated by a fragmented system of indirect
taxes are large. Consolidating indirect taxes at the state and federal levels and working towards
one value added tax with a broad base, full refunds for input VAT paid and zero-rating for
exports could lead to a major reduction in compliance costs.
Infrastructure: Infrastructure bottlenecks drive up transport and logistics costs, in particular
with respect to industrial exports. New concessions in roads and airports will help to alleviate
these bottlenecks, but much more needs to be done. Improvements in the technical capacity and
planning for infrastructure concessions could enhance the benefits from private investment in
infrastructure.
Enhancing fiscal room for public investment: Public expenditures have been rising faster than
GDP and efforts to limit fiscal deficits have largely been to the detriment of public investment. A
credible strategy to rein in current expenditures would leave more room for urgently needed
public investment, which could boost productivity. Enhancing the effectiveness and efficiency of
public benefits will play a key role in this context.
Addressing skill scarcity: Difficulties in hiring high-skilled and technical workers hold back
productivity growth and will require further expansions of vocational training programmes.
Labour market reforms: Labour regulations date from the 1940s and contain many unnecessary
details that could be governed more efficiently by agreements between employers and
employees.
Productivity-enhancing institution
Brazil’s large public sector think-tank IPEA has ample experience in analysing productivity
developments and challenges in Brazil.
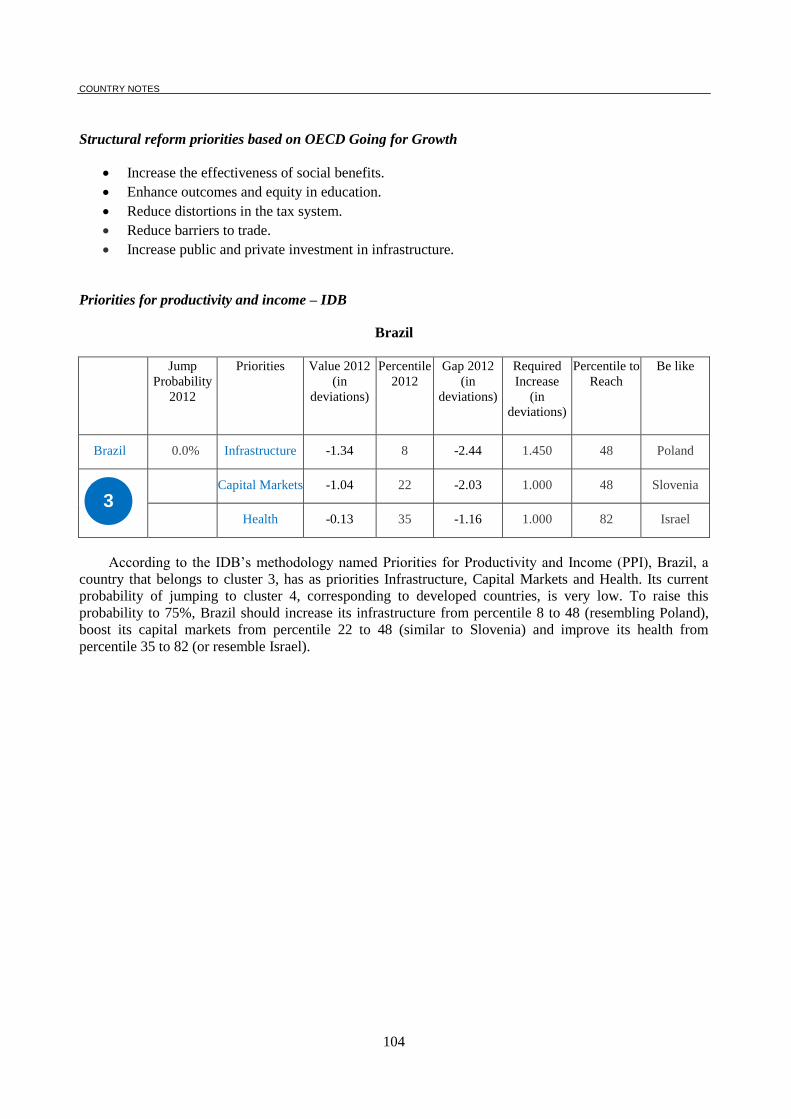
COUNTRY NOTES
104
Structural reform priorities based on OECD Going for Growth
Increase the effectiveness of social benefits.
Enhance outcomes and equity in education.
Reduce distortions in the tax system.
Reduce barriers to trade.
Increase public and private investment in infrastructure.
Priorities for productivity and income – IDB
Brazil
Jump
Probability
2012
Priorities Value 2012
(in
deviations)
Percentile
2012
Gap 2012
(in
deviations)
Required
Increase
(in
deviations)
Percentile to
Reach
Be like
Brazil 0.0% Infrastructure -1.34 8 -2.44 1.450 48 Poland
Capital Markets -1.04 22 -2.03 1.000 48 Slovenia
Health -0.13 35 -1.16 1.000 82 Israel
According to the IDB’s methodology named Priorities for Productivity and Income (PPI), Brazil, a
country that belongs to cluster 3, has as priorities Infrastructure, Capital Markets and Health. Its current
probability of jumping to cluster 4, corresponding to developed countries, is very low. To raise this
probability to 75%, Brazil should increase its infrastructure from percentile 8 to 48 (resembling Poland),
boost its capital markets from percentile 22 to 48 (similar to Slovenia) and improve its health from
percentile 35 to 82 (or resemble Israel).
3
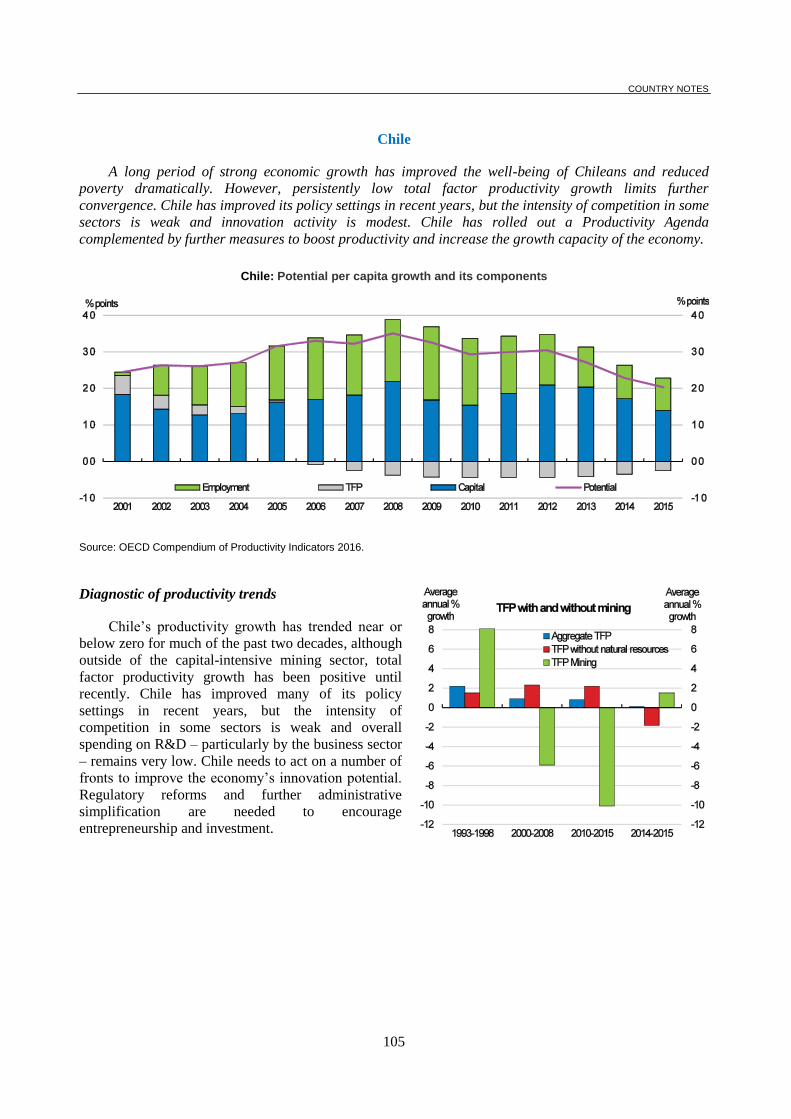
COUNTRY NOTES
105
Chile
A long period of strong economic growth has improved the well-being of Chileans and reduced
poverty dramatically. However, persistently low total factor productivity growth limits further
convergence. Chile has improved its policy settings in recent years, but the intensity of competition in some
sectors is weak and innovation activity is modest. Chile has rolled out a Productivity Agenda
complemented by further measures to boost productivity and increase the growth capacity of the economy.
Chile: Potential per capita growth and its components
Source: OECD Compendium of Productivity Indicators 2016.
Diagnostic of productivity trends
Chile’s productivity growth has trended near or
below zero for much of the past two decades, although
outside of the capital-intensive mining sector, total
factor productivity growth has been positive until
recently. Chile has improved many of its policy
settings in recent years, but the intensity of
competition in some sectors is weak and overall
spending on R&D – particularly by the business sector
– remains very low. Chile needs to act on a number of
fronts to improve the economy’s innovation potential.
Regulatory reforms and further administrative
simplification are needed to encourage
entrepreneurship and investment.
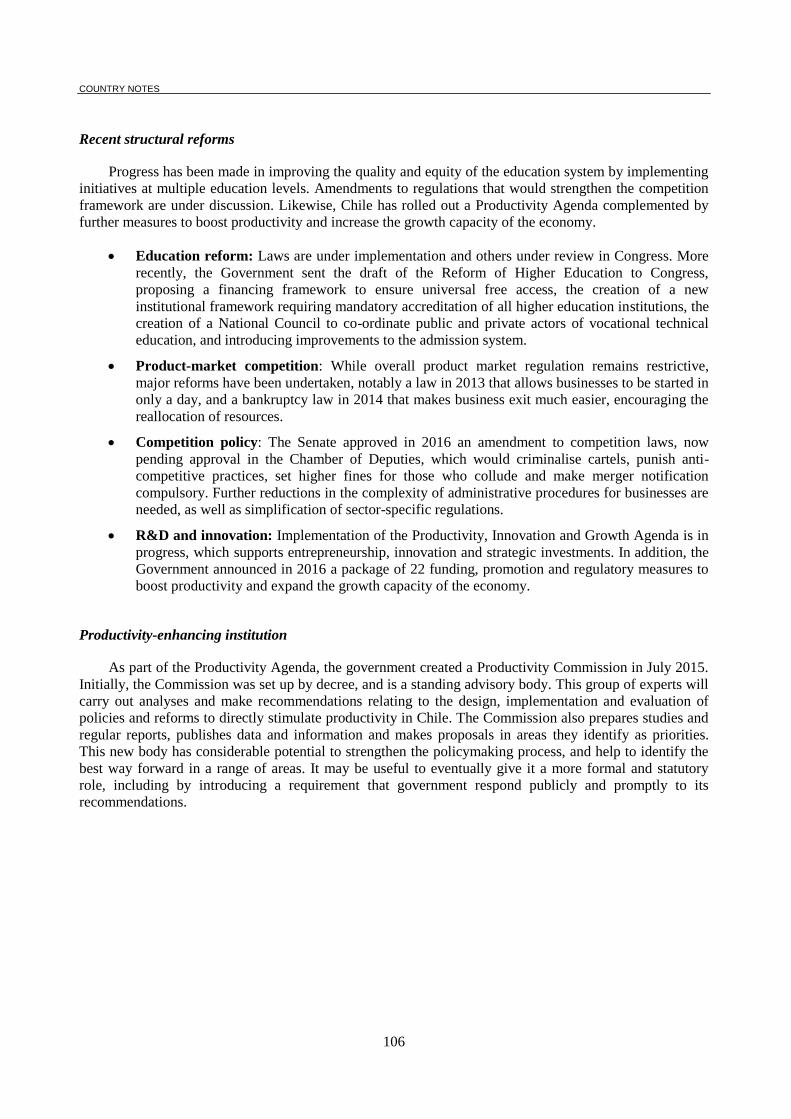
COUNTRY NOTES
106
Recent structural reforms
Progress has been made in improving the quality and equity of the education system by implementing
initiatives at multiple education levels. Amendments to regulations that would strengthen the competition
framework are under discussion. Likewise, Chile has rolled out a Productivity Agenda complemented by
further measures to boost productivity and increase the growth capacity of the economy.
Education reform: Laws are under implementation and others under review in Congress. More
recently, the Government sent the draft of the Reform of Higher Education to Congress,
proposing a financing framework to ensure universal free access, the creation of a new
institutional framework requiring mandatory accreditation of all higher education institutions, the
creation of a National Council to co-ordinate public and private actors of vocational technical
education, and introducing improvements to the admission system.
Product-market competition: While overall product market regulation remains restrictive,
major reforms have been undertaken, notably a law in 2013 that allows businesses to be started in
only a day, and a bankruptcy law in 2014 that makes business exit much easier, encouraging the
reallocation of resources.
Competition policy: The Senate approved in 2016 an amendment to competition laws, now
pending approval in the Chamber of Deputies, which would criminalise cartels, punish anti-
competitive practices, set higher fines for those who collude and make merger notification
compulsory. Further reductions in the complexity of administrative procedures for businesses are
needed, as well as simplification of sector-specific regulations.
R&D and innovation: Implementation of the Productivity, Innovation and Growth Agenda is in
progress, which supports entrepreneurship, innovation and strategic investments. In addition, the
Government announced in 2016 a package of 22 funding, promotion and regulatory measures to
boost productivity and expand the growth capacity of the economy.
Productivity-enhancing institution
As part of the Productivity Agenda, the government created a Productivity Commission in July 2015.
Initially, the Commission was set up by decree, and is a standing advisory body. This group of experts will
carry out analyses and make recommendations relating to the design, implementation and evaluation of
policies and reforms to directly stimulate productivity in Chile. The Commission also prepares studies and
regular reports, publishes data and information and makes proposals in areas they identify as priorities.
This new body has considerable potential to strengthen the policymaking process, and help to identify the
best way forward in a range of areas. It may be useful to eventually give it a more formal and statutory
role, including by introducing a requirement that government respond publicly and promptly to its
recommendations.
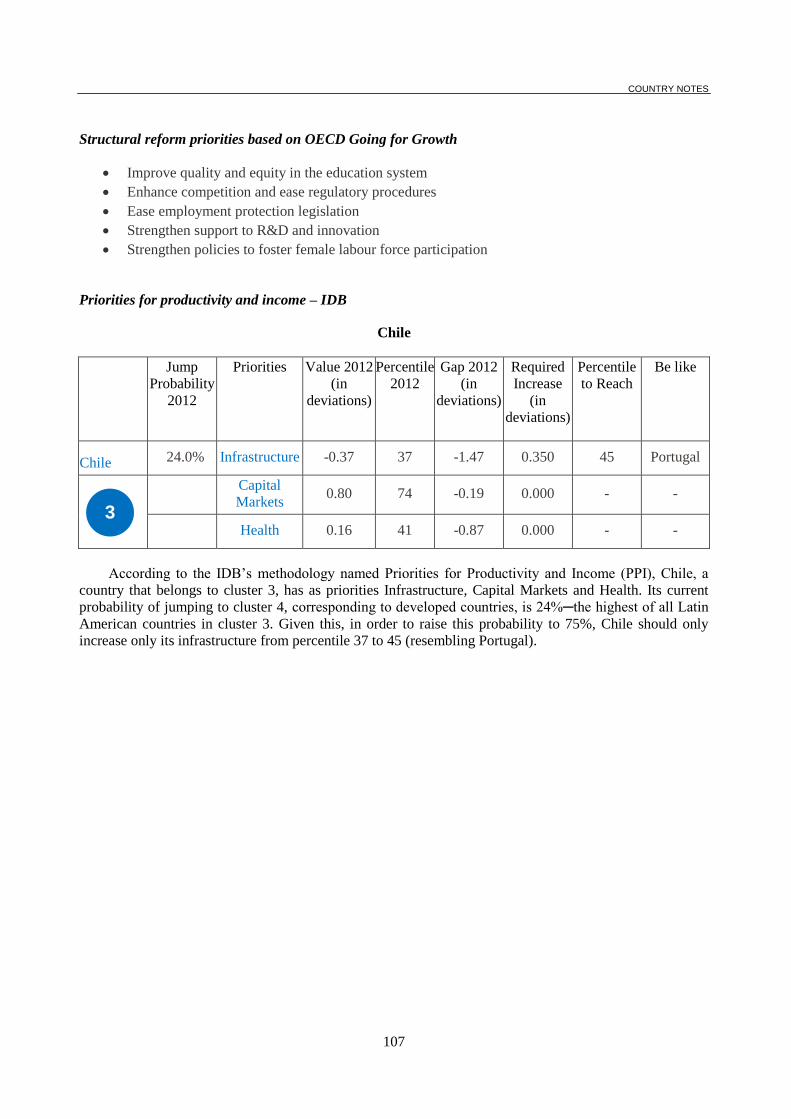
COUNTRY NOTES
107
Structural reform priorities based on OECD Going for Growth
Improve quality and equity in the education system
Enhance competition and ease regulatory procedures
Ease employment protection legislation
Strengthen support to R&D and innovation
Strengthen policies to foster female labour force participation
Priorities for productivity and income – IDB
Chile
Jump
Probability
2012
Priorities Value 2012
(in
deviations)
Percentile
2012
Gap 2012
(in
deviations)
Required
Increase
(in
deviations)
Percentile
to Reach
Be like
Chile 24.0% Infrastructure -0.37 37 -1.47 0.350 45 Portugal
Capital
Markets 0.80 74 -0.19 0.000 - -
Health 0.16 41 -0.87 0.000 - -
According to the IDB’s methodology named Priorities for Productivity and Income (PPI), Chile, a
country that belongs to cluster 3, has as priorities Infrastructure, Capital Markets and Health. Its current
probability of jumping to cluster 4, corresponding to developed countries, is 24%─the highest of all Latin
American countries in cluster 3. Given this, in order to raise this probability to 75%, Chile should only
increase only its infrastructure from percentile 37 to 45 (resembling Portugal).
3
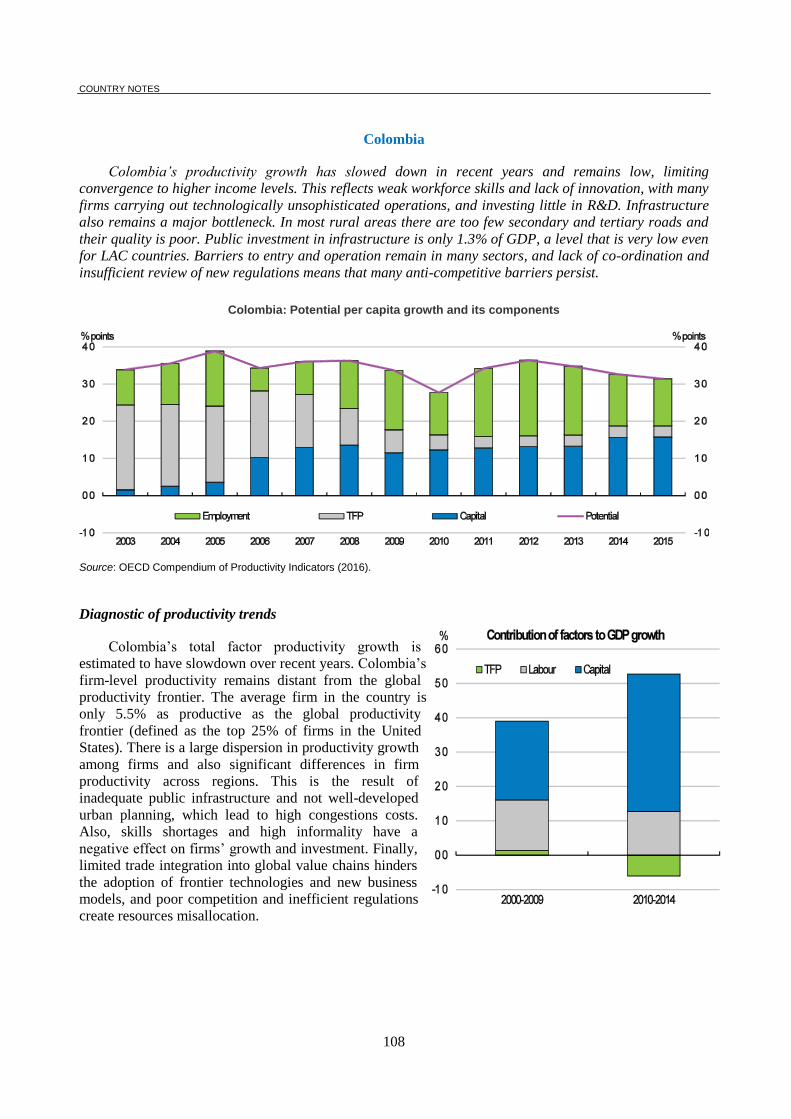
COUNTRY NOTES
108
Colombia
Colombia’s productivity growth has slowed down in recent years and remains low, limiting
convergence to higher income levels. This reflects weak workforce skills and lack of innovation, with many
firms carrying out technologically unsophisticated operations, and investing little in R&D. Infrastructure
also remains a major bottleneck. In most rural areas there are too few secondary and tertiary roads and
their quality is poor. Public investment in infrastructure is only 1.3% of GDP, a level that is very low even
for LAC countries. Barriers to entry and operation remain in many sectors, and lack of co-ordination and
insufficient review of new regulations means that many anti-competitive barriers persist.
Colombia: Potential per capita growth and its components
Source: OECD Compendium of Productivity Indicators (2016).
Diagnostic of productivity trends
Colombia’s total factor productivity growth is
estimated to have slowdown over recent years. Colombia’s
firm-level productivity remains distant from the global
productivity frontier. The average firm in the country is
only 5.5% as productive as the global productivity
frontier (defined as the top 25% of firms in the United
States). There is a large dispersion in productivity growth
among firms and also significant differences in firm
productivity across regions. This is the result of
inadequate public infrastructure and not well-developed
urban planning, which lead to high congestions costs.
Also, skills shortages and high informality have a
negative effect on firms’ growth and investment. Finally,
limited trade integration into global value chains hinders
the adoption of frontier technologies and new business
models, and poor competition and inefficient regulations
create resources misallocation.
COUNTRY NOTES
109
Recent structural reforms
8 August 2016, the National Council on Economic and Social Policy approved the Productive
Development Policy 2016-2025, which aims to improve the levels of productivity, diversification and
sophistication in the economy, in order to move towards higher value-added exports. But a number of other
reforms have been implemented in recent years.
Education reform: The education system is undergoing a fundamental transformation. Recent
policies were able to expand enrolment at every level, increasing access in every corner of the
country. Access to early childhood education and care and tertiary education doubled over the
last decade. However, the quality of education remains poor, with wide inequalities across
socioeconomic groups.
Product-market competition: Colombia has made great strides toward OECD standards in
competition policy. Recently it has adopted important legislative reforms in order to strengthen
competition policy, such as amendments to the leniency program, Amendments to the merger
regime and trade association guidelines.
Informality: A series of recent legislative initiatives have helped reduce informality. The most
important one was the 2012 tax reform, which significantly reduced non-wage labour costs.
However, informality remains high as a result of high labour costs, lack of awareness about the
rights and benefits associated with being formal, complex procedures for companies’ registration
to social security and weak monitoring. .
R&D and technology policy: There are different instruments and programs that are being
implemented by different government agencies in order to foster innovation in Colombian firms
among which are as Innovation Pacts and Alliances for Innovation, which are voluntary
agreements with companies that see innovation as a growth and business development strategy.
Entrepreneurship: Colombia has made great efforts on reducing the administrative burdens for
enterprises. Two general strategies have been developed that simplify the processes and services
to be provided to the enterprises. The first is the creation of one-stop shops for business
registration, foreign trade and procedures of telecommunications. The second is to allow the
procedures to be done on-line and reduce the time spent for compliance.
Special Economic Zones: Colombia has created special economic zones for exports in the
municipalities of Buenaventura, Cucuta, Valledupar or Ipiales to produce goods or provide
services mainly meant to be exported. .
Productivity-enhancing institution
The National Commission of Competitiveness and Innovation, the highest body of the National
System of Competitiveness and Innovation, is responsible for advising the President of the Republic and
the National Government in the formulation of policy guidelines on productivity, competitiveness, science,
technology and innovation.
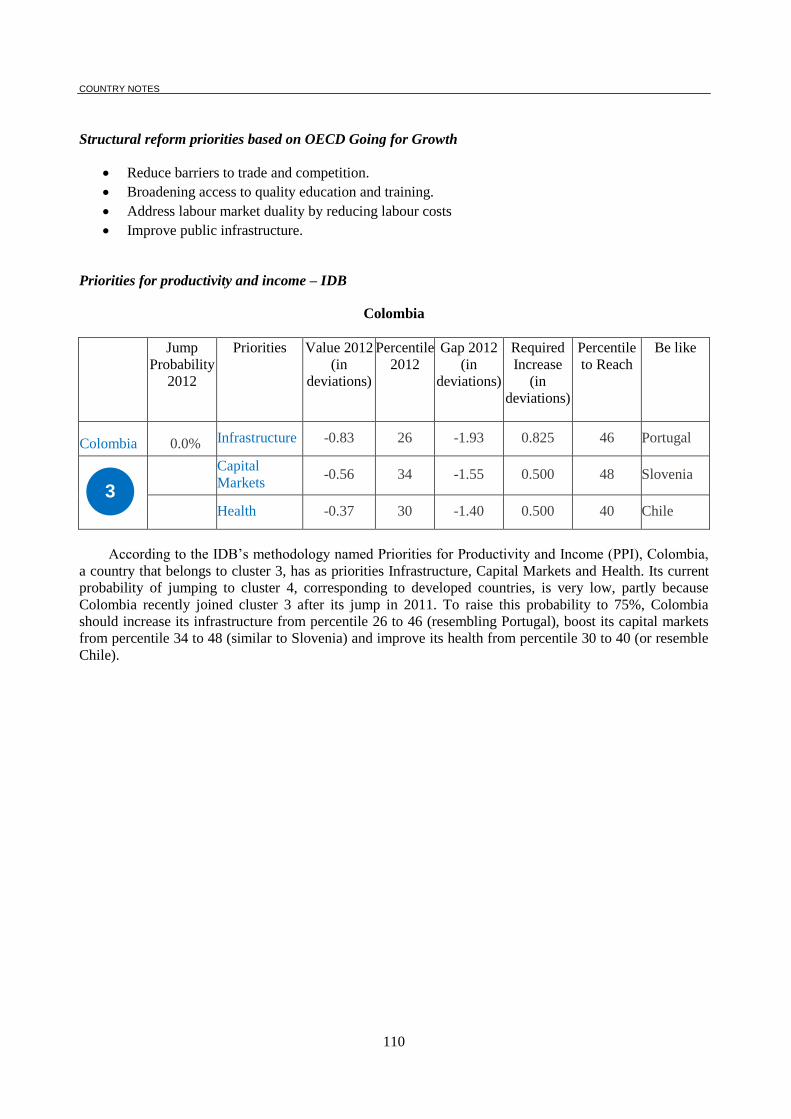
COUNTRY NOTES
110
Structural reform priorities based on OECD Going for Growth
Reduce barriers to trade and competition.
Broadening access to quality education and training.
Address labour market duality by reducing labour costs
Improve public infrastructure.
Priorities for productivity and income – IDB
Colombia
Jump
Probability
2012
Priorities Value 2012
(in
deviations)
Percentile
2012
Gap 2012
(in
deviations)
Required
Increase
(in
deviations)
Percentile
to Reach
Be like
Colombia 0.0% Infrastructure -0.83 26 -1.93 0.825 46 Portugal
Capital
Markets -0.56 34 -1.55 0.500 48 Slovenia
Health -0.37 30 -1.40 0.500 40 Chile
According to the IDB’s methodology named Priorities for Productivity and Income (PPI), Colombia,
a country that belongs to cluster 3, has as priorities Infrastructure, Capital Markets and Health. Its current
probability of jumping to cluster 4, corresponding to developed countries, is very low, partly because
Colombia recently joined cluster 3 after its jump in 2011. To raise this probability to 75%, Colombia
should increase its infrastructure from percentile 26 to 46 (resembling Portugal), boost its capital markets
from percentile 34 to 48 (similar to Slovenia) and improve its health from percentile 30 to 40 (or resemble
Chile).
3
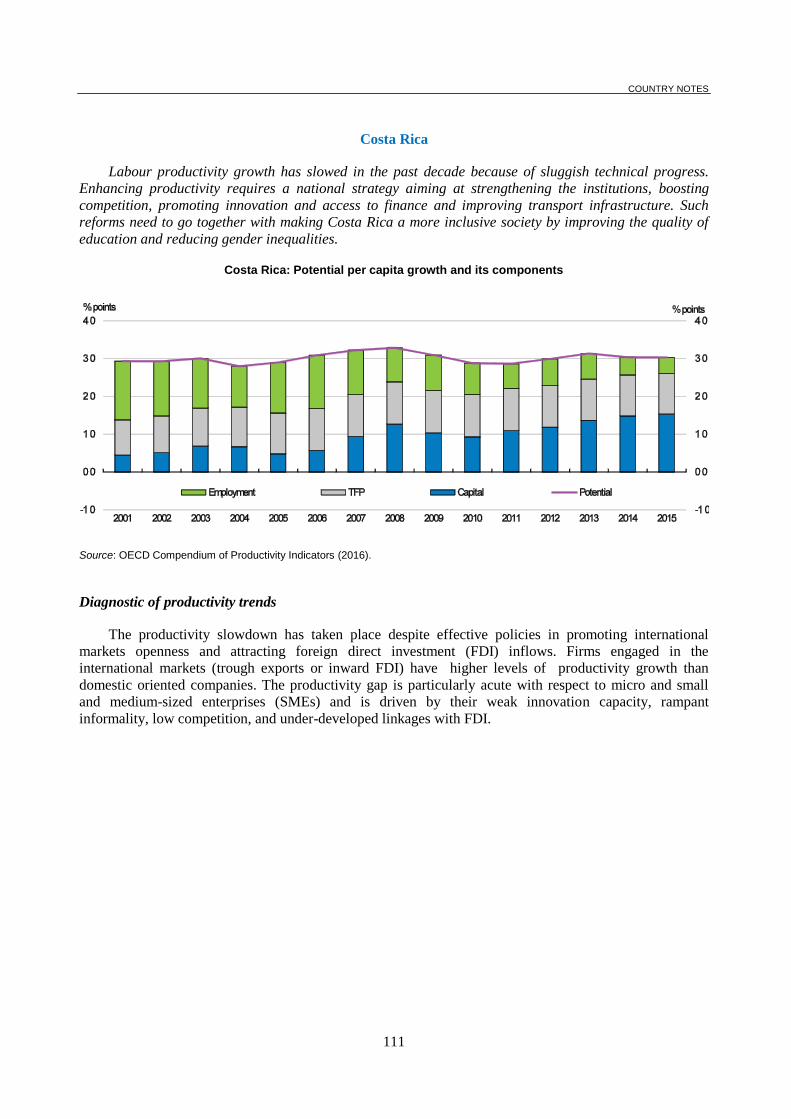
COUNTRY NOTES
111
Costa Rica
Labour productivity growth has slowed in the past decade because of sluggish technical progress.
Enhancing productivity requires a national strategy aiming at strengthening the institutions, boosting
competition, promoting innovation and access to finance and improving transport infrastructure. Such
reforms need to go together with making Costa Rica a more inclusive society by improving the quality of
education and reducing gender inequalities.
Costa Rica: Potential per capita growth and its components
Source: OECD Compendium of Productivity Indicators (2016).
Diagnostic of productivity trends
The productivity slowdown has taken place despite effective policies in promoting international
markets openness and attracting foreign direct investment (FDI) inflows. Firms engaged in the
international markets (trough exports or inward FDI) have higher levels of productivity growth than
domestic oriented companies. The productivity gap is particularly acute with respect to micro and small
and medium-sized enterprises (SMEs) and is driven by their weak innovation capacity, rampant
informality, low competition, and under-developed linkages with FDI.
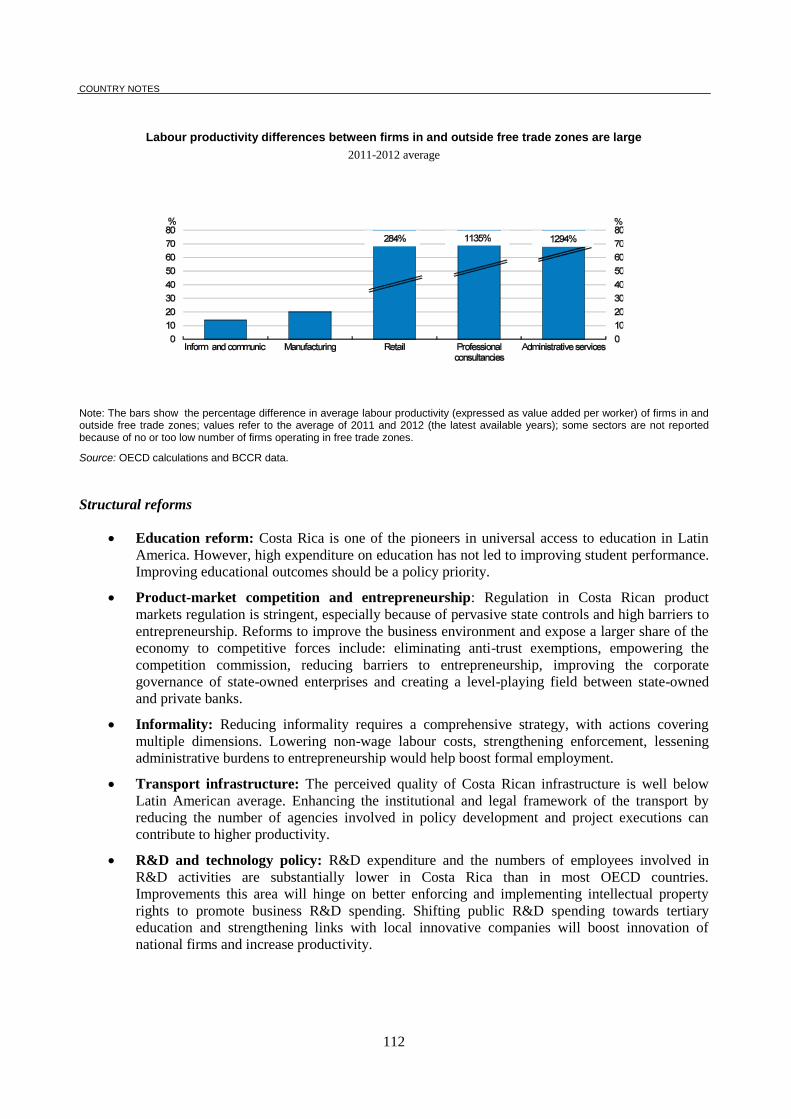
COUNTRY NOTES
112
Labour productivity differences between firms in and outside free trade zones are large
2011-2012 average
Note: The bars show the percentage difference in average labour productivity (expressed as value added per worker) of firms in and outside free trade zones; values refer to the average of 2011 and 2012 (the latest available years); some sectors are not reported because of no or too low number of firms operating in free trade zones.
Source: OECD calculations and BCCR data.
Structural reforms
Education reform: Costa Rica is one of the pioneers in universal access to education in Latin
America. However, high expenditure on education has not led to improving student performance.
Improving educational outcomes should be a policy priority.
Product-market competition and entrepreneurship: Regulation in Costa Rican product
markets regulation is stringent, especially because of pervasive state controls and high barriers to
entrepreneurship. Reforms to improve the business environment and expose a larger share of the
economy to competitive forces include: eliminating anti-trust exemptions, empowering the
competition commission, reducing barriers to entrepreneurship, improving the corporate
governance of state-owned enterprises and creating a level-playing field between state-owned
and private banks.
Informality: Reducing informality requires a comprehensive strategy, with actions covering
multiple dimensions. Lowering non-wage labour costs, strengthening enforcement, lessening
administrative burdens to entrepreneurship would help boost formal employment.
Transport infrastructure: The perceived quality of Costa Rican infrastructure is well below
Latin American average. Enhancing the institutional and legal framework of the transport by
reducing the number of agencies involved in policy development and project executions can
contribute to higher productivity.
R&D and technology policy: R&D expenditure and the numbers of employees involved in
R&D activities are substantially lower in Costa Rica than in most OECD countries.
Improvements this area will hinge on better enforcing and implementing intellectual property
rights to promote business R&D spending. Shifting public R&D spending towards tertiary
education and strengthening links with local innovative companies will boost innovation of
national firms and increase productivity.
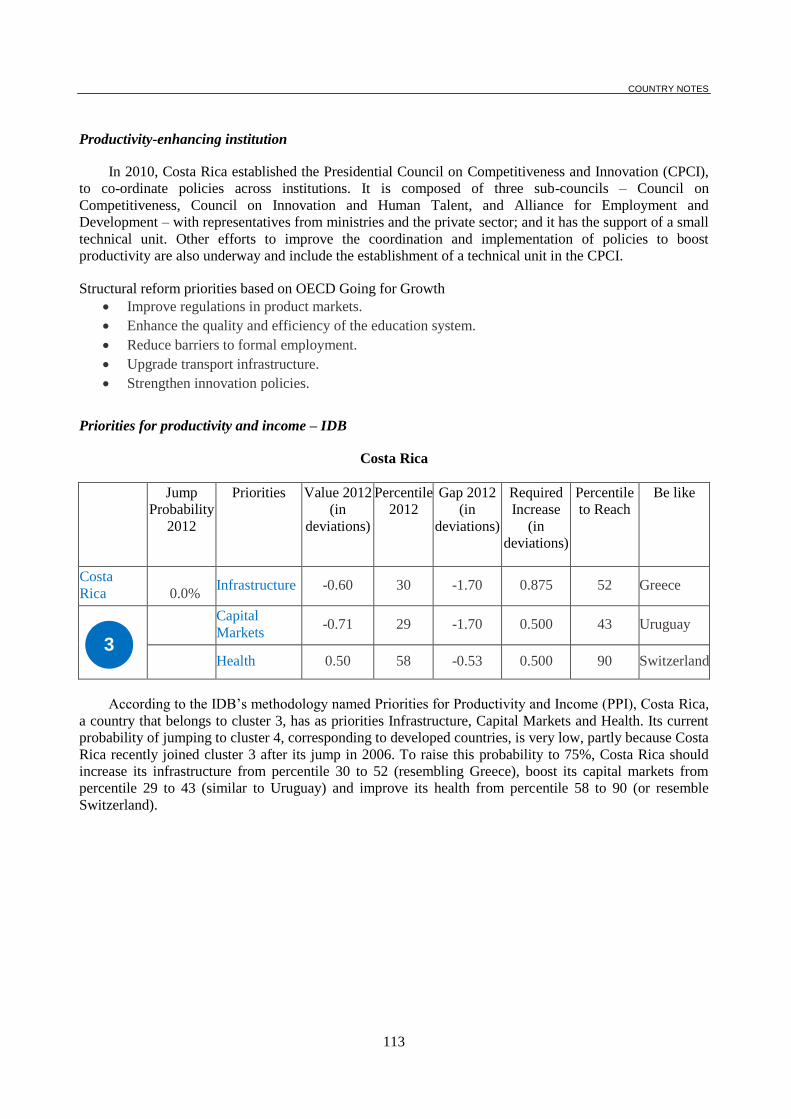
COUNTRY NOTES
113
Productivity-enhancing institution
In 2010, Costa Rica established the Presidential Council on Competitiveness and Innovation (CPCI),
to co-ordinate policies across institutions. It is composed of three sub-councils – Council on
Competitiveness, Council on Innovation and Human Talent, and Alliance for Employment and
Development – with representatives from ministries and the private sector; and it has the support of a small
technical unit. Other efforts to improve the coordination and implementation of policies to boost
productivity are also underway and include the establishment of a technical unit in the CPCI.
Structural reform priorities based on OECD Going for Growth
Improve regulations in product markets.
Enhance the quality and efficiency of the education system.
Reduce barriers to formal employment.
Upgrade transport infrastructure.
Strengthen innovation policies.
Priorities for productivity and income – IDB
Costa Rica
Jump
Probability
2012
Priorities Value 2012
(in
deviations)
Percentile
2012
Gap 2012
(in
deviations)
Required
Increase
(in
deviations)
Percentile
to Reach
Be like
Costa
Rica 0.0% Infrastructure -0.60 30 -1.70 0.875 52 Greece
Capital
Markets -0.71 29 -1.70 0.500 43 Uruguay
Health 0.50 58 -0.53 0.500 90 Switzerland
According to the IDB’s methodology named Priorities for Productivity and Income (PPI), Costa Rica,
a country that belongs to cluster 3, has as priorities Infrastructure, Capital Markets and Health. Its current
probability of jumping to cluster 4, corresponding to developed countries, is very low, partly because Costa
Rica recently joined cluster 3 after its jump in 2006. To raise this probability to 75%, Costa Rica should
increase its infrastructure from percentile 30 to 52 (resembling Greece), boost its capital markets from
percentile 29 to 43 (similar to Uruguay) and improve its health from percentile 58 to 90 (or resemble
Switzerland).
3
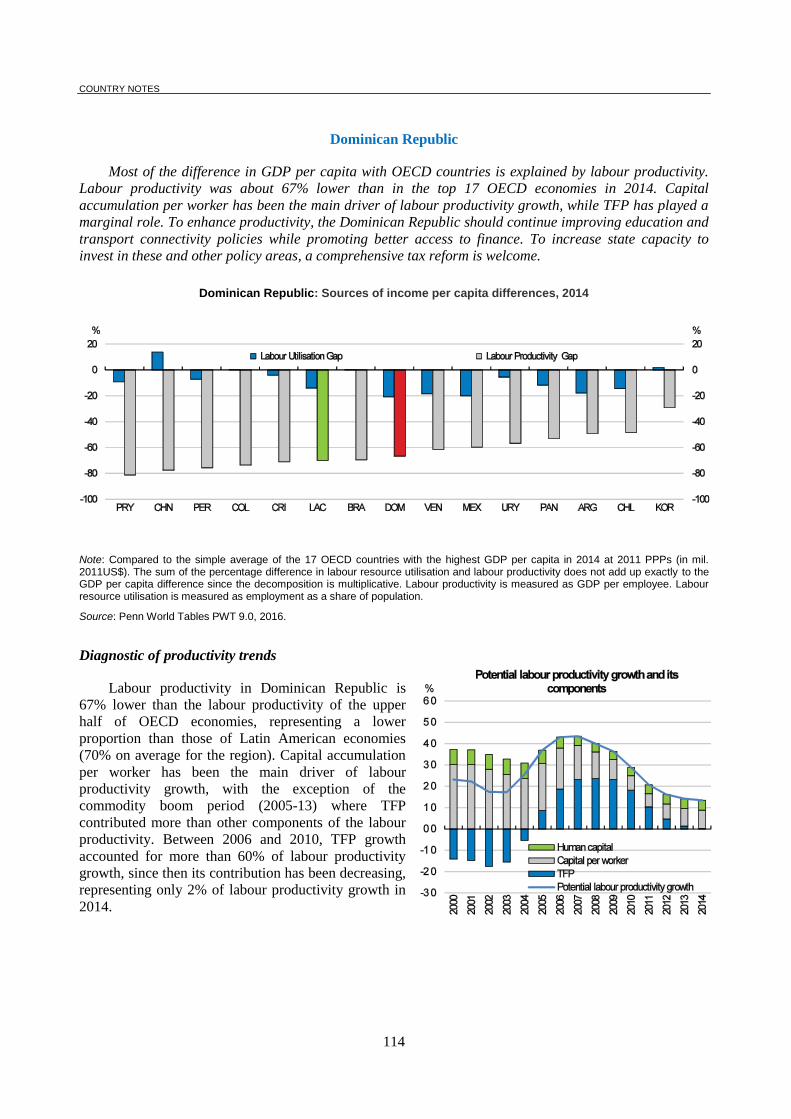
COUNTRY NOTES
114
Dominican Republic
Most of the difference in GDP per capita with OECD countries is explained by labour productivity.
Labour productivity was about 67% lower than in the top 17 OECD economies in 2014. Capital
accumulation per worker has been the main driver of labour productivity growth, while TFP has played a
marginal role. To enhance productivity, the Dominican Republic should continue improving education and
transport connectivity policies while promoting better access to finance. To increase state capacity to
invest in these and other policy areas, a comprehensive tax reform is welcome.
Dominican Republic: Sources of income per capita differences, 2014
Note: Compared to the simple average of the 17 OECD countries with the highest GDP per capita in 2014 at 2011 PPPs (in mil. 2011US$). The sum of the percentage difference in labour resource utilisation and labour productivity does not add up exactly to the GDP per capita difference since the decomposition is multiplicative. Labour productivity is measured as GDP per employee. Labour resource utilisation is measured as employment as a share of population.
Source: Penn World Tables PWT 9.0, 2016.
Diagnostic of productivity trends
Labour productivity in Dominican Republic is
67% lower than the labour productivity of the upper
half of OECD economies, representing a lower
proportion than those of Latin American economies
(70% on average for the region). Capital accumulation
per worker has been the main driver of labour
productivity growth, with the exception of the
commodity boom period (2005-13) where TFP
contributed more than other components of the labour
productivity. Between 2006 and 2010, TFP growth
accounted for more than 60% of labour productivity
growth, since then its contribution has been decreasing,
representing only 2% of labour productivity growth in
2014.
COUNTRY NOTES
115
The Dominican Republic has experienced high labour productivity growth rates since 1996, but they
have been mainly concentrated in sectors that create few jobs and have not reflected in wages increases.
Between 1996 and 2013 labour productivity grew at an average rate of 2.6% per year. This performance
has been concentrated in the sectors where only 30% of Dominicans work: mining (4.7% growth per year),
manufacturing (5.1% growth per year) and transport and communications (6.8% growth per year). In
contrast, labour productivity in only “other service sectors” (i.e., Education, Health and social services as
well as services in private households), where the highest proportion of Dominicans work (24% of total
jobs), decreased by -1.5% between 2005 and 2013. Finally, the overall increase in labour productivity
between 1990 and 2013 has not been reflected in wage increases, as wages decreased in this period by -
1.3%.30
Recent productivity-enhancing policies
The Dominican Republic has a challenging agenda of broad-based policies to boost productivity.
Education and skills are fundamental to boost productivity. The Dominican Republic has made
considerable efforts to improve the coverage and quality of education. They created a National Alliance for
Education Reform (Pacto Nacional para la Reforma Educativa) in 2014. The alliance’s actions represent
an investment of more than 4% of GDP in education. Similarly, programmes such as “nivel medio" aims to
provide qualified teachers (better wages and training), developing the curriculum and content, and creating
the necessary infrastructure. In vocational education and training, the Dominican Republic has been
promoting public-private partnerships through the INFOTEP vocational education centre (Instituto de
Formación Técnica y Profesional) and supporting technical and vocational training in high-technology
domains through the ITLA technical college (Instituto Tecnológico de las Américas) .
The development of the “Agenda Digital” (Digital Agenda) 2016-2020 is an effort to increase the use
of new technologies and communications. The agenda identifies and delimits an action plan for possible
barriers for the development of the Agenda, such as low infrastructure and connectivity, low prices, low
human capital and delimits.
Key recommendations to boost productivity
Increase access to finance. Low levels of banking penetration and the low development of the
capital markets could complicate the efficient distribution of the necessary resources for higher
productivity growth. Actions include improvement in the management of the public debt and
initiatives to increase access to finance to the middle class, such as the promotion of financial
education and reduce the cost of regulatory compliance (OECD, 2012).
Promote entrepreneurship by improving the business regulatory process and increasing the
effectiveness of entrepreneurship programmes. Barriers to entrepreneurship are higher in the
Dominican Republic than the average of OECD economies. This result is mainly explained by
the complexity of the regulatory process. In addition, the estimated spending of entrepreneurship
programmes is relatively low in the Dominican Republic (only 0.02% of GDP)
(OECD/CAF/ECLAC, 2016, OECD, 2013b).
Increase transport connectivity thanks to better infrastructure and logistics policies. More
than 93% of the Dominican Republic’s exports are time sensitive. Furthermore, the ratio of
transport costs to tariffs is 11 times higher than in OECD economies (OECD/CAF/ECLAC,
30
Figures and sector classification are based on official figures and methodology form the Central Bank of the
Dominican Republic (http://www.bancentral.gov.do/).
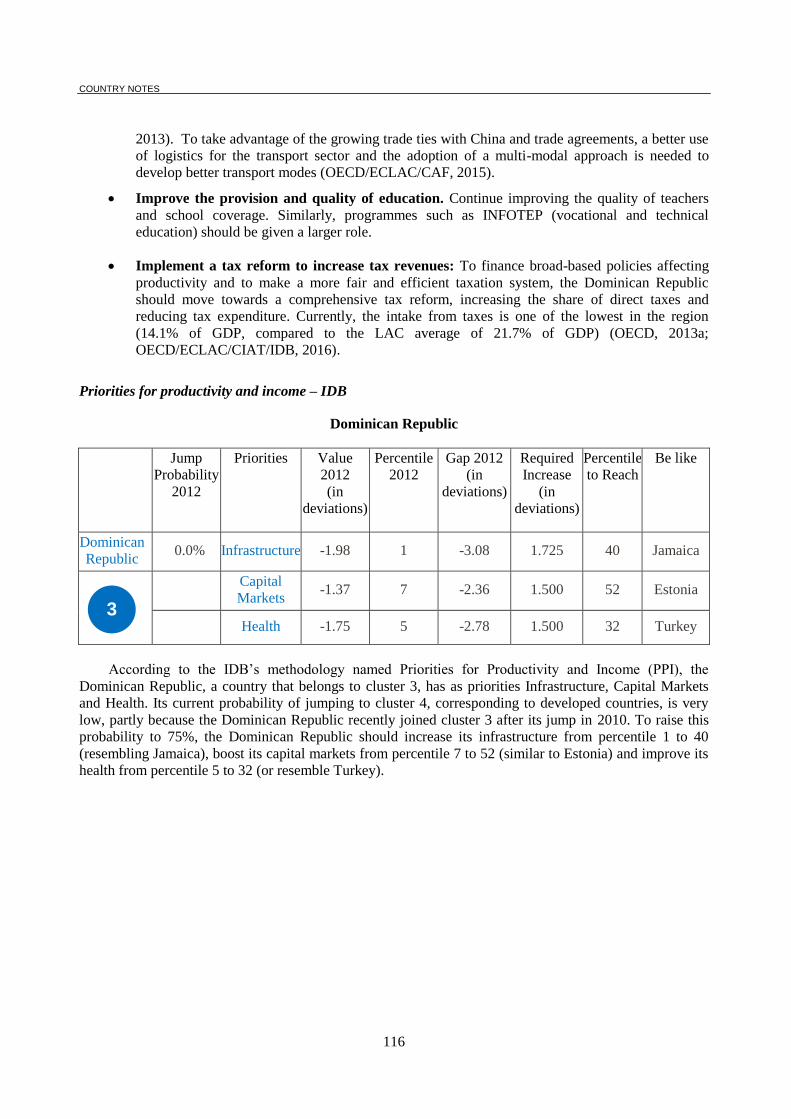
COUNTRY NOTES
116
2013). To take advantage of the growing trade ties with China and trade agreements, a better use
of logistics for the transport sector and the adoption of a multi-modal approach is needed to
develop better transport modes (OECD/ECLAC/CAF, 2015).
Improve the provision and quality of education. Continue improving the quality of teachers
and school coverage. Similarly, programmes such as INFOTEP (vocational and technical
education) should be given a larger role.
Implement a tax reform to increase tax revenues: To finance broad-based policies affecting
productivity and to make a more fair and efficient taxation system, the Dominican Republic
should move towards a comprehensive tax reform, increasing the share of direct taxes and
reducing tax expenditure. Currently, the intake from taxes is one of the lowest in the region
(14.1% of GDP, compared to the LAC average of 21.7% of GDP) (OECD, 2013a;
OECD/ECLAC/CIAT/IDB, 2016).
Priorities for productivity and income – IDB
Dominican Republic
Jump
Probability
2012
Priorities Value
2012
(in
deviations)
Percentile
2012
Gap 2012
(in
deviations)
Required
Increase
(in
deviations)
Percentile
to Reach
Be like
Dominican
Republic 0.0% Infrastructure -1.98 1 -3.08 1.725 40 Jamaica
Capital
Markets -1.37 7 -2.36 1.500 52 Estonia
Health -1.75 5 -2.78 1.500 32 Turkey
According to the IDB’s methodology named Priorities for Productivity and Income (PPI), the
Dominican Republic, a country that belongs to cluster 3, has as priorities Infrastructure, Capital Markets
and Health. Its current probability of jumping to cluster 4, corresponding to developed countries, is very
low, partly because the Dominican Republic recently joined cluster 3 after its jump in 2010. To raise this
probability to 75%, the Dominican Republic should increase its infrastructure from percentile 1 to 40
(resembling Jamaica), boost its capital markets from percentile 7 to 52 (similar to Estonia) and improve its
health from percentile 5 to 32 (or resemble Turkey).
3
COUNTRY NOTES
117
REFERENCES
(OECD, 2012), Capital Markets in the Dominican Republic: Tapping the Potential for Development,
Development Centre Studies, OECD Publishing.
(OECD, 2013a), Política Fiscal para el desarrollo en República Dominicana (Fiscal Policy for
Development in the Dominican Republic), Development Centre, Making Development Happen
series, OECD Publishing.
OECD (2013b), Product Market Regulation Database, www.oecd.org/economy/pmr.
OECD/CAF/ECLAC (2013), Latin American Economic Outlook 2014: Logistics and Competitiveness for
Development, OECD Publishing, Paris.
DOI: http://dx.doi.org/10.1787/leo-2014-en
OECD/CAF/ECLAC (2014), Latin American Economic Outlook 2015: Education, Skills and Innovation
for Development, OECD Publishing, Paris.
DOI: http://dx.doi.org/10.1787/leo-2015-en
OECD/ECLAC/CAF (2015), Latin American Economic Outlook 2016: Towards a New Partnership with
China, OECD Publishing, Paris. http://dx.doi.org/10.1787/9789264246218-en
OECD/CAF/ECLAC (2016), Latin American Economic Outlook 2017: Youth, Skills and entrepreneurship
Development, OECD Publishing, Paris.
DOI: http://dx.doi.org/10.1787/leo-2015-en
OECD/ECLAC/CIAT/IDB (2016), Revenue Statistics in Latin America and the Caribbean 2016, OECD
Publishing, Paris. DOI: http://dx.doi.org/10.1787/rev_lat_car-2016-en-fr
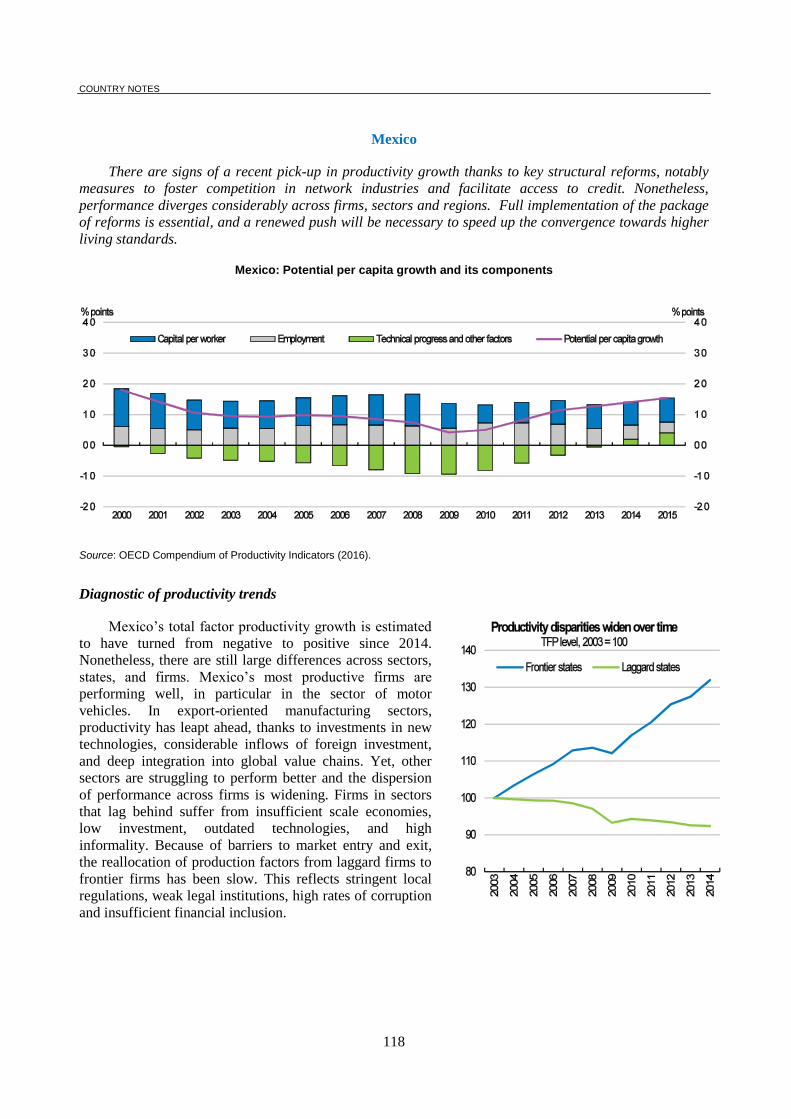
COUNTRY NOTES
118
Mexico
There are signs of a recent pick-up in productivity growth thanks to key structural reforms, notably
measures to foster competition in network industries and facilitate access to credit. Nonetheless,
performance diverges considerably across firms, sectors and regions. Full implementation of the package
of reforms is essential, and a renewed push will be necessary to speed up the convergence towards higher
living standards.
Mexico: Potential per capita growth and its components
Source: OECD Compendium of Productivity Indicators (2016).
Diagnostic of productivity trends
Mexico’s total factor productivity growth is estimated
to have turned from negative to positive since 2014.
Nonetheless, there are still large differences across sectors,
states, and firms. Mexico’s most productive firms are
performing well, in particular in the sector of motor
vehicles. In export-oriented manufacturing sectors,
productivity has leapt ahead, thanks to investments in new
technologies, considerable inflows of foreign investment,
and deep integration into global value chains. Yet, other
sectors are struggling to perform better and the dispersion
of performance across firms is widening. Firms in sectors
that lag behind suffer from insufficient scale economies,
low investment, outdated technologies, and high
informality. Because of barriers to market entry and exit,
the reallocation of production factors from laggard firms to
frontier firms has been slow. This reflects stringent local
regulations, weak legal institutions, high rates of corruption
and insufficient financial inclusion.
COUNTRY NOTES
119
Recent structural reforms
The government has adopted decisive reforms since 2012. Pivotal sectors – notably energy and
telecoms -- have been opened to more intense competition. These reforms have only been in effect for a
short period of time, but there are early signs of an upturn in productivity growth.
Education reform: Wide-ranging education reforms are proceeding fairly well in most states,
while those states that initially resisted now complying. Teachers’ evaluations will be
accompanied by continuous training to help advance professional development.
Product-market competition: Competition policy has improved recently, with visible results in
network industries and utilities. Examples are lower electricity prices, successful oil auction
tenders, more intensive competition in telecoms and broadcasting, and the three-fold increase in
leniency applications.
Legal reforms: In mid-2016, a legal reform was approved to deter corruption. More budgetary
and human resources for the judiciary would be crucial.
Informality: The programme “Go Formal” provides both “carrots” and “sticks” to firms in terms
of formalisation. Changes in the fiscal regime have induced 1.5 million informal firms to comply
with the tax system.
R&D and technology policy: The government objective is to double public R&D spending to
1% of GDP, but private spending on R&D remains extremely low. An R&D tax incentive is now
planned. Further promotion of industry co-operation with research institutes, particularly in
sectors with high domestic content in exports, could be helpful.
Entrepreneurship: New policy tools are being developed to foster the emergence of start-ups,
including a fund for entrepreneurs, improvements in access to credit, the recently approved
Productivity and Competitiveness Law, and an introduction of a national one-stop shop (Gob.mx)
as well as a company-in-one-day law.
Special Economic Zones: A federal law creating Special Economic Zones (SEZ) in four of the
poorest regions of the country was enacted. The zones will include tax incentives, trade facilities
and duty-free customs exemptions, as well as streamlining regulatory processes. The zones also
aim at increasing infrastructure investment in energy and telecommunications.
Productivity-enhancing institution
The Productivity and Competitiveness Act enacted in May 2015 institutionalized the National
Productivity Council (NPC), whose aim is to recommend policies and concrete projects with the objective
of democratizing and increasing productivity. The NPC, under the umbrella of the Presidency, is composed
of the relevant ministers (finance, economy, labour, education), the national council of Science and
Technology, and representatives of the business sector, universities and research entities. It has already
identified and provided recommendations for the auto parts, aerospace suppliers and retail trade sectors.
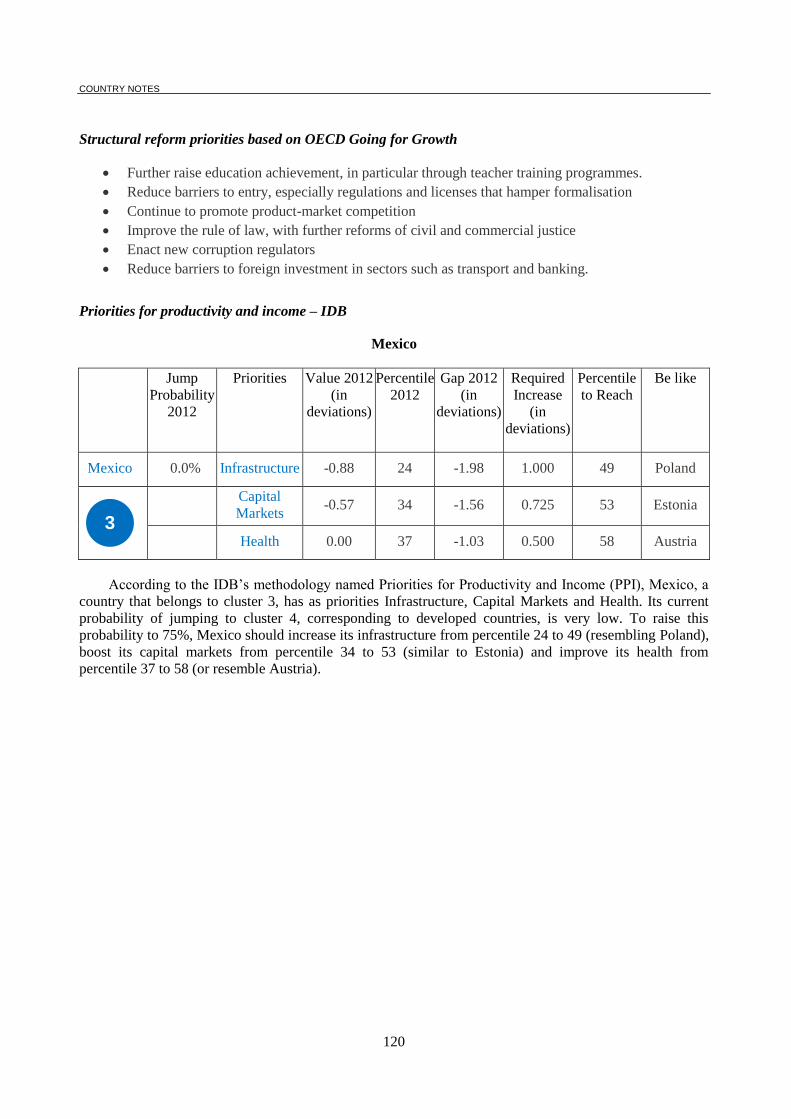
COUNTRY NOTES
120
Structural reform priorities based on OECD Going for Growth
Further raise education achievement, in particular through teacher training programmes.
Reduce barriers to entry, especially regulations and licenses that hamper formalisation
Continue to promote product-market competition
Improve the rule of law, with further reforms of civil and commercial justice
Enact new corruption regulators
Reduce barriers to foreign investment in sectors such as transport and banking.
Priorities for productivity and income – IDB
Mexico
Jump
Probability
2012
Priorities Value 2012
(in
deviations)
Percentile
2012
Gap 2012
(in
deviations)
Required
Increase
(in
deviations)
Percentile
to Reach
Be like
Mexico 0.0% Infrastructure -0.88 24 -1.98 1.000 49 Poland
Capital
Markets -0.57 34 -1.56 0.725 53 Estonia
Health 0.00 37 -1.03 0.500 58 Austria
According to the IDB’s methodology named Priorities for Productivity and Income (PPI), Mexico, a
country that belongs to cluster 3, has as priorities Infrastructure, Capital Markets and Health. Its current
probability of jumping to cluster 4, corresponding to developed countries, is very low. To raise this
probability to 75%, Mexico should increase its infrastructure from percentile 24 to 49 (resembling Poland),
boost its capital markets from percentile 34 to 53 (similar to Estonia) and improve its health from
percentile 37 to 58 (or resemble Austria).
3
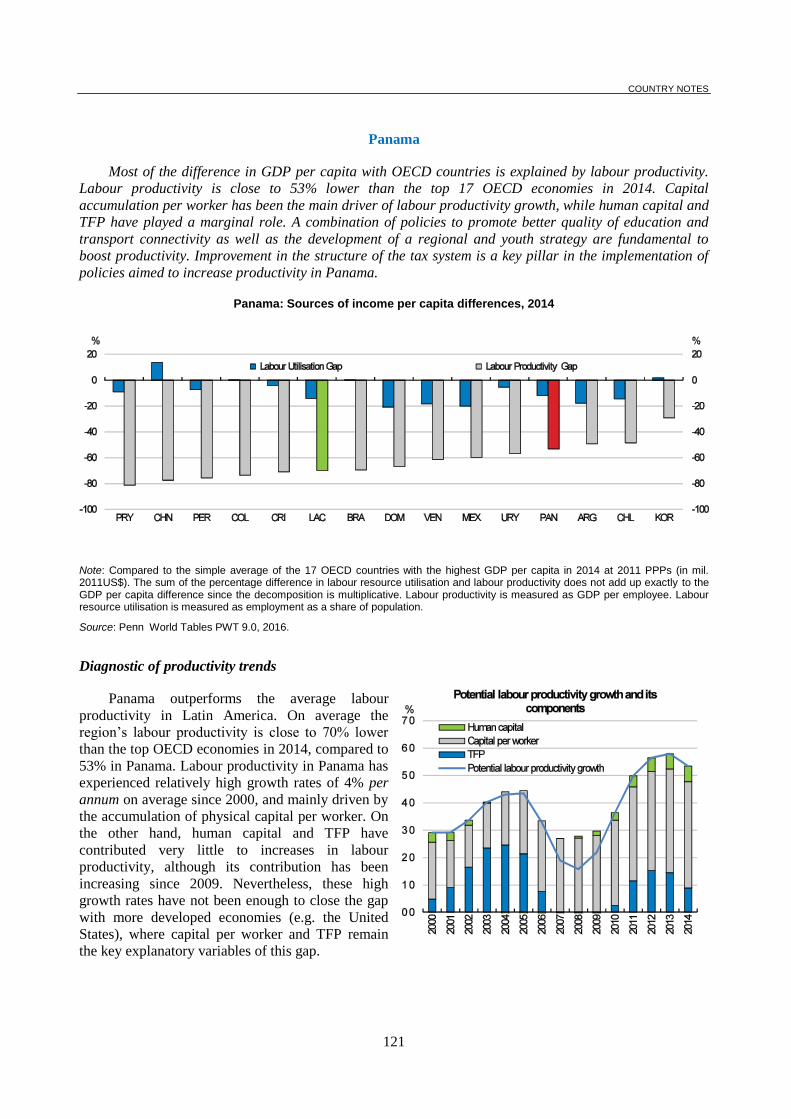
COUNTRY NOTES
121
Panama
Most of the difference in GDP per capita with OECD countries is explained by labour productivity.
Labour productivity is close to 53% lower than the top 17 OECD economies in 2014. Capital
accumulation per worker has been the main driver of labour productivity growth, while human capital and
TFP have played a marginal role. A combination of policies to promote better quality of education and
transport connectivity as well as the development of a regional and youth strategy are fundamental to
boost productivity. Improvement in the structure of the tax system is a key pillar in the implementation of
policies aimed to increase productivity in Panama.
Panama: Sources of income per capita differences, 2014
Note: Compared to the simple average of the 17 OECD countries with the highest GDP per capita in 2014 at 2011 PPPs (in mil. 2011US$). The sum of the percentage difference in labour resource utilisation and labour productivity does not add up exactly to the GDP per capita difference since the decomposition is multiplicative. Labour productivity is measured as GDP per employee. Labour resource utilisation is measured as employment as a share of population.
Source: Penn World Tables PWT 9.0, 2016.
Diagnostic of productivity trends
Panama outperforms the average labour
productivity in Latin America. On average the
region’s labour productivity is close to 70% lower
than the top OECD economies in 2014, compared to
53% in Panama. Labour productivity in Panama has
experienced relatively high growth rates of 4% per
annum on average since 2000, and mainly driven by
the accumulation of physical capital per worker. On
the other hand, human capital and TFP have
contributed very little to increases in labour
productivity, although its contribution has been
increasing since 2009. Nevertheless, these high
growth rates have not been enough to close the gap
with more developed economies (e.g. the United
States), where capital per worker and TFP remain
the key explanatory variables of this gap.
COUNTRY NOTES
122
Recent productivity-enhancing policies
In recent years, the country has sought to bolster the quality and coverage of education. In 2010, the
country launched the “Beca Universal” to increase education coverage. This scholarship programme
provides financial support to all students registered at primary and secondary levels, both in public and
private education centres (provided they are certified by the Ministry of Education) based on their
achievements. In addition, primary and secondary education curriculums were reformed under the
“curriculum transformation” initiative to link education programmes to practical skills as well as to
comprise learning by doing training and provide students with tools to integrate better into the workplace.
Annual investment in the programme has averaged 0.9% of GDP since it was introduced in 2010. It
provides training for teachers and introduces new curricula, and in 2012 it covered 70% of schools.
Additionally, the National Professional Training Institute (INADEH), the public entity in charge of
technical and vocation training, is developing a comprehensive training programme designed to create the
skills that the productive sector needs. On Average, 10,000 individuals graduate annually from a range of
short training courses offered by the INADEH, which spends around 0.11% of GDP in training (World
Bank, 2014).
In terms of infrastructure, recent investment in the canal and port infrastructure should contribute to
boost productivity. According to the global competitive index, Panama ranks 5th out of 136 countries in the
quality of port infrastructure (WEF, 2016). The newly expanded Panama canal should not only increase
trade activity, logistics-related investments and employment, but should also increase the effectiveness of
public revenues that could be spent on productive investments.
Key recommendations to boost productivity
Improve the provision and quality of education. Panama should continue improving the
quality of it teachers, expand education coverage –especially at secondary level- and work to
provide schooling that is adequate to the skills demanded by the private sector. Similarly, the
INADEH should be given a larger role to continue training and updating the skills of workers as
well as provide training to those who dropped-out of school and are low skilled
(OECD/CAF/ECLAC, 2014).
Increase transport connectivity thanks to better infrastructure and logistics policies. Despite
ranking relatively high in the quality of port infrastructure, Panama ranks relatively low in the
quality of roads, 48 out of 136 countries (WEF, 2016). Furthermore, more than 75% of Panama’s
exports are time sensitive. Actions include “soft” and “hard” policies. The “hard” components
are associated with transport infrastructure, which, given the costs component, are harder to
change in the short run. On the other hand, “soft” policies are linked to strengthening the
institutional structure and improving governance as part of an integral logistics policy offering
modern storage facilities, more efficient customs and certification procedures, and the use of new
information and communication technologies.
Integrate rural population, especially those in the comarcas, into productive activities. More
than 90% of the population in Kuna Yala, Emberá y Ngobe Buglé are poor (UNDP, 2016) and
involved in low productive activities. Improving their livelihood and offering support to engage
in value added activities thanks to a regional development agenda is crucial.
Include the youth in the labour market. In 2014 in line with the regional average, around 20%
of young people aged 15-29 are neither employed nor in education nor training compared with
15% in the OECD. Investing in youth’s skills is key to igniting endogenous engines of growth
and building a solid basis for future progress. Improving the skills of Panama’s youth involves
strengthening the education system and promoting lifelong and comprehensive skills policies.
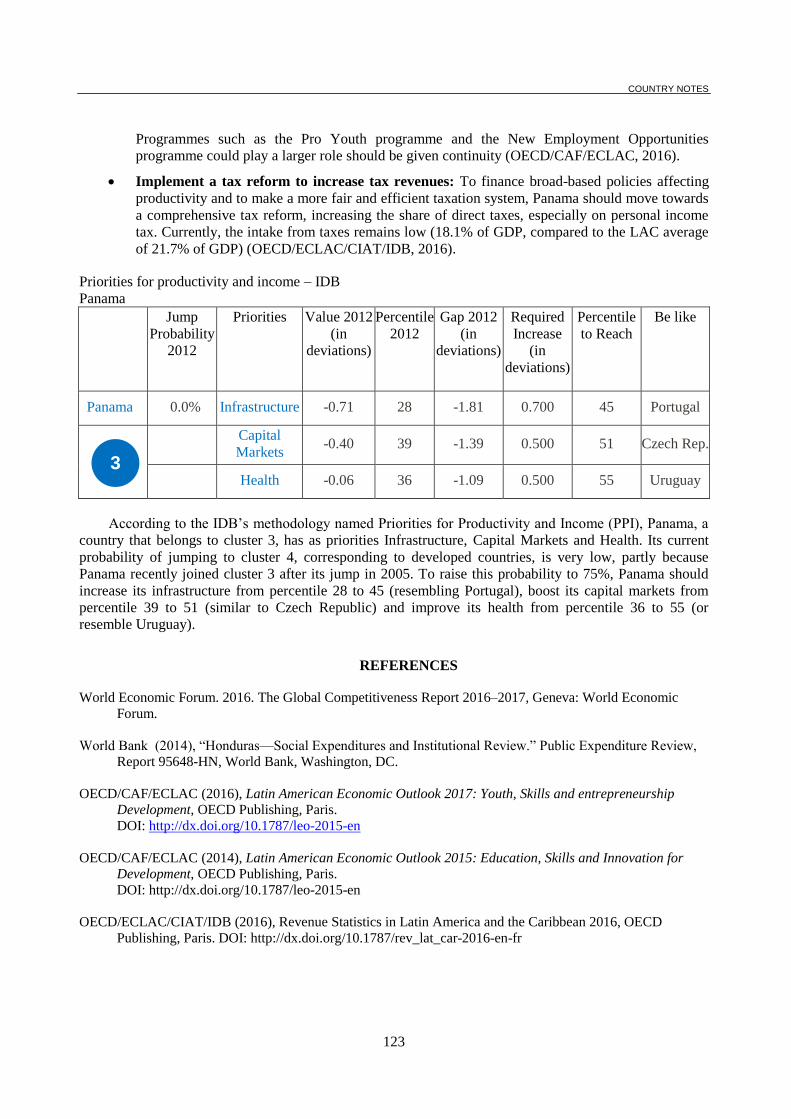
COUNTRY NOTES
123
Programmes such as the Pro Youth programme and the New Employment Opportunities
programme could play a larger role should be given continuity (OECD/CAF/ECLAC, 2016).
Implement a tax reform to increase tax revenues: To finance broad-based policies affecting
productivity and to make a more fair and efficient taxation system, Panama should move towards
a comprehensive tax reform, increasing the share of direct taxes, especially on personal income
tax. Currently, the intake from taxes remains low (18.1% of GDP, compared to the LAC average
of 21.7% of GDP) (OECD/ECLAC/CIAT/IDB, 2016).
Priorities for productivity and income – IDB
Panama
Jump
Probability
2012
Priorities Value 2012
(in
deviations)
Percentile
2012
Gap 2012
(in
deviations)
Required
Increase
(in
deviations)
Percentile
to Reach
Be like
Panama 0.0% Infrastructure -0.71 28 -1.81 0.700 45 Portugal
Capital
Markets -0.40 39 -1.39 0.500 51 Czech Rep.
Health -0.06 36 -1.09 0.500 55 Uruguay
According to the IDB’s methodology named Priorities for Productivity and Income (PPI), Panama, a
country that belongs to cluster 3, has as priorities Infrastructure, Capital Markets and Health. Its current
probability of jumping to cluster 4, corresponding to developed countries, is very low, partly because
Panama recently joined cluster 3 after its jump in 2005. To raise this probability to 75%, Panama should
increase its infrastructure from percentile 28 to 45 (resembling Portugal), boost its capital markets from
percentile 39 to 51 (similar to Czech Republic) and improve its health from percentile 36 to 55 (or
resemble Uruguay).
REFERENCES
World Economic Forum. 2016. The Global Competitiveness Report 2016–2017, Geneva: World Economic
Forum.
World Bank (2014), “Honduras—Social Expenditures and Institutional Review.” Public Expenditure Review,
Report 95648-HN, World Bank, Washington, DC.
OECD/CAF/ECLAC (2016), Latin American Economic Outlook 2017: Youth, Skills and entrepreneurship Development, OECD Publishing, Paris.
DOI: http://dx.doi.org/10.1787/leo-2015-en
OECD/CAF/ECLAC (2014), Latin American Economic Outlook 2015: Education, Skills and Innovation for Development, OECD Publishing, Paris.
DOI: http://dx.doi.org/10.1787/leo-2015-en
OECD/ECLAC/CIAT/IDB (2016), Revenue Statistics in Latin America and the Caribbean 2016, OECD
Publishing, Paris. DOI: http://dx.doi.org/10.1787/rev_lat_car-2016-en-fr
3
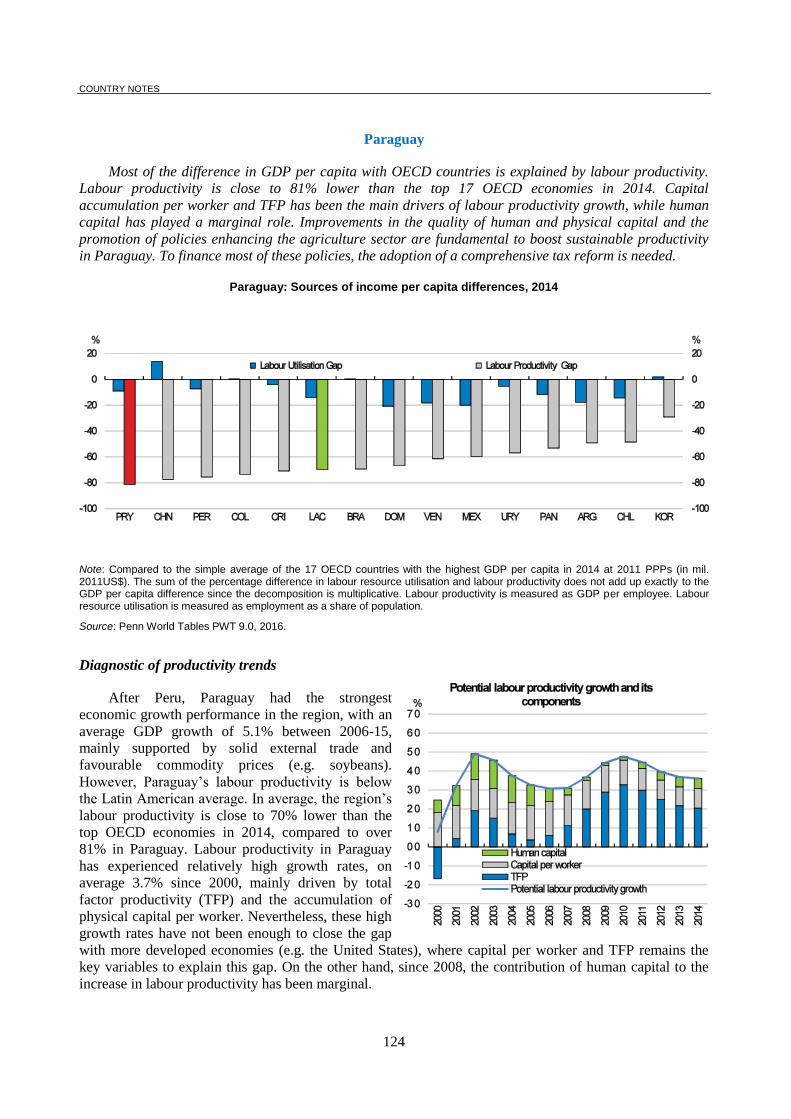
COUNTRY NOTES
124
Paraguay
Most of the difference in GDP per capita with OECD countries is explained by labour productivity.
Labour productivity is close to 81% lower than the top 17 OECD economies in 2014. Capital
accumulation per worker and TFP has been the main drivers of labour productivity growth, while human
capital has played a marginal role. Improvements in the quality of human and physical capital and the
promotion of policies enhancing the agriculture sector are fundamental to boost sustainable productivity
in Paraguay. To finance most of these policies, the adoption of a comprehensive tax reform is needed.
Paraguay: Sources of income per capita differences, 2014
Note: Compared to the simple average of the 17 OECD countries with the highest GDP per capita in 2014 at 2011 PPPs (in mil. 2011US$). The sum of the percentage difference in labour resource utilisation and labour productivity does not add up exactly to the GDP per capita difference since the decomposition is multiplicative. Labour productivity is measured as GDP per employee. Labour resource utilisation is measured as employment as a share of population.
Source: Penn World Tables PWT 9.0, 2016.
Diagnostic of productivity trends
After Peru, Paraguay had the strongest
economic growth performance in the region, with an
average GDP growth of 5.1% between 2006-15,
mainly supported by solid external trade and
favourable commodity prices (e.g. soybeans).
However, Paraguay’s labour productivity is below
the Latin American average. In average, the region’s
labour productivity is close to 70% lower than the
top OECD economies in 2014, compared to over
81% in Paraguay. Labour productivity in Paraguay
has experienced relatively high growth rates, on
average 3.7% since 2000, mainly driven by total
factor productivity (TFP) and the accumulation of
physical capital per worker. Nevertheless, these high
growth rates have not been enough to close the gap
with more developed economies (e.g. the United States), where capital per worker and TFP remains the
key variables to explain this gap. On the other hand, since 2008, the contribution of human capital to the
increase in labour productivity has been marginal.
COUNTRY NOTES
125
Recent productivity-enhancing policies
To improve its skills pool, Paraguay has four types of technical and vocational training. 1) the
Agricultural Professional Initiation (Iniciación Profesional Agropecuaria) that addresses the third-cycle
student in basic education; 2) technical schools and vocational training programmes that address students
of the medium education level; 3) technical education offered at the tertiary education level; and 4) non-
formal (vocational) training programmes that are part of lifelong learning. The last is part of the National
System of Professional Promotion (Sistema Nacional de Promoción Profesional – SNPP-) under the
responsibility of the Ministry of Labour, Employment and Social Security and aims to promote and
develop workers’ training and skills. Furthermore, the National System for Skill Formation and Vocational
Training (Sistema Nacional de Formación y Capacitación Laboral –SINAFOCAL-) also provides various
kinds of training and skill learning opportunities.
To improve youth insertion and entrepreneurship, Paraguay has designed an array of policies. For
instance, The Política de Empleo Juvenil (Youth Employment Policy) aims to implement initiatives that
support youth’s job trajectory. It also seeks to develop entrepreneurial culture in the country and create
jobs through entrepreneurship. Similarly, “Paraguay Emprende” (Paraguay Entrepreneurs) programme,
which aims to give youth the tools to help them start their own businesses. As a first step, it holds regional
and national workshops, mentoring and consulting to entrepreneurs aged 18-30 years.
Key recommendations to boost productivity
Improve the provision and quality of education. Coverage for secondary and tertiary
education is relatively low for adults (30-64 years old) in Paraguay (36.6% and 12.5%,
respectively) compared to the LAC regional average (38.6% and 13.4%, respectively) and the
OECD average (76% and 34%, respectively) (OECD/CAF/ECLAC, 2016). Paraguay should not
only increase education expenditure, but also increase its efficiency in education expenditure.
Increase transport connectivity thanks to better infrastructure and logistics policies. More
than 75% of Paraguay’s exports are time sensitive (OECD/CAF/ECLAC, 2014). To improve
transport connectivity, Paraguay could implement “soft” solutions, while “hard” policies are
incorporated in the medium-term, in particular transport infrastructure. “Soft” policies include
offering modern storage facilities, more efficient customs and certification procedures, and the
use of new information and communication technologies.
Low productivity in the agriculture sector is in part explained by Paraguay’s poor access to
long-term financing, which impedes investments on technology and improvements in the
management of agriculture supply chains (ECLAC/JICA, 2014). As agriculture accounts for
nearly 30% of the country’s economy, the sector has strong repercussions on growth volatility
(World Bank, 2014). Production, market and environmental risks are therefore important for the
sector’s overall productivity. Programmes in this direction, like IDB’s Project to Broaden
Financial Products have started to address the issue.
Implement a comprehensive tax reform. The implementation of the Ley de Responsabilidad
Fiscal (APP Law) has improved Paraguay’s macroeconomic and fiscal stance, but other reforms
may be needed. To finance broad-based policies affecting productivity and to make a more fair
and efficient taxation system, Paraguay should move towards a comprehensive tax reform,
increasing the share of direct taxes. Currently, the intake from taxes is one of the lowest in the
region (17.1% of GDP, compared to the LAC average of 21.7% of GDP)
(OECD/ECLAC/CIAT/IDB, 2016).
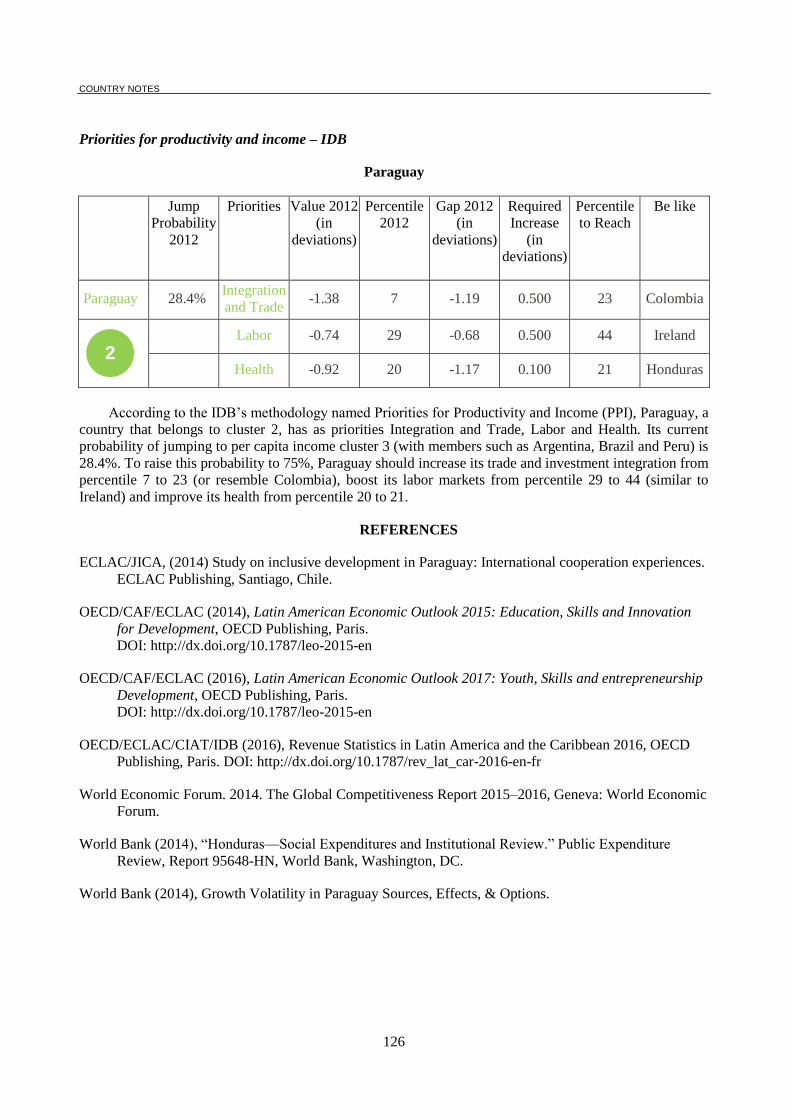
COUNTRY NOTES
126
Priorities for productivity and income – IDB
Paraguay
Jump
Probability
2012
Priorities Value 2012
(in
deviations)
Percentile
2012
Gap 2012
(in
deviations)
Required
Increase
(in
deviations)
Percentile
to Reach
Be like
Paraguay 28.4% Integration
and Trade -1.38 7 -1.19 0.500 23 Colombia
Labor -0.74 29 -0.68 0.500 44 Ireland
Health -0.92 20 -1.17 0.100 21 Honduras
According to the IDB’s methodology named Priorities for Productivity and Income (PPI), Paraguay, a
country that belongs to cluster 2, has as priorities Integration and Trade, Labor and Health. Its current
probability of jumping to per capita income cluster 3 (with members such as Argentina, Brazil and Peru) is
28.4%. To raise this probability to 75%, Paraguay should increase its trade and investment integration from
percentile 7 to 23 (or resemble Colombia), boost its labor markets from percentile 29 to 44 (similar to
Ireland) and improve its health from percentile 20 to 21.
REFERENCES
ECLAC/JICA, (2014) Study on inclusive development in Paraguay: International cooperation experiences.
ECLAC Publishing, Santiago, Chile.
OECD/CAF/ECLAC (2014), Latin American Economic Outlook 2015: Education, Skills and Innovation
for Development, OECD Publishing, Paris.
DOI: http://dx.doi.org/10.1787/leo-2015-en
OECD/CAF/ECLAC (2016), Latin American Economic Outlook 2017: Youth, Skills and entrepreneurship
Development, OECD Publishing, Paris.
DOI: http://dx.doi.org/10.1787/leo-2015-en
OECD/ECLAC/CIAT/IDB (2016), Revenue Statistics in Latin America and the Caribbean 2016, OECD
Publishing, Paris. DOI: http://dx.doi.org/10.1787/rev_lat_car-2016-en-fr
World Economic Forum. 2014. The Global Competitiveness Report 2015–2016, Geneva: World Economic
Forum.
World Bank (2014), “Honduras—Social Expenditures and Institutional Review.” Public Expenditure
Review, Report 95648-HN, World Bank, Washington, DC.
World Bank (2014), Growth Volatility in Paraguay Sources, Effects, & Options.
2
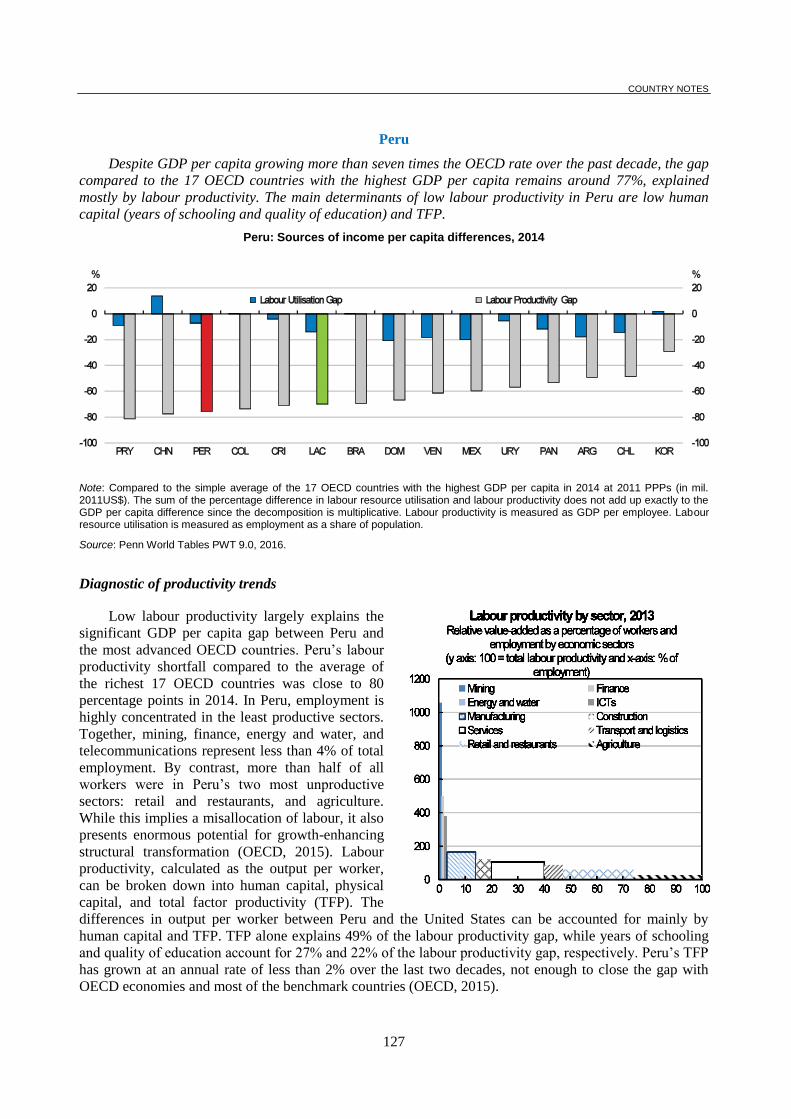
COUNTRY NOTES
127
Peru
Despite GDP per capita growing more than seven times the OECD rate over the past decade, the gap
compared to the 17 OECD countries with the highest GDP per capita remains around 77%, explained
mostly by labour productivity. The main determinants of low labour productivity in Peru are low human
capital (years of schooling and quality of education) and TFP.
Peru: Sources of income per capita differences, 2014
Note: Compared to the simple average of the 17 OECD countries with the highest GDP per capita in 2014 at 2011 PPPs (in mil. 2011US$). The sum of the percentage difference in labour resource utilisation and labour productivity does not add up exactly to the GDP per capita difference since the decomposition is multiplicative. Labour productivity is measured as GDP per employee. Labour resource utilisation is measured as employment as a share of population.
Source: Penn World Tables PWT 9.0, 2016.
Diagnostic of productivity trends
Low labour productivity largely explains the
significant GDP per capita gap between Peru and
the most advanced OECD countries. Peru’s labour
productivity shortfall compared to the average of
the richest 17 OECD countries was close to 80
percentage points in 2014. In Peru, employment is
highly concentrated in the least productive sectors.
Together, mining, finance, energy and water, and
telecommunications represent less than 4% of total
employment. By contrast, more than half of all
workers were in Peru’s two most unproductive
sectors: retail and restaurants, and agriculture.
While this implies a misallocation of labour, it also
presents enormous potential for growth-enhancing
structural transformation (OECD, 2015). Labour
productivity, calculated as the output per worker,
can be broken down into human capital, physical
capital, and total factor productivity (TFP). The
differences in output per worker between Peru and the United States can be accounted for mainly by
human capital and TFP. TFP alone explains 49% of the labour productivity gap, while years of schooling
and quality of education account for 27% and 22% of the labour productivity gap, respectively. Peru’s TFP
has grown at an annual rate of less than 2% over the last two decades, not enough to close the gap with
OECD economies and most of the benchmark countries (OECD, 2015).
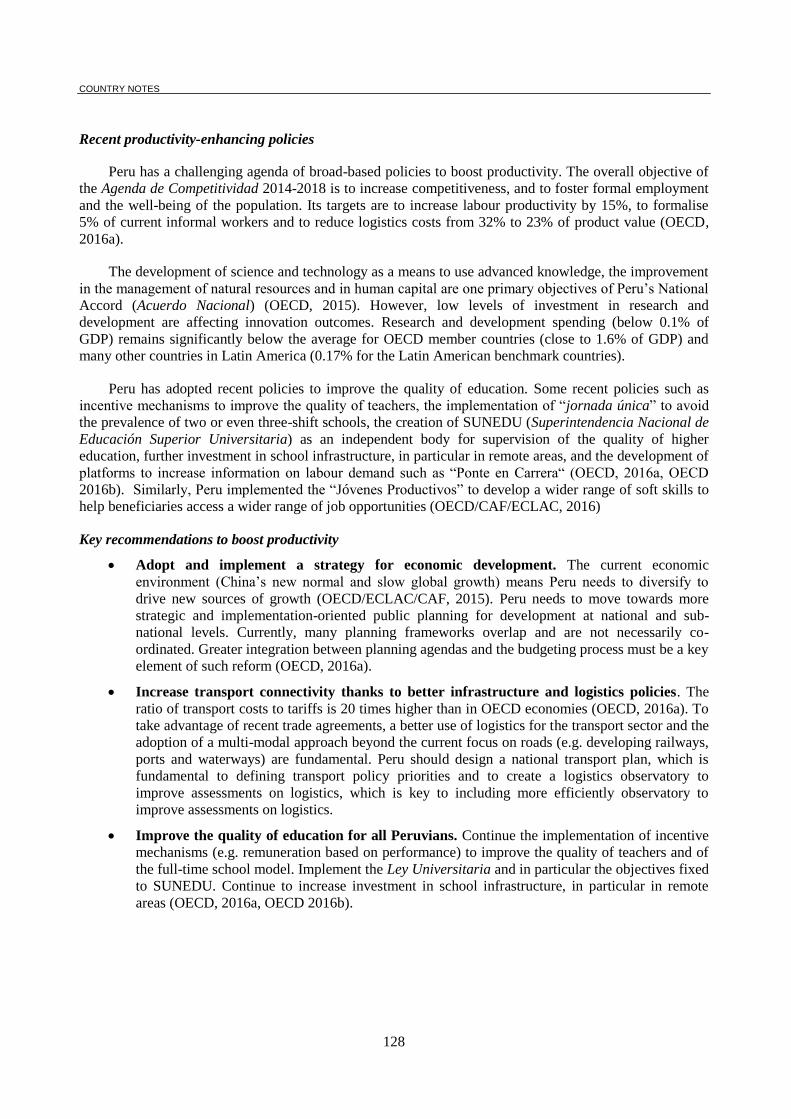
COUNTRY NOTES
128
Recent productivity-enhancing policies
Peru has a challenging agenda of broad-based policies to boost productivity. The overall objective of
the Agenda de Competitividad 2014-2018 is to increase competitiveness, and to foster formal employment
and the well-being of the population. Its targets are to increase labour productivity by 15%, to formalise
5% of current informal workers and to reduce logistics costs from 32% to 23% of product value (OECD,
2016a).
The development of science and technology as a means to use advanced knowledge, the improvement
in the management of natural resources and in human capital are one primary objectives of Peru’s National
Accord (Acuerdo Nacional) (OECD, 2015). However, low levels of investment in research and
development are affecting innovation outcomes. Research and development spending (below 0.1% of
GDP) remains significantly below the average for OECD member countries (close to 1.6% of GDP) and
many other countries in Latin America (0.17% for the Latin American benchmark countries).
Peru has adopted recent policies to improve the quality of education. Some recent policies such as
incentive mechanisms to improve the quality of teachers, the implementation of “jornada única” to avoid
the prevalence of two or even three-shift schools, the creation of SUNEDU (Superintendencia Nacional de
Educación Superior Universitaria) as an independent body for supervision of the quality of higher
education, further investment in school infrastructure, in particular in remote areas, and the development of
platforms to increase information on labour demand such as “Ponte en Carrera“ (OECD, 2016a, OECD
2016b). Similarly, Peru implemented the “Jóvenes Productivos” to develop a wider range of soft skills to
help beneficiaries access a wider range of job opportunities (OECD/CAF/ECLAC, 2016)
Key recommendations to boost productivity
Adopt and implement a strategy for economic development. The current economic
environment (China’s new normal and slow global growth) means Peru needs to diversify to
drive new sources of growth (OECD/ECLAC/CAF, 2015). Peru needs to move towards more
strategic and implementation-oriented public planning for development at national and sub-
national levels. Currently, many planning frameworks overlap and are not necessarily co-
ordinated. Greater integration between planning agendas and the budgeting process must be a key
element of such reform (OECD, 2016a).
Increase transport connectivity thanks to better infrastructure and logistics policies. The
ratio of transport costs to tariffs is 20 times higher than in OECD economies (OECD, 2016a). To
take advantage of recent trade agreements, a better use of logistics for the transport sector and the
adoption of a multi-modal approach beyond the current focus on roads (e.g. developing railways,
ports and waterways) are fundamental. Peru should design a national transport plan, which is
fundamental to defining transport policy priorities and to create a logistics observatory to
improve assessments on logistics, which is key to including more efficiently observatory to
improve assessments on logistics.
Improve the quality of education for all Peruvians. Continue the implementation of incentive
mechanisms (e.g. remuneration based on performance) to improve the quality of teachers and of
the full-time school model. Implement the Ley Universitaria and in particular the objectives fixed
to SUNEDU. Continue to increase investment in school infrastructure, in particular in remote
areas (OECD, 2016a, OECD 2016b).
COUNTRY NOTES
129
Improve the allocation of commodity-based transfers. They should target all regions in Peru
according to their socio-economic challenges. Sub-national authorities need to be supported with
further technical capacity to manage these resources and interact with civil society, academics
and the private sector to improve the allocation of these resources.
Implement a comprehensive tax reform: To finance broad-based policies affecting
productivity and to make a more fair and efficient taxation system, Peru should move towards a
comprehensive tax reform, increasing the share of direct taxes (thanks to personal income taxes).
Priorities for productivity and income – IDB
Peru
Jump
Probability
2012
Priorities Value 2012
(in
deviations)
Percentile
2012
Gap 2012
(in
deviations)
Required
Increase
(in
deviations)
Percentile
to Reach
Be like
Peru 0.0% Infrastructure -0.68 29 -1.78 1.000 54 Greece
Capital
Markets -1.05 21 -2.04 0.513 34 Colombia
Health -0.59 26 -1.62 0.500 35 Panama
According to the IDB’s methodology named Priorities for Productivity and Income (PPI), Peru, a
country that belongs to cluster 3, has as priorities Infrastructure, Capital Markets and Health. Its current
probability of jumping to cluster 4, corresponding to developed countries, is very low, partly because Peru
recently joined cluster 3 after its jump in 2012. To raise this probability to 75%, Peru should increase its
infrastructure from percentile 29 to 54 (resembling Greece), boost its capital markets from percentile 21 to
34 (similar to Colombia) and improve its health from percentile 26 to 35 (or resemble Panama).
REFERENCES
Céspedes, N., M. Aquile, A. Sanchez, and R. Tudela (2014), “Productividad y tratados de libre comercio a nivel
de empresas en Perú”, Working Papers, 2014-014, Banco Central de Reserva del Perú.
OECD (2015), Multi-dimensional Review of Peru: Volume I. Initial Assessment, OECD Development Pathways,
OECD Publishing, Paris. http://dx.doi.org/10.1787/9789264243279-en
OECD (2016a), Multi-dimensional Review of Peru: Volume 2. In-depth Analysis and Recommendations,
OECD Development Pathways, OECD Publishing, Paris. http://dx.doi.org/10.1787/9789264264670-en
OECD (2016b), DMoving towards a better education in Peruw, Making Development Happen, No. 3, OECD
Development Centre, OECD Publishing, Paris, www.oecd.org/dev/Avanzando-hacia-una-mejor-
educacion-en-Peru.pdf.
OECD/ECLAC/CAF (2015), Latin American Economic Outlook 2016: Towards a New Partnership with China,
OECD Publishing, Paris. http://dx.doi.org/10.1787/9789264246218-en
OECD/CAF/ECLAC (2016 forthcoming), Latin American Economic Outlook 2017: Youth, Skills and
entrepreneurship Development, OECD Publishing, Paris. DOI: http://dx.doi.org/10.1787/leo-2015-en
3
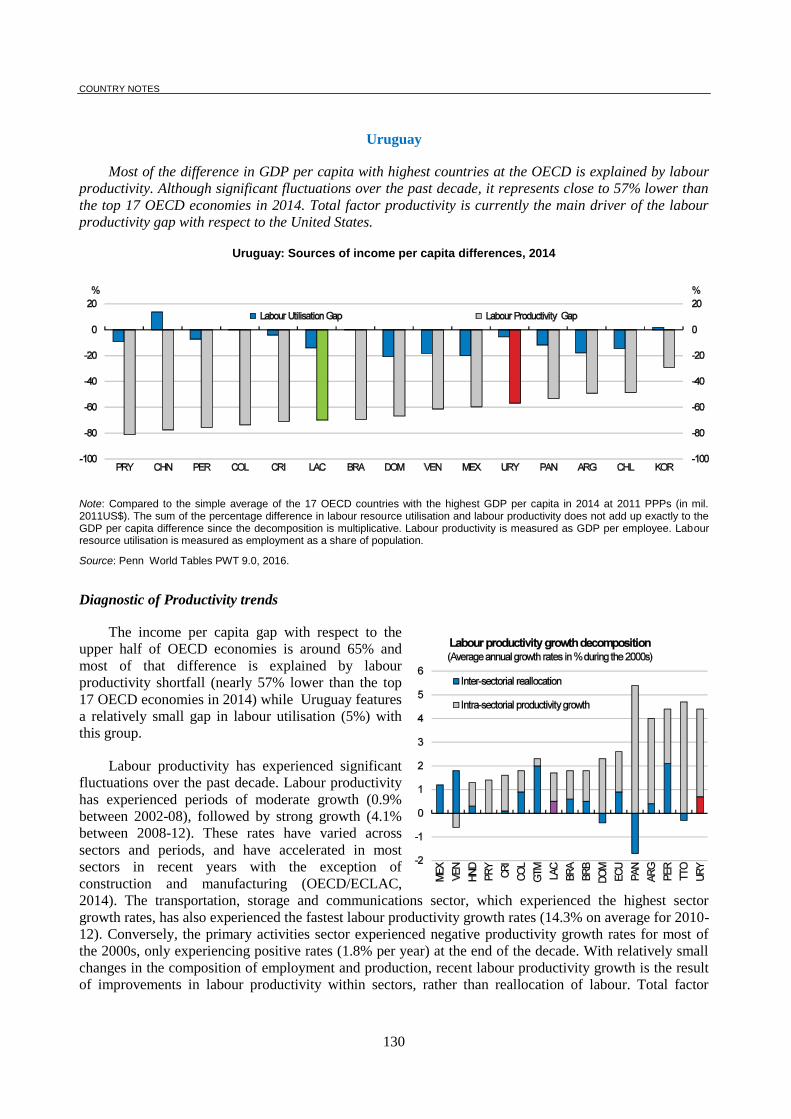
COUNTRY NOTES
130
Uruguay
Most of the difference in GDP per capita with highest countries at the OECD is explained by labour
productivity. Although significant fluctuations over the past decade, it represents close to 57% lower than
the top 17 OECD economies in 2014. Total factor productivity is currently the main driver of the labour
productivity gap with respect to the United States.
Uruguay: Sources of income per capita differences, 2014
Note: Compared to the simple average of the 17 OECD countries with the highest GDP per capita in 2014 at 2011 PPPs (in mil. 2011US$). The sum of the percentage difference in labour resource utilisation and labour productivity does not add up exactly to the GDP per capita difference since the decomposition is multiplicative. Labour productivity is measured as GDP per employee. Labour resource utilisation is measured as employment as a share of population.
Source: Penn World Tables PWT 9.0, 2016.
Diagnostic of Productivity trends
The income per capita gap with respect to the
upper half of OECD economies is around 65% and
most of that difference is explained by labour
productivity shortfall (nearly 57% lower than the top
17 OECD economies in 2014) while Uruguay features
a relatively small gap in labour utilisation (5%) with
this group.
Labour productivity has experienced significant
fluctuations over the past decade. Labour productivity
has experienced periods of moderate growth (0.9%
between 2002-08), followed by strong growth (4.1%
between 2008-12). These rates have varied across
sectors and periods, and have accelerated in most
sectors in recent years with the exception of
construction and manufacturing (OECD/ECLAC,
2014). The transportation, storage and communications sector, which experienced the highest sector
growth rates, has also experienced the fastest labour productivity growth rates (14.3% on average for 2010-
12). Conversely, the primary activities sector experienced negative productivity growth rates for most of
the 2000s, only experiencing positive rates (1.8% per year) at the end of the decade. With relatively small
changes in the composition of employment and production, recent labour productivity growth is the result
of improvements in labour productivity within sectors, rather than reallocation of labour. Total factor
COUNTRY NOTES
131
productivity (TFP) is currently the main driver of the labour productivity gap with respect to more
developed economies (e.g. the United States), accounting for around 57% of the labour productivity gap.
Physical capital contributes around 31% and human capital the remaining 12% (after controlling for
quality of education using PISA data) (OECD/CEPAL, 2014).
Recent productivity-enhancing policies
Uruguay’s agenda to strengthen productivity is embodied in the (still under discussion) creation of
the National Competitiveness System (SNC). The SNC aims to strengthen Uruguay’s systemic
competitiveness and productivity by improve government’s coordination capacities. The SNC will be in
charge of co-ordinating several institutional bodies and integrating their activities into a long-term, over-
arching strategy, with the aim of designing, implementing and evaluating programmes for productive
transformation. Together with the Competitiveness Cabinet, the system includes several agencies (ANII,
ANDE, Uruguay XXI, INEFOP, INACOOP, CND, INIA, and National System to address Climate
Change).
Uruguay has made considerable efforts in several productivity-linked areas including reforms in the
education and skills sectors (e.g. creation of the Technological University – UTEC), the support of
innovation initiatives (e.g. the National Agency for Research and Innovation (ANII), the Technological
Laboratory for Uruguay –LATU), the support of foreign trade (e.g. Special Economic Zones), and the
implementation of the Public-Private Partnership (PPP) law to develop infrastructure. The areas of human
capital development, infrastructure and international integration are key for Uruguay’s productivity
agenda.
Key recommendations to boost productivity
Strengthen support systems for less performing students. Improve the conditions of teaching,
increasing the autonomy of schools and facilitating mobility in higher education (OECD, 2016,
OECD/CAF/ECLAC, 2014, 2016).
Improve the provision of skills. Take advantage of the recently-created UTEC (Technological
University) to better match higher education provision with employers’ needs and decentralise
the supply of tertiary education. UTEC must offer relevant and up-to-date curricula, and promote
innovation in the study process, preserving a more technical, labour market-oriented character.
Create a National Transport Plan and re-organise the governance of infrastructure. This
involves the creation of an institution responsible for reporting performance indicators on
infrastructure projects and designing a proper regulatory framework for all actors involved in the
infrastructure sector (OECD, 2016).
Ensure that PPP (public-private partnerships) projects are part of both the national and sub-
national budgets and establish clear regulations for PPP contract renegotiation.
Deepen engagement in trade and investment. This involves the revision of rules of origin and
other flexibilities, adapting regional trade agreements to include disciplines such as the
international movement of skills, and protection of knowledge and technology)
(OECD/CAF/ECLAC, 2015).
Take advantages of any flexibility within Mercosur, to diversify markets and forge new
agreements with other partners, particularly in services.
Improve its Bilateral Investment Treaties (BITs) drawing on the most progressive agreements
to attract foreign investment.
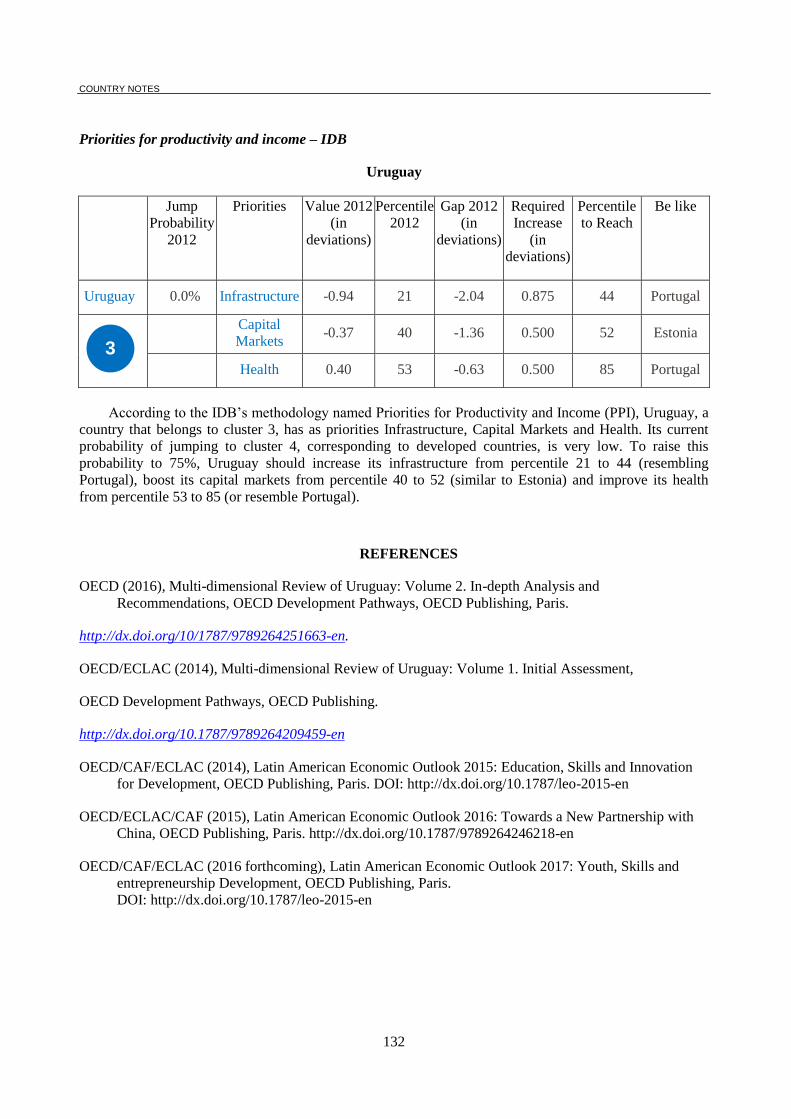
COUNTRY NOTES
132
Priorities for productivity and income – IDB
Uruguay
Jump
Probability
2012
Priorities Value 2012
(in
deviations)
Percentile
2012
Gap 2012
(in
deviations)
Required
Increase
(in
deviations)
Percentile
to Reach
Be like
Uruguay 0.0% Infrastructure -0.94 21 -2.04 0.875 44 Portugal
Capital
Markets -0.37 40 -1.36 0.500 52 Estonia
Health 0.40 53 -0.63 0.500 85 Portugal
According to the IDB’s methodology named Priorities for Productivity and Income (PPI), Uruguay, a
country that belongs to cluster 3, has as priorities Infrastructure, Capital Markets and Health. Its current
probability of jumping to cluster 4, corresponding to developed countries, is very low. To raise this
probability to 75%, Uruguay should increase its infrastructure from percentile 21 to 44 (resembling
Portugal), boost its capital markets from percentile 40 to 52 (similar to Estonia) and improve its health
from percentile 53 to 85 (or resemble Portugal).
REFERENCES
OECD (2016), Multi-dimensional Review of Uruguay: Volume 2. In-depth Analysis and
Recommendations, OECD Development Pathways, OECD Publishing, Paris.
http://dx.doi.org/10/1787/9789264251663-en.
OECD/ECLAC (2014), Multi-dimensional Review of Uruguay: Volume 1. Initial Assessment,
OECD Development Pathways, OECD Publishing.
http://dx.doi.org/10.1787/9789264209459-en
OECD/CAF/ECLAC (2014), Latin American Economic Outlook 2015: Education, Skills and Innovation
for Development, OECD Publishing, Paris. DOI: http://dx.doi.org/10.1787/leo-2015-en
OECD/ECLAC/CAF (2015), Latin American Economic Outlook 2016: Towards a New Partnership with
China, OECD Publishing, Paris. http://dx.doi.org/10.1787/9789264246218-en
OECD/CAF/ECLAC (2016 forthcoming), Latin American Economic Outlook 2017: Youth, Skills and
entrepreneurship Development, OECD Publishing, Paris.
DOI: http://dx.doi.org/10.1787/leo-2015-en
3


![the all-inclusive resort experience - Interval International · Interest in Alternative Vacations ALL-INCLUSIVE RESORT LATIN AMERICA CRUISE LATIN AMERICA ASIA/PACIFIC AUSTRALIA] NEW](https://img.pdfslide.us/doc/110x75/60f8245eb3d2a06d2810608d/the-all-inclusive-resort-experience-interval-international-interest-in-alternative.jpg)