Embed Size (px)
Citation preview

Boom, Bust, KABOOM?
Prospects for Physician
Resources in Canada
Town Hall Meeting
Faculty of Medicine
Dalhousie University
Halifax, NS
December 15, 2012
Owen Adams
Vice-President, Policy & Research
Boom, Bust, Kaboom.ppt
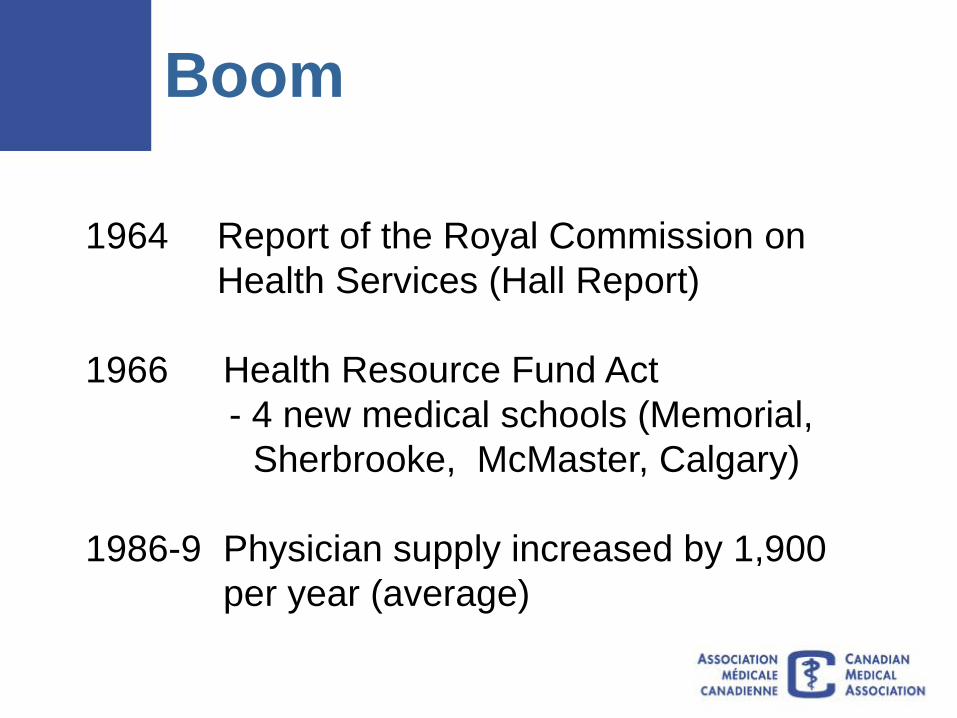
Boom
1964 Report of the Royal Commission on
Health Services (Hall Report)
1966 Health Resource Fund Act
- 4 new medical schools (Memorial,
Sherbrooke, McMaster, Calgary)
1986-9 Physician supply increased by 1,900
per year (average)

Bust
1992 Health Ministers agree to cut enrolment by 10%
(post-Barer-Stoddart)
1992 Shift to two-year prelicensure
1996 Net loss of 508 physicians to migration
1993-96 Net declines in physician supply each year
1995 Shortages emerge in medium-size cities

KABOOM?
1999 Canadian Medical Forum calls for 2,000 1st-year
enrolment places by 2000
2001 Northern Ontario School of Medicine announced
1997- 2011 1st-year enrolment increased by 79% compared to 14%
population growth
2004-12 Net gains to migration each year
Ongoing Expanded roles for non-MD clinicians (e.g., NPs and
pharmacists) and new roles (Physician Assistants)
Emerging Evidence of employment challenges for new certificants

Projected Physician Supply Status quo from 1999 and 2012
Source: 1999 and 2012 CMA Physician Resource Evaluation
Template
1.0
1.2
1.4
1.6
1.8
2.0
2.2
2.4
2.6
19
99
20
01
20
03
20
05
20
07
20
09
20
11
20
13
20
15
20
17
20
19
20
21
20
23
20
25
20
27
20
29
Ph
ys p
er
1000 p
op
n
2012 status quo 1999 status quo

Physician Demographics in 2012-2030
Cohort 2012 2020 2030
Female 36.5% 43.5% 50.3%
FPs 51.9% 52.0% 51.4%
55+ 37.2% 37.8% 34.6%
Boomer (1946-64) 48.8% 34.4% 16.0%
Gen X (1965-74) 26.2% 23.5% 18.6%
Gen Y (1975-95) 13.9% 38.7% 52.0%
Selected physician demographics 2012-2030, Canada

IMGs as a percentage of all physicians,
2012
34%
41%
Source: 2012 CMA Masterfile
21%
29% 26%
10%
26%
30% 54% 29% 28%
13% 18%
Overall: 24%

Key Findings: PTMA Survey,
February 2012
All jurisdictions have an ongoing challenge in
recruiting family physicians to rural and remote
communities
To the degree that newly certified specialists are
having difficulty finding positions this is mainly
occurring among surgical subspecialties such as
cardiac surgery and orthopedics and is mainly the
result (particularly in orthopedics) of hospital
infrastructure shortages (especially OR time) and
not because of insufficient demand.

General Observations
To this day, only Quebec, PEI and NB have had a long-term
physician resource plan in place and NS launched in Spring,
2012.
Ontario is the first jurisdiction to have developed a supply and
needs-based projection model. They are in the process of re-
running the base model.
Generally few observations offered on the mix of post-MD
positions.
Most PT governments maintain a web-based listing of
available physician positions (both FP and specialist)
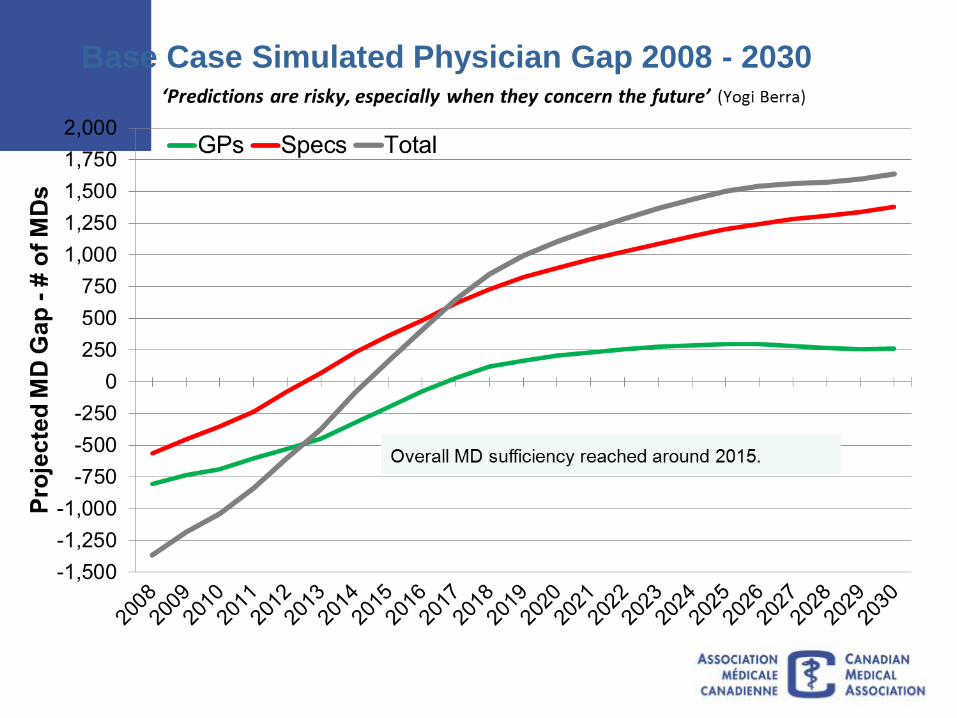
Base Case Simulated Physician Gap 2008 - 2030
Kingston, Ontario
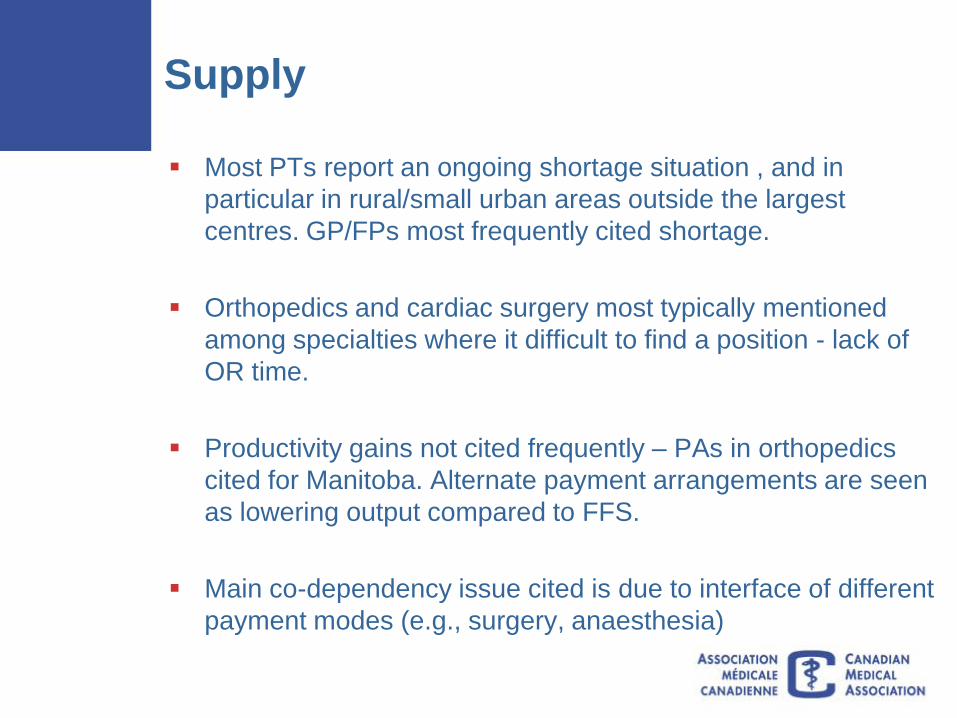
Supply
Most PTs report an ongoing shortage situation , and in
particular in rural/small urban areas outside the largest
centres. GP/FPs most frequently cited shortage.
Orthopedics and cardiac surgery most typically mentioned
among specialties where it difficult to find a position - lack of
OR time.
Productivity gains not cited frequently – PAs in orthopedics
cited for Manitoba. Alternate payment arrangements are seen
as lowering output compared to FFS.
Main co-dependency issue cited is due to interface of different
payment modes (e.g., surgery, anaesthesia)

Supply (Continued)
The newer cohorts of graduates do not put in the same hours
as their forebears. Retiring physicians tend to have much
larger practices than newer grads are willing to take on.
FFS tends to be associated with higher volume/output than
alternate forms of payment.
Most jurisdictions continue to rely on IMGs. It is mainly
Saskatchewan and Newfoundland that rely on recruiting them
directly to practice.

Access to Family Physicians
All jurisdictions have a number of residents without a family physician. These
range from 10-15% of Yukon’s population to 8-12K in PEI to 700K in AB and
800K in Ontario
However, not all persons without a FP are looking for one.
Both Ontario and BC report success in promoting a resurgence in
comprehensive family practice through new models/incentives.
Several jurisdictions pinpoint specific populations in need of family physicians
e.g., addicts, homeless persons, Aboriginal persons, immigrants, rural
populations, student populations in urban areas, HIV population.
Functional specialty in family medicine is not perceived to be a full-time
endeavour but done on the side

Other Issues
There remains limited opportunity for re-training.
The Agreement on International Trade is not yet perceived as having
an impact on mobility but there is concern that it might. (NWT has
just adopted a regulation to come into compliance).
Most jurisdictions now offer a retention bonus but they are not large.
In general a surge of retirements is not anticipated. Physicians
generally gradually diminish their activities. Moreover the stock
market has been functioning as a retention factor.
Presently there are no hard or soft caps on physician services
budgets.
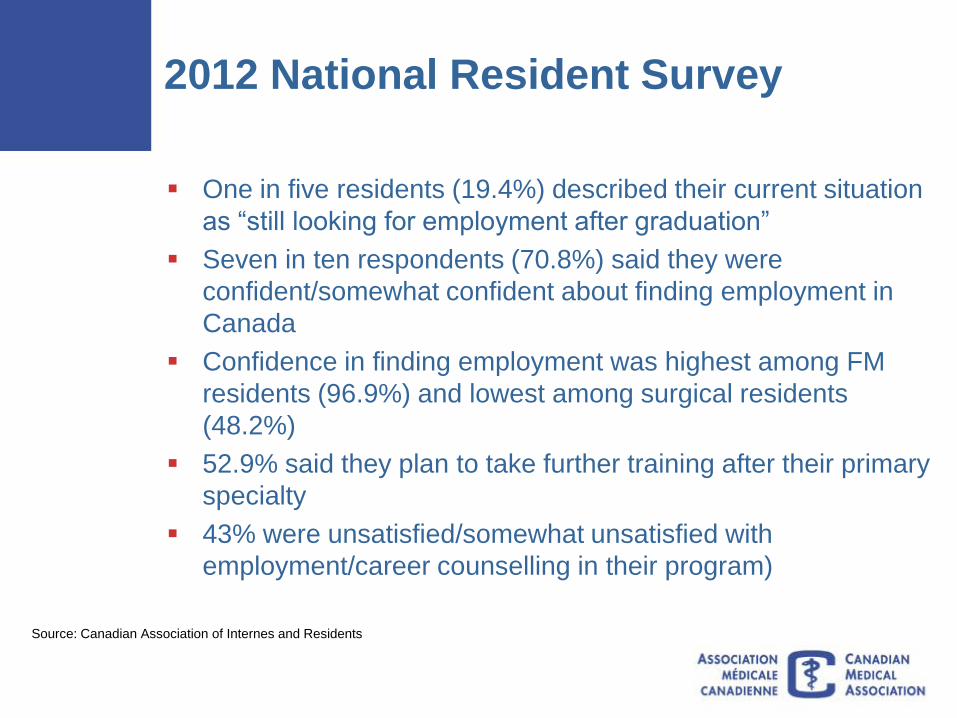
2012 National Resident Survey
One in five residents (19.4%) described their current situation
as “still looking for employment after graduation”
Seven in ten respondents (70.8%) said they were
confident/somewhat confident about finding employment in
Canada
Confidence in finding employment was highest among FM
residents (96.9%) and lowest among surgical residents
(48.2%)
52.9% said they plan to take further training after their primary
specialty
43% were unsatisfied/somewhat unsatisfied with
employment/career counselling in their program)
Source: Canadian Association of Internes and Residents

Key Question
To the degree that there is a
supply imbalance is it due to
lack of need/demand or lack of
human/physical infrastructure?

18 18
Wait Times for Elective Surgery and
Specialist Appointments
Percent AUS CAN FR GER NETH NZ NOR SWE SWIZ UK US
Specialist appointment*
Less than
4 weeks 54 41 53 83 70 61 50 45 82 72 80
2 months
or more 28 41 28 7 16 22 34 31 5 19 9
Elective surgery**
Less than
1 month 53 35 46 78 59 54 44 34 55 59 68
4 months
or more 18 25 7 0 5 8 21 22 7 21 7
* Base: Needed to see specialist in past 2 years.
** Base: Needed elective surgery in past 2 years.
Source: 2010 Commonwealth Fund International Health Policy Survey in Eleven Countries.

MD Graduates and R-1 Trainees:
Canada and the U.S., 2011
MD R-1 Ratio R-1:
Graduates Trainees* Grads
Canada1 2,573 3,049 1.2:1
U.S.2,3 17,446 26,292 1.5:1
*Refers to program year 1
Sources: 1 Association of Faculties of Medicine of Canada. Canadian Medical Education Statistics,
2010 and 2011-2012 CAPER Census of Post MD Trainees
2 Barzansky B, Etzel S. JAMA Dec. 5,2012 – Vol 308 #21,2259-63
3 Brotherton S, Etzel S. JAMA Dec. 5, 2012 – Vol 308 #21,2264-79

Selected Field of Post-MD Training:
Ministry-Funded Trainees, 1991 and
2011
Selected Field #1991 #2011 % Change
FM Care of Elderly 3 9 200
Anaesthesia 334 642 92
Geriatric Medicine 18 24 33
Pediatrics 324 546 69
Psychiatry 438 789 80
Anotomical Pathology 112 213 90
CVT Surgery 35 50 54
General Surgery 425 578 39
Neurosurgery 69 106 54
Orthopaedic Surgery 198 423 114
Total (all fields) 6,471 11,508 78


CMA Canadian Collaborative Centre
for Physician Resources -
www.cma.ca/c3pr
National Physician Survey (CFPC,
CMA, RCPSC)
www.nationalphysiciansurvey.ca
Thank You!