Embed Size (px)
Citation preview

AN ANALYSIS OF THE EFFECTS OF VARIOUS COMPOUNDS ON ALCOHOL
AND HIGH-FAT-DIET-INDUCED STEATOSIS IN RATS AND MICE
by
BONNIE NOLAN
A dissertation submitted to the Graduate School-New Brunswick
Rutgers, The State University of New Jersey
And
The Graduate School of Biomedical Sciences
University of Medicine and Dentistry of New Jersey
In partial fulfillment of the requirements
For the degree of
Doctor of Philosophy
Graduate Program in
Neuroscience
Written under the Direction of
George C. Wagner, PhD
And approved by
___________________
___________________
___________________
___________________
New Brunswick, New Jersey
January, 2009
ii
ABSTRACT OF THE DISSERTATION
AN ANALYSIS OF THE EFFECTS OF VARIOUS COMPOUNDS ON ALCOHOL
AND HIGH-FAT-DIET-INDUCED STEATOSIS IN RATS AND MICE
By BONNIE NOLAN
Dissertation Director:
George C. Wagner, PhD
Excessive alcohol consumption is known to result in fatty liver, or steatosis. A high-fat,
low-carbohydrate diet also results in fatty liver. Furthermore, fatty liver is known to
precede cirrhosis in both animals and humans, and cirrhosis precedes primary
hepatocellular carcinoma in humans. A series of studies was first undertaken to
determine whether exercise and/or certain dietary manipulations could affect fatty liver.
Long-Evans rats were given either a high-fat, low-carbohydrate or a high-carbohydrate,
low-fat version of liquid diet with or without alcohol. Livers were analyzed for fat and
measures of carbohydrate metabolism in liver and plasma were taken, as well as blood
glucose alcohol concentrations. Next, added exercise (run wheel), caffeine, antioxidants
such as Vitamin E, diphenyl-para-phenylene diamine (DPPD), and selenium were
examined as were the dietary additives cranberry powder and soy protein. Finally, based
on ambiguous results involving each agent separately, caffeine and DPPD were
combined. Following the conclusion of rat studies, C57BL6 mice were given a modified
version of the Leiber-deCarli liquid diet with alcohol. The calorie manipulation

iii
described above was repeated in mice to determine whether alcohol-induced fatty liver
would be exacerbated in the presence of a high-fat diet. Subsequently, the dietary
additives Vitamin E, DPPD and Trolox were added. Striatum was taken for HPLC, and
livers were taken for liver fat analysis and malondialdehyde (MDA) assay (as a measure
of oxidative stress) respectively. Finally, an experiment was undertaken to determine a
time course for withdrawal seizures in mice.
In rats, differences in liver glycogen did not account for differences in liver fat. Exercise
and caffeine both resulted in significant changes in weight gain, and while combined they
appeared to reduce alcohol-induced fatty liver, the effect was not significant. Separately,
no protective properties of either exercise or caffeine were observed. Vitamin E and
selenium were found to exacerbate alcohol-induced fatty liver, while DPPD did not.
Neither cranberry powder nor soy protein affected alcohol-induced fatty liver. DPPD
combined with caffeine reduced alcohol-induced fatty liver significantly (p<0.05).
Adult mice were able to tolerate 4.5% ethanol in a high-fat liquid diet. The high-fat diet
resulted in liver fat values significantly higher than high-carbohydrate when combined
with alcohol. Vitamin E appeared to exacerbate fatty liver in mice, but differences were
not significant. There were significant differences in oxidative stress; Vitamin E and
Trolox reduced MDA significantly over diet plus alcohol alone. All animals experienced
withdrawal seizures between 3 and 5 hours after removal of alcohol. There were
significant differences in serotonin turnover (5HIAA/5HT) in animals fed a high-fat diet
without alcohol vs. chow controls.

iv
Acknowledgements:
I would like to express my sincerest appreciation to George C. Wagner, for his guidance,
wisdom, respect and patience.
I would also like to extend thanks to the members of my Dissertation Committee. Hans
Fisher has been incredibly helpful and endlessly knowledgeable. Alexander Kusnecov
has always contributed with productive research ideas and guidance, and his expertise in
immunology has prompted interest in several new areas of research related to this
dissertation. Joseph V. Martin has a vast knowledge of the systems discussed in this
work; this has been of enormous benefit, as has his editing diligence.
My sincere appreciation extends also to the members of my laboratory, particularly
Michelle Jobes, for her warm friendship, and Chris Medviecki, who was instrumental in
the completion of the final mouse studies.
I would like to thank my family; my husband Jim has been so supportive throughout this
process, and my children, Jimmy and Billy, have provided motivation to work in a way
that inspires pride.
I must also thank my mother, Donna Young, who taught me how to work while everyone
else is asleep, and also to be kind to myself.
This dissertation is dedicated to my father, Charles Robert Raymond, whose life and
death has shown many people, but most of all his children, that very valuable and
beloved people will benefit if alcoholic liver disease is conquered.

v
Table of Contents
Abstract of the Dissertation ii Acknowledgements iii List of Tables v List of Illustrations vi Introduction 1 Chapter 1: Effects of Dietary Caffeine 4 and Alcohol on Liver Carbohydrate Chapter 2:Analysis of Dietary Additives: 22 High Vitamin E and Selenium Elevate, whereas diphenyl-para-phenylenediamine (DPPD) Plus Caffeine Lowers Liver Fat in Alcohol-fed Rats
Chapter 3: A Mouse Model for 37 Alcohol-Induced Steatosis using Ethanol in a High-Fat Liquid Diet Conclusion and Future Directions 50 References 52
Figures 61 Captions 69 Curriculum Vita 70

vi
List of Tables
Table 1: Differences in body weight, blood glucose, liver weight 15 and liver fat between rats fed a high-fat vs. high carbohydrate diet with or without ethanol. Table 2: Differences in food and alcohol intake, liver fat, and 17 liver metabolites in rats fed caffeine and ethanol with or without runwheel. Table 3: Differences in food and alcohol consumed, 19 weight gain and serum leptin in rats fed caffeine plus ethanol for varying time periods. Table 4: Differences in liver fat values in rats fed Vitamin E 29 with or without ethanol vs. no Vitamin E. Table 5: Differences in liver fat between rats fed DPPD, 30 Vitamin E, or Selenium with ethanol. Table 6: Differences in liver fat values between rats fed 31 DPPD+caffeine, Cranberry powder, or soy powder with ethanol. Table 7: Differences in liver fat between rats fed DPPD, 32 caffeine, or both with ethanol. Table 8: Description of various treatments administered to mice. 42 Table 9: Chart of withdrawal seizure scoring. 44 Table 10: Differences in liver fat between mice 45 fed a high-fat vs. high-carbohydrate diet with or without ethanol. Table 11: Differences in liver fat in mice fed one of two 46 Types of Vitamin E or DPPD plus ethanol. Table 12: Differences in liver fat between developing 47 mice fed high-fat diet with or without alcohol.

vii
List of Illustrations
Figure 1: Comparison of liver metabolites in rats fed 61 a high-fat vs. high carbohydrate diet with or without ethanol. Figure 2: Epididymal fat pad weight, liver glycogen 62 liver glucose and liver fat of groups of rats maintained on control diets and ethanol-containing diets with or without caffeine for 2–12 weeks. Figure 3: Comparison of liver fat in between mice 63 fed high-fat, low-carbohydrate vs. high-carbohydrate, low fat liquid diet with 4% ethanol. Figure 4: Comparison of striatal neurochemistry between mice fed 64 alcohol vs. no ethanol. Figure 5: Comparison of MDA as a measure of 65 oxidative stress in mice fed ethanol plus various antioxidants. Figure 6: Comparison of neurochemistry between developing 66 mice fed ethanol vs. no ethanol. Figure 7: Comparison of neurochemistry between developing 67 mice fed ethanol vs. no ethanol; neurotransmitter chemistry turnover. Figure 8: Comparison of liver fat, liver weight, body weight 68 and liver fat as a percentage of body weight in developing mice fed ethanol.

1
Introduction
Liver Fat and Ethanol
Liver fat accumulation, or steatosis, appears to precede alcoholic liver disease including
fibrosis and necrosis leading to cirrhosis (Leiber, et al. 1965; Kourourian, et al. 1999).
The underlying mechanism of lipid accumulation in the liver remains unclear, and is
probably multifactorial. A study by You and Crabb (2004) showed that sterol-regulatory
element binding proteins (SREBP), which regulate cholesterol and fatty acid synthesis by
activation of more than 30 genes in the liver and are activated by ethanol, are probably
implicated; previous studies by the same group showed that acetaldehyde is required for
this effect. However, these studies were conducted using a low-fat, balanced liquid diet.
Previous work by Fisher, at al. (2002) shows that a high-fat, low carbohydrate diet
without alcohol results in steatosis in rats similar to that of rats consuming a high-
carbohydrate, low-fat diet with alcohol. Therefore, while the SREBP mechanism may
seem clear in the You and Crabb study, there are more factors and perhaps separate
mechanisms likely at work in human alcoholic steatosis. Jeong, et al. demonstrated that
hepatic endocannabinoids and their receptors (CB1) mediate ethanol induced steatosis by
increasing lipogenesis and decreasing fatty acid oxidation. Again, a low-fat diet was
used. Moon, et al (2008) fed a high-fat pellet diet to ob/ob mice and concluded that this
resulted in increases in hepatic steatosis. The increase in liver fat was completely
ameliorated by adding conjugated linoleic acids coupled to polyethylene glycol. The
group postulates that the beneficial effects were a result of a reduction of lipid
accumulation throughout the animal and an attenuation of insulin resistance.

2
Sozio and Crabb (2008) highlight a variety of recently investigated mechanisms for the
accumulation of liver fat, demonstrating a multifactorial syndrome that involves both a
failure to clear lipids through oxidation and transport and an increase in lipogenesis.
With regard to oxidation and transport, inhibition of peroxisome proliferator-activated
receptor-α (PPAR-α) causes a reduction of PPARα target enzymes. This results in
inhibition of microsomal triglyceride transfer protein (MTP) (transport), reduction in
fatty acid oxidation, and apoptosis. Ethanol also upregulates homocycteine, which leads
to an endoplasmic reticulum stress response. This leads to (a) upregulation of pro-
apoptotic gene expression resulting in apoptosis, and (b) upregulated SREBP-1, causing
an upregulation of lipogenic enzyme gene expression and increased lipogenesis, which
will be explained in more detail in the discussion. Finally, ethanol results in a down-
regulation of AMP-activated protein kinase (AMPK), leading to an upregulation of
acetyl-CoA carboxylase, which leads to upregulation of malonyl CoA, which is both a
precursor for synthesis of fatty acids and an inhibitor of carnitine palitoyltransferase, the
rate limiting enzyme for fatty acid oxidation. Therefore, the ethanol-induced
downregulation of AMPK results in both an increase in fatty acid synthesis and a
decrease in fatty acid oxidation. The three pathways are simplified here: (Sozio, Crabb
2008).
1. EtOH→↓PPARα→↓PPARα target enzymes→
2. EtOH→↑Homocysteine→↑ERStress Response→
3. EtOH→↓AMPK→ ↑acetyl-CoA carboxylase→↑ACC→↑Malonyl CoA→
→↓MTP→↓fatty acid transport →↓fatty acid oxidation →↑apoptosis
↑Pro-Apoptotic gene expression→↑Apoptosisis ↑SREBP-1→↑Lipogenic gene
expression→
↑fatty acid synthesis ↓β-oxidation

3
Steatosis resulting from excessive alcohol consumption and a high-fat diet is reversible.
However, continued consumption results in cirrhosis and necrosis in rodents and liver
failure in humans (Leiber, C.S. 1966). Cell death results from oxidative stress following
steatosis. If steatosis could be prevented or reduced, subsequent liver damage could be
minimized. By systematically modifying the constituents of a nutritionally-balanced
ethanol-containing liquid diet developed by Lieber et al. (1965) it has been possible to
investigate the influences of dietary calorie source on toxic effects of chronic ethanol
intake.
4
I. Effects of Dietary Caffeine and Alcohol on Liver Carbohydrate and Fat Metabolism in Rats High-carbohydrate vs. High-fat
Ethanol-induced accumulation of excessive liver fat was reduced by diets rich in
carbohydrate as compared to diets low in carbohydrate but high in fat (Martin, et al.
2002; Fisher, et al. 1996; Fisher, et al. 1997; Guthrie, et al. 1990; Kourourian, et al. 1999)
see (Tsukomoto, et al, 1996; French, et al. 1993). In addition, blood ethanol of animals
receiving the high-fat diet with ethanol was elevated over those receiving the low-fat
(high-carbohydrate) diet with ethanol. It was hypothesized that the observed effects on
liver fat were perhaps due to an influence of different nutrients on the gastric absorption
of ethanol. This was tested by an acute intraperitoneal injection of ethanol, which
resulted in higher blood alcohol in animals given a high-fat ethanol-free diet as compared
to a group maintained on the high-carbohydrate ethanol-free diet (Fisher, et al. 2002).
These results suggest that the effect of diet on ethanol levels is not likely to be due to an
influence on gastric absorption of ethanol. Lieber, et al. (1997) reported an induction of
CYP2E1 by chronic alcohol which could result in reduced blood alcohol over time, but
this is unlikely to explain the effect of the ethanol-free diet composition on circulating
level of ethanol seen only 2 hours following a single injection of alcohol.
Yoo, et al. demonstrated that unsaturated fatty acids (UFA) result in a 2-4 fold linear
increase (based first on 25% of calories as UFA and then 45%) in CYP2E1 induction in
the absence of alcohol. However, Kourourian, et al. (1999) demonstrated that while a
diet high in ethanol and balanced in carbohydrate (using the standard TEN diet) resulted
in a 3- to 9-fold increase in CYP2E1, the number increased to 27- to -34 fold when

5
carbohydrates were reduced to below 10% of total calorie intake. This difference is
therefore not likely explained by the increase in UFA, but rather a change in
carbohydrate-mediated suppression of the P450.
Further studies (Fisher, et al. 2002) showed that switching from a high-fat, low-
carbohydrate diet with ethanol to a high-carbohydrate, low-fat diet with ethanol
maintained high levels of ethanol intake (as compared to a group which was kept on the
high-fat plus ethanol diet throughout).
However, switching to the carbohydrate plus ethanol diet for the same time period
significantly lowered the level of liver fat as compared to the group maintained on the
high-fat plus ethanol diet. These studies suggest that the observed reduction in liver fat in
rats on a high-carbohydrate diet, which is accompanied by a decrease in blood alcohol
level, might be in part due to a diet-related alteration in liver carbohydrate metabolism.
There have been several reports of an influence of ethanol on carbohydrate metabolism in
rats (Walker, et al. 1970; Winston, et al. 1984; 1981; Van Horn, et al. 2001; Kisclevski, et
al. 2003; Nanji, et al. 1995). Walker and Gordon (1970) found a profound depletion of
liver glycogen following chronic ethanol feeding. Winston, et al. (1981, 1984) report that
chronic ethanol consumption does not increase glycogen phosphorylase activity, which
would increase the metabolism of existing glycogen, but instead has been shown to
reduce levels of the enzyme glycogen synthase (Van Horn, et al. 2001), resulting in a
reduction in the synthesis of glycogen. Chronic alcohol also decreases glucose
transporter levels and activity (Van Horn, et al. 2001; Nanji, et al. 1995). Chronic
feeding of ethanol to rats has been found to decrease measures of glycolytic as compared
to gluconeogenic enzyme activity (Duruibe et al. 1981; Baio et al. 1998). Together, these
6
findings suggest qualitative differences in the utilization of nutrients and the nature of
energy metabolism (Martin, et al. 2004).
Caffeine
Caffeine exerts numerous influences on metabolism in addition to a well-known effect as
a CNS stimulant. The drug elevates circulating fatty acids in exercising rats and, at the
end of exercise, increases plasma glucose (Demadai B.S. 1994). Caffeine has a well-
described inhibitory influence on activity of phosphorylase a (Kasvinsky et al. 1978;
Fletterick et al. 1980) the phosphorylated (active) form of the enzyme. Glucose inhibits
phosphorylase-a activity by a competitive interaction with the active site, and enhances
the binding of caffeine to the inhibitory site on the phosphorylase-a enzyme (Fletterick et
al. 1980; Madsen, et al. 1983). However, this effect of caffeine has not clearly been
demonstrated following orally administered caffeine (Martin et al. 1998; Ercan-Fang et
al. 2001). Systemic caffeine inhibits the secretion of leptin (Cammisotto et al. 2002).
Caffeine (supplemented with carnitine and choline) decreases serum leptin and
epididymal fat pad weights (Hongu et al. 2000; Sachan et al. 1999) and increases
measures of fatty acid oxidation (Sachan et al. 2000). Human studies have shown that
coffee, which contains the highest amount of caffeine in a widely consumed beverage,
has protective properties with regard to hepatocellular carcinoma (Kurozawa et al. 2005),
diabetes mellitus (Reunanan et al.2003) and Parkinson’s disease (Ascherio et al. 2001);
studies also show possible protection from Alzheimer’s disease and colon cancer. Many
studies have been completed in this lab in a collaborative effort to determine whether
caffeine is protective against skin cancer. Michna et al. (2006) found that caffeinated tea,

7
caffeine, and, to a lesser extent, decaffeinated teas offered significant protection against
UVB-induced tumors in hairless mice. Moreover, Conney et al. (2007) showed that both
ingested caffeine and topically applied caffeine and caffeine-sodium benzoate resulted in
a significant increase in UVB-induced apoptosis and protection from UVB-induced
carcinogenesis. Based on the finding that animals consuming caffeinated drinks tended
to have lower fat pad weights, Lu et al. (2006) performed an experiment in which animals
had fat pads surgically removed; this procedure resulted in enhanced UVB-induced
apoptosis and protection from UVB-induced skin changes. As an extension of that work
and the work involving caffeine, the group tested caffeine when combined with exercise,
and found that SKH-1 hairless mice that consumed caffeine and were given the
opportunity to exercise for two weeks experienced increased UVB-induced apoptosis.
Still another study (unpublished) in which SKH-1 hairless mice that had been exposed to
UVB twice weekly for a period of twenty weeks and then subsequently separated into
groups receiving caffeine, a run wheel, both or neither showed increased tumor latency
and decreased tumor incidence and tumors per mouse when treated with 0.1 mg/ml
caffeine and given the opportunity to exercise. (Carcinogenesis data in this study has yet
to be analyzed.) The studies that involve caffeine link the drug with an increase in UVB-
induced apoptosis and apparent protection against keratoacanthomas. More studies are
needed to determine whether oral administration of coffee in animals, independent of
exercise, stimulates apoptosis and a reduction in UVB-induced carcinogenesis. Studies
in this lab have shown that voluntary run wheel exercise alone reduces the risk of UVB-
induced skin tumor formation (including keratoacanthomas and squamous cell
carcinomas) in female SKH-1 hairless mice. Since caffeine without exercise was shown

8
to have some benefit, it is of interest to determine whether coffee consumption will offer
protection from these tumors without strenuous exercise; this might implicate a separate
mechanism that may enhance any benefit offered by exercise.
Protection from a variety of diseases and health conditions is offered in the daily
consumption of caffeinated beverages by humans, primarily coffee and tea (Higdon and
Frei, 2006; Inoue et al., 2005; Shimazu et al., 2005). Coffee and tea contain a number of
compounds that might account for the beneficial effects. Caffeine appears to be of
importance; researchers in several human studies have used decaffeinated beverages as
well as caffeinated and have found that health benefits were significantly diminished but
not eliminated (Higdon and Frei, 2006; Salazar-Martinez et al., 2004). Other
epidemiological studies have caffeine separated from coffee in their analysis; these
showed that caffeine was more protective than coffee (Ascherio et al., 2001).
Conversely, two of the largest prospective cohort studies to date have shown that
decaffeinated coffee reduced colorectal cancer risk, but caffeinated teas, coffees and
colas were not associated with reduced risk. (Higdon and Frei, 2006; Giovannucci et al.,
1998; Michels et al., 2005; Olsen and Kronberg, 1993; Lee et al., 1993). Many
epidemiological studies have shown that green tea consumption is protective from several
types of cancers, and (-)-epigallocatechin (EGCG), a polyphenol found in the drink, is
implicated. However, these studies involve regularly consumed tea, which also contains
caffeine (Inoue et al., 2001; Sasazuki et al., 2004; Tsubono et al., 2001).
Given the effects of caffeine on carbohydrate and fat metabolism, it was of interest to
determine the possible interactions of this compound with the effects of chronic ethanol
on carbohydrate metabolism and liver function. We also included caffeine in conjunction

9
with DPPD because of its known effects on fat metabolism (Michna, et al. 2003) and
apoptosis (Lu, et al. 2002), and because we had obtained ambiguous results in a recent
trial (Martin et al. 2004).
Hypothesis: Alcohol combined with a high-fat, low-carbohydrate diet will yield
differences in liver fat. Dietary caffeine and exercise may show protection against
alcohol-induced fatty liver.
Specific Aims:
In the interest of determining the effect of caloric composition on alcohol-induced
liver fat, animals would be fed isocaloric diet with differing energy composition and
with or without ethanol. Liver fat and carbohydrate metabolites would be
measured.
Materials and Methods: Energy Manipulation and Caffeine
Animals:
Male Long-Evans rats, initially weighing 100-125 g were obtained from Charles River
Laboratories in Wilmington, MA and were maintained according to the National Institute
of Health Guide for the Care and Use of Laboratory Animals in a vivarium accredited by
the American Association for the Accreditation of laboratory Animal Care (AAALAC).
Temperature was controlled (21-23˚C) and the cycle of 12 hours light/dark began at 7:00
PM. The procedures were approved by the Institutional Review Board at Rutgers
University (Martin et al. 2004).

10
Diet:
Animals were given isocaloric alcohol-free or alcohol-containing liquid diet varying in
fat and carbohydrate purchased. Powder basic diet was purchased from Research Diets,
North Brunswick, NJ. Diets for all experiments included, per kg: 42.0 g casein, (with the
exception of the soy protein diet) 0.6 g DL-methionine, 7.3 g salt mix, (1,16) 2.1 g
vitamin mix, (1,2,16) 0.4 g choline bitartrate, 1.0 g cellulose, 3.0 g xanthan gum, 0.254 g
sodium saccharin, and 25.0 g sucrose. In addition to these ingredients, varying amounts
of corn oil, maltodextrin, ethanol and water were added to result in diets matched for
energy content (4906-4985 kJ/kg). The high-fat, low-carbohydrate diets were designed
such that 8% of the dietary energy was in the form of carbohydrate, while low-fat, high-
carbohydrate diets were adjusted such that 8% of dietary energy was provided in the form
of fat. In all cases, the diets were prepared daily and provided ad libitum in bottles
designed to minimize spillage, starting at 7:00 am. The diets were administered for
varying times, as indicated for each experiment (Martin, et al. 2004).
I. High-fat vs. High-carbohydrate
Experiment 1
Rationale:
Based on previous results indicating clear protection in a high-carbohydrate, low-fat diet,
animals were fed the two types with or without alcohol. In an effort to expand on
previous findings, liver glycogen and glucose were measured to determine whether
differences in liver pathology resulted from differences in carbohydrate metabolism.

11
Separate groups of 8 rats were maintained on the alcohol free diets (high-fat or high-
carbohydrate or on the corresponding diets including 4.5% ethanol for two weeks. Liver
metabolites were examined as described above.
Experiment 2
Rationale:
Exercise and caffeine are known to impact adipose tissue formation. To determine
whether these variants would reduce ethanol-induced fatty liver, rats were given the
opportunity to exercise using a running wheel or caffeine or both.
Four groups of 8 rats were maintained on high-fat + ethanol diets containing 3.5%
ethanol for 10 days. Two groups were housed in wire cages with free access to running
wheels (approximately 0.5 m diameter) and two other groups were housed in standard
wire-bottomed hanging cages (20×25 cm). In each housing condition, one of the groups
received caffeine as a 0.05% solution in the high-fat diet, while the other received the
high-fat + ethanol diet without caffeine.
Experiment 3
While previous studies have shown some protection against alcohol-induced fatty liver
by caffeine, results have not been significant. It was of interest to determine whether
there was a time point in the course of alcohol-induced liver pathology at which caffeine
protection was optimal.
Rats were maintained on one of three different diets: high-fat, high-fat+ethanol, (3.5%
ethanol) without caffeine or high-fat+ethanol including 0.05% caffeine. At each time

12
point (2, 5, 8 or 12 weeks), four rats from each of the three dietary groups were killed and
tissue samples were taken.
Analysis of blood and tissues
Rats were decapitated between 8:00 and 9:00 A.M, the trunk blood was collected, and
samples in heparinized capillary tubes were centrifuged at 500 × g for 25 min to provide
plasma as needed for alcohol or leptin determinations. The whole liver was rapidly
dissected from the body cavity, blotted dry, and weighed before freezing in liquid
nitrogen and storage at –70°C for later analysis. In experiment 3, the epididymal fat pads
were also carefully removed and weighed.
Glucose was measured in blood using a One-Touch II Blood Glucose Monitor (Lifescan,
Milpitas, CA). Alcohol was determined in plasma using a commercial alcohol
dehydrogenase assay (333-UV; Sigma Chemical, St Louis, MO). All other reagents and
enzymes were obtained from Sigma Chemical (St. Louis, MO) in highest purity
available.
For liver fat analysis, duplicate pieces of liver, weighing between 200 and 400 mg, were
cut up and homogenized in 10 mL of 2:1 chloroform/methanol solution. The resulting
homogenates were mixed for 15-second periods at 5-minute intervals for 30 minutes and
filtered. The filters were rinsed with another 5 mL of chloroform-methanol solution. 3
mL of a 0.84% potassium chloride solution were added to the filtrate to remove and
separate the water portion of the filtrate, followed by another 15 seconds mixing period
and a settlement period of 30 minutes. The aqueous layer was then siphoned off and

13
discarded, and the organic solvent layer was poured into pre-weighed aluminum dishes.
After overnight evaporation of the solvent under a hood, the residual lipid was weighed
and percent lipid as liver fat was calculated using the weight of the initial sample.
For liver carbohydrate analysis (Keppler, at al. 1974; Noll, F. 1974), frozen samples were
homogenized in 1: 4 (w/v) of 0.6 N perchloric acid. The suspension was further disrupted
at 0–4°C using a Polytron (Brinkmann, Westbury, NY) at setting 6 for 15 s, followed by
two 45 s bursts at 30% power level using a Biosonik III (Bronwill Scientific, Rochester,
NY) sonicator with a micro-tip. The resulting homogenate was shaken on ice for 10
minutes, and an aliquot of well-mixed suspension was frozen at –70°C for glycogen
digestion. The remaining suspension was centrifuged at 3,000 × g for 20 minutes and the
supernatant was neutralized with a solution of 3 N KOH, 0.4 M Tris and 0.3 M KCl. The
mixture was centrifuged at 3,000 × g for 20 minutes to give a deproteinized liver extract.
For lactate analysis, samples of the deproteinized liver extract were combined in a
solution with final concentrations of 4.8 mM EDTA, 450 mM hydrazine hydrate, and
0.26 mM β-NAD in a 38.6 mM Tris-HCl buffer at pH 9. Following a preliminary
measurement of absorbance at 340 nm, lactate dehydrogenase (11 units) was added to a
final assay concentration of 10 µg/ml, the mixture was incubated at 30°C in a shaking
water bath for one hour, and the final absorbance was measured.
For glycogen digestion, aliquots of 50 µl of the thawed and diluted liver homogenate
were mixed with 50 µl of 1 M potassium bicarbonate and 1 ml of 0.28 mg/ml

14
amyloglucosidase in 0.2 M acetate buffer at pH 4.8. (For estimations of free glucose,
parallel tubes were prepared substituting 0.2 M acetate buffer for the amyloglucosidase
solution.) The tubes were stoppered and incubated at 40°C for 2 hours in a shaking water
bath. The digestion was terminated by adding 0.5 ml of 0.6 N perchloric acid to each
mixture, followed by centrifugation at 220 × g for 15 minutes. The supernatants were
neutralized with 30% KOH and centrifuged at 220 × g for 15 minutes to remove the
perchlorate precipitate. Aliquots of the deproteinized glycogen digests (or corresponding
undigested extracts for free glucose determination) were combined in a mixture including
final concentrations of 3 mM MgSO4, 0.7 mM ATP, 0.6 mM β-NADP, and 5 µg/ml
glucose-6-phosphate dehydrogenase in 0.2 M triethanolamine buffer at pH 7.5.
Following addition of hexokinase to a final concentration of 5 µg/ml, absorbance at 340
nm was monitored to completion of reaction and the original concentrations of free liver
glucose and glucosyl units in digested liver glycogen were calculated.
Leptin levels were measured in plasma using a commercial radioimmunoassay kit
designed for measurements in rat (Cat. # RL-83K, Linco Research, Inc, St. Charles, MO).
Statistical Analysis:
Data were subjected to one-way analyses of variance (ANOVA) in Experiment 1 and to
two-way ANOVA in Experiments 2 and 3. Following demonstration of significant
effects in the ANOVA, Bonferroni’s post-hoc comparison tests were used to determine
the significance of differences between particular groups.

15
Results: Energy Manipulation and Caffeine
Experiment 1
Diet significantly influenced the weight gained over the 2week experiment (p<0.0001)
and the trunk blood glucose levels (p<0.01). Rats maintained on either of the ethanol-
containing diets (high-carbohydrate + ethanol or high-fat + ethanol) gained significantly
less weight over the two-week course of the experiment (Table 1) and had significantly
lower levels of circulating glucose than rats on either of the diets without ethanol (high-
carbohydrate or high-fat).
Although there was no effect of diet on liver weight as a percent of body weight, the
percent of fat in the livers of the rats was significantly influenced by diet (p<0.001).
Post-hoc tests indicated that the liver fat of rats maintained on the high-fat + ethanol diet
was significantly higher than that of any of the other treatment groups (Table 1). Rats on
the high-fat diet tended to have a higher percent of fat in liver than those on the high-
carbohydrate diet.
Table 1:
Diet** Bodyweight change (g)
Blood glucose (mg/dl)
Liver weight (g/kg body weight)
Liver fat (g/100 g liver wet weight)
F 60±9a 9.0±0.5a 4.4±0.2 8.0±0.6 F+E 14±8b 7.9±0.4b 4.3±0.2 11.4±1.0a C 80±6 a 9.2±0.1a 4.5±0.2 6.4±0.5 C+E 40±9 b 7.3±0.4b 4.3±0.1 5.9±0.4 Means with different superscript letters are significantly different at p<0.05 by Bonferroni’s Multiple Comparison Test (N=8); ** F – low-carbohydrate and high-fat diet without ethanol; F+E – low-carbohydrate and high-fat diet with 4.5% ethanol; C – high-carbohydrate and low-fat diet without ethanol; C+E – high-carbohydrate and low-fat diet with 4.5% ethanol, as described in Methods (Experiment 1).

16
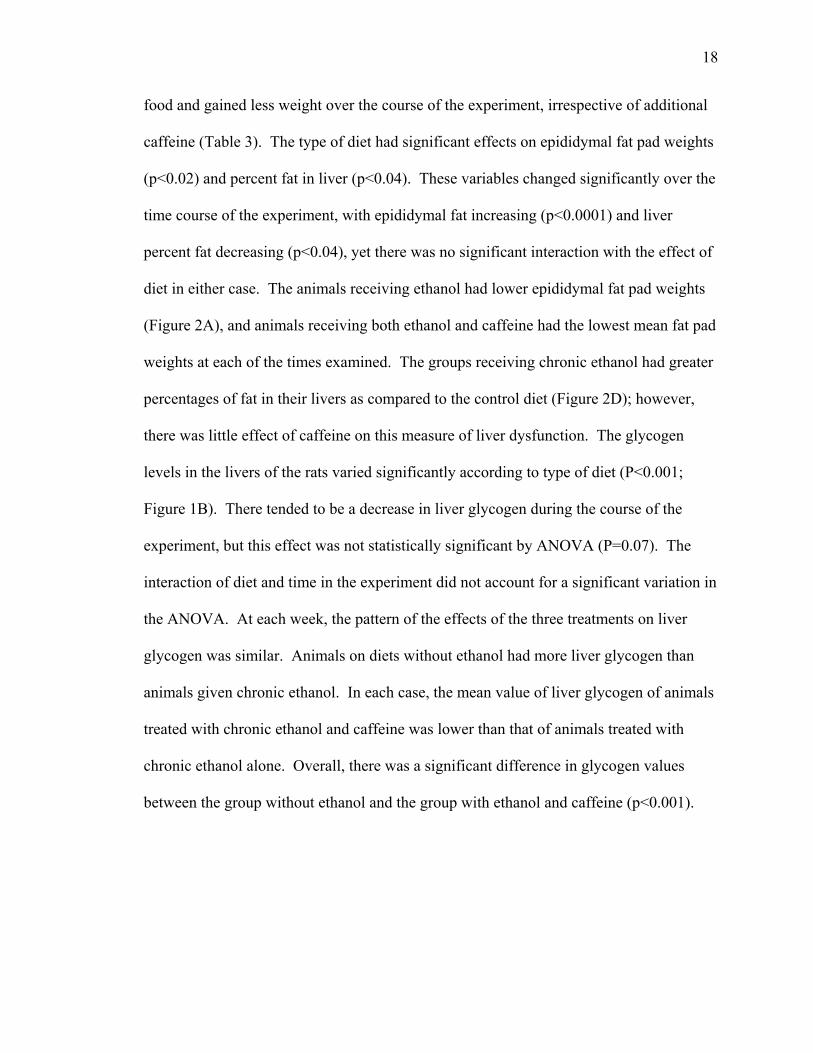
Significant influences of diet on liver levels of glycogen (p<0.0001), glucose (p<0.0001)
and lactate (p<0.0002) were demonstrated in the ANOVA. The rats fed the high-
carbohydrate diet without alcohol had significantly higher levels of liver glycogen when
compared to any of the other groups. Ethanol tended to decrease liver glycogen in both
high-carbohydrate + ethanol and high-fat + ethanol diets as compared to the
corresponding high-carbohydrate and high-fat diets without ethanol. However, the
apparent glycogen-depleting effect was less pronounced in the high-carbohydrate +
ethanol diet condition than with the high-fat + ethanol diet. Rats maintained on the high-
carbohydrate diets (high-carbohydrate or high-carbohydrate + ethanol) had higher liver
glucose than the rats on the high-fat diets (high-fat or high-fat + ethanol). Liver lactate
was significantly lower in the high-fat + ethanol group than in any of the other groups
(Table 2), indicating a lowered rate of glycolysis in rats having the greatest accumulation
of liver fat.
Experiment 2
The effects of caffeine were tested on measures of metabolism and liver function in rats
maintained for nine days on an alcohol-containing diet in cages with or without running
wheels (Table 2). Over the course of the experiment, the rats given caffeine averaged
4715±711 turns of the running wheel as compared to 2762±641 turns for the animals
without caffeine (p<0.03, t-test). The presence of a running wheel significantly inhibited
food intake (p<0.004), alcohol intake (p<0.01), caffeine intake (p<0.02), liver weight
(p<0.003) and total weight gain (p<0.001) (Table 2). There were no significant effects

17
of caffeine administration on any of the variables measured, nor significant interactions
between the effects of cage type and caffeine administration. However, there were trends
approaching significance for inhibitory effects of caffeine on serum ethanol (p=0.099),
blood glucose (p=0.076), and liver fat (p=0.080). While not statistically different, the
percent of liver fat was lower in the caffeine-treated animals allowed access to a running
wheel than any of the other groups and liver glycogen also tended to be lower in this
group than in the other treatment conditions. Liver glucose levels were not noticeably
altered by any of these treatments.
Table 2:
Treat- ment*
Daily food intake (g/rat)
Daily alc.intake (k/kg)**
Weight gain (g)
Plasma Ethanol (mg/100dL)
Liver weight (g)**
Liver Fat (%wet weight)
Liver Glycogen(µmol glucosyl units/g)
Liver glucose(µmol
Reg/nc 42±1a 12.5±0.3a,b 50±6 125±33 8.5±0.3a 12.6±1.0 92±14 42±6 Rw/nc 34±3 11.6±0.6a,b 8±11 149±34 6.8±0.8a,b 13.7±1.6 89±26 53±12 Reg+caf 41±2a 12.6±0.4a 49±3a 66±18 8.7±0.6a,b 12.1±0.5 105±18 39±9 RW+caf 32±2 10.9±0.5b 14±7 103±35 6.6±0.5b 10.3±0.9 74±15 42±3 *Rats were maintained on a high-fat diet including 3.5% ethanol (F+E), with or without 0.05% caffeine, as described in Methods (Experiment 2) Reg=regular cage,RW=Running wheel nc=no caffeine** Means with different superscript letters are significantly different at p<0.05 by Bonferroni’s Multiple Comparison Test (N=8).
Experiment 3:
To more fully characterize the interactions of caffeine with carbohydrate metabolism in
relationship to development of fatty liver, we studied groups of rats maintained for 2–12
weeks on high-fat + alcohol diets (containing 3.5% ethanol) with or without 0.05%
caffeine, or, for comparison, a high-fat diet (Table 3). Rats given ethanol consumed less
18
food and gained less weight over the course of the experiment, irrespective of additional
caffeine (Table 3). The type of diet had significant effects on epididymal fat pad weights
(p<0.02) and percent fat in liver (p<0.04). These variables changed significantly over the
time course of the experiment, with epididymal fat increasing (p<0.0001) and liver
percent fat decreasing (p<0.04), yet there was no significant interaction with the effect of
diet in either case. The animals receiving ethanol had lower epididymal fat pad weights
(Figure 2A), and animals receiving both ethanol and caffeine had the lowest mean fat pad
weights at each of the times examined. The groups receiving chronic ethanol had greater
percentages of fat in their livers as compared to the control diet (Figure 2D); however,
there was little effect of caffeine on this measure of liver dysfunction. The glycogen
levels in the livers of the rats varied significantly according to type of diet (P<0.001;
Figure 1B). There tended to be a decrease in liver glycogen during the course of the
experiment, but this effect was not statistically significant by ANOVA (P=0.07). The
interaction of diet and time in the experiment did not account for a significant variation in
the ANOVA. At each week, the pattern of the effects of the three treatments on liver
glycogen was similar. Animals on diets without ethanol had more liver glycogen than
animals given chronic ethanol. In each case, the mean value of liver glycogen of animals
treated with chronic ethanol and caffeine was lower than that of animals treated with
chronic ethanol alone. Overall, there was a significant difference in glycogen values
between the group without ethanol and the group with ethanol and caffeine (p<0.001).

19
Table 3
Diet (weeks)
Diet alcohol (%)
Diet Caffeine (%)
Food Intake (g/rat/day)
Alcohol Consumed (g/kg/day)
Caffeine Consumed (mg/kg/day)
Weight Gain (g)
Serum leptin (µ/g fat pad/g bwt
2 0 0 71±7a 0 0 78.2±12 3.5 0 52±4 11.8±0.4 0 64±8 3.5 0.05 47±4 12.1±0.7 172±12 56±9
5 0 0 86±6a 0 0 196±21 1779±192a 3.5 0 66±2 10.8±0.1 0 168±12 1063±112ab 3.5 0.05 62±3 10.7±0.04 152±1 176±16 410±205b
8 0 0 90±5a 0 0 260±11 703 3.5 0 71±6 9.9±0.2 0 230±36 932 3.5 0.05 72±6 10.9±0.2 145±2 236±33 937
12 0 0 101±7a 0 0 376±11 874 3.5 0 82±3 8.4±0.1 0 375±28 1010 3.5 0.05 80±2 9.1±0.3 130±4 258±51 453
*Rats were maintained on an ethanol-free high-fat (F) diet or a high-fat diet including 3.5% ethanol (F+E), with or without 0.05% caffeine, as described in Methods (Experiment 3); ** Means with different superscript letters are significantly different from others at the same time point at p<0.05 by Bonferroni’s Multiple Comparison Test (N=4).
Discussion
The percent fat in livers of rats on the high-carbohydrate, ethanol diet was lower than any
of the other groups of Experiment 1, consistent with previous reports of a protective
effect of the high-carbohydrate diet against ethanol-induced fatty liver (Fisher, et al.
1997; Fisher, et al. 1996; Guthrie, at al. 1990; Kourourian et al. 1999). Ethanol tended to
decrease liver glycogen in both high-fat and low-fat diets as compared to the
corresponding diets without ethanol. These results are consistent with earlier reports of
decreases in glycogen synthase enzyme protein due to chronic ethanol exposure (Van
Horn, et al. 2001). A protective influence of a high carbohydrate diet against deleterious
effects of ethanol with regard to fatty liver might be related to a preservation of the
contribution of glycolytic intermediates to the energy metabolism. Liver lactate was
significantly lower in the high-fat + ethanol group than in any of the other groups (Table

20
2), indicating an inverse correlation between rate of glycolysis and liver fat. High
carbohydrate might therefore exert a protective effect against ethanol-induced depletion
of glycogen, which would have been accompanied by reduction of glycolysis and
induction of fatty liver. While chronic ethanol is known to decrease the expression of
glucose transporter 1 in liver (Van Horn, et al.2001; Kisclevski, et al. 2003; Nanji et al.
1995), the availability of higher glucose levels from dietary sources could presumably
overcome this limitation to increase intracellular glucose in hepatocytes of rats on the
high-carbohydrate diet (Martin, et al. 2004).
The increased intracellular glucose resulting from a high-carbohydrate vs. high-fat diet
would positively modulate glycogen synthase activity (Fletterick, Nabsen 1980; Madsen,
et al. 1983), compensating for the lowered enzyme levels. The resulting greater store of
liver glycogen in rats maintained on a high carbohydrate diet was accompanied by a
lower accumulation of fat in their livers, even after exposure to chronic alcohol, which
may indicate a protective effect of liver glycogen store against liver fat accumulation and
perhaps subsequent deleterious effects of chronic ethanol.
The currently demonstrated effect of ethanol to decrease leptin levels is consistent with a
controlled diurnal study of leptin secretion in human subjects given alcohol (Rojdmark, et
al. 2001) and with studies of leptin levels correlated with self-reported alcohol intake
(Donahue. Et al. 1999; Perkins and Fonte 2002), but contrasts with results of other
studies of postmenopausal women (Roth, et al. 2003) and a group of young men self-
reporting alcohol use (Mantzoros, et al. 1998). Although inconsistent in direction of
effect, each of the studies did provide support of significant effects of ethanol on leptin
secretion and levels. Factors contributing to differences between findings of these studies

21
include the groups examined and the time course of the alcohol action. In the case of our
study, it was clear that likely physiological actions of leptin (e.g., on epididymal fat pad
weight) were influenced in a manner consistent with the observed influences on levels of
the peptide.
The level of caffeine (0.05%) used in this study caused substantial increases in activity in
the presence of a running wheel, yet had no protective effect against ethanol-induced
depletion of liver glucose and induction of fatty liver. In fact, caffeine appears to
exacerbate the effect of ethanol to deplete liver glycogen, decrease epididymal fat pad
weight (Figure 2) and lower serum leptin (Table 3), which serves to underscore that there
is a distinction between liver fat (as an indicator of pathology) and body fat (as an
indicator of general metabolic processes regulated, for example, by leptin, and which also
may be disrupted by ethanol). Furthermore, it seems unlikely that the protective
influences of high-carbohydrate diet against effects of chronic ethanol to induce fatty
liver are merely the simple result of a protection against liver glycogen depletion.
While our results lend further support to the idea that a protective influence of a high-
carbohydrate diet against liver pathology due to chronic ethanol might be exerted by
qualitative shift in the regulation of pathways of carbohydrate metabolism, the precise
nature of such a mechanism remains unclear. Given that there has been a recent
demonstration of protective effects of ethyl pyruvate against acute alcohol-induced liver
injury (Yang, et al. 2003), it is logical to hypothesize that the accumulation of a
metabolite enhanced by the high-carbohydrate ethanol-containing diet has a protective
effect against liver pathology.

22
II. Analysis of Dietary Additives: High Vitamin E and Selenium Elevate, whereas diphenyl-para-phenylenediamine (DPPD) Plus Caffeine Lowers Liver Fat in Alcohol-fed Rats
In this second group of experiments, the roles of certain antioxidants were examined
when added to the high-fat, alcohol-containing diet. Antioxidants such as vitamin E,
diphenyl-para-phenylenediamine, and selenium, as well as cranberry powder and soy
protein have been shown to prevent oxidative stress that can lead to cell death (Levander
et al. 1972; Liu, et al. 1994; Howell, Foxman 2002; Ascencio et al. 2004). The liver is
particularly vulnerable to oxidative stress because of excessive fat accumulation
subsequent to insults such as high-fat diets and/or alcohol abuse. Because caffeine has
been shown to decrease leptin and epididymal fat pad weights, (Hongu, Sachan 2002,
Sachan, Hongu 1999) and because it appeared to exhibit some effect on liver fat in the
previous study, the drug was also included in some experiments, either combined with or
separate from antioxidant-enriched diets (Nolan, et al. 2005).
Hypothesis: A high-fat diet plus ethanol will result in significantly higher levels of
liver fat than controls, and this condition can be ameliorated by use of dietary
additives.
Specific Aims:
In the interest of determining the effects of dietary additives on alcohol-induced
fatty liver, animals would be fed diets supplemented with antioxidants, cranberry
powder or soy protein in combination with a high-fat diet with alcohol. Liver fat
would then be measured.

23
Antioxidants
We examined the role of antioxidants on liver fat when added to the high-fat, alcohol-
containing diet. The dietary antioxidants selected included vitamin E (which is often
found deficient in disorders that compromise hepatic health) and diphenylpara-
phenylenediamine (DPPD), which has been shown to be an effective synthetic
antioxidant (Matterson, L.D. 1955, Monson, et al. 1957). In addition, selenium, a trace
element that is a component of several proteins including glutathione peroxidase was
examined. Glutathione peroxidase acts to protect cells against oxidative stress through
detoxification of peroxides (Liu, et al. 1994); therefore, it was predicted that selenium
may also be effective in reducing alcohol-induced fatty liver.
Materials and Methods: Antioxidant Studies
Animals:
Male Long-Evans rats, initially weighing 100-125 g were obtained from Charles River
Laboratories in Wilmington, MA and were maintained according to the National Institute
of Health Guide for the Care and Use of Laboratory Animals in a vivarium accredited by
the American Association for the Accreditation of laboratory Animal Care (AAALAC).
Temperature was controlled (21-23˚C) and the cycle of 12 hours light/dark began at 7:00
PM. The procedures were approved by the Institutional Review Board at Rutgers
University.

24
Diet:
The rats were fed our modification of the Lieber-DeCarli liquid diet [2,13], administered
ad libitum in hanging plastic bottles designed to minimize spillage. Amount of diet
consumed by each animal was recorded daily. Each kilogram contained the following
ingredients unless otherwise specified (in grams): casein (except in the soy protein-based
diet), 42; DL-methionine, 0.6; sucrose, 25; maltodextrin, 42; cellulose (BW200), 1;
xanthan gum, 3; corn oil, 53; salt mix (Fisher, et al. 2002), 7.3; vitamin mix (Fisher, et al.
2002), 2.1; choline bitartrate, 0.4; sodium saccharin, 0.254; and water, 811. Diet premix
was obtained from Research Diets, North Brunswick, NJ. Selenium (0.3 mg) from
sodium selenite (Sigma Aldrich), tocopheryl acetate (0.5 g, 50% concentrate) (Sigma
Aldrich), DPPD (0.5 g ) (99%, Sigma Aldrich), cranberry powder (0.003 g ) (90 MX
supplied by Ocean Spray Cranberries, Inc, Middleboro, Mass), or caffeine (0.5 g) (Sigma
Aldrich) was added to each kilogram of the diet. Ethanol as a 95% solution (Rutgers
University under license from the AFT) comprising 4% to 5% of total diet, was added to
the premix and blended with the other ingredients. Fresh diet was prepared daily for each
treatment group.
Experiment 1
Rationale:
Vitamin E is a comprehensive name for eight different forms: α-β-λ, δ-tocopherol, with a
chromanol ring and saturated phytyl side chain, and four with unsaturated side chains: α-
β-λ, δ-trienols. α-Tocopherol is the most potent of these antioxidants (Burton and Ingold,

25
1986, Sadrzadeh et al. 1995). As ethanol metabolism is associated with the generation of
reactive oxygen species, the effects of this potent antioxidant on liver fat resulting from a
high-fat diet with ethanol was examined.
Four groups of rats (n = 8), were fed, for 8 weeks, a vitamin E–supplemented (500
mg/kg), high-fat diet; a vitamin E supplemented, high-fat diet with 4% alcohol; a high-fat
diet devoid of vitamin E; or a high-fat diet devoid of vitamin E with 4% alcohol. In this
experiment, corn oil stripped of vitamin E and the vitamin mix devoid of vitamin E were
used in place of regular corn oil and the regular vitamin mix.
Experiment 2
Rationale:
DPPD diphenyl-para-phenylenediamine has been shown to be an effective synthetic
antioxidant (Matterson, L.D. 1955, Monson, et al. 1957). Selenium is a trace element
that is a component of several proteins including glutathione peroxidase, which acts to
protect cells against oxidative stress through detoxification of peroxides (Liu, et al. 1994)
As a continuation of the analysis of the effects of Vitamin E, these additional antioxidants
were examined with regard to their impact on alcohol-induced steatosis.
Four groups of rats (n = 8) were given high-fat diets containing 5% alcohol either alone
or combined with vitamin E (500 mg/kg), DPPD (500 mg/kg), or selenium (0.3 mg/kg).
As for experiment 1, vitamin E–stripped corn oil was used for all treatments, the vitamin
E–free vitamin mix was used, and selenium was removed from the salt mix. Rats were
maintained on this diet for 6 weeks.

26
Experiment 3
Rationale:
Endotoxins and Cranberry Powder
Another hypothesis regarding liver pathology consequent to alcohol ingestion is that
endotoxins provoke an inflammatory response that ultimately leads to necrosis (Yin, et al.
1999). There have been several studies linking the potent bacterial anti-adhesion
properties of proanthocyanidins found in cranberries to the prevention of bacterial
infection in the urinary tract (Howell, A.B. 2002; Howell et al. 2001). This same
antibacterial property could potentially lead to a delay in the onset of inflammation in the
liver. Accordingly, in this investigation, a cranberry powder concentrate was also used as
a supplement to test this hypothesis.
Likewise, soy protein has been shown to have potent anti-inflammatory effects
(Ascencio, et al. 2004). Polyenylphosphatidylcholine (PPC) extracted from soybeans has
been shown to protect rats treated with CCl4 baboons fed ethanol against lipid
peroxidation, fibrosis and cirrhosis (Aleynik, et al. 1997, 2000; Lieber et al. 1994, 1997;
Ma et al. 1996). Therefore soy protein was included in these experiments in lieu of the
casein that would normally be in the diet.
DPPD and caffeine individually had yielded unclear results in previous experiments. In
an attempt to strengthen the apparent effect of each, the two additives were combined.
Groups were fed high-fat versions of the previously described liquid diet as appropriate
for individual experiments below. At the end of each time period, trunk blood was

27
collected for blood glucose and plasma leptin. In addition, epididymal fat pads were
weighed and liver was taken for analysis of fat, as described in the previous experiment.
Four groups of rats (n = 8) were given the high-fat diet and 5% alcohol. One group was
given 500 mg/kg of caffeine and 500 mg/kg of DPPD in the diet. Another group was
given 9 mg/kg of cranberry powder in the diet (Howell, et al. 2001). The casein normally
used in the basic diet was replaced with soy protein in yet another diet. Rats were
maintained on their respective diet for 6 weeks. In anticipation of amelioration of the
alcohol effects by one or more of the supplements, 9 hours before sacrifice, food was
removed from all groups to check for alcohol withdrawal seizures induced by key
jingling for 60 seconds above the cages. A reduction in seizures would serve as an
additional sign of reduced alcohol addiction (Fisher, et al. 1996).
Experiment 4
Rationale:
Previous research from this laboratory had shown that the effects of caffeine on liver fat
were unclear (Martin, et al. 2004) so the significant benefit of DPPD plus caffeine shown
in Experiment 3 could have been additive, synergistic, or solely DPPD-related. To
clarify this issue, Experiment 4 was undertaken. Four groups of rats (N = 8) were fed the
high-fat diet and 5% alcohol. In addition, 1 group was given DPPD (500 mg/kg) plus
caffeine (500 mg/kg), 1 received DPPD (500 mg/kg) alone, and 1 was given caffeine
(500 mg/kg) alone. Rats were maintained on these diets for 6 weeks, and total liver fat
was determined.

28
For liver fat analysis, duplicate pieces of liver, weighing between 200 and 400 mg, were
cut up and homogenized in 10 mL of 2:1 chloroform/methanol solution. The resulting
homogenates were mixed for 15-second periods at 5-minute intervals for 30 minutes and
filtered. The filters were rinsed with another 5 mL of chloroform-methanol solution. 3
mL of a 0.84% potassium chloride solution were added to the filtrate to remove and
separate the water portion of the filtrate, followed by another 15 seconds mixing period
and a settlement period of 30 minutes. The aqueous layer was then siphoned off and
discarded, and the organic solvent layer was poured into pre-weighed aluminum dishes.
After overnight evaporation of the solvent under a hood, the residual lipid was weighed
and percent lipid as liver fat was calculated using the weight of the initial sample.
Statistical Analysis:
Data were subjected to one-way analyses of variance (ANOVA). After demonstration of
significant effects, Bonferroni post hoc comparison tests were used to determine the
significance of differences among groups. Results are presented as means ± standard
error of the mean.
Results: Antioxidants
Experiment 1
The addition of alcohol to the high-fat diet, regardless of vitamin E status, significantly
increased hepatic fat (p<0.001). Supplementation of the alcohol-containing diet with 500

29
mg vitamin E per kilogram of diet further significantly elevated liver fat compared with
controls (vitamin E, no alcohol, Table 4). Alcohol depressed body weight gain.
Although the differences were not significant between the individual groups, they are
significant if the 2 alcohol groups are jointly compared with the 2 non–alcohol-provided
groups (p<0.001). There were no differences in alcohol consumption. In rats fed vitamin
E and 4% alcohol, pronounced bloating of the stomach was observed in 7 of 8 rats.
Table 4:
Treatment* Mean liver fat† (%)
6-week weight gain (g)
Mean alcohol consumed (g/kg body weight)
Vitamin E: 500 mg/kg diet no alcohol
7.7 a ± .3 288 ±12 0
Vitamin E: 500 mg/kg diet 4% alcohol
14.6 b ± 0.8 201 ± 8 10.6 ± 0.5
No Vitamin E: no alcohol
7.0 a ± 0.2 256 ± 14 0
No Vitamin E: 4% alcohol
10.2 c ± 0.5 199 ± 12 9.2 ± 0.1
* 8 rats per group
†Means in each column with different superscripts are significantly different at p<0.05 by
Bonferroni’s multiple comparison test. Liver fat was determined in lateral lobes.
Experiment 2
In this experiment, vitamin E and selenium both significantly elevated liver fat in rats fed
high-fat, alcohol-containing diet, (p<0.05) whereas DPPD did not affect liver fat in either
direction (Table 5). All 3 supplements reduced weight gain compared with the controls,

30
but only the selenium effect was significant (p<0.05). There were no significant
differences in alcohol consumption among treatment groups (Table 5).
Table 5:
Treatment
*
Mean liver fat†
(%)
6-week weight gain†
(g)
Mean alcohol consumed
(g/kg body weight)
Control 9.6 a ± 0.6 132 a ± 8 9.5 ± 0.4
DPPD 9.1 a ± 0.4 111 a ± 10 10.2 ± 0.5
Vitamin E 15.4 b ± 1.7 117 a ± 13 8.4 ± 0.3
Selenium 12.7 c ± 1.3 108 b ± 13 9.0 ± 0.3
*controls, vitamin E N=7, DPPD, selenium N=8.
†Means in each column with different superscripts are significantly different at p<0.05 by
Bonferroni’s multiple comparison test.
Experiment 3
Neither soy protein nor the cranberry concentrate powder affected liver fat (Table 6).
Diphenyl-para-phenylenediamine combined with caffeine significantly reduced liver fat
accumulation (p<0.05) when compared with controls and the other treatment groups
(Table 6). Both the group that received DPPD plus caffeine and the group that received
soy protein gained significantly less weight than controls and the group that received the
cranberry powder (p<0.05). The weight gains for the supplemented groups were similar
to those in experiments 1 and 2, but for unexplained reasons, the controls gained more
weight in experiment 3. The amount of alcohol consumed per kilogram of body weight
did not differ among treatment groups. There were no withdrawal seizures in the rats fed
DPPD plus caffeine, compared with 2 seizures in the control group, 1 in the cranberry
powder group, and none in the soy protein group. Although of interest because the

31
DPPD plus caffeine group also had significantly reduced liver fat, the small number of
rats affected do not permit any meaningful interpretation at this time.
Table 6:
Treatment* Mean liver
fat† (%)
6-week weight gain†
(g)
Mean alcohol consumed
(g/kg body weight)
Control 10.8 a ± 1 153 a ± 9 9.1 ± 0.4
DPPD+caffeine 8.0 b ± 0.9 110 b ± 8 9.1 ± 0.4
Cranberry
powder
9.5 a ± 0.9 130 a ± 8 8.4 ± 0.4
Soy protein 10.8 a ± 0.9 100 b ± 8 9.2 ± 0.4
* 8 rats per group.
†Means in each column with different superscripts are significantly different at p<0.05 by
Bonferroni’s multiple comparison test.
Experiment 4
There were no significant differences in liver fat among control, caffeine, and DPPD
treatments (Table 7). However, the combination of DPPD plus caffeine, again,
significantly reduced liver fat values below those of controls, DPPD alone, or caffeine
alone (p<0.001). Caffeine alone significantly reduced weight gain below that of the other
treatments (p<0.05). There were no differences in alcohol consumption among
treatments.

32
Table 7:
Treatment* Mean Liver Fat
%
6-week weight
gain† (g)
Mean alcohol consumed
(g/kg body weight)
Control 14.9 a ± 0.7 132 a ± 7.8 9.5 ± 0.4
DPPD 13.5 a ± 0.8 111 a ± 9.5 10.2 ± 0.5
Caffeine 15.5 a ± 0.9 86 b ± 10.0 10.6 ± 0.5
DPPD+Caf 10.8 b ± 0.7 100 a ± 7.1 10.0 ± 0.4
*controls, N=14, DPPD, N=10, caffeine, N=15, DPPD + caffeine, N=15
†Means in each column with different superscripts are significantly different at p<0.05 by
Bonferroni’s multiple comparison test.
Discussion
The present experiments showed that of all the substances tested, only the lipid-soluble
antioxidants and caffeine affected alcohol-induced liver fat accumulation. These results
indicate that because neither vitamin E nor selenium protected against steatosis, attempts
to ameliorate oxidative stress with high doses of antioxidants are probably not a prudent
treatment option. That DPPD was protective, particularly when combined with caffeine,
could guide research to more specific possibilities about the cause and prevention of liver
disease; combinations of reasonable doses of several compounds may be more effective
and safer than large doses of single compounds.
The current experiments show that a diet relatively high in vitamin E can aggravate the
fatty liver condition produced by the high-fat, alcohol-containing diet long used in this
laboratory. A similar observation was reported by Levander et al (1972) who obtained a
fatty liver condition by giving alcohol in drinking water along with a necrogenic, torula
yeast–based diet. This finding is important given that vitamin E is often found lacking in
liver-related pathologies (You, et al. 2004), and that although supplements are often

33
prescribed, careful attention must be paid to dosage; more is clearly not better in this
instance.
The mechanism for the protective effect of DPPD plus caffeine is unclear. Vitamin E has
been shown to have both anti- and pro-oxidant properties, whereas DPPD and other
molecules were found to be strictly antioxidant. According to Culbertson and Porter
(2000), the long carbon chain on the tocopherol molecule makes it more lipophilic than
DPPD. In addition, the DPPD molecule contains 3 benzene rings that enhance stability
of the resulting radical following the initial reaction. This property may make vitamin E
more reactive in lipid and, therefore, more likely to show pro-oxidant effects.
It should be noted that we used α-tocopheryl acetate as the vitamin E supplement, the
form that is typically found in most supplements. Work by McCormick and Parker
(2004) has shown that tocopherol uptake varies, based not only on the form of the
molecule, but also on the type of cell.
Diphenyl-para-phenylenediamine not only did not exhibit pro-oxidant effects, but it was
the only substance tested that, together with caffeine, reduced liver fat accumulation in
rats below that of controls. Possible explanations for this phenomenon include the
possibility that each compound addresses an unrelated mechanism. Caffeine is known to
exert inhibitive effects on body fat accumulation (Lu, et al. 2002, 2007); this could result
in a reduction in tnf-α secretion, which would give rise to circulating adiponectin above
levels normally associated with ethanol consumption, and thereby ameliorate the steatosis
resulting from a reduction in PPARα. Meanwhile, DPPD could simply serve to reduce
lipid peroxidation in the liver, thereby curtailing accumulation of fat. Further studies
determining the safety of DPPD for human consumption may be in order, although

34
several earlier reports exist that have addressed teratogenicity and reproductive health in
animals (Oser, et al. 1956).
Caffeine combined with DPPD proved to be highly effective not only in preventing a rise
in liver fat accumulation, but in significantly reducing liver fat compared with the
controls. The limited observation of protection against alcohol withdrawal seizures by
DPPD plus caffeine suggests that this combination had reduced the addictive properties
of alcohol. Further studies are needed to test if this combination also reduces alcohol
craving/consumption. Michna et al (2002) have shown that caffeine consumption
significantly reduced body fat content in mice through a process of activity stimulation.
Perhaps a similar mechanism is at work in rats so that the combined effect of DPPD plus
caffeine increases the alcohol elimination/metabolism rate, which would explain the
reduced withdrawal seizure rate.
Previous studies have shown that the proanthocyanidins found in cranberry powder
inhibit low-density lipoprotein oxidation and have an overall positive effect on lipid
metabolism and cholesterol (Howell, A.B. 2002). The current study showed no
protective effect vis a vis liver fat accumulation, suggesting that a lipid-soluble
compound may be required in this regard. A longer feeding period also may be necessary
before the benefits of these compounds with regard to liver fat are ruled out. Although
necrosis resulting from an inflammatory response to endotoxins may be a significant
contributor to alcoholic liver disease (You, et al. 2004), the order of events has not been
firmly established. Therefore, proanthocyanidins may be helpful later on in interfering in
the cascade of events leading to irreversible cell damage, particularly if endotoxin release
via leaky gut results from long-term alcohol abuse (Yin, et al. 1999).

35
The recommended daily allowance for vitamin E for adult humans is 15 mg, which
calculates to approximately 0.21 mg/kg body weight. The tolerance upper intake level is
set at 1000 mg/d or roughly 15 mg/kg body weight (Institute of Medicine DRI, 2000).
The rats in the present experiments received about 50 mg/d, which translates to
approximately 150 mg/kg body weight or about 10 times the purported upper tolerance
level for human beings.
The recommended daily allowance of selenium for adult humans is 55 µg, which
translates to 0.8 µg/kg body weight (Institute of Medicine DRI, 2000) . Our rats
consumed about 0.03 mg/d (from the liquid diet) which translates to roughly 0.09 mg/kg
body weight. Halverson (1974) has reported 2 mg selenium per kilogram of solid diet as
an upper level of intake for the rat. Assuming rats consume about 20 g of solid food per
day, they would then ingest about 0.04 mg of selenium per day, or an amount in the same
intake range (0.03 mg) as that consumed by the rats in this experiment.
To summarize, in these experiments, we examined the effects of lipid and water-soluble
antioxidants, an anti-inflammatory compound, antiadhesive cranberry powder, and
caffeine, a stimulant known to reduce lipid accumulation. Each of these substances
potentially addresses an aspect of ethanol-induced liver fat accumulation. We observed
that vitamin E and selenium supplementation increased liver fat accumulation in the
presence of alcohol when compared with controls. Diphenyl-para-phenylenediamine,
cranberry powder, and soy protein had no significant effect on liver fat accumulation in
comparison with controls, whereas DPPD plus caffeine significantly reduced liver fat
compared with all other treatments.

36
Although there may be differences in antioxidant metabolism across species, the
significant accumulation of fat in the liver in diets high in vitamin E or selenium warrants
caution against unnecessary supplementation of these nutrients. Recent warnings of
increased all-cause mortality in people consuming supplements of Vitamin E in excess of
400 IU per day (Miller, et al. 2003) further strengthen this position.

37
III. A Mouse Model for Alcohol-Induced Steatosis using Ethanol in a
High-Fat Liquid Diet
Important discoveries regarding ethanol consumption, addiction and withdrawal have
been made using transgenic mouse models. Examples include the work of Fehr, et al.
(2002); this team used recombinant progeny testing combined with classic congenic
analysis to map quantitative trait loci (QTL) affecting physiologic dependence and found
a region that appears to encode for dependence on phenobarbitol and alcohol at the same
5cM interval of murine chromosome 4. A study by Pawlak, et al. (2005) shows that
tissue plasminogen activator (tPA), which is implicated in neuronal plasticity and
seizures and induced by limbic system, coincides with up-regulation of NMDA receptors
in chronic alcohol abuse. In their experiment, tPA deficient mice experience fewer
withdrawal seizures. Furthermore, tPA facilitated seizures are abolished by NR2B –
NMDA antagonist infenprodil; they conclude that tPA mediates addiction to ethanol. It
is probably more accurate to say that tPa mediates the upregulation response of NMDA
receptors to alcohol abuse. This group was one of very few that used liquid diet to
achieve addiction. Another was the group headed by Olive, et al. (2001) who showed
that protein kinase c-epsilon null mice exhibit reductions in withdrawal seizure severity
and shorter recovery after establishing addiction; while this result shows a perhaps
lessened addiction, addiction does take hold, so more remains to be learned about the
course of biological events leading to addiction.
Several studies have implicated dopamine pathways. Lu et al. (2000) demonstrated that
alterations in striatal dopamine were necessary but not sufficient to predispose to
audiogenic seizures. Wrona, Han (1997) proposed that the activation of CYP2E1 yields

38
oxygen radicals which in turn produce tetrahydro-beta-carbolines, a potent neurotoxin,
which then results in the turnover of neurotransmitters such as dopamine and opioids.
They conclude that the subsequent interaction of all of these cause degeneration of
serotonergic pathways leading to addiction.
To summarize, glutamate, specifically NMDA receptors are implicated. (Chromosome 5
is most often mentioned in this context, with occasional discussion of 6 and 4.) TPA is
implicated, as is protein kinase-c, ROS, alpha-1 adrenoceptors, aldehyde dehydrogenase,
(ALDI,ALDII) alcohol dehydrogenase, (ADHIB,ADHIC) the 5cM interval of murine
chromosome 4, CYP4502E and human gene 5q34. Clearly, much has been discovered
about the genetics of addiction using mouse models, but a model using liquid diet may be
expedient for many other genetic discoveries and treatments of both addiction and its
effects on other organs, particularly the liver.
The liquid diet model was used in the mouse experiments to determine whether mouse
livers would respond as had those of rats, i.e. whether fatty liver would result from a
high-fat diet with ethanol; it was observed both visually and through wet liver analysis
that results are similar. However, mice do not appear to tolerate alcohol as readily as
rats, although they do end up consuming at least as much per kilogram of body weight.
Rats tended not to gain weight as rapidly as controls; mice lose weight on the diet and
could not be maintained as long as rats without significant mortality. Recent work by
Anji and Kumari (2008) has shown that not only does supplementing the liquid diet with
chow result in significant reductions in weight loss, it actually increase alcohol
consumption and higher blood alcohol levels.

39
Also of interest was whether mice would experience alcohol withdrawal seizures after
one or two weeks consuming between 12 and 20 g alcohol per kg body weight; first
audiogenic (key jingling) seizures were attempted followed by handling seizures using
the tail-spin method described by Farook, et al (2008).
Hypothesis: Mice will develop steatosis in a manner similar to that of rats.
Specific Aims: In the interest of measuring the effect of high-fat diet with alcohol,
liquid diet supplemented with alcohol would be administered, and then liver fat and
withdrawal seizures would be measured.
To determine whether antioxidants would affect either liver fat or withdrawal
outcome, Vitamin E, (lipid and water soluble) and DPPD would be administered
and followed by analysis of withdrawal and neurochemistry.
Materials and Methods: Mouse studies
Animals
Male C57 mice, 5-6 weeks of age, were obtained from Jackson Laboratories in Bar
Harbor, Maine. Mice were singly housed and maintained according to the National
Institute of Health Guide for the Care and Use of Laboratory Animals in a humidity and
temperature controlled room. The cycle of 12 hours light/dark began at 7:00 PM. The
procedures were approved by the Institutional Review Board at Rutgers University.
Diet:
Animals were given isocaloric alcohol-free or alcohol-containing liquid diet varying in
fat and carbohydrate. Diets for all experiments included, per kg: 42.0 g casein, (with the

40
exception of the soy protein diet) 0.6 g DL-methionine, 7.3 g salt mix, 2.1 g vitamin mix,
0.4 g choline bitartrate, 1.0 g cellulose, 3.0 g xanthan gum, 0.254 g sodium saccharin, and
25.0 g sucrose. In addition to these ingredients, varying amounts of corn oil,
maltodextrin, ethanol and water were added to result in diets matched for energy content
(4906-4985 kJ/kg). The high-fat, low-carbohydrate diets were designed such that 8% of
the dietary energy was in the form of carbohydrate, while low-fat, high-carbohydrate
diets were adjusted such that 8% of dietary energy was provided in the form of fat. In all
cases, the diets were prepared daily and provided ad libitum in bottles designed to
minimize spillage, starting at 7:00 am. The diets were administered for varying times, as
indicated for each experiment (Nolan, et al. 2005).
Experiment 1: Alcohol Dosage
It was necessary to determine a safe method of administering alcohol to mice wherein
weight loss is minimized but alcohol consumption per kg body weight is maximized as
this is essential to establishing addiction. After 3 days of acclimatization on chow and
then 3 days on alcohol-free liquid diet, 14 mice were given alcohol in the high-fat version
of the diet. Of the 14 mice given alcohol, 7 were given 4%, and the remaining 7 were
given 6%. Alcohol-free high-fat liquid diet was used for controls. Animals were
sacrificed after one week and liver was taken for fat analysis.
For liver fat analysis, duplicate pieces of liver, weighing between 200 and 400 mg, were
cut up and homogenized in 10 mL of 2:1 chloroform/methanol solution. The resulting
homogenates were mixed for 15-second periods at 5-minute intervals for 30 minutes and

41
filtered. The filters were rinsed with another 5 mL of chloroform-methanol solution. 3
mL of a 0.84% potassium chloride solution were added to the filtrate to remove and
separate the water portion of the filtrate, followed by another 15 seconds mixing period
and a settlement period of 30 minutes. The aqueous layer was then siphoned off and
discarded, and the organic solvent layer was poured into pre-weighed aluminum dishes.
After overnight evaporation of the solvent under a hood, the residual lipid was weighed
and percent lipid as liver fat was calculated using the weight of the initial sample.
Experiment 2: High-fat vs. High-carbohydrate Diet
Earlier work involving rats established that a high-fat, low-carbohydrate diet would result
in robust increases in liver fat when combined with alcohol (Fisher, et al 2002, Martin et
al. 2004). In the interest of further developing mouse models comparable to the rat
models discussed earlier, we undertook an experiment in which, after 3 days of
acclimatization on chow and then 3 days on alcohol-free liquid diet, 15 mice were fed a
high-carbohydrate, low-fat diet, and 15 were fed a high-fat, low-carbohydrate diet. Of
these, subsets of eight in each group received 4.5% alcohol. After two weeks, diet was
removed from cages and beginning at one hour post-feeding, animals were tested for
(audiogenic) withdrawal seizures. None were observed in a five hour period. Animals
were then sacrificed and livers were taken for fat analysis. Mice fed the high-fat diet
with alcohol had significantly higher liver fat than controls; no other significant
differences were observed.

42
Experiment 3: Antioxidants
Earlier work established protection by one antioxidant (DPPD) with regard to liver fat but
an exacerbation of the condition when large doses of vitamin E were combined with a
high-fat diet + ethanol (Nolan et al 2005). In the interest of determining the effects of
various anti-oxidants on steatosis and withdrawal seizures in mice, sixty eight-week old
C57 mice were divided into six groups of ten. One group serving as a control for liquid
diet continued to receive chow and water. Of the remaining five, which all received
high-fat liquid diet, four groups received alcohol; three of those groups were given either
DPPD, trollox, (water-soluble vitamin E) or alpha-tocopherol (fat-soluble Vitamin E);
this arrangement provided an anti-oxidant control and an alcohol control. Animals were
given alcohol in increments starting at 3.5% for three days, then 4 % for three days, then
5% for the remaining five days.
Table 8:
group High-fat Liquid diet (HFLD)
+alc +alc+DPPD +alc+trollox +alc+alpha tocopherol
Chow
1 X 2 X X 3 X X X 4 X X X 5 X X X 6 X
At the conclusion of the experiment, animals were tested for seizures. Then livers were
taken for liver fat analysis.
Experiment 4: Withdrawal Seizures
Rationale:

43
While previous studies showed some success with audiogenic and handling-induced
seizures, we had yet to firmly establish a time course for ethanol induced withdrawal
seizures. In the previous experiment, we removed alcohol and all diet at the point at
which it would have been replaced with fresh diet. However, it was considered that
animals had consumed most of their daily diet early in the feeding period, and that by
removing food 24 hours after placing it, the optimal time point for withdrawal was being
overlooked. Therefore, we opted to remove diet two hours after fresh diet had been
placed on cages, and then begin testing for seizures three hours later.
After 3 days of acclimatization on a chow diet, 30 mice were divided into three groups.
Group 1 was given the high-fat liquid diet without alcohol. Group 2 was given the high-
fat liquid diet with 3.5% alcohol, increasing incrementally to 4.5%.Group 3 remained on
a chow and water diet.
Seizure Assessment:
On the last day of the experiment, mice were given fresh diet at the beginning of their
dark cycle as usual. After two hours, all diet and water was removed. 3 hours later, blind
testing for seizures began, and all mice were tested for seizures every sixty minutes for
three hours (Farook, et al 2008; Wilson and Little, 1998).
Immediately following the last testing period, mice were sacrificed and livers were taken,
weighed and placed in liquid nitrogen for fat assay. In addition, frontal cortex, striatum,
hippocampus and cerebellum were taken for HPLC analysis.

44
Seizure testing:
Seizures were generated in these mice using the tail spin method beginning 3 hours after
removal of all food and water. Cages were turned and rearranged to render scoring blind.
Animals are gently held by the tail and lifted. If a seizure occurred upon tail lift, the
highest seizure score was given. If no seizure occurred at that point, animals were gently
spun 360 degrees.
Table 9:
HPLC:
Tissue was homogenized in 0.3 ml of 0.4 N perchloric acid with 0.1 mM ethylenediamine
tetraacetic acid (EDTA) to inhibit chemical breakdown. Homogenized samples were
centrifuged at 20,000 g for 20 minutes at 4˚ C and the supernatant frozen in liquid
nitrogen until time of assay. Supernatant was assayed for serotonin, dopamine and their
metabolites using HPLC (Bioanalytical systems, West Lafayette, Indiana). The mobile
phase consisted of 0.1375 M sodium phosphate (dibasic) =0.0625 M citric acid, 5.0 mg
EDTA and 14% methanol with a flow rate of 0.7 ml/min.
Statistical Analysis:
Score Symptom 0 1 2 3 4
No activity on tail lift, or 360° spin Facial grimace or tonic convulsion after 360° spin Tonic/clonic convulsion after 360° spin Tonic/clonic convulsion after 360° spin lasting more than 3 seconds Tonic/clonic convulsion on tail lift itself

45
Data were subjected to one-way analyses of variance (ANOVA). After demonstration of
significant effects, Bonferroni post hoc comparison tests were used to determine the
significance of differences among groups. Results are presented as means ± standard
error of the mean.
Results: Mouse Studies
Experiment 1
Of the 14 mice given alcohol, 7 were given 4%, and the remaining 7 were given 6%.
Pronounced weight loss and mortality were observed in the 6% group immediately; it
was concluded that this amount was too high to administer, at least without incremental
increases. Liver fat was higher in the mice fed 4% alcohol when compared to controls;
there were not enough surviving subjects to test in the 6% group (Figure 1).
Experiment 2
Mice fed the high-fat diet with alcohol had significantly higher liver fat than controls; no
other significant differences were observed. No audiogenic seizures were observed in a
five hour period.
Table 10
*Treatment Alcohol Consumed per kg body weight
†Liver fat (%)
High-fat, low-carbohydrate 0 5.80±.48 High-fat, low-carbohydrate +4.5% alcohol
13.46±.38 8.36±.53a
High-carbohydrate, low-fat 0 4.89±.46

46
High-carbohydrate, low-fat +4.5% alcohol
15.96±.59 4.60±.48
*N=15 †Means in each column with different superscripts are significantly different at p<0.05 by Bonferroni’s multiple comparison test.
Experiment 3
Seizures were generated in these mice beginning 3 hours after removal of all food and
water using the tail spin method. There were no significant differences in seizures among
animals given alcohol but animals with DPPD showed a trend toward fewer seizures. No
seizures were seen in animals not given alcohol. There were no significant differences in
liver fat. However, the alpha-tocopherol group approached significantly high levels of
liver fat when compared to the chow group (p=0.08). It was also observed that animals
given a high-fat diet all exhibited higher liver fat than that of animals receiving chow.
Neurotransmitter levels showed no significant differences (Figure 4) but HVA appears to
be slightly higher in the striatum of mice that were given alcohol. In addition, mice that
were given alcohol had slightly lower levels of striatal serotonin and HIAA. MDA was
significantly higher in mice that consumed the high-fat diet + alcohol and the high-fat
diet + alcohol and DPPD than in all other groups (Figure 5).
Table 11
*Treatment †Liver fat (%) High-fat Liquid diet (HFLD) +alc 9.69±1.18 HFLD +alc+DPPD 12.96±2.40a
HFLD +alc+trollox 10.78±3.02 HFLD +alc+alpha tocopherol 10.87±1.94 HFLD 9.28±.95 Chow 7.97±0.69b

47
*HFLD+alc, N=6, HFLD+Alc+DPPD, N=4, HFLD+Alc+trollox, N=5, HFLD+alc+α-tocopherol, N=7, HFLD alone, N=10, pellet, N=8. †Means in each column with different superscripts are significantly different at p<0.05 by Bonferroni’s multiple comparison test.
Experiment 4:
All animals receiving alcohol in diet experienced withdrawal seizures between 3 and 5
hours after all food and fluid was removed from cages.
Mice experienced significant mortality on 4% alcohol in this experiment, and the
duration was shortened to avoid further loss. Body weights in mice receiving alcohol
were significantly lower than both other groups, as was overall liver weight. Of note is
that liver fat percent was not different in mice receiving alcohol when compared to other
groups.
Table 12
*Treatment Alc. Cons. (g/kg bw)
Body weight (g)
Liver weight (g)
Liver fat (%)
High-fat 20.42±.46a .83±.09a 9.01±.73 High-fat + alcohol
14.10±.75b .51±.06b 8.94±1.11
Chow 18.10±.44a .80±.05a 7.88±.32 *High-fat N=10, High-fat + alcohol N=7, Chow N=9 †Means in each column with different superscripts are significantly different at p<0.05 by Bonferroni’s multiple comparison test. Discussion:
Adult mice consume sufficient alcohol in high-fat liquid diet to establish addiction and
liver fat pathology. Furthermore, a high-fat liquid diet results in higher liver fat values
when combined with alcohol than does a high-carbohydrate diet. Mice given high-fat
diet with high doses of vitamin E, trollox and DPPD all showed higher liver fat values
than chow controls. However, only DPPD resulted in values that were significantly

48
higher. Of interest is that MDA was significantly reduced by Vitamin E and trollox to
levels of chow controls. However, DPPD in a high-fat diet with ethanol did not reduce
MDA; it was similar to animals fed high-fat diet with alcohol without added antioxidants.
The observation that a reduction in MDA by α-tocopherol when combined with alcohol
in a high-fat diet without a corresponding reduction in liver fat accumulation may lend
support to the argument put forth by Eduardo Porta (1997) that lipid peroxidation may be
at least in part unrelated to the development of fatty liver, based on their Vitamin-E
related reduction in TBARS in liver homogenates of alcohol-fed rats that was not
accompanied by a reduction in triglycerides.
Kovacic, Cooksy et al (2005) also propose a unifying theory for alcohol addiction and the
toxic properties of alcohol that involves aldehyde metabolism resulting in free-radical
formation. Based on their own work and reports by others, they hypothesize that
oxidative stress resulting from metabolites of alcohol are responsible for both the toxic
effects in liver and neural responses leading to addiction. (Kovacic and Cooksy, 2005;
Otsuka et al. 1996, 1999). In heavy drinkers, the induction of CYP2E1 generates
increased amounts of superoxide and hydrogen peroxide, resulting in oxidative stress,
which then leads to lipid peroxidation, conjugated dienes, and reduction in superoxide
dismutase and glutathione (Kovacic and Cooksy, 2005). In addition to this known
metabolic avenue, aldehyde side reactions resulting in diacetyl, acetoin and 2,3-
butanediol occur when alcohol is consumed in large amounts or when there is a lack of
availability of alcohol dehydrogenase. The second two products are reduction products,
but diacetyl is a product of oxidation, and is in lower quantities than acetoin or 2,3-
butanediol (Montgomery, et al. 1993; Nakajima and Mitsuda 1984; Otsuka et al. 1996,

49
1999; Rutstein 1983). Kovacic and Cooksy postulate that diacetyl, with or without
reactive oxygen species, is a player in electron transport in the central nervous system
with regard to ion transport, neuromodulation, transcription and other molecular
processes that could play a role in addiction (Kovacic and Cooksy, 2005).
Kovacic appears to ascribe every addiction to oxidative stress; in this light, antioxidant
treatment is certainly relevant. However, as is demonstrated by results in the rat studies
described above, establishment of appropriate type and dosage is complicated and
necessary.
It was observed that younger mice generally did not tolerate alcohol as well as rats of
similar age. However, for a variety of reasons, they consume more grams/kilogram
(body weight) of alcohol when alcohol is given as the same percentage of diet. In other
words, young rats, (5-6 weeks of age) weighing an average of 200 grams, consume about
50 grams of liquid diet per day. At 4.5% alcohol, this works out to approximately 11.5
grams/kilogram body weight. Mice of similar age weigh approximately 20 grams, and
consume between 10-17 g liquid diet per day. At 4.5% alcohol, this can go as high as 22
grams/kilogram body weight. Mice rapidly begin to lose weight and eat less. Therefore,
it is necessary to begin with mice that are fully mature, weighing roughly 30 grams, and
add alcohol incrementally. Our last experiment demonstrated a clear addiction to
ethanol, as every animal experienced withdrawal seizures fairly soon after diet was
removed, but liver fat was lower than non-alcohol controls, probably due to an overall
failure to thrive and synthesize fatty acids. Indeed, You and Crabb (2004) point to a
variety of mechanisms for liver fat accumulation, one of which describes an ethanol-
induced increase in TNF-α secretion by adipose tissue that is accompanied by a reduction

50
in adiponectin. The response in liver to this chain of events begins with a reduction in
peroxisome proliferators activated receptor α (PPARα) activity, then a reduction in
PPARα target enzyme, which leads to a reduction in hepatic FFA (free fatty acid) β
oxidation. This particular mechanism of liver fat accumulation would likely be
confounded by a significant reduction in adipose tissue, which was a probable result in
mice that lost significant weight (as opposed to rats, which simply failed to gain weight
as rapidly as their non-ethanol consuming counterparts).
Future Direction:
Research in mouse models of alcohol consumption and addiction have proven abundantly
useful for a variety of reasons, not the least of which is the ability to investigate
differences in transgenic models. Mechanisms behind addiction and liver disease have
been uncovered, but many pathways to both remain unclear. Ob-/ob- mice have
elucidated much of the biological processes behind non-alcoholic steatosis, and tnf-α
knockouts have demonstrated, at least in part, a role for inflammation in liver
pathogenesis. Future investigation into metabolic processes using mice overexpressing a
variety of genes including SREBP-1, PPAR, CB1 and perhaps combinations would be of
use. While the work described here describes parameters for the murine liquid diet
model, including age and a time course for seizures as well as energy content, it would be
of use to investigate ways to improve this model so that developing mice could thrive;
young rats were used in the work of Fisher et al (2002), Martin et al (2004), and Nolan et.
al (2005) because the most robust differences in liver fat are observed in this age group.
Perhaps a reduction in alcohol percent resulting in higher volumes of diet and therefore
more g alcohol/kg bodyweight would be effective.

51
It was of interest that in mice, liver fat accumulation did not necessarily correspond with
MDA. Histological analysis of livers of mice given these treatments would yield
valuable information about the importance of oxidative stress in liver pathology, and
whether fatty liver is necessary for this to occur. In other words, reduction in fatty liver
may not necessarily completely protect animals from alcohol-induced liver damage such
as fibrosis, necrosis, cirrhosis and hepatocellular carcinoma.

52
References: Aleynik, S, Leo, MA, Aleynik, M, Lieber, CS. (2000) Polyenylphosphatidylcholine Protects against alcohol but not iron-induced oxidative stress in the liver. Alcoholism: Clin Exp Res. 24,2:196-206. American Institute of Nutrition. Report of the American Institute of Nutrition ad hoc committee standards for nutritional studies (1977) J Nutr. 107 1340-48. American Institute of Nutrition. Second Report of the American Institute of Nutrition ad hoc committee standards for nutritional studies (1980) J Nutr. 110 1726. Anji, A, Kumari, M. (2008) Supplementing the liquid alcohol diet with chow enhances alcohol intake in C57 BL/6 mice. Drug and Alcohol Dependence, Volume 97, Issues 1-2, 1 Pages 86-93 Ascencio, C, Torres, N, Isoard-Acosta F, Gomez-Perez, FJ, Hernandez-Pando R, Tovar AR (2004) Soy protein affects serum insulin and hepatic SREBP-1 mRNA and reduces fatty liver in rats. J Nutr. 134:522-9. Ascherio, A, Weisskopf, MG, O’Reilly, EJ, McCullough, ML, Calle, EE, Rodriguez, C, Thun, MJ (2004) Coffee consumption, gender, and Parkinson’s disease mortality in the cancer prevention study II cohort: The modifying effects of estrogen. American Journal of Epidemiology160:977-84. Ascherio, A, Zhang, SM, Hernan, MA, Kawachi, I, Colditz, GA, Speizer, FE, Willett, WC (2001) Prospective study of caffeine consumption and risk of Parkinson’s Disease in men and women. Annals of Neurology 50:56-63. Baio DL, Czyz CN, Van Horn CG (1998) Effect of chronic ethanol consumption on respiratory and glycolytic activities of rat periportal and perivenous hepatocytes. Arch Biochem Biophys 350(2): 193–200 Becker, U, Deis, A, Sorenson, TIA, (1996) Prediction of Risk of Liver Disease By Alcohol Intake, Sex, and Age-A Prospective Population Study. Hepatology 23:1025-9. Bradley, KA, Badrinath, S, Bush, K, Boyd-Wickizer, J, Anawalt, B (1998) Medical Risks for Women who Drink Alcohol. J Gen Int Med 13:627-639. Cammisotto PG, Bukowiecki LJ (2002) Mechanisms of leptin secretion from white adipocytes. Am J Physiol Cell Physiol 283(1): C244–C250 Conney, AH, Zhou, S., Lee, M-J, Xie, J.G., Yang, CS, Lou, Y.R., Lu, Y (2006) Stimulatory effect of oral administration of tea, coffee or caffeine on UVB-induced apoptosis in the epidermis of SKH-1 mice. Toxicol. Appl. Pharmacol. 1-5.

53
Critical reviews in food science and nutrition, (2006)46:101-123. Denadai BS (1994) Effect of caffeine on the metabolism of rats exercising by swimming. Braz J Med Biol Res27(10): 2481–85 Duruibe V, Tejwani GA (1981) The effect of ethanol on the activities of the key gluconeogenic and glycolytic enzymes of rat liver. Mol Pharmacol, 20(3): 621–30 Ercan-Fang NG, Nuttall FQ, Gannon MC (2001) Uric acid inhibits liver phosphorylase-a activity under simulated in vivo conditions. Am J Physiol Endocrinol Metab280(2): E248–E253
Farook, JM, Krazem, A, Lewis, B, Morrell, DJ, Littleton, JM, Barron, S (2008) Acamprosate attenuates the handling induced convulsions during alcohol withdrawal in Swiss Webster mice. Physiology and Behavior 95 267-270. Fehr, C., R. L. Shirley (2002). Congenic Mapping of Alcohol and Pentobarbital Withdrawal Liability Loci to a <1 Centimorgan Interval of Murine Chromosome 4: Identification of Mpdz as a Candidate Gene. 22: 3730-3738. Fisher H, Halladay A, Ramasubramaniam N, Petrucci, JC, Dagounis, D, Sekowski, A, Martin, JV, Wagner, GC (2002) Liver fat and plasma ethanol are sharply lower in rats fed ethanol in conjunction with high-carbohydrate compared with high-fat diets. J Nutr 132(9):2732–36. Fisher H, Yu YL, Sekowski A, Wagner, GC (1996) Diet composition, alcohol utilization, and dependence. Alcohol 13(2): 195–200. Fisher, H, Halladay A, Yu, YL. Alcohol utilization and dependence with special reference to protein level in a liquid diet for rats. Alcohol 1997, 14(2):199-202. Fletterick RJ, Madsen NB: The structures and related functions of phosphorylase-a Annual Rev Biochem, 1980; 49: 31–61
Fredholm, B.B., Battig, K., Holman, J., Nehlig, A., Zvartau, E.E. Action of caffeine in the brain with special reference to factors that contribute to its widespread use. Pharmacological Reviews(1999) 51:83-133
French SW: Nutrition in the pathogenesis of alcoholic liver disease. Alcohol, 1993; 28(1): 97–109 Frezza, M, DiPadova, C, Pozzato, G, Terpin, M, Baraona, E, Lieber, CS (1990) High Blood Alcohol Levels in Women. The Role of Decreased Gastric Alcohol Dehydrogenase Activity and First-Pass Metabolism. N. Eng. J. Med 322(2):95-9. Gelatti, U, Covolo, L, Talamini, R, Tagger, A, Barbone F, Martelli, C, Cremaschini F, Franceschi, S, Ribero, ML, Garte, S, Nardi, G, Donadon, V, Donato V(2005) F N-

54
acetytransferase-2, glutathione S-transferase M1 and T1 genetic polymorphisms, cigarette smoking and hepatocellular carcinoma: a case-control study. Int J Cancer 115(2):301-6. Gilman, AG, Goodman, LS, Rall, TW, Murad F (eds) (1985) Goodman and Gilman’s The Pharmacological Basis of Therapeutics Macmillan, NY 7th edition p. 1673. Greenland, S (1993) A Meta-Analysis of coffee, Myocardial Infarction, and Coronary Death.Epidemiology 4:366-74. Guthrie GD, Myers KJ, Gesser EJ, White GW, Koehl JR (1990) Alcohol as a nutrient: interactions between ethanol and carbohydrate. Alcohol Clin Exp Res 14(1): 17–22
Halldner, L, Aden, U, Dahlberg, V, Johansson, B, Ledent, C, Fredholm, B (2004) The adenosine A1 receptor contributes to the stimulatory, but not the inhibitory effect of caffeine on locomotion: a study in mice lacking adenosine A1 and/or A2 receptors. Neuropharmacology 46:1008-1017
Hartmann, M., Czok, GZ (1980) Pharmacokinetics of caffeine in mice and its modification by ethanol Ernahrungswiss 19:215-27 Higdon, J.V, Frei, B (2006) Coffee and Health: A Review of Recent Human Research. Critical Reviews in Food Science and Nutrition 46:101-123 Hongu, N, Sachan, DS (2000) Caffeine, carnitine and choline supplementation of rats decreases body fat and serum leptin concentrations as does exercise. J Nutr. 130(2):152-157 Horrigan, LA, Kelly, JP, Connor, TJ (2006) Immunomodulatory Effects of caffeine: Friend or Foe? Pharmacology and Therapeutics. 11(3)877-92. Hotamisligil, GS, Shargill, NS, Spiegelman, BM (1993) Adipose Expression of Tumor Necrosis Factor Alpha- Direct Role in Obesity Resistance. Science 259:87-91. Howell AB, Leahy M, Kurowska E, Guthrie N (2001) In vivo evidence that cranberry proanthocyanidins inhibitadherence of p-fimbriated E. coli bacteria to uroepithelial cells. FASEB J 15:A284. Howell AB (2002) Cranberry proanthocyanidins and the maintenance of urinary tract health. Crit Rev Food Sci Nutr. 42(Suppl.):273 -8. Howell, AB, Foxman, B (2002) Cranberry juice and adhesion of antibiotic-resistant uropathogens. JAMA, 287:3082. Inoue, M, Yoshimi, I, Sobue, T, Tsugane, S (2005) Influence of Coffee Drinking on Subsequent Risk of Hepatocellular Carcinoma: A Prospective Study in Japan. Jacobsen BK, Bjelke, E, Kvale G, Heuch, I (1986) Coffee Drinking, Mortality and Cancer Incidence: results from a Norwegian prospective study. J Natl Cancer Inst. 76(5):823-31.

55
James, JE (2004) Critical Review of Dietary caffeine and Blood pressure: A relationship that should be taken more seriously. Psychosom. Med 66:63-71.
James, JE (1990) The Influence of user Status and Anxious Disposition on the Hypertensive Effects of caffeine. Int. J. Psychophys. 10:171-9.
Jeong, WI, D. Osei-Hyiaman, Park O, Liu J, Bátkai S, Mukhopadhyay P, Horiguchi N, Harvey-White J, Marsicano G, Lutz B, Gao B, Kunos G. (2008). "Paracrine Activation of Hepatic CB1 Receptors by Stellate Cell-Derived Endocannabinoids Mediates Alcoholic Fatty Liver." Cell Metabolism 7(3): 227-235. Ji, C, Shinohara, M, Vance, D, Than, TA, Oookhtens, M, Chan, C, Kaplowitz, N (2008) Effect of Transgenic Extrahepatic Expression of Betaine-Homocysteine Methyltransferase on Alcohol or Homocysteine-Induced Fatty Liver. 32: 1049-1058. Julien RM (2000) Ethyl alcohol and the inhalants of abuse. In: A Primer of Drug Action. Portland, Oregon, Worth Publishers.
Kanda,T, Jackson.MJ, Smith, LA, Pearce,RKB,Nakamura, J, Kase, H, Kuwana,Y, Jenner, P (2000) Combined Use of the Adenosine A2A Antagonist KW-6002 with -DOPA or with Selective D1 or D2 Dopamine Agonists Increases Antiparkinsonian Activity but Not Dyskinesia in MPTP-Treated Monkeys Experimental Neurobiology 321-327
Karatzis, E, Papaioannou, TG, Aznaouridis, K, Karatzi, K, Stamateloupolos, K, Zampelas, A (2005) Acute Effects of Caffeine on Blood Pressure and Wave Effects in Healthy Subjects: Should We consider Monitoring Central Blood Pressure? Int. J. Cardiology 98:435-30.
Kasvinsky PJ, Fletterick RJ, Madsen NB (1981) Regulation of the dephosphorylation of glycogen phosphorylase a and synthase b by glucose and caffeine in isolated hepatocytes. Can J Biochem 59(6): 387–95
Kasvinsky PJ, Shechosky S, Fletterick RJ (1978) Synergistic regulation of phosphorylase-a by glucose and caffeine. J Biol Chem 253(24): 9102–6. Kawachi, I, Colditz, GA, Stone, CB (1994) Does Coffee Drinking Increase the Risk of Coronary Heart Disease? Results from a Meta-Analysis. Br. Heart J. (1994) 269-75.
Keppler D, Decker K (1974) Glycogen. In: Bergmeyer HU, Grassl M, editors. Metabolites 1: Carbohydrates. Basel: Verlag Chemie, 11–18
Kiselevski Y, Oganesian N, Zimatkin S, Szutowicz A, Angielski S, Niezabitowski P, Uracz W, Gryglewski RJ (2003) Acetate metabolism in brain mechanisms of adaptation to ethanol. Med Sci Monit 9(5): BR218– BR222.

56
Kourourian, S, Hakkak, R, Ronis, MJ, Shelnut, SR, Waldron, J, Ingelman-Dundberg, M, Badger, TM (1999) Diet and risk of ethanol-induced hepatotoxicity: carbohydrate-fat relationships in rats. Toxicol. Sci. 47(1):110-117. Kovacic P, Cooksy AL (2005) Role of diacetyl metabolite in alcohol toxicity and addiction via electron transfer and oxidative stress. Archives of Toxicology 79(3)123-128. Kovacic, P. and A. L. Cooksy (2005 Unifying mechanism for toxicity and addiction by abused drugs: electron transfer and reactive oxygen species. Medical Hypotheses 64(2): 357-366. Kurozawa Y, Ogimoto, I, Shibata, A, Nose, T, Yoshimura, T, Suzuki, H, Sakata, R, Fujita, Y, Ichikawa, S, Iwai, N, Tamakoshi, A, JACC Study Group(2005) Coffee and risk of death from hepatocellular carcinoma in a large cohort study in Japan. Br J Cancer 93(5):607-10. Lieber CS, Jones DP, DeCarli LM (1965) Effects of prolonged ethanol intake: Production of fatty liver despite adequate diets. J Clin Invest 44:1009–21. Lieber CS, DeCarli, LM (1994) Animal models of chronic ethanol toxicity, in Methods in Enzymology: Oxygen radical in Biological Systems. (Packer L ed) Part C vol 233 Academic Press, Orlando 585-94. Lieber, CS, Leo, MA, Aleynik, SI, Aleynik, MK, DeCarli, LM (1997) Polyenylphosphatidyl-choline decreases alcohol-induced oxidative stress in baboons Alc Clin Res 21:375-79. Lieber CS (1997) Cytochrome P-4502E1: its physiological and pathological role. Physiol. Rev., 77(2)517:44. Liu JZ, Zhang BZ, Milner JA(1994) Dietary selenite modifies glutathione metabolism and 7, 12 dimethylben-(a)anthracene conjugation in rats. J Nutr. 124:172- 80. Lu Y, Fisher H, Wagner GC (2000) Monoaminergic changes associated with audiogenic seizures in ethanol-dependent rats. Progress in Neuro-Psychopharmacology and Biological Psychiatry 24(8) 1379-1392. Lu YP, Lou YR, Xie JG, Peng QY, Liao J, Yang CS Huang MT, Conney AH (2002) Topical applications of caffeine or (-)- epigallocatechin gallate (EGCG) inhibit carcinogenesis and selectively inhibit apoptosis in UVB-induced skin tumors in mice. Proc Natl Acad Sci. U S A 99:12455- 60.
Lu, Y-P., Nolan, B., Lou, Y-R, Peng, Q-Y, Wagner, G.C., Conney, A.H (2007) Voluntary exercise together with oral caffeine markedly stimulates UVB light-induced apoptosis and decreases tissue fat in SKH-1 mice. Proceedings National Academy of Sciences 104(31)12936-41.
Ma X, Zhao, J, Lieber, CS (1996) Polyenylphosphatidyl-choline attenuates non-alcoholic hepatic fibrosis and accelerates its regression J Hepatol 24: 604-13.

57
Madsen NB, Shechosky S, Fletterick RJ(1983) Site-site interactions in glycogen phosphorylase- b probed by ligands specific for each site. Biochemistry 22(19): 4460–65
Mahmud, A and Feely, J (2001) Acute Effect of Caffeine on Arterial Stiffness and aortic Pressure Waveform. Hypertension 38:227-31.
Mally, J., Stone, T.W. (1996) The effect of theophylline on in parkinsonian symptoms. Journal of Pharmacy and Pharmacology. 46:515-517.
Marshall, AW, Kingstone, D, Boss, M, Morgan, MY(1983) Ethanol Elimination in Males and Females: Relationship to Menstrual Cycle and Body Composition. Hepatology 3:701-6. Martin JV, Nolan B, Wagner GC, Fisher H (2004) Effects of dietary caffeine and alcohol on liver carbohydrate metabolism in rats. Med Sci Monit 24:10 BR455-61. Martin WH, Hoover DJ, Armento SJ Armento SJ, Stock IA, McPherson RK, Danley DE, Stevenson RW, Barrett EJ, Treadway JL (1998) Discovery of a human liver glycogen phosphorylase inhibitor that lowers blood glucose in vivo. Proc Natl Acad Sci USA, 95(4): 1776–81 Matterson LD (1955) The effect of incorporating diphenyl-p-phenylenediamine (DPPD) into a ration containing various levels of vitamin A from fish oils. Poult Sci. 34:1080-4.
McCusker, RR, Goldberger, BA, Cone, EJ (2003) Caffeine Content of Specialty Coffees. J. Anal. Toxic 27:520-522.
Michna L, Lu YP, Wagner GC, Conney AH (2003). Stimulatory effect of green tea and caffeine on locomotor activity in SKH-1 mice. Life Sci. 73:1383- 92. Mirovsky, Y, Yu, YL, Wagner, GC, Sekowski, A, Goldberg, M, Fisher, H (1995) Novel Synergistic Treatment of ethanol withdrawal seizures in rats with dopamine and serotonin agonists. Alcohol Clin Exp Res. 19:160-3. Monson WJ, Gade ET, Lloyd MD, Groschke AV (1957) Utilization of Vitamin A activity from alfalfa or fish oil by chicks receiving diets with and without diphenyl-p-phenylenediamine. Poult Sci. 36:166- 70. Montgomery JA, David F, Garneau M, Brunengraber H (1993) Metabolism of 2:3-butanediol in the perfused rat liver. J Biol Chem 268:20185–20190 Moon, HS, Lee, HG, Seo, JH, Chung, CS, Kimd, TG, Choi, YJ, Cho, CS (2008) obesity effect of PEGylated conjugated linoleic acid on high-fat diet-induced obese C57BL/6J (ob/ob) mice: attenuation of insulin resistance and enhancement of antioxidant defenses.The Journal of Nutritional Biochemistry In Press, Corrected Proof.

58
Nakajima K, Mitsuda H (1984) Possibility of diacetyl and related compounds as the 4-carbon compound necessary for the formation of riboflavin in Ashbya gossypii. Acta Vitaminol Enzymol 6:271–282 Nanji AA, Fogt F, Griniuviene B (1995) Alterations in glucose transporter proteins in alcoholic liver disease in the rat. Am J Pathol 146(2): 329–34 Nau, H (1986) Environ. Health Perspec 70:113-29.
Nehlig, A, Daval, JL, Debry, G (1992) Caffeine and the central nervous system: mechanisms of action, biochemical, metabolic, and psychostimulant effects. Brain Research Reviews 17:139-170.
Nkondjock, A, Ghadirian, P, Kotsopoulos, J, Lubinski, J, Lynch, H, Kim-Sing C, Horsman, D, Rosen, B, Isaacs, C, Weber, B, Foulkes, W, Ainsworth, P, Tung, N, Eisen, A, Friedman, E, Eng, C, Sun, P, Narod, SA (2006) Int J Coffee Consumption and Breast Cancer Risk Among BRCA1 and BRCA2 Mutation Carriers.Cancer 118(1):103-7. Nolan, B, Hess, M, Howell, A, Martin, JV, Wagner, GC and Fisher, H (2005) High levels of vitamin E and selenium significantly elevate liver fat while diphenyl-para-phenylene diamine, in combination with caffeine, significantly lowers it in rats fed alcohol-containing, high-fat diets. Nutrition Research 25, 701-709.
Noll F: L-(+)-Lactate. In: Bergmeyer HU, Grassl M, eds (1974) Metabolites1: carbohydrates. Basel: Verlag Chemie, 582–88 Olive MF, Mehmert KK, Nannini MA, Camarini R, Messing RO, Hodge CW (2001) Reduced ethanol withdrawal severity and altered withdrawal-induced c-fos expression in various brain regions of mice lacking protein kinase c-epsilon. Neuroscience 103(1):171-179 Otsuka M, Mine T, Ohuchi K, Ohmori S (1996) A detoxication route for acetaldehyde: metabolism of diacetyl, acetoin, and 2:3-butanediol in liver homogenate and perfused liver of rats. J Biochem (Tokyo) 119:246–251
Otsuka M, Harada N, Itabashi T, Ohmori S (1999) Blood and urinary levels of ethanol, acetaldehyde, and C4 compounds such as diacetyl, acetoin and 2:3-butanediol in normal male students after ethanol ingestion. Alcohol 17:119–124 Pawlak R, Melchor J, Matys T, Skrzypiec A, Strickland S (2005) Ethanol-withdrawal seizures are controlled by tissue plasminogen activator via modulation of NR2B-containing NMDA receptors. PNAS 102(2):443-448. Reunanen, A, Heliovaara, M, and Aho, K (2003) Coffee Consumption and Risk of Type 2 Diabetes Mellitus. Lancet 361:702-3.

59
Ross, GW, Abbott, RD, Petrovitch, H (2000) Association of coffee and caffeine intake with the risk of Parkinson’s Disease. Jama 283:2674-79. Rutstein DD, Veech RL, Nickerson RJ, Felver ME, Vernon AA, Needham LL, Kishore P, Thacker SB (1983) 2,3-Butanediol: an unusual metabolite in the serum of severely alcoholic men during acute intoxication. Lancet II:534–537 Sachan DS, Hongu N (1999) A combination of caffeine, carnitine, choline and exercise decreases serum leptin, body weight/fat. FASEB J 13(5): A908. Sachan DS, Hongu N (2000) Increases in VO(2)max and metabolic markers of fat oxidation by caffeine, carnitine, and choline supplementation in rats. J Nutr Biochem 11(10): 521–26. Sachan, DS, Hongu, N (1999) A combination of caffeine, carnitine, choline and exercise decreases serum leptin, bodyweight/fat. FASEB J. 13(5):A908. Salazar-Martinez, E., Willett, W.C., Ascherio, A., Manson JE, Leitzmann MF, Stampfer MJ, Hu FB (2004) Coffee Consumption and risk for type 2 Diabetes Mellitus. Ann. Intern. Med. 14:1-8.
Smith, B, Gupta, U, Gupta, BS (2007) Eds Caffeine and Activation Theory: effects on health and Behavior CRC Press, Taylor and Francis Group, Boca Raton.
Sozio, M and Crabb, DW (2008) Alcohol and lipid metabolism. Am J Physiol Endocrinol 295: E10 - E16.
SS Starcher, B (2000) Role for Tumour Necrosis Factor-alpha Receptors in Ultraviolet-Induced SkinTumors. Br.J. Dermatol. 142(6):1140-7. Trayhurn, P, Wood, IS (2004) Adipokine: Inflammation and the Pleiotropic Role of white Adipose Tissue. British Journal of Nutrition 92:347-55. Tsukamoto H, Kaplowitz N (1996) Pathogenesis of alcoholic liver disease. In: Kaplowitz N, editor. Liver and Biliary Diseases. Baltimore:Williams and Wilkins 121–38. Van Dam, RM, and Freskens, EJ (2002) Coffee Consumption and Risk of Type 2 Diabetes Mellitus. Lancet 360:1477-8. Van Horn CG, Ivester P, Cunningham CC (2001) Chronic ethanol consumption and liver glycogen synthesis. Arch Biochem Biophys, 392(1):145–52. Walker JE, Gordon ER (1970) Biochemical aspects associated with an ethanol induced fatty liver. Biochem J 119(3): 511–16. Wilson, J and Little, HJ (1998) CCK(B) antagonists protect against some aspects of the ethanol withdrawal syndrome, Pharmacol Biochem Behav 59 pp. 967–973.

60
Winston GW, Reitz RC (1981) Effects of chronic ethanol ingestion on liver glycogen phosphorylase in male and female rats. Am J Clin Nutr 34(11): 2499–507 Winston GW, Reitz RC (1984) Effects of chronic ethanol ingestion on male and female rat liver glycogen phosphorylase phosphatase. Alcohol Clin Exp Res 8(3): 277–82. Yang R, Han X, Delude RL, Fink MP(2003) Ethyl pyruvate ameliorates acute alcohol-induced liver injury and infl ammation in mice. J Lab Clin Med 142(5): 322–31 Yin M, Wheeler MD, Kono H, Bradford BU, Gallucci RM, Luster MI, et al. (1999) Essential role of tumor necrosis factor a in alcohol-induced liver injury in mice. Gastroenterology 117:942- 52. Yoo, J.-S. H., S. M. Ning, et al. (1991) Regulation of Hepatic Microsomal Cytochrome P450IIE1 Level by Dietary Lipids and Carbohydrates in Rats. J.Nutr. 121: 959-965.
You, M. and D. W. Crabb (2004) Molecular mechanisms of alcoholic fatty liver: role of sterol regulatory element-binding proteins. Alcohol 34(1): 39-43.
61
Figure 1

62
Figure 2

63
Figure 3
Liver fatpe
rcen
t
0
2
4
6
8
10
12
14 *
Control 4% Alcohol

64
Figure 4
Neurochemistry - HPLC
pico
mol
es
0
2
4
6
8
10
12
14
16
18
20
alco noalc
Dopamine Dopac Serotonin HIAA HVA

65
Figure 5
MDA
Abs
orpt
ion
0
20
40
60
80
100
Alcohol +DPPD +Trolox +alpha-toc. no alc pellet
**
**

66
Figure 6:
Neurochemistrym
icro
gram
s N
T/g
tissu
e
0
2
4
6
8
10
12
14
16
18
20
hf hf+alc chow
Dopamine Dopac 5 HT 5 HIAA HVA
*

67
Figure 7
NT Turnoverm
etab
olite
/cat
echo
lam
ine
0.0
0.2
0.4
0.6
0.8
hf hf+alc chow
Dopac/DA HVA/DA 5HIAA/5HT
*
Fig 8

68
Liver Fat lip
id p
erce
nt
0
2
4
6
8
10
12
High fat High fat + ethanol Chow A B C
Whole liver weights
gram
s
0.0
0.2
0.4
0.6
0.8
1.0
High fat High fat + etoh Chow
Final Body Weight
aver
age
gram
s pe
r mou
se
0
5
10
15
20
25
High fat High fat + ethanol Chow
**
Liver Fat as Percent Body Weight
g liv
er fa
t/g b
ody
wei
ght
0.0
0.2
0.4
0.6
0.8**
High fat High fat + etoh Chow

69
Figure Captions:
Figure 1: Liver glycogen (A), glucose (B) and lactate (C) of groups of rats fed high-fat and high-carbohydrate diets with or without ethanol for two weeks (Experiment 1). F – low-carbohydrate and high-fat diet without ethanol; F+E – low-carbohydrate and high-fat diet with 4.5% ethanol; C – high-carbohydrate and low-fat diet without ethanol; C+E – high-carbohydrate and low-fat diet with 4.5% ethanol. Data are plotted as the group mean ±SEM (N=8). Bars with diff erent symbols (�,*) at the top are significantly different from each other at p<0.05 by Bonferroni’s Multiple Comparison Test.
Figure 2: Epididymal fat pad weight (A), liver glucogen (B), liver glucose (C), and liver fat (D) of groups of rats maintained on control diets and ethanol-containing diets with or without caffeine for 2–12 weeks (Experiment 3). Data are plotted as the group mean ± SEM (N=4). For each variable, bars with symbols (*) at the top are significantly different from others at the same time point at p<0.05 by Bonferroni’s MultipleComparison Test. Figure 3: Mice fed high-fat, low-carbohydrate liquid diet with 4% alcohol had significantly higher liver fat than those fed high-fat, low-carbohydrate diet without alcohol. Figure 4: There were no significant differences in neurochemistry. However, serotonin and its metabolites show a trend nearing significance. Figure 5: Alcohol alone and DPPD + alcohol result in liver MDA levels significantly higher than those of all other groups (p<0.05 by Bonferroni’s multiple comparison test). Figure 6: Animals consuming high-fat + etoh had significantly less homeovanillic acid, a metabolite of dopamine, than did mice consuming high-fat without alcohol or chow. Figure 7: NT turnover for serotonin was significantly higher on animals fed a high-fat diet without alcohol than it was for both other groups. Figure 8: High-fat and high-fat+ alcohol showed similar levels of liver fat accumulation. However, animals given a chow diet had lower levels of liver fat, though differences were not significant. A) Liver weights as a percent in animals given high-fat + etoh were not significantly different from other groups. B) Of note is that animals given high-fat + alcohol weighed 33% less than both other groups. C) Liver fat as a percent of total body weight was significantly higher in mice fed high-fat + alcohol than that of both high-fat and chow groups

70
Curriculum Vita Bonnie Nolan
Rutgers University, New Brunswick, NJ Psychology Major, English Minor 2002, Bachelor of Arts Rutgers University and UMDNJ, Piscataway, NJ Neuroscience 2003-2008 Rutgers University and UMDNJ, Piscataway, NJ Graduate Assistant 2003-2008 Teaching Experience: Advisor, Honors and Independent Studies 2003 - 2008 Publications: Martin, J.V., Nolan, B., Wagner, G.C. and Fisher, H. Effects of dietary caffeine on liver carbohydrate and fat in rats (2004) Medical Science Monitor BR455-461. Nolan, B., Hess, M., Howell, A., Martin, J.V., Wagner, G.C. and Fisher, H (2005) High levels of vitamin E and selenium significantly elevate liver fat while diphenyl-para-phenylene diamine, in combination with caffeine, significantly lowers it in rats fed alcohol-containing, high fat diets. Nutrition Research 25: 701-709. Lu, Y-P, Lou, Y-R, Nolan, B, Peng, Q-Y, Xie, J-G, Wagner, GC and Conney, AH (2006) Stimulatory effect of voluntary exercise or fat removal (partial lipectomy) on apoptosis in the skin of UVB-light irradiated mice. Proceedings of the National Academy of Science 103:16301-16306. Lu, Y-P, Nolan, B., Lou, Y-R, Peng, Q-Y, Wagner, G.C. and Conney, A.H (2007) Voluntary running wheel exercise together with oral administration of caffeine markedly decreases tissue fat and stimulates UVB light-induced apoptosis in SKH-1 mice. Proceedings of the National Academy of Science 104(31):12936-41. Ju, J, Nolan, B, Cheh, M, Bose, M, Lin, Y, Wagner, GC and Yang, CS. Inhibition of intestinal tumorigenesis in ApcMin/+ mice by voluntary exercise and its combination with -(-)epigallocatechin-3-gallate. American Association for Cancer Research, Boston, 2006. Lu, Y-P, Nolan, B., Lou, Y-R, Peng, Q-Y, Xie, J-G., Wagner, G.C. and Conney, A.H. Pronounced effect of voluntary running wheel exercise in combination with oral administration of caffeine to decrease tissue fat and increase UVB-induced apoptosis in the epidermis SKH-1 mice. American Association for Cancer Research, Boston, 2007.
71
Ju, J, Nolan, B, Cheh, M, Bose, M., Lin, Y, Wagner, GC and Yang, CS (2005) Voluntary Exercise Inhibits Intestinal Tumorigenesis in ApcMin/+ Mice and Azoxymethane/Dextran Sulfate Sodium-Treated Mice. BMC Cancer, 8:316doi:10.1186/1471-2407-8-316