Embed Size (px)
Citation preview
1
Bone Pathologies
o Bone Fracture and Bone Repairo Degenerative Changes Associated with Agingo Osteoporosis
- Trabecular Resorption - Singh Index
o Rickets and Osteomalacia o Osteopetrosis o Osteosarcoma (Bone Cancer)o Paget's Diseaseo Overuse Damage (Stress Fractures)o Considerations for Bioengineers
TOPICS
1
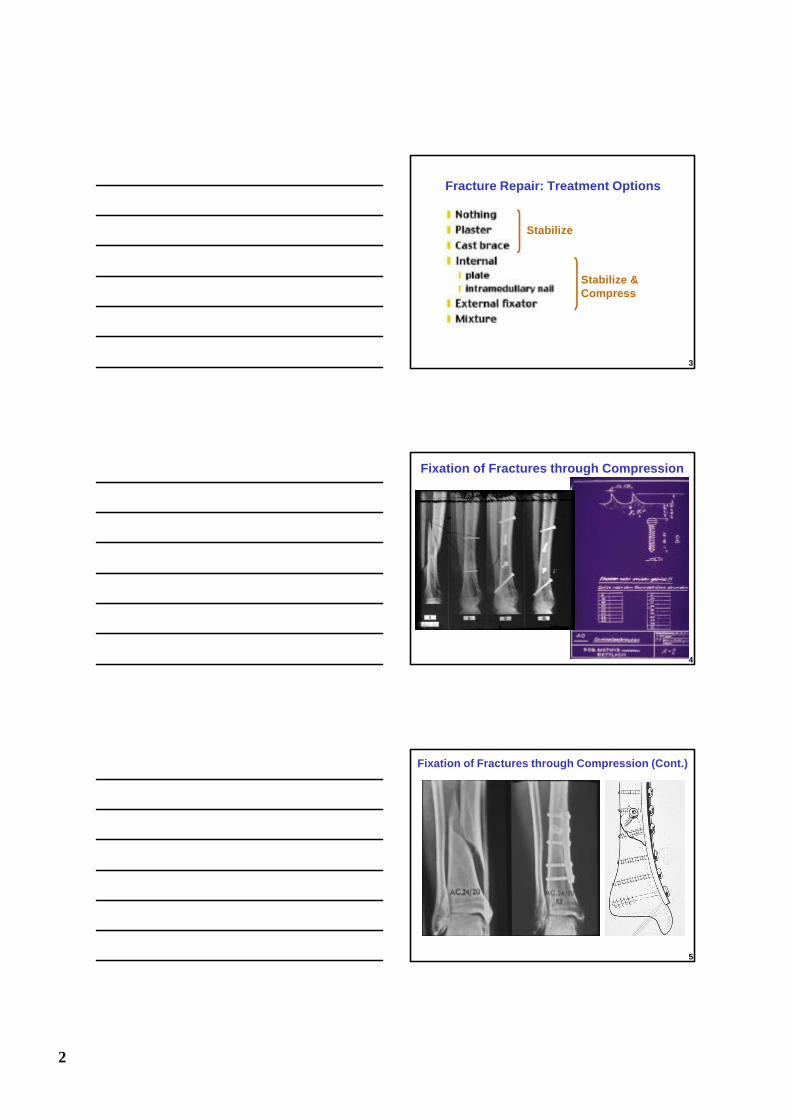
Bone Fracture and Bone Repair
A radiograph of a torsional bone fracture from a skiing accident.
2
2
3
Fracture Repair: Treatment Options
Stabilize
Stabilize & Compress
Fixation of Fractures through Compression
4
Fixation of Fractures through Compression (Cont.)
5
3
Fixation of Fractures through Compression (Cont.)
6
Fixation of Fractures through Compression (Cont.)
7
Fixation of a patellar fracture using wires
Fixation of Fractures through Compression (Cont.)
8
4
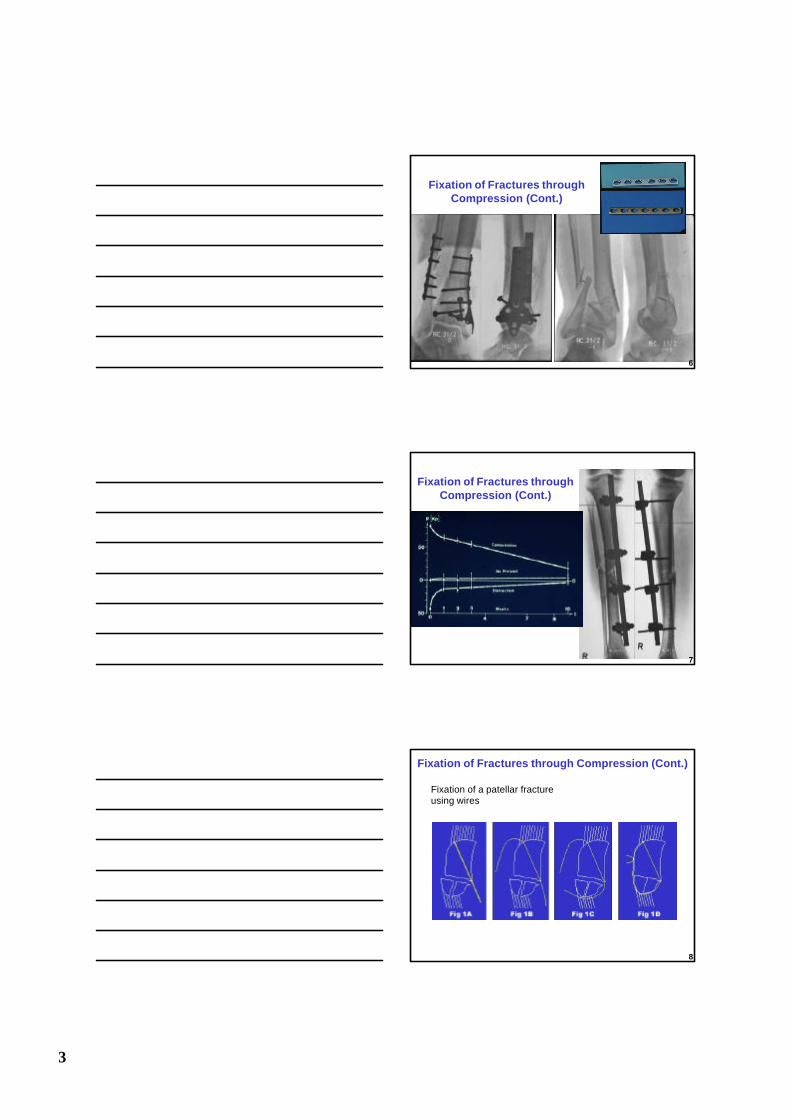
Effects of Aging on Bone Quality
Vertebral cross-sections from autopsy specimens of young (A) and old (B) bone show a marked reduction in trabecular bone in the later. Bone reduction with aging (C) is schematically depicted
9
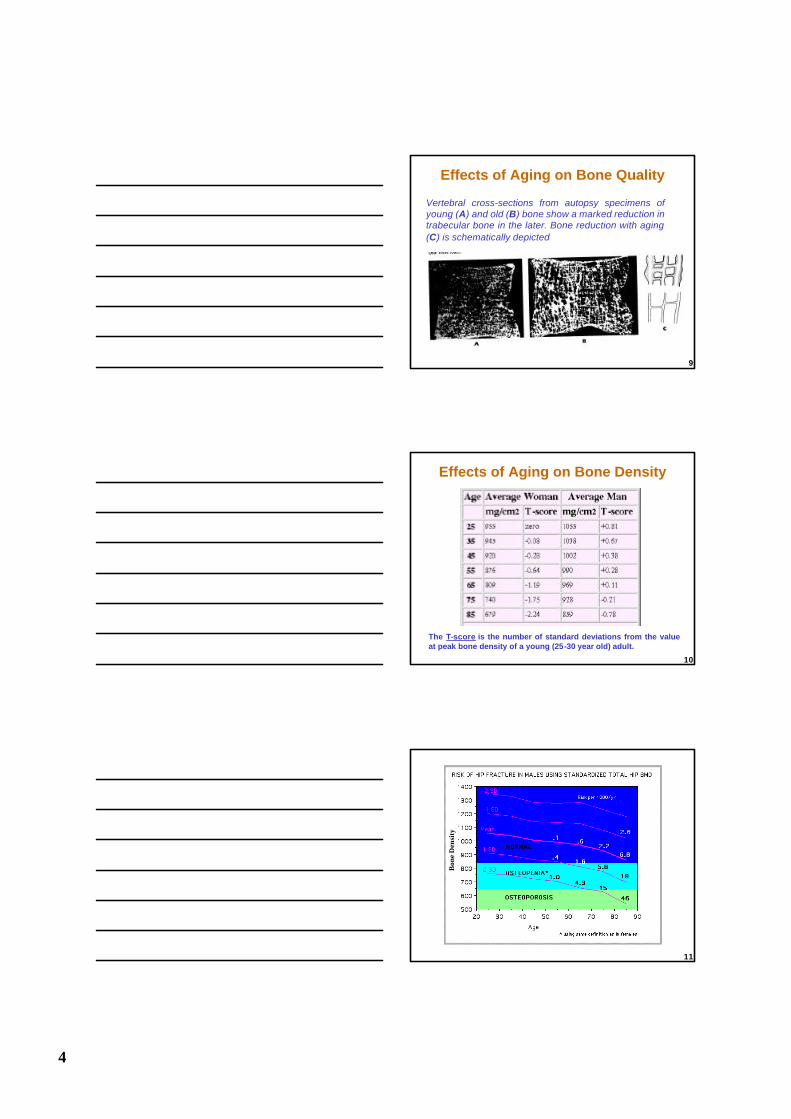
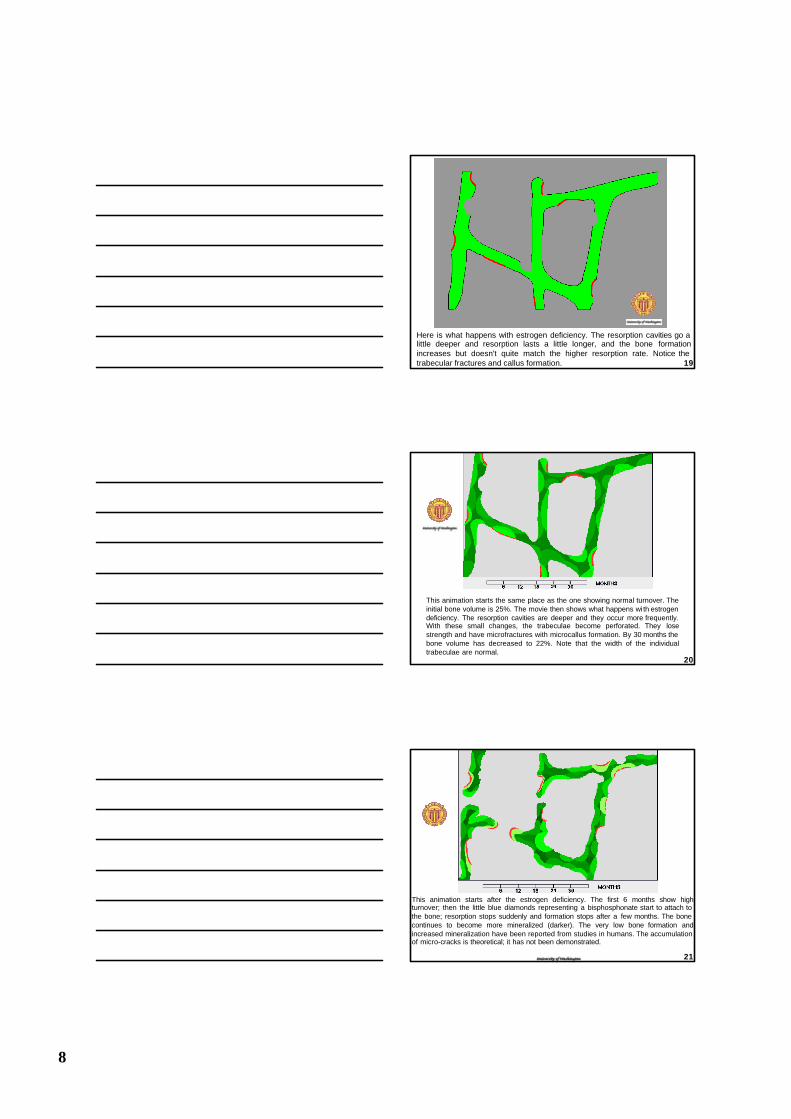
The T-score is the number of standard deviations from the value at peak bone density of a young (25-30 year old) adult.
Effects of Aging on Bone Density
10
Bon
e D
ensi
ty
11
5
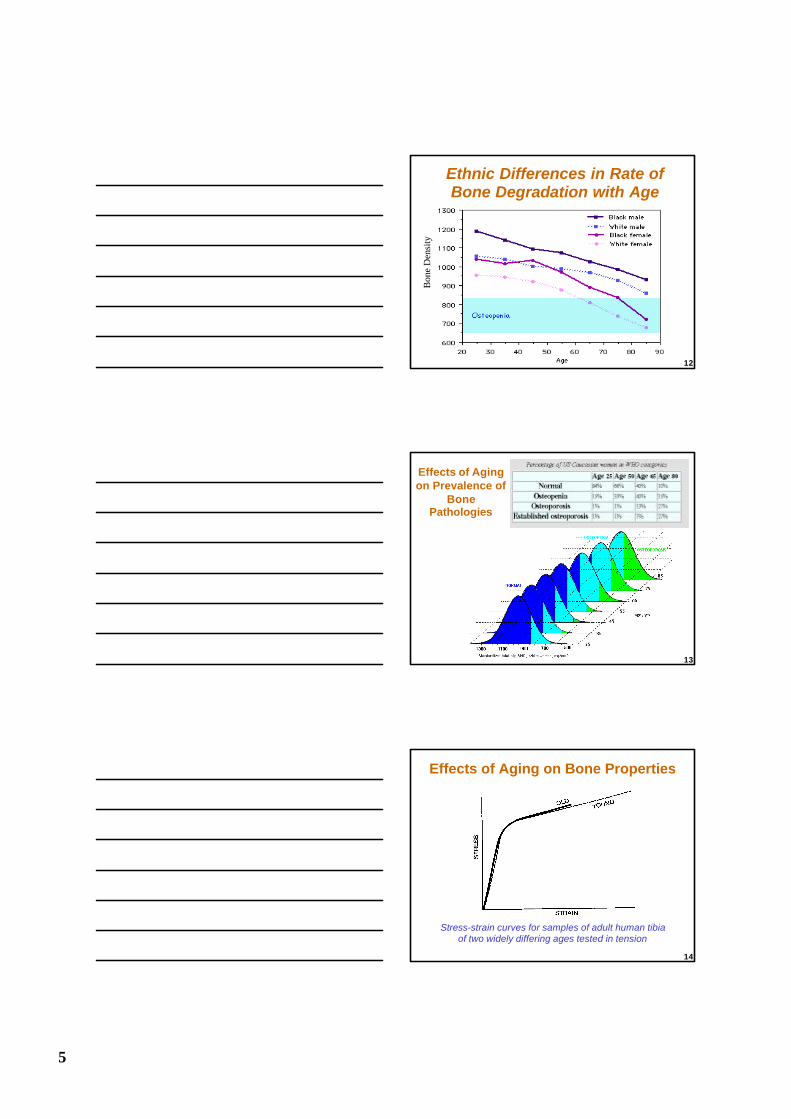
Ethnic Differences in Rate of Bone Degradation with Age
Bon
e D
ensi
ty
12
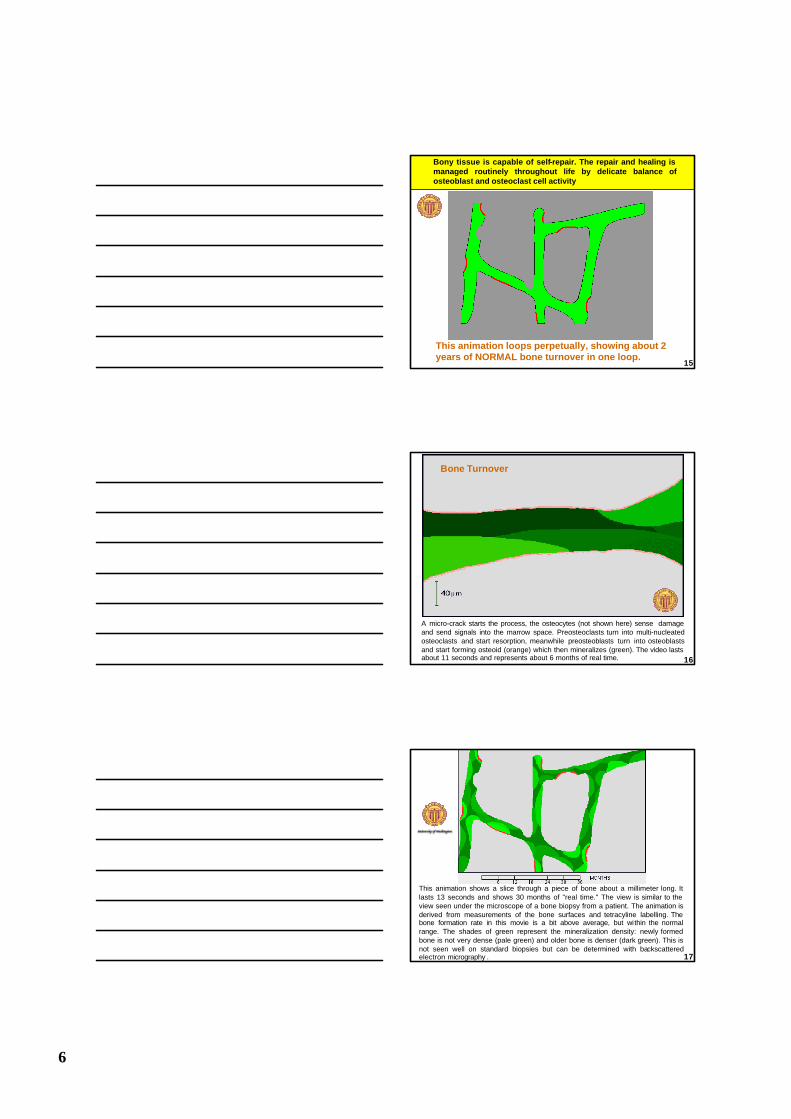
Effects of Aging on Prevalence of
Bone Pathologies
13
Stress-strain curves for samples of adult human tibia of two widely differing ages tested in tension
Effects of Aging on Bone Properties
14
6
This animation loops perpetually, showing about 2 years of NORMAL bone turnover in one loop.
Bony tissue is capable of self-repair. The repair and healing is managed routinely throughout life by delicate balance of osteoblast and osteoclast cell activity
15
A micro-crack starts the process, the osteocytes (not shown here) sense damage and send signals into the marrow space. Preosteoclasts turn into multi-nucleatedosteoclasts and start resorption, meanwhile preosteoblasts turn into osteoblastsand start forming osteoid (orange) which then mineralizes (green). The video lasts about 11 seconds and represents about 6 months of real time.
Bone Turnover
16
This animation shows a slice through a piece of bone about a millimeter long. It lasts 13 seconds and shows 30 months of "real time." The view is similar to the view seen under the microscope of a bone biopsy from a patient. The animation is derived from measurements of the bone surfaces and tetracyline labelling. The bone formation rate in this movie is a bit above average, but within the normal range. The shades of green represent the mineralization density: newly formed bone is not very dense (pale green) and older bone is denser (dark green). This is not seen well on standard biopsies but can be determined with backscattered electron micrography . 17
7
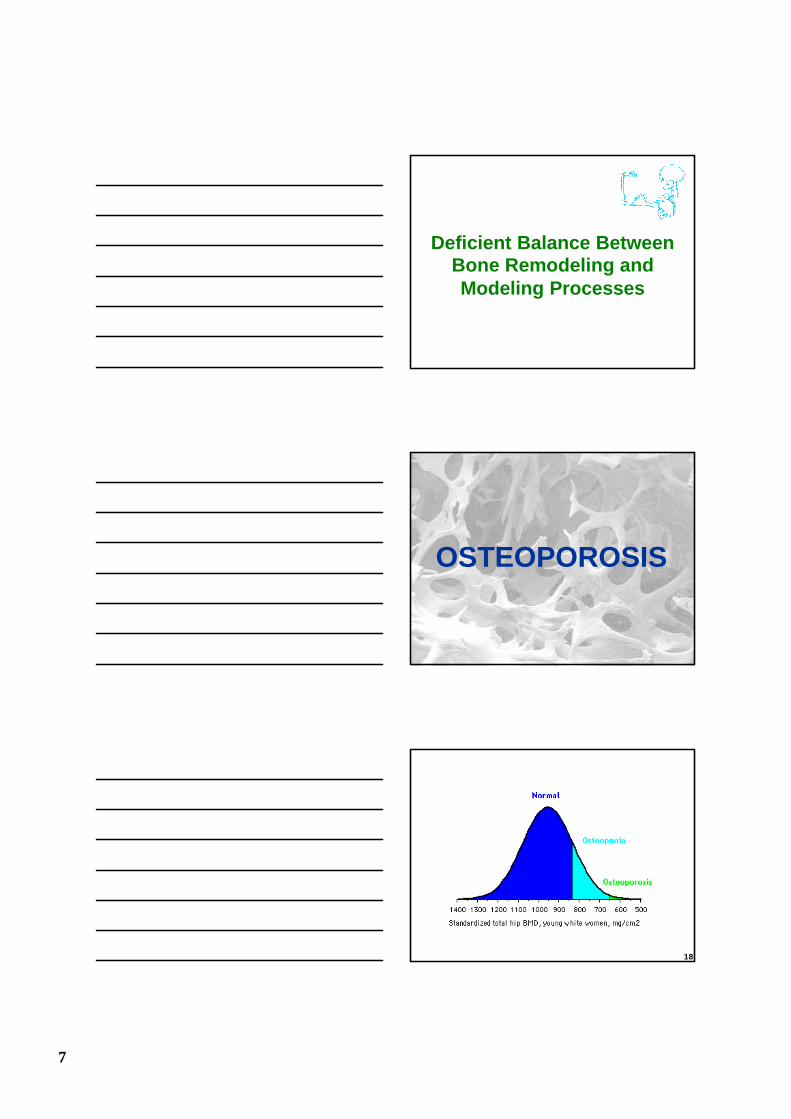
Deficient Balance Between Bone Remodeling and Modeling Processes
OSTEOPOROSIS
18
8
Here is what happens with estrogen deficiency. The resorption cavities go a little deeper and resorption lasts a little longer, and the bone formation increases but doesn't quite match the higher resorption rate. Notice the trabecular fractures and callus formation. 19
This animation starts the same place as the one showing normal turnover. The initial bone volume is 25%. The movie then shows what happens wi th estrogen deficiency. The resorption cavities are deeper and they occur more frequently. With these small changes, the trabeculae become perforated. They lose strength and have microfractures with microcallus formation. By 30 months the bone volume has decreased to 22%. Note that the width of the individual trabeculae are normal.
20
This animation starts after the estrogen deficiency. The first 6 months show high turnover; then the little blue diamonds representing a bisphosphonate start to attach to the bone; resorption stops suddenly and formation stops after a few months. The bone continues to become more mineralized (darker). The very low bone formation and increased mineralization have been reported from studies in humans. The accumulation of micro-cracks is theoretical; it has not been demonstrated.
21
9
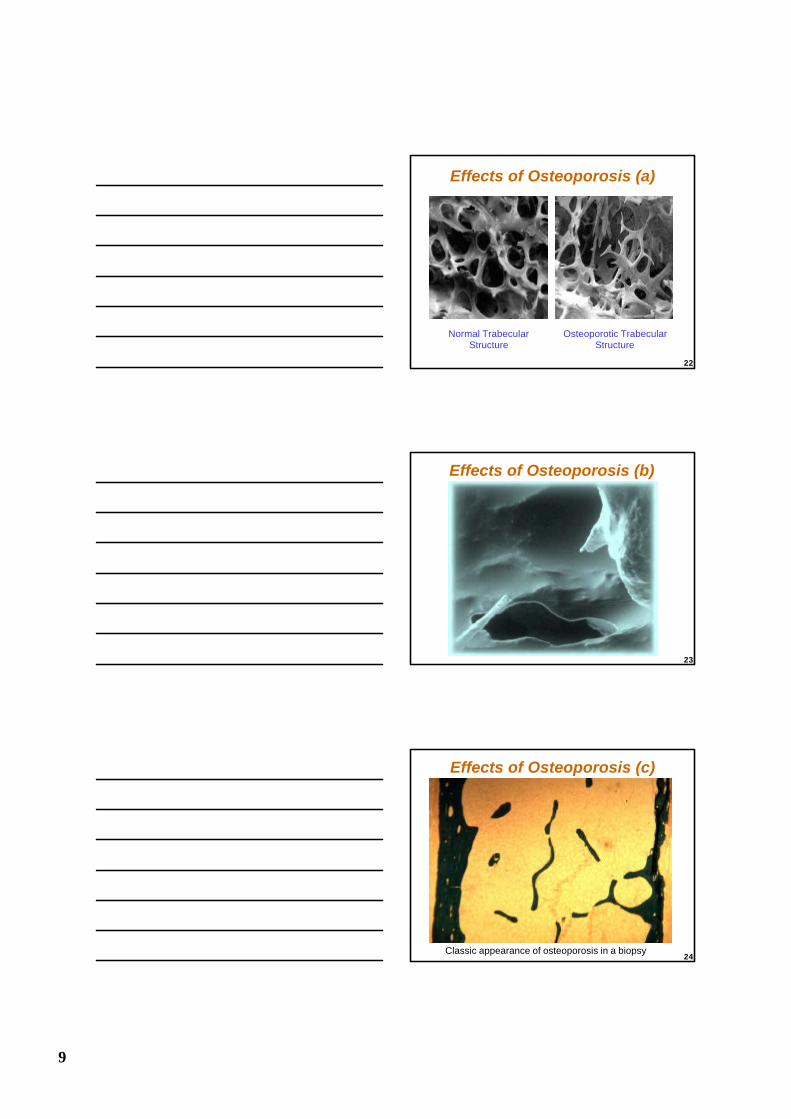
Effects of Osteoporosis (a)
Normal Trabecular Structure
Osteoporotic Trabecular Structure
22
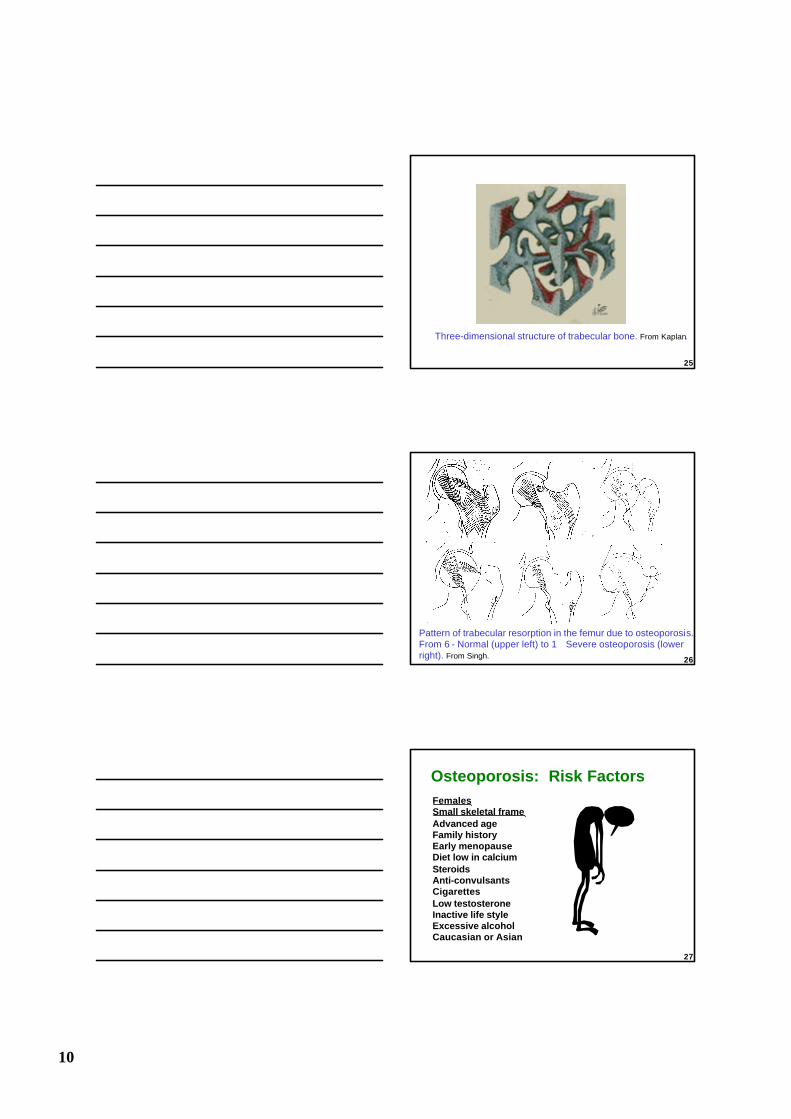
Effects of Osteoporosis (b)
23
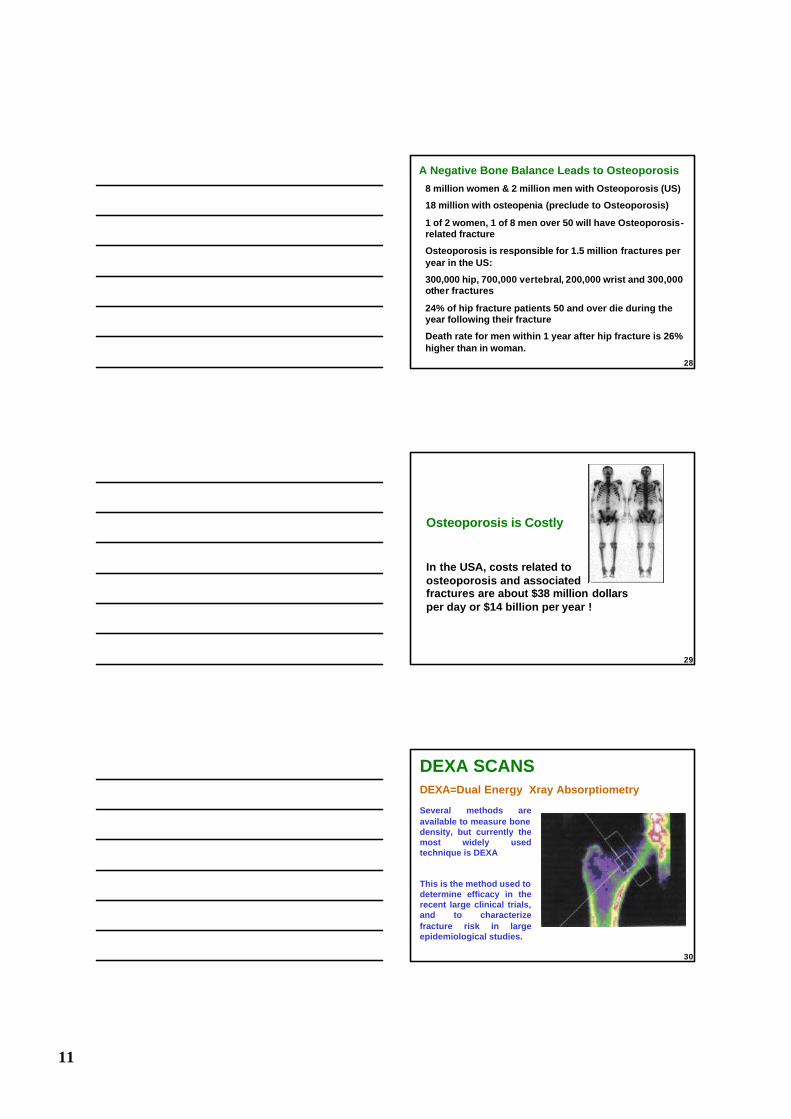
Classic appearance of osteoporosis in a biopsy
Effects of Osteoporosis (c)
24
10
Three-dimensional structure of trabecular bone. From Kaplan.
25
Pattern of trabecular resorption in the femur due to osteoporosis. From 6 - Normal (upper left) to 1 Severe osteoporosis (lower right). From Singh. 26
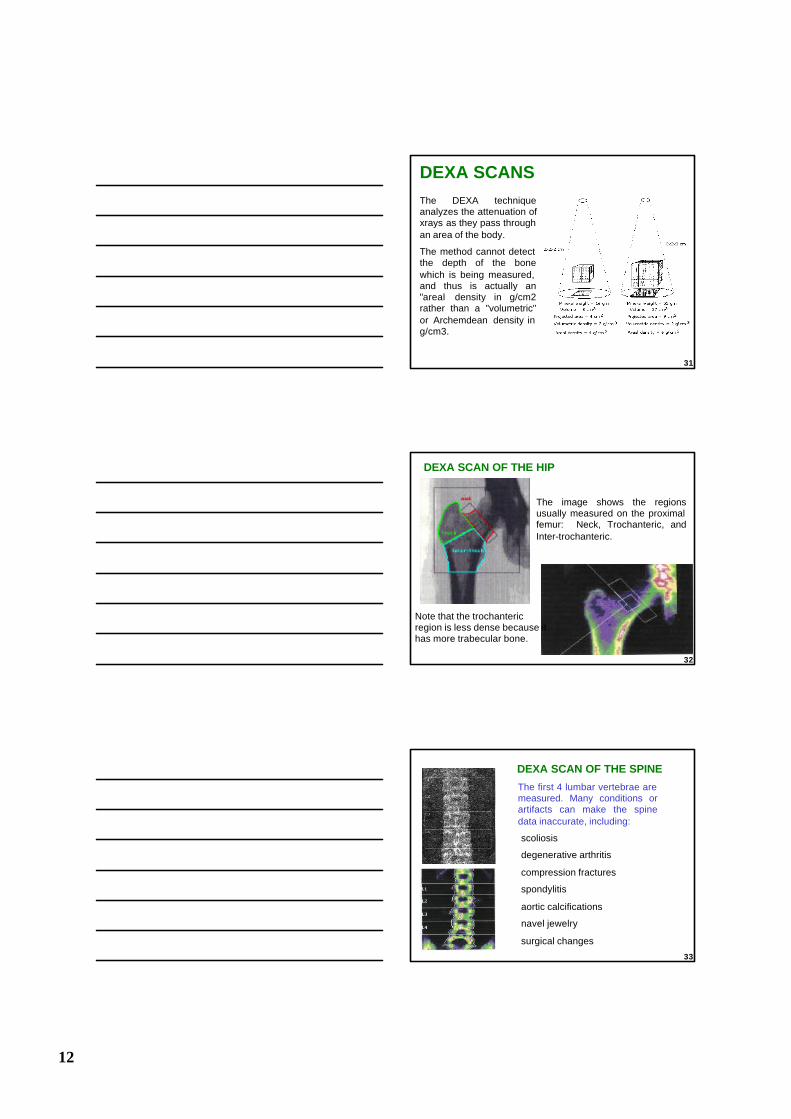
FemalesSmall skeletal frameAdvanced ageFamily historyEarly menopauseDiet low in calciumSteroidsAnti-convulsantsCigarettesLow testosteroneInactive life styleExcessive alcoholCaucasian or Asian
Osteoporosis: Risk Factors
27
11
A Negative Bone Balance Leads to Osteoporosis
8 million women & 2 million men with Osteoporosis (US)
18 million with osteopenia (preclude to Osteoporosis)
1 of 2 women, 1 of 8 men over 50 will have Osteoporosis-related fracture
Osteoporosis is responsible for 1.5 million fractures peryear in the US:
300,000 hip, 700,000 vertebral, 200,000 wrist and 300,000other fractures
24% of hip fracture patients 50 and over die during the year following their fracture
Death rate for men within 1 year after hip fracture is 26% higher than in woman.
28
Osteoporosis is Costly
In the USA, costs related toosteoporosis and associated fractures are about $38 million dollarsper day or $14 billion per year !
29
Several methods are available to measure bone density, but currently the most widely used technique is DEXA
This is the method used to determine efficacy in the recent large clinical trials, and to characterize fracture risk in large epidemiological studies.
DEXA SCANSDEXA=Dual Energy Xray Absorptiometry
30
12
The DEXA technique analyzes the attenuation ofxrays as they pass through an area of the body.
The method cannot detect the depth of the bone which is being measured, and thus is actually an "areal density in g/cm2 rather than a "volumetric" or Archemdean density in g/cm3.
DEXA SCANS
31
The image shows the regions usually measured on the proximal femur: Neck, Trochanteric, and Inter-trochanteric.
DEXA SCAN OF THE HIP
Note that the trochantericregion is less dense because it has more trabecular bone.
32
The first 4 lumbar vertebrae are measured. Many conditions or artifacts can make the spine data inaccurate, including:
scoliosis
degenerative arthritis
compression fractures
spondylitis
aortic calcifications
navel jewelry
surgical changes
DEXA SCAN OF THE SPINE
33
13
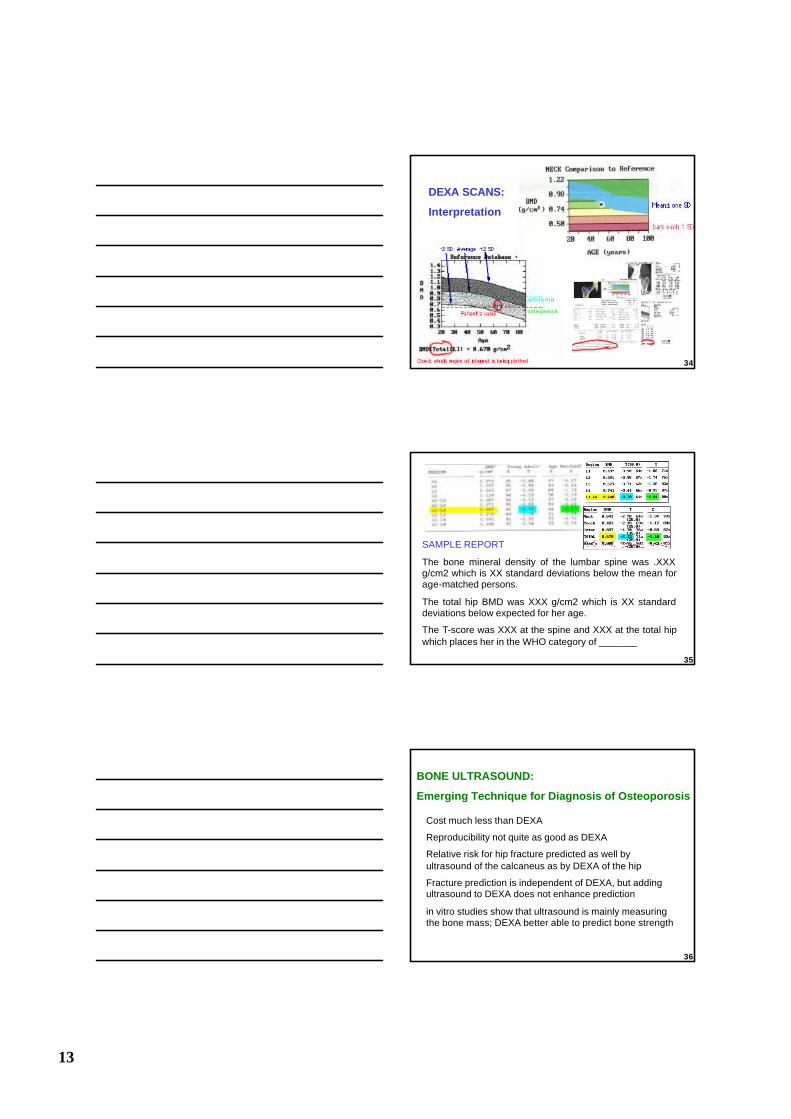
DEXA SCANS:
Interpretation
34
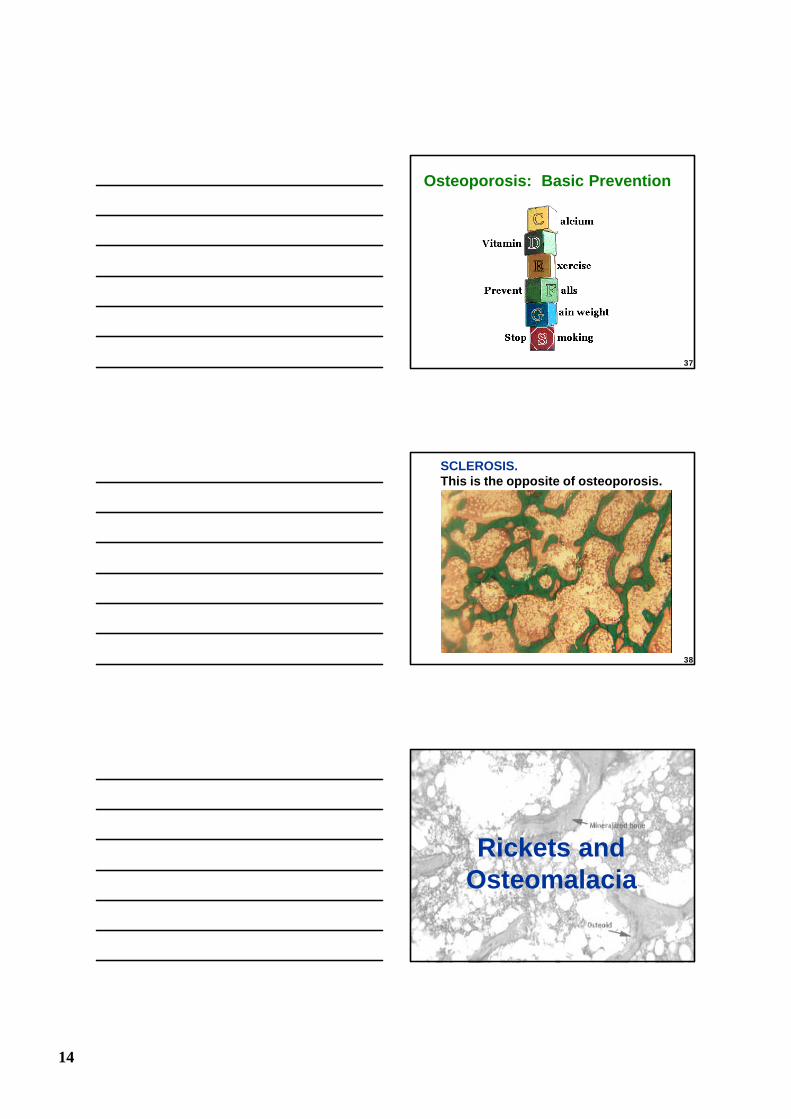
SAMPLE REPORT
The bone mineral density of the lumbar spine was .XXX g/cm2 which is XX standard deviations below the mean for age-matched persons.
The total hip BMD was XXX g/cm2 which is XX standard deviations below expected for her age.
The T-score was XXX at the spine and XXX at the total hip which places her in the WHO category of _______
35
Cost much less than DEXA
Reproducibility not quite as good as DEXA
Relative risk for hip fracture predicted as well by ultrasound of the calcaneus as by DEXA of the hip
Fracture prediction is independent of DEXA, but adding ultrasound to DEXA does not enhance prediction
in vitro studies show that ultrasound is mainly measuring the bone mass; DEXA better able to predict bone strength
BONE ULTRASOUND:
Emerging Technique for Diagnosis of Osteoporosis
36
14
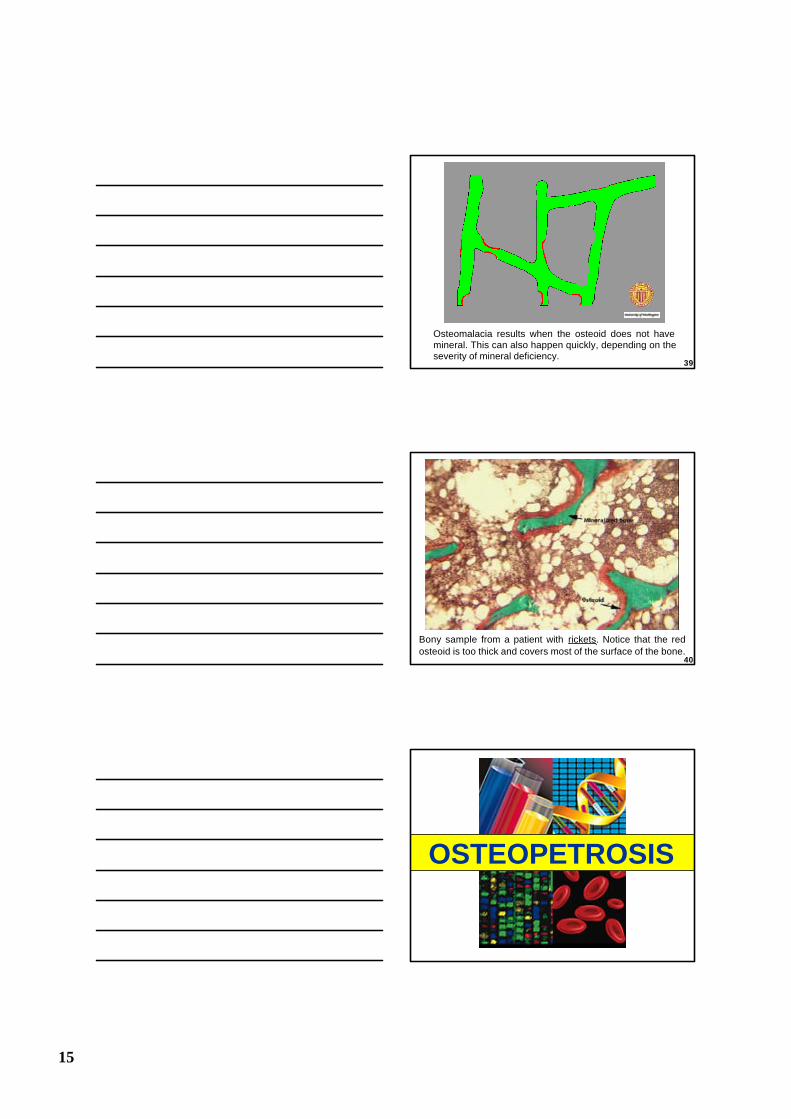
Osteoporosis: Basic Prevention
37
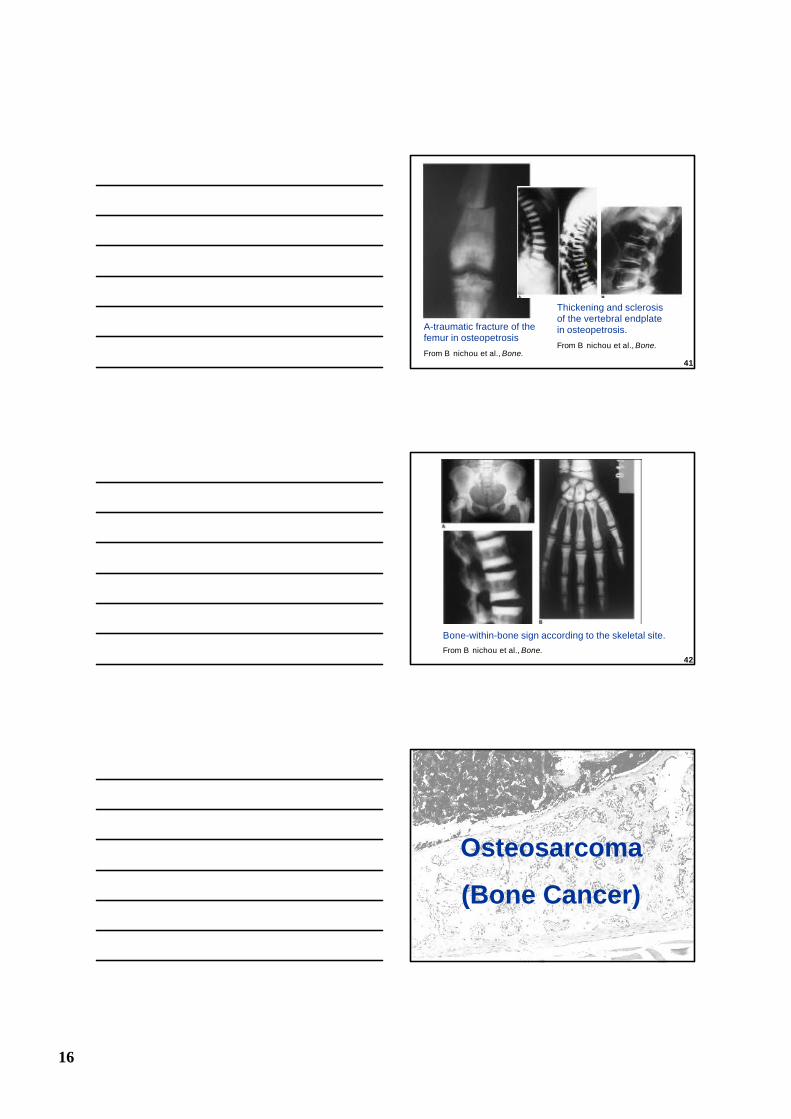
SCLEROSIS. This is the opposite of osteoporosis.
38
Rickets and Osteomalacia
15
Osteomalacia results when the osteoid does not have mineral. This can also happen quickly, depending on the severity of mineral deficiency.
39
Bony sample from a patient with rickets. Notice that the red osteoid is too thick and covers most of the surface of the bone.
40
OSTEOPETROSIS
16
A-traumatic fracture of the femur in osteopetrosis
From B nichou et al., Bone.41
Thickening and sclerosis of the vertebral endplate in osteopetrosis.
From B nichou et al., Bone.
Bone-within-bone sign according to the skeletal site.
From B nichou et al., Bone.42
Osteosarcoma
(Bone Cancer)
17
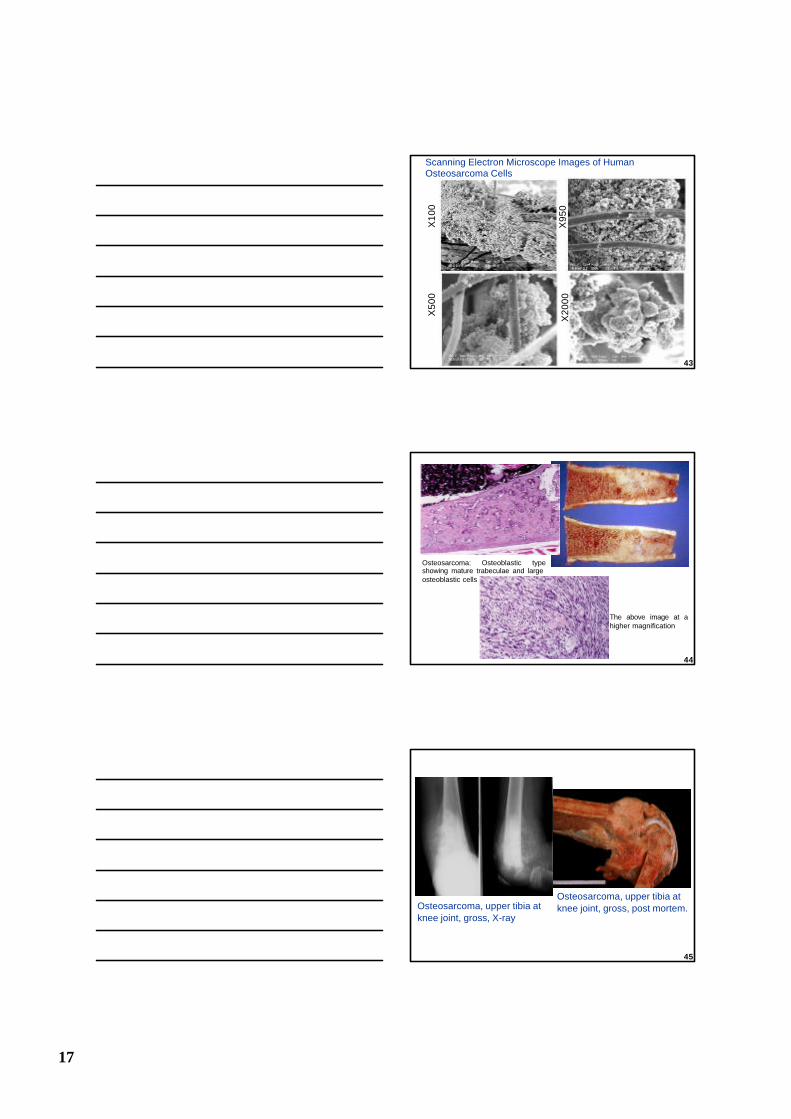
Scanning Electron Microscope Images of Human Osteosarcoma Cells
X1
00
X9
50
X5
00
X2
00
0
43
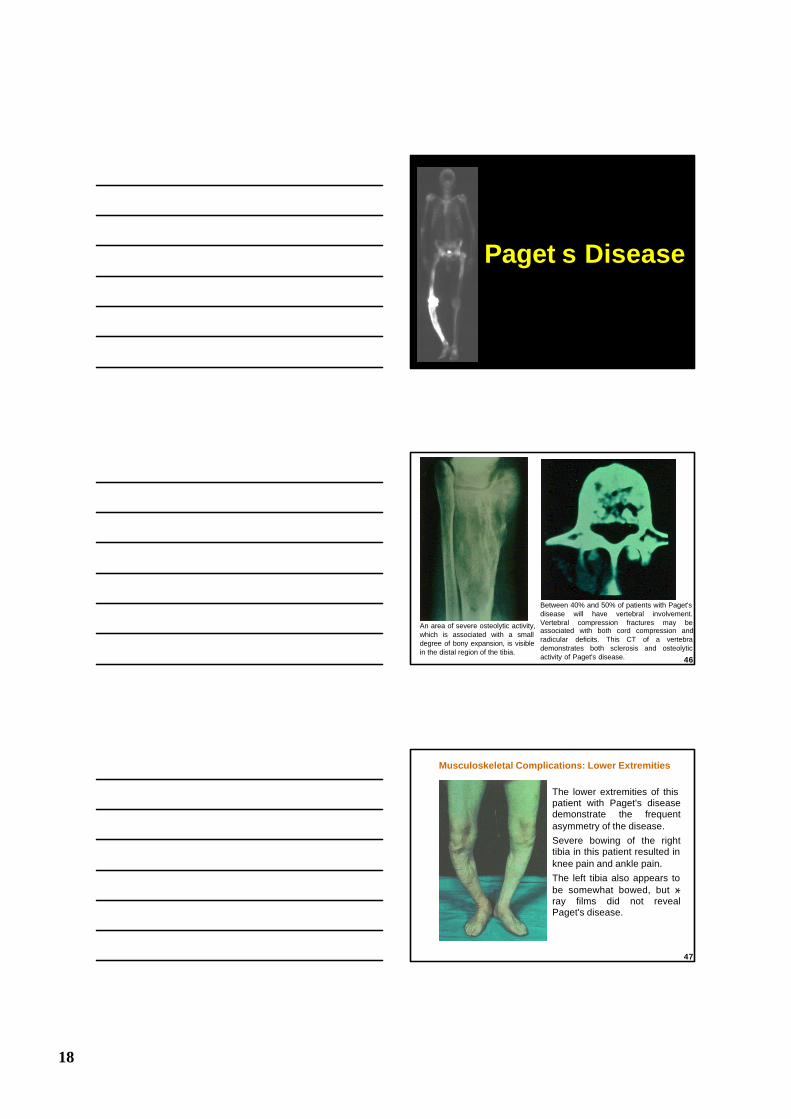
Osteosarcoma: Osteoblastic type showing mature trabeculae and large osteoblastic cells
The above image at a higher magnification
44
Osteosarcoma, upper tibia at knee joint, gross, post mortem. Osteosarcoma, upper tibia at
knee joint, gross, X-ray
45
18
Paget s Disease
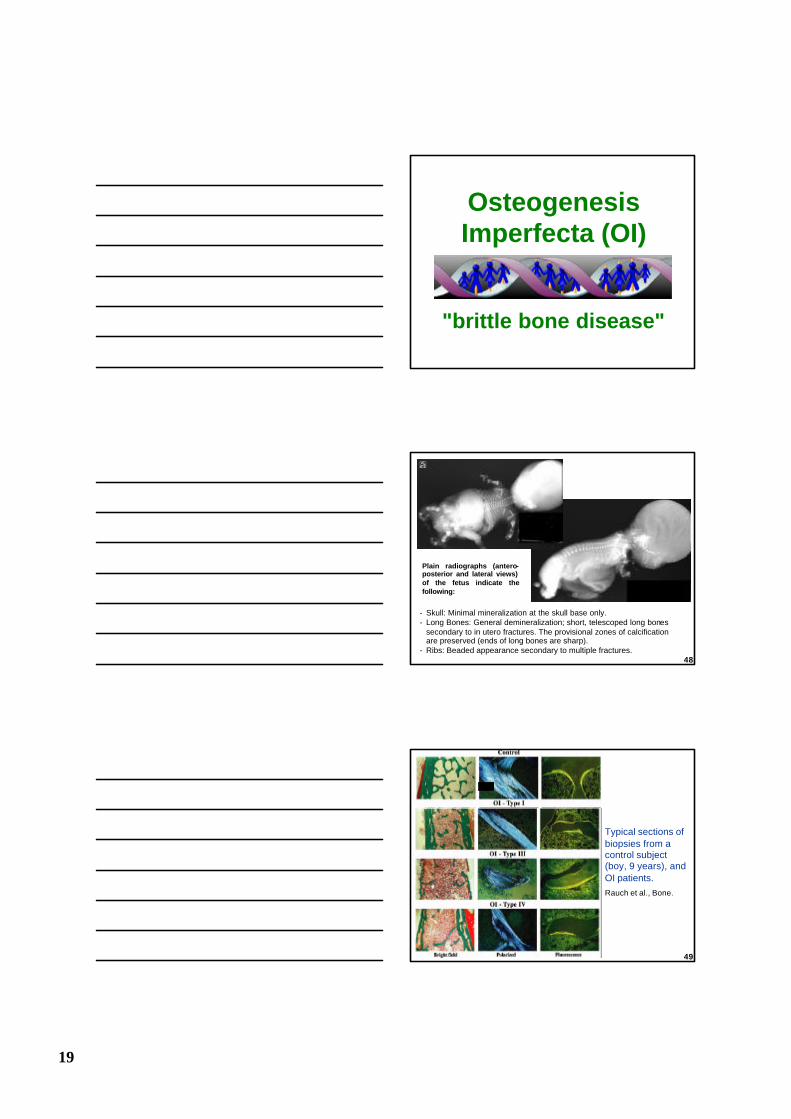
An area of severe osteolytic activity, which is associated with a small degree of bony expansion, is visible in the distal region of the tibia.
Between 40% and 50% of patients with Paget's disease will have vertebral involvement. Vertebral compression fractures may be associated with both cord compression andradicular deficits. This CT of a vertebra demonstrates both sclerosis and osteolytic activity of Paget's disease. 46
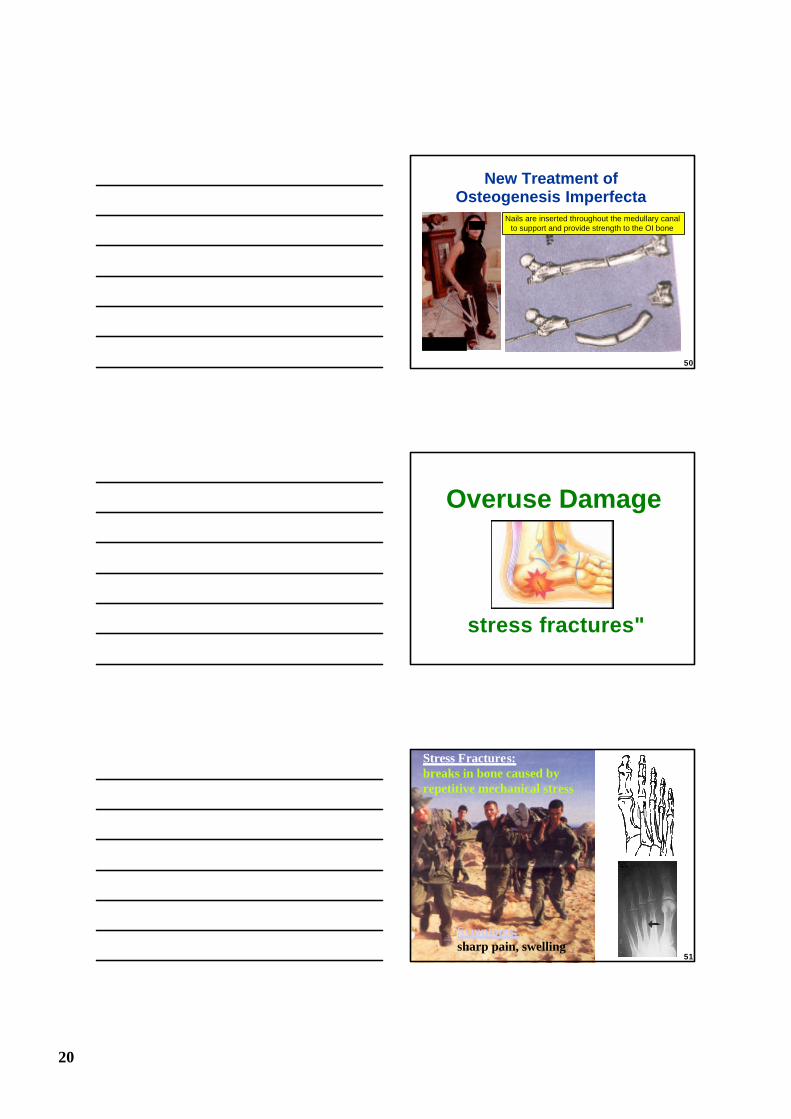
Musculoskeletal Complications: Lower Extremities
The lower extremities of this patient with Paget's disease demonstrate the frequent asymmetry of the disease.
Severe bowing of the right tibia in this patient resulted in knee pain and ankle pain.
The left tibia also appears to be somewhat bowed, but x-ray films did not reveal Paget's disease.
47
19
Osteogenesis Imperfecta (OI)
"brittle bone disease"
- Skull: Minimal mineralization at the skull base only.- Long Bones: General demineralization; short, telescoped long bones
secondary to in utero fractures. The provisional zones of calcification are preserved (ends of long bones are sharp).
- Ribs: Beaded appearance secondary to multiple fractures.
Plain radiographs (antero-posterior and lateral views) of the fetus indicate the following:
48
Typical sections of biopsies from a control subject (boy, 9 years), and OI patients.
Rauch et al., Bone.
49
20
New Treatment of Osteogenesis Imperfecta
Nails are inserted throughout the medullary canal to support and provide strength to the OI bone
50
Overuse Damage
stress fractures"
Stress Fractures:breaks in bone caused by repetitive mechanical stress
Symptoms:sharp pain, swelling
51
21
Background Roles of Lower-limb Muscle Contraction During Walking
Normal contraction of the lower-limb muscles
during the stance phase of walking/running not only generates propulsion, but also protects the body by absorbing some of the foot-ground impact energy:
the lower-limb muscles exert a protective effect on bone surfaces by contractingto reduce tension stresses and strains
52
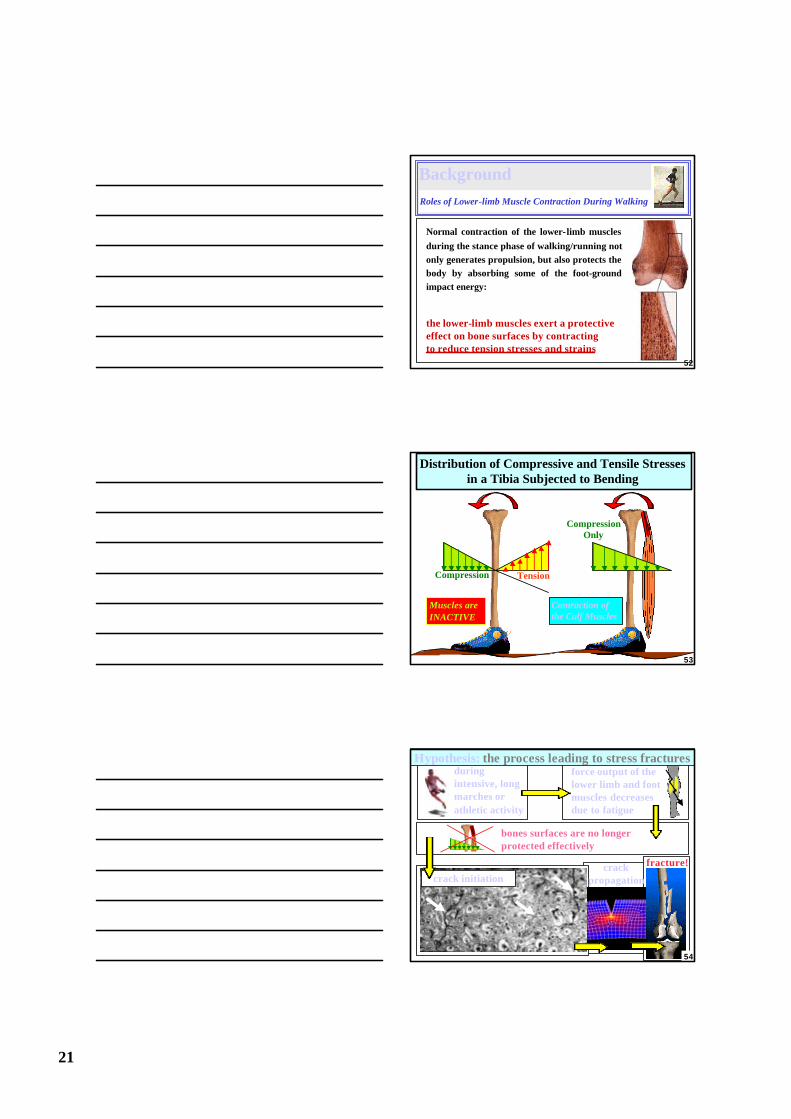
Distribution of Compressive and Tensile Stresses in a Tibia Subjected to Bending
Muscles areINACTIVE
TensionCompression
Contraction of the Calf Muscles
CompressionOnly
53
during intensive, long marches or athletic activity
force output of the lower limb and foot muscles decreases due to fatigue
crack initiation
fracture!crack propagation
bones surfaces are no longer protected effectively
Hypothesis: the process leading to stress fractures
54
22
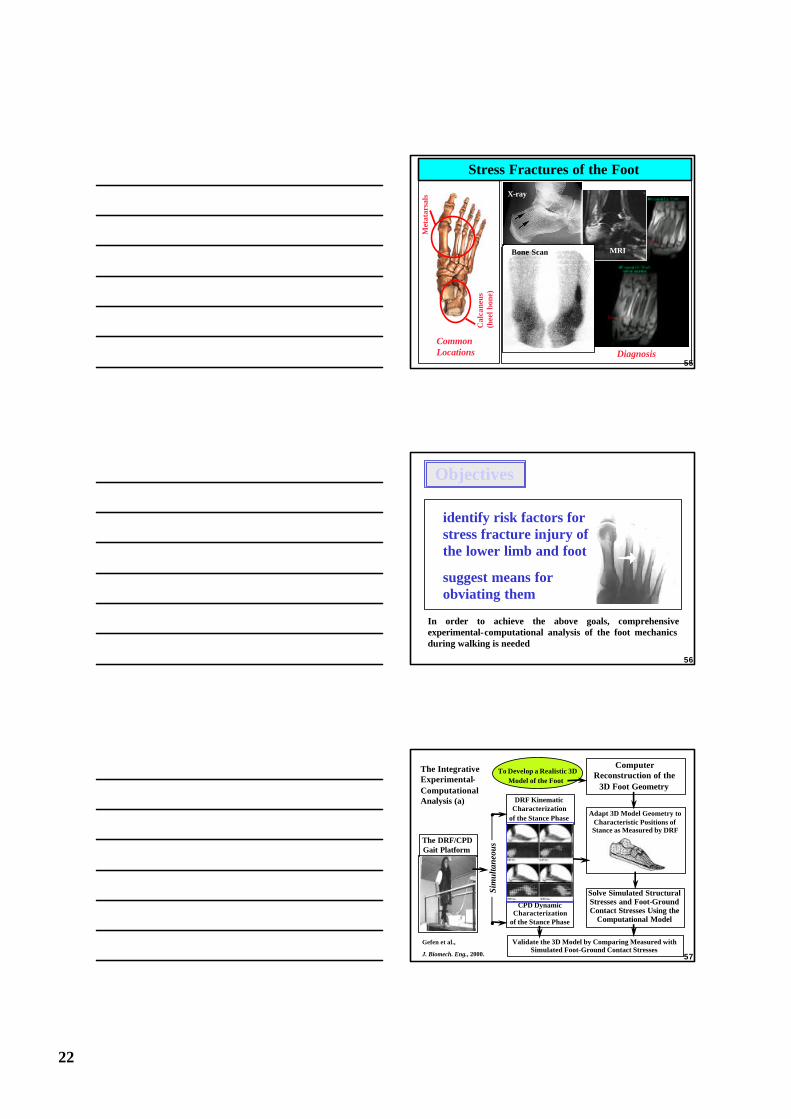
Stress Fractures of the Foot
Common Locations
Cal
cane
us
(hee
l bon
e)
Met
atar
sals
Diagnosis
X-ray
MRIBone Scan
55
Objectives
In order to achieve the above goals, comprehensive experimental-computational analysis of the foot mechanics during walking is needed
identify risk factors for stress fracture injury of the lower limb and foot
suggest means for obviating them
56
The IntegrativeExperimental-ComputationalAnalysis (a) DRF Kinematic
Characterizationof the Stance Phase
Computer Reconstruction of the
3D Foot Geometry
To Develop a Realistic 3D Model of the Foot
Adapt 3D Model Geometry to Characteristic Positions of Stance as Measured by DRF
Solve Simulated Structural Stresses and Foot-Ground Contact Stresses Using the
Computational Model
CPD Dynamic Characterization
of the Stance Phase
The DRF/CPDGait Platform
Sim
ulta
neou
s
Validate the 3D Model by Comparing Measured with Simulated Foot-Ground Contact Stresses
Gefen et al.,
J. Biomech. Eng., 2000. 57
23
Muscle Exercise Protocols to Achieve
Fatigue
Study the Stress State of the Foot in Conditions of
Muscular Fatigue
SurfaceEMG
Alter Muscular Loading of the Model According to EMG
Measurements
Compare Model Predictions of the Foot-Ground Pressure with Respective Measured CPD Data to Characterize Fatigue Effects
EMGMeasurements
The IntegrativeExperimental-ComputationalAnalysis (b)
58
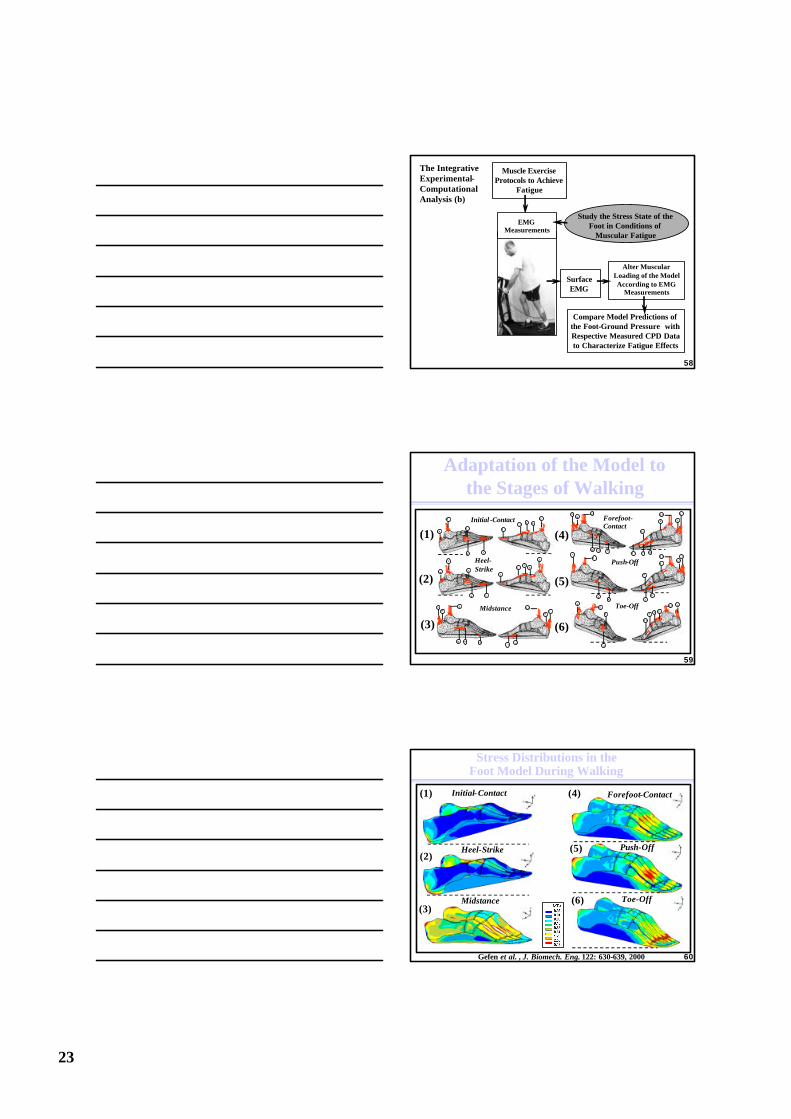
Adaptation of the Model to the Stages of Walking
(2)
(1)
(3)
(4)
(5)
(6)
Heel-Strike
1 2
1 43
4
12 6
1 2
2
3
Initial -Contact1 2
1 43
4
12 6
1 2
2
3
Midstance
1 0
1 251 4
9
51 3
1 2
788
1 0
1 251 4
9
6
5
1 3
1 2
7 8
1 1
81 1
1 25
9
6
5
1 3
1 2
7
8
1 1
8
Push-Off
123
4
1 21 2
55
1 1
6
Toe-Off
Forefoot-Contact
59
Stress Distributions in the Foot Model During Walking
Initial-Contact
Heel-Strike
Midstance
Forefoot-Contact
Push-Off
Toe-Off
(1)
(2)
(3)
(4)
(5)
(6)
Gefen et al. , J. Biomech. Eng. 122: 630-639, 2000 60
24
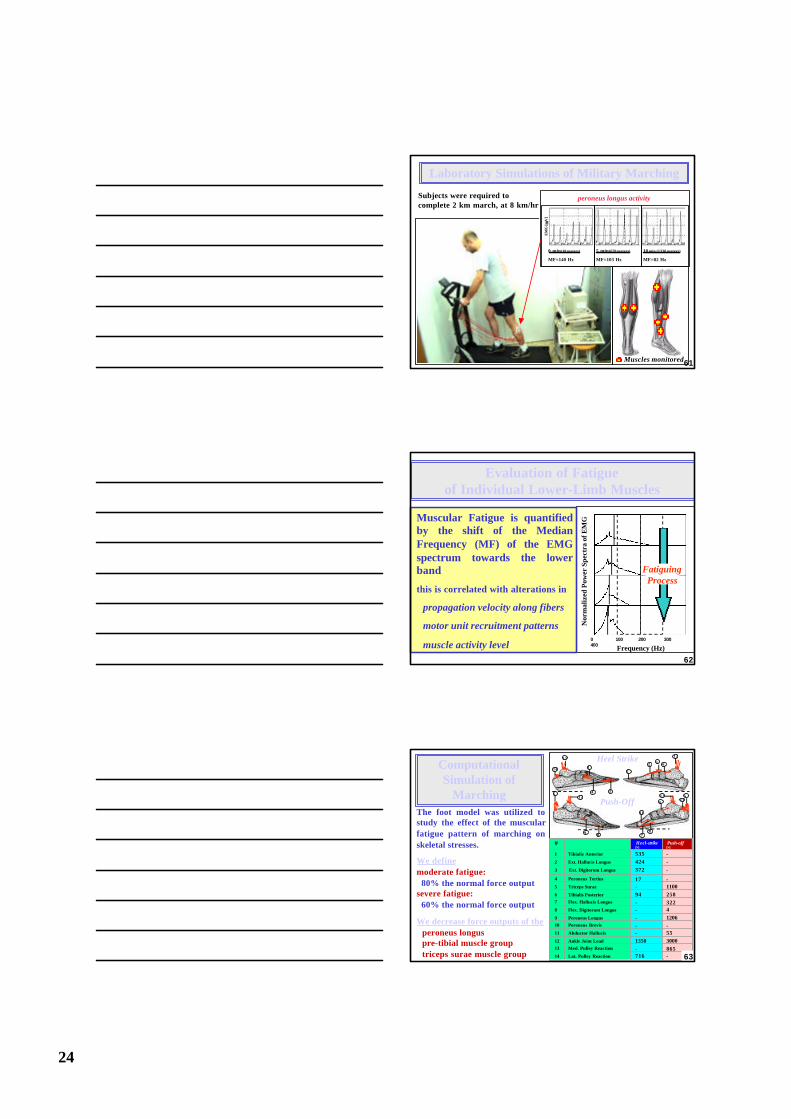
Laboratory Simulations of Military Marching
Subjects were required to complete 2 km march, at 8 km/hr
peroneus longus activity
5 min(670 meters)
MF=103 Hz
0 min(10 meters)
MF=140 Hz
10 min (1330 meters)
MF=82 Hz
EM
G [ µµ
V]
Muscles monitored61
Evaluation of Fatigue of Individual Lower-Limb Muscles
Nor
mal
ized
Pow
er S
pect
ra o
f EM
G
Frequency (Hz)0 100 200 300400
Fatiguing Process
Muscular Fatigue is quantified by the shift of the Median Frequency (MF) of the EMG spectrum towards the lower band
this is correlated with alterations in
propagation velocity along fibers
motor unit recruitment patterns
muscle activity level62
Computational Simulation of
Marching
Heel Strike12
14 3
4
12 6
12
2
312
5
9
6
513
12
78
11
8
Push-Off
# Heel-strike[N]
Push-off[N]
1 Tibialis Anterior 535 -2 Ext. Hallucis Longus 424 -3 Ext. Digitorum Longus 372 -
4 Peroneus Tertius 17 -5 Triceps Surae - 11006 Tibialis Posterior 94 2587 Flex. Hallucis Longus - 3228 Flex. Digitorum Longus - 49 Peroneus Longus - 120610 Peroneus Brevis - -11 Abductor Hallucis - 5512 Ankle Joint Load 1350 300013 Med. Pulley Reaction - 86514 Lat. Pulley Reaction 716 -
The foot model was utilized to study the effect of the muscular fatigue pattern of marching on skeletal stresses.
We definemoderate fatigue:
80% the normal force outputsevere fatigue:
60% the normal force output
We decrease force outputs of theperoneus longuspre-tibial muscle grouptriceps surae muscle group 63
25
0
0.5
1
1.5
2
σσv
.M. [
MP
a]
PositionS1
normalmoderate fatiguesevere fatigue
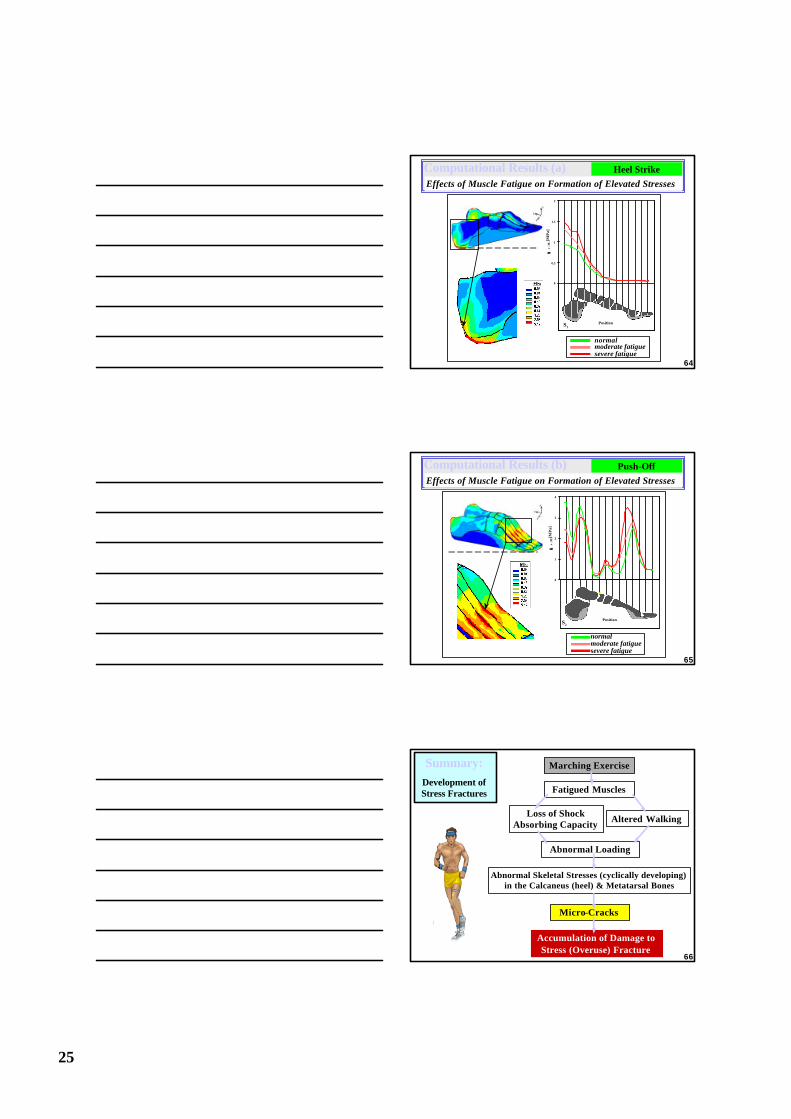
Computational Results (a)Effects of Muscle Fatigue on Formation of Elevated Stresses
Heel Strike
64
0
1
2
3
4
σσv
.M. [M
Pa]
PositionS2
normalmoderate fatiguesevere fatigue
Computational Results (b)Effects of Muscle Fatigue on Formation of Elevated Stresses
Push-Off
65
Marching Exercise
Fatigued Muscles
Loss of Shock Absorbing Capacity
Altered Walking
Abnormal Skeletal Stresses (cyclically developing)in the Calcaneus (heel) & Metatarsal Bones
Micro-Cracks
Accumulation of Damage to Stress (Overuse) Fracture
Abnormal Loading
Summary:Development of Stress Fractures
66