Embed Size (px)
Citation preview
Bone HealthEPI 254
May 25, 2011
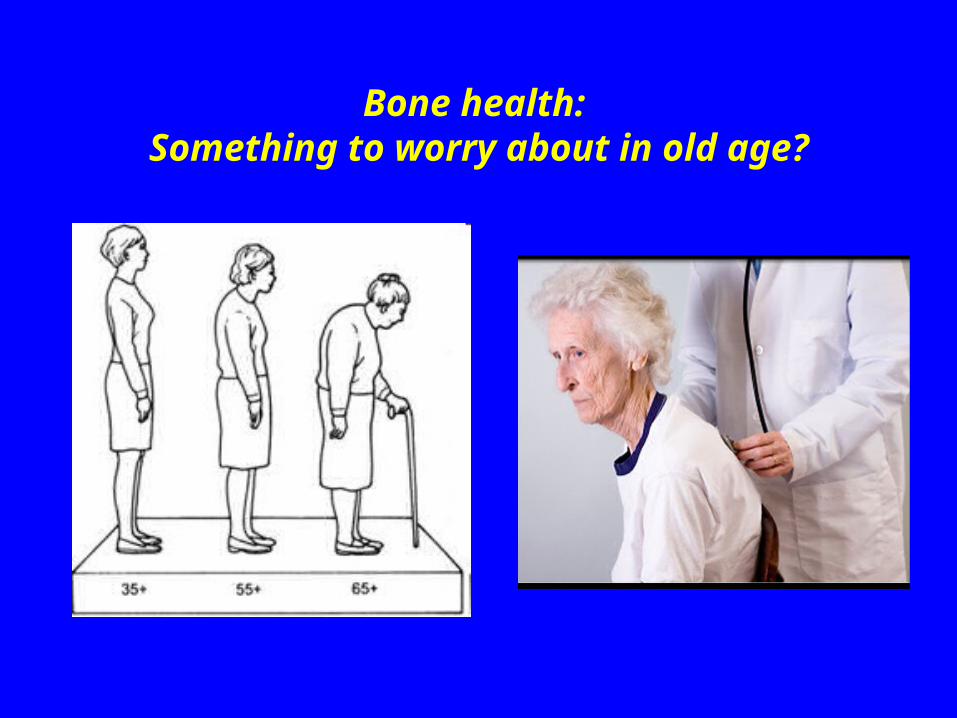
Bone health: Something to worry about in old age?
Outline
• Functions of bone
• Bone composition & structure
• Measuring bone
• Bone density and osteoporosis
• Determinants of bone health– genes, hormones physical activity, diet
• Prevalence of osteoporosis
• Promoting bone health
Functions of Bone
• Provides structural support for the body
• Protects vital organs
• Attachment sites for muscles
• Acts as a mineral reservoir for calcium homeostasis in the body
• Provides an environment for marrow
• Trap for some dangerous minerals

Bone composition
• The matrix– 40% organic
• Type 1 collagen (tensile strength)• Proteoglycans (compressive strength)• Osteocalcin/Osteonectin• Growth factors/Cytokines/Osteoid
– 60% inorganic• Calcium hydroxyapatite
• The cells – osteo-clast/blast/cyte/progenitor
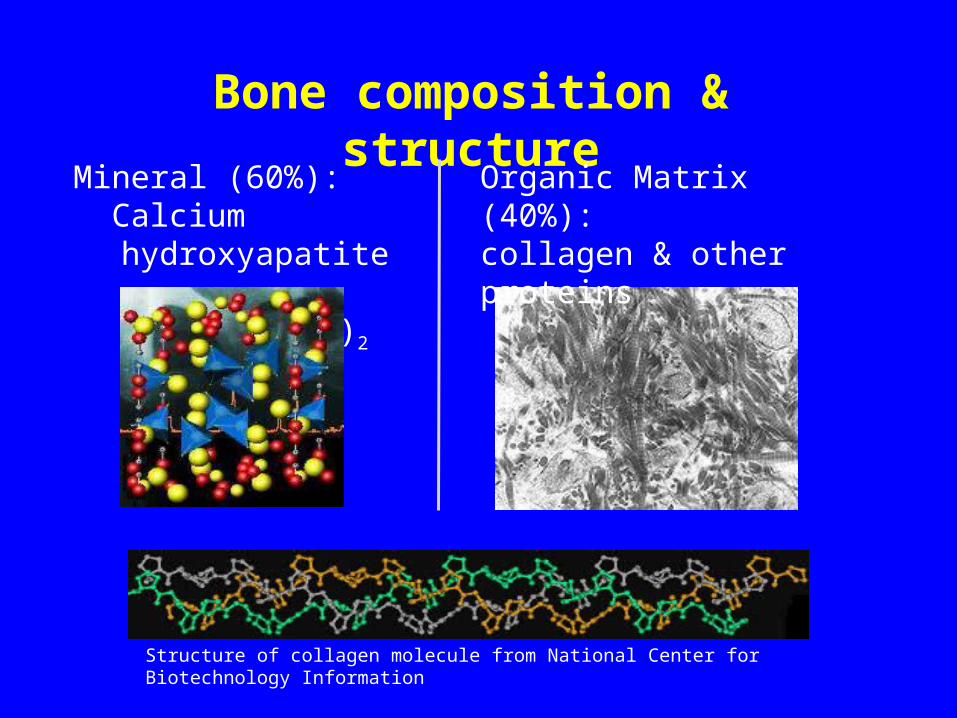
Structure of collagen molecule from National Center for Biotechnology Information
Bone composition & structure
Organic Matrix (40%): collagen & other proteins
Mineral (60%): Calcium hydroxyapatite Ca10(PO4)6(OH)2

Bone strength is determined by
• bone microarchitecture and
• bone mass
but clinically indicated by
bone mass
70% of bone fragility is accounted for
by bone mass

Measuring Bone Mass
• Different expressions of bone mass• Most common expression is:
Bone Mineral Density (g/cm2)
as measured by dual-energy x-ray absorptiometry
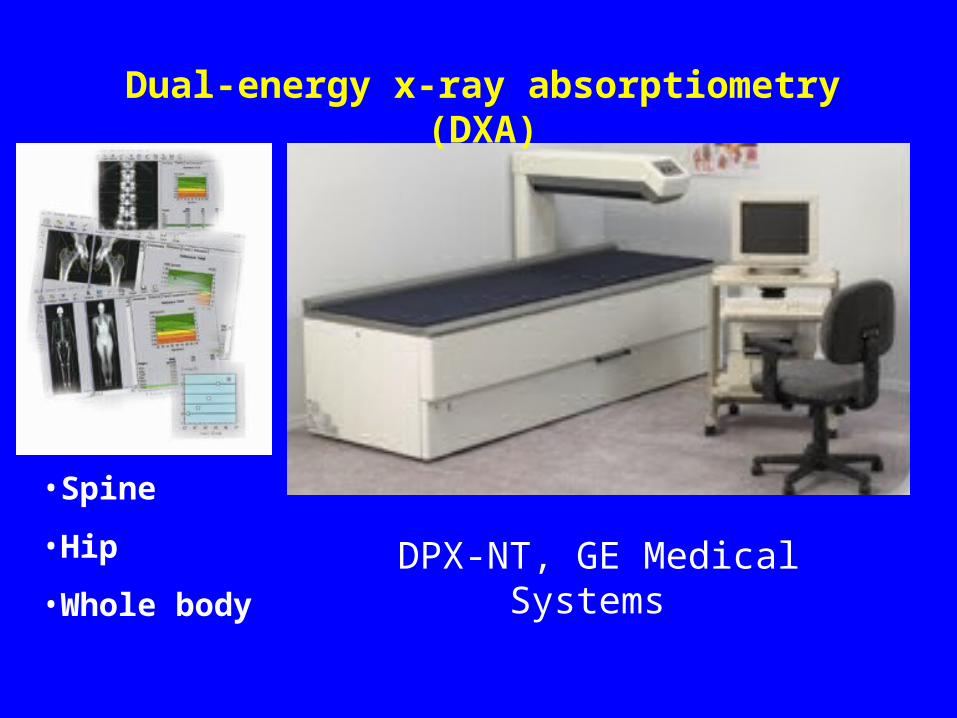
DPX-NT, GE Medical Systems
•Spine
•Hip
•Whole body
Dual-energy x-ray absorptiometry (DXA)
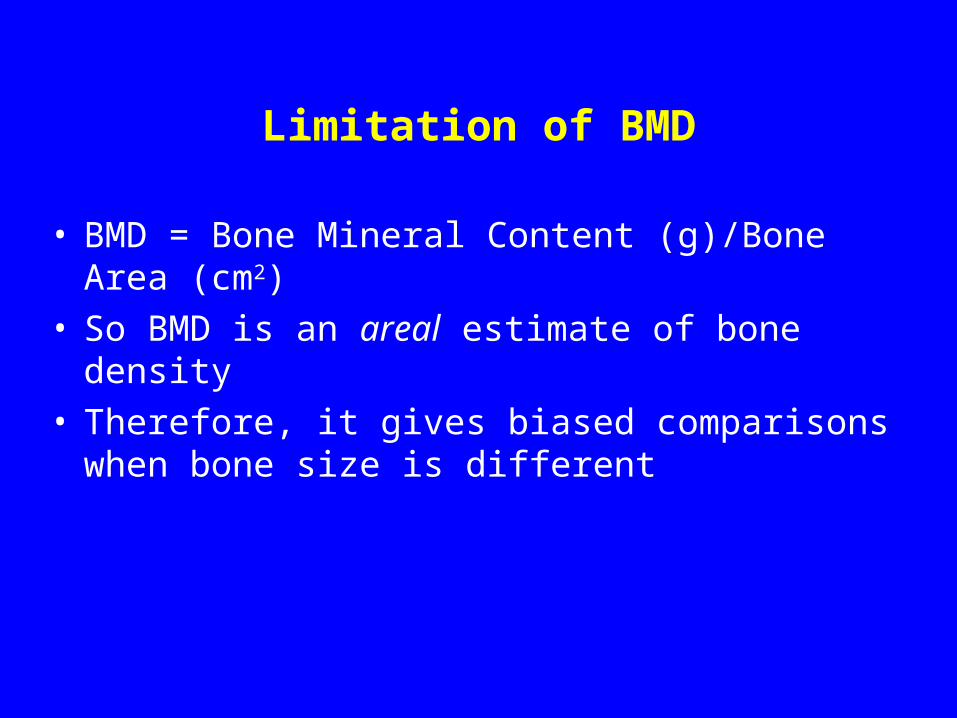
Limitation of BMD
• BMD = Bone Mineral Content (g)/Bone Area (cm2)• So BMD is an areal estimate of bone density• Therefore, it gives biased comparisons when bone
size is different

How are BMD values interpreted?
WHO definitions
BMD (young adult as reference)
-2.5 -1.0
osteopenia
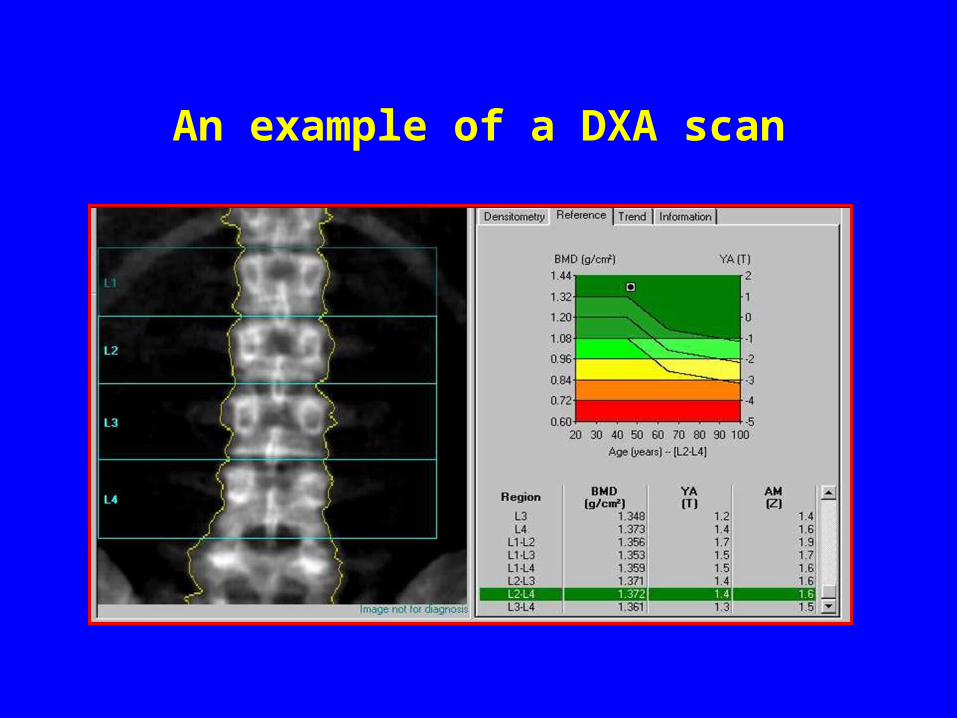
An example of a DXA scan
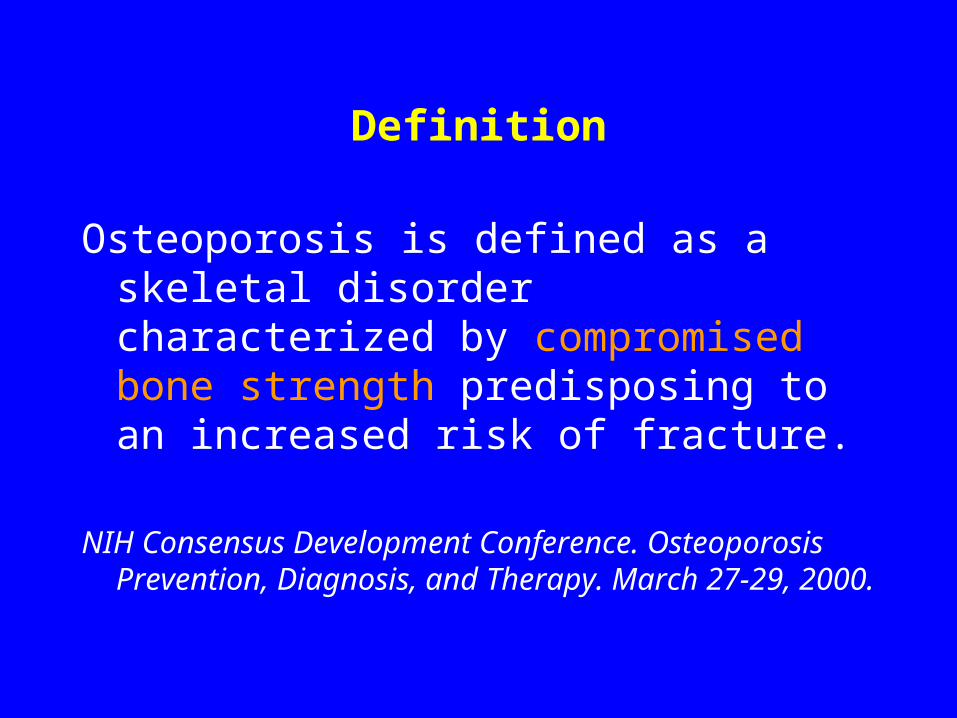
Definition
Osteoporosis is defined as a skeletal disorder characterized by compromised bone strength predisposing to an increased risk of fracture.
NIH Consensus Development Conference. Osteoporosis Prevention, Diagnosis, and Therapy. March 27-29, 2000.

33 yr old 55 yr old 72 yr old
Vertebra sample from women using Computed Microtomography (CMT)
Salome, et al, Creatis, INSA, Lyons, France
European Synchrotron Radiation Facility (ESRF)
Bone micro-architecture
Determinants of bone density
1. Genes2. Hormones3. Diet4. Physical Activity

Changes in bone mass with age
0.00
0.40
0.80
1.20
10 20 30 40 50 60 70 80
Adolescence
Premenopause
Postmenopause
Age (years)
BM
D,
g/c
m2
Peak bone mass
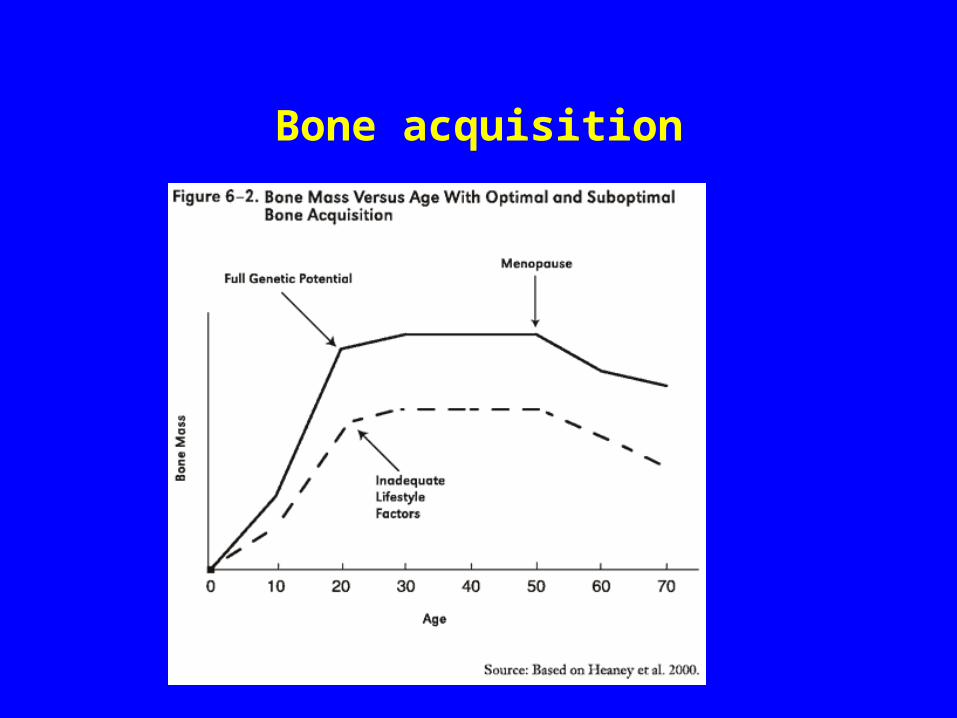
Bone acquisition
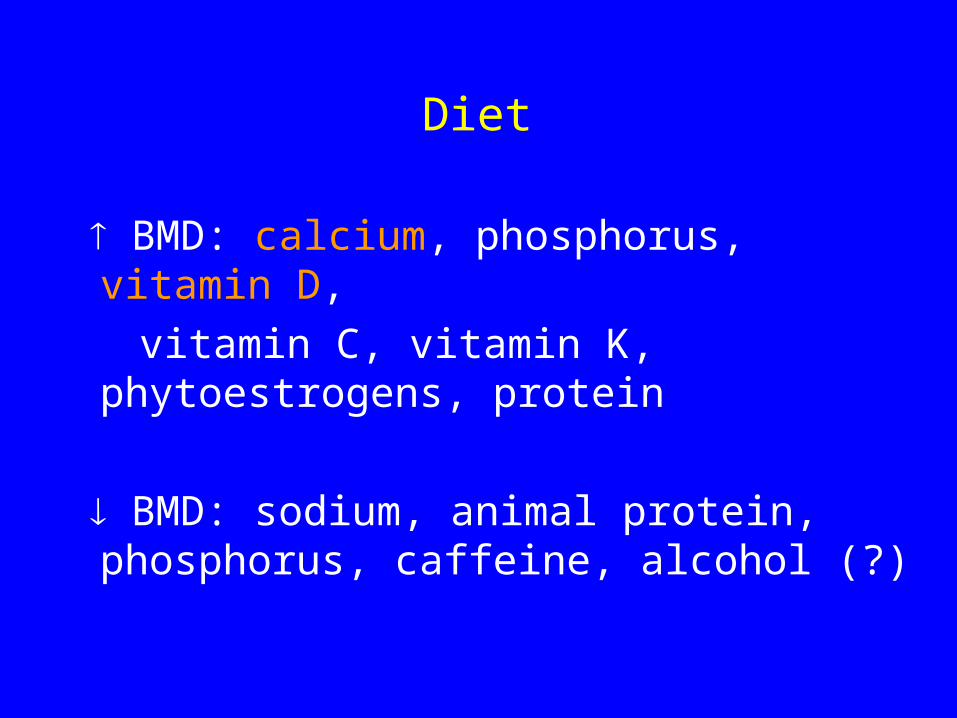
Diet BMD: calcium, phosphorus, vitamin
D, vitamin C, vitamin K, phytoestrogens,
protein
BMD: sodium, animal protein, phosphorus, caffeine, alcohol (?)

Calcium & Vitamin D play critical roles in osteoporosis prevention
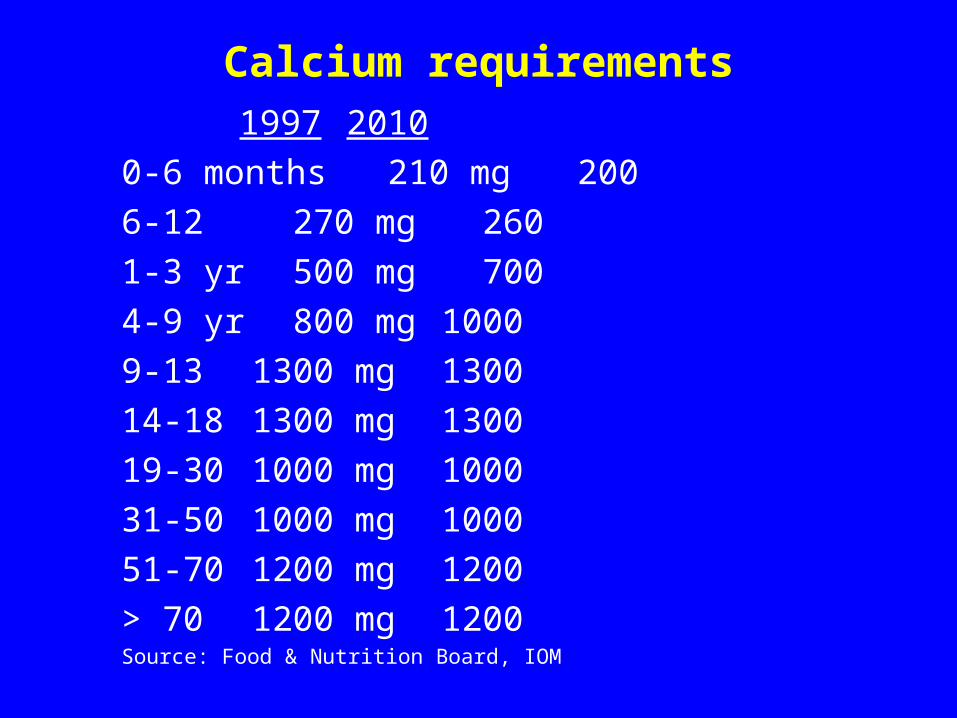
Calcium requirements 1997 2010
0-6 months 210 mg 200
6-12 270 mg 260
1-3 yr 500 mg 700
4-9 yr 800 mg 1000
9-13 1300 mg 1300
14-18 1300 mg 1300
19-30 1000 mg 1000
31-50 1000 mg 1000
51-70 1200 mg 1200
> 70 1200 mg 1200Source: Food & Nutrition Board, IOM
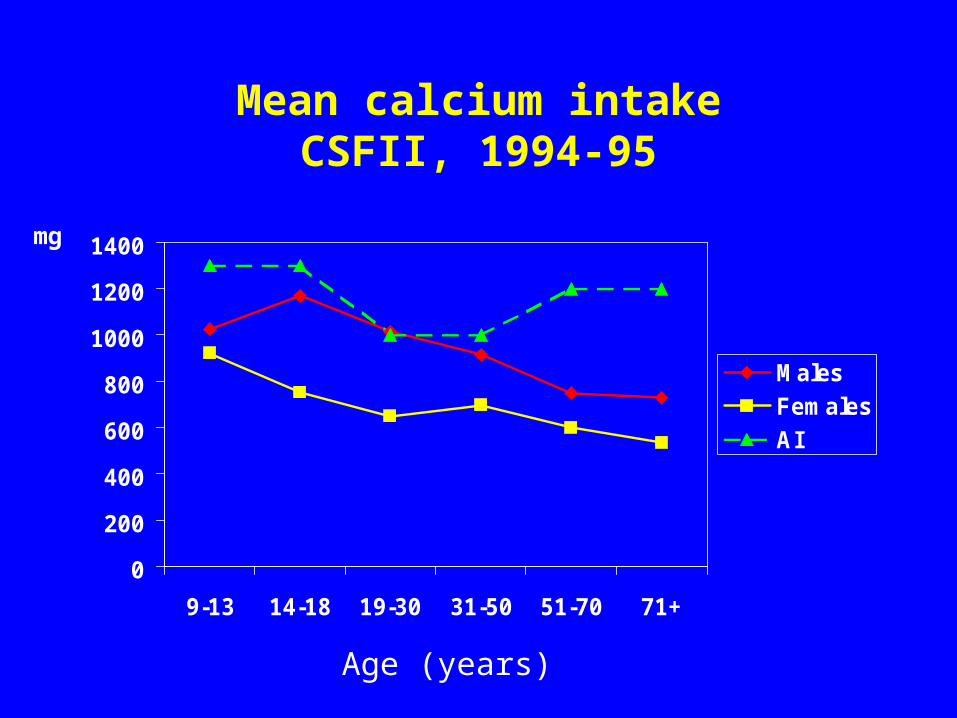
Mean calcium intakeCSFII, 1994-95
0
200
400
600
800
1000
1200
1400
9-13 14-18 19-30 31-50 51-70 71+
Males
Females
AI
Age (years)
mg
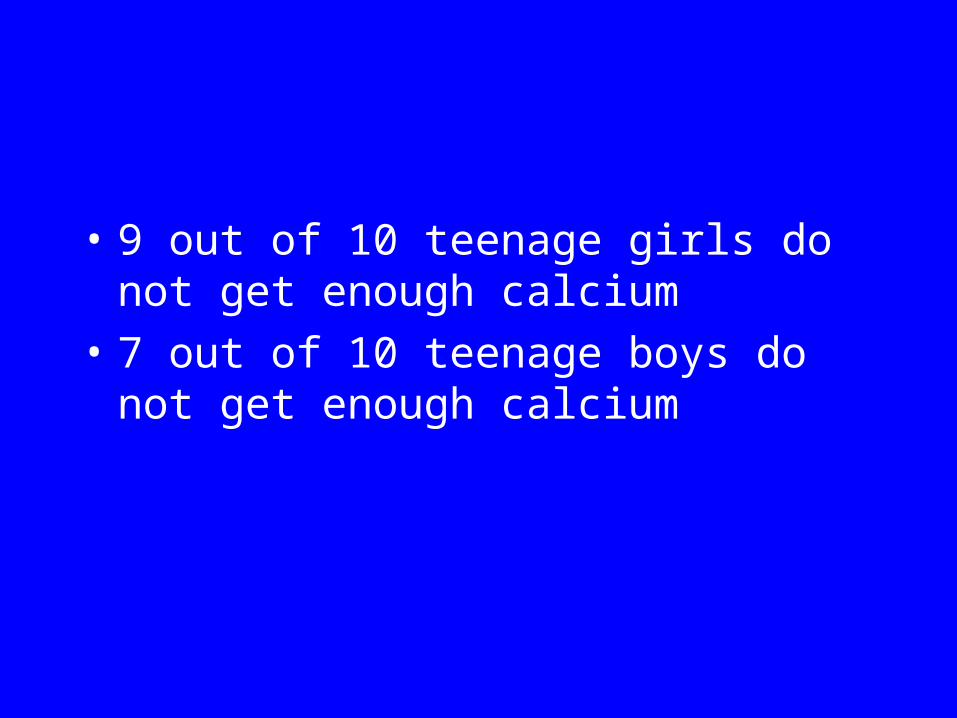
• 9 out of 10 teenage girls do not get enough calcium
• 7 out of 10 teenage boys do not get enough calcium

How does calcium affect bone mass?
• 99% of total body calcium (1000-1200g) is found in bone– needed for bone formation, maintenance
and repair
• Bone acts as a reserve for calcium – to maintain calcium homeostasis

What are the effects of other dietary components on calcium metabolism
1. Calcium excretion
2. Calcium absorption
Calcium Excretion
• Sodium
• Protein

Sodium increases urinary calcium loss
• Sodium and calcium share the same transport system in the proximal tubule
2300 mg Na excreted 20-60 mg Ca loss
Massey L and Whiting S (1996). J Bone Miner Res 11:731
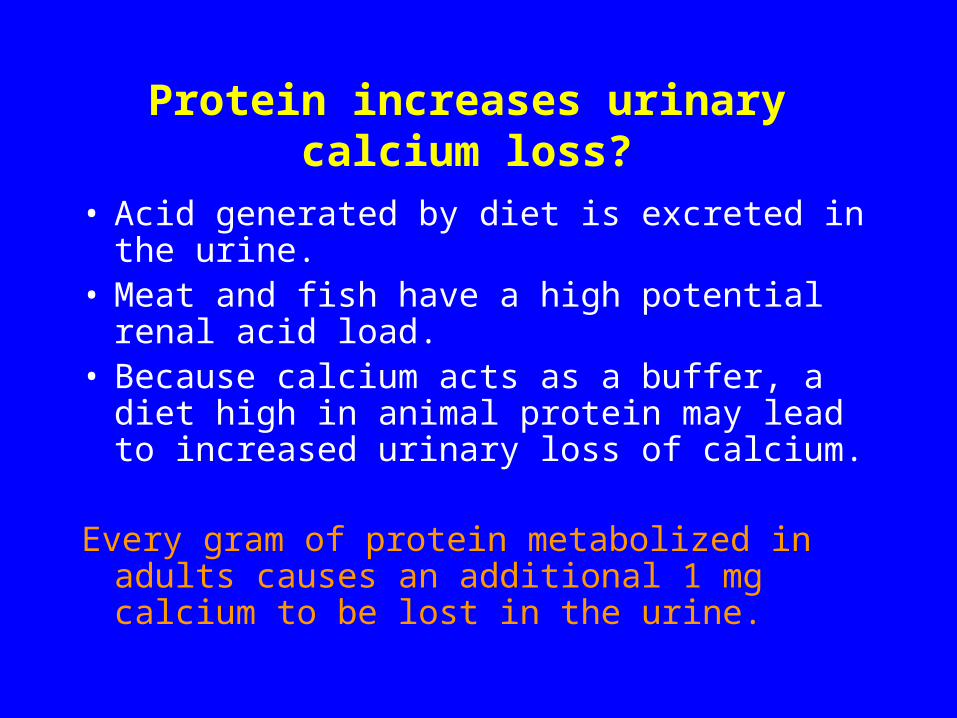
Protein increases urinary calcium loss?
• Acid generated by diet is excreted in the urine. • Meat and fish have a high potential renal acid
load.• Because calcium acts as a buffer, a diet high in
animal protein may lead to increased urinary loss of calcium.
Every gram of protein metabolized in adults causes an additional 1 mg calcium to be lost in the urine.

Protein associated with decreased bone loss in older women?
Framingham Study
Higher protein intakes were associated with lower bone losses in over 600 men and women, aged 70-90 years.
Hannan, et al (2000). J Bone Miner Res 5(12):2504-12.

Calcium absorption
Vitamin D (sunlight)Fiber (wheat bran)
Oxylate (spinach, rhubarb, beans)
Phytate (beans)
Caffeine (by ~ 3 mg Ca per cup of coffee) Phosphorus
Heaney RP (1996). Nutrition and risk for osteoporosis. In: Marcus R, Feldman D & Kelsey JL (eds) Osteoporosis. Academic Press, New York, pp 483-510.
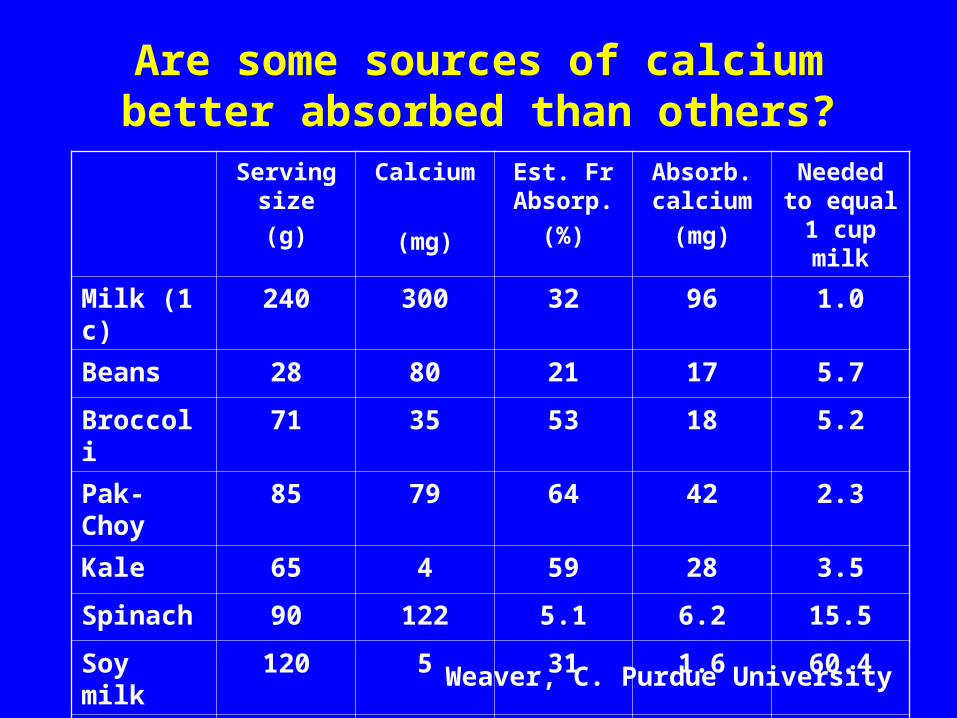
Are some sources of calcium better absorbed than others?Serving
size
(g)
Calcium
(mg)
Est. Fr Absorp.
(%)
Absorb. calcium
(mg)
Needed to equal 1
cup milk
Milk (1 c) 240 300 32 96 1.0
Beans 28 80 21 17 5.7
Broccoli 71 35 53 18 5.2
Pak-Choy 85 79 64 42 2.3
Kale 65 4 59 28 3.5
Spinach 90 122 5.1 6.2 15.5
Soy milk 120 5 31 1.6 60.4
Tofu 126 258 31 80 1.2
Weaver, C. Purdue University

Phosphorus decreases calcium absorption?
• In animal studies, phosphorus shown to result in changes in calcium-regulating hormones (decreasing serum 1,25 (OH)2D3) that may compromise bone health.
Calvo, M.(1993). J. Nutr. 123:1627-33.
• In 460 high school females, cola consumption associated with bone fractures. OR = 3.1 (1.5,6.8)
Wyshak, G. (2000). Arch Pediatr Adol Med. 154:610-3.

Vitamin D
• Aids in absorption and utilization of Ca
• Sunlight converts precursors in skin
• Vitamin D status measured by serum 25-hydroxy vitamin D
• Vitamin D levels with age

Are Americans deficient in Vitamin D?
Recent IOM Report (2010):• Majority of North Americans receive adequate
Vitamin D.• The majority receive significant levels from
sun exposure.• Some subgroups are at risk of receiving
inadequate levels. E.g. The elderly living in institutions or people
with darker pigmentation.

How do we determine dietary adequacy?
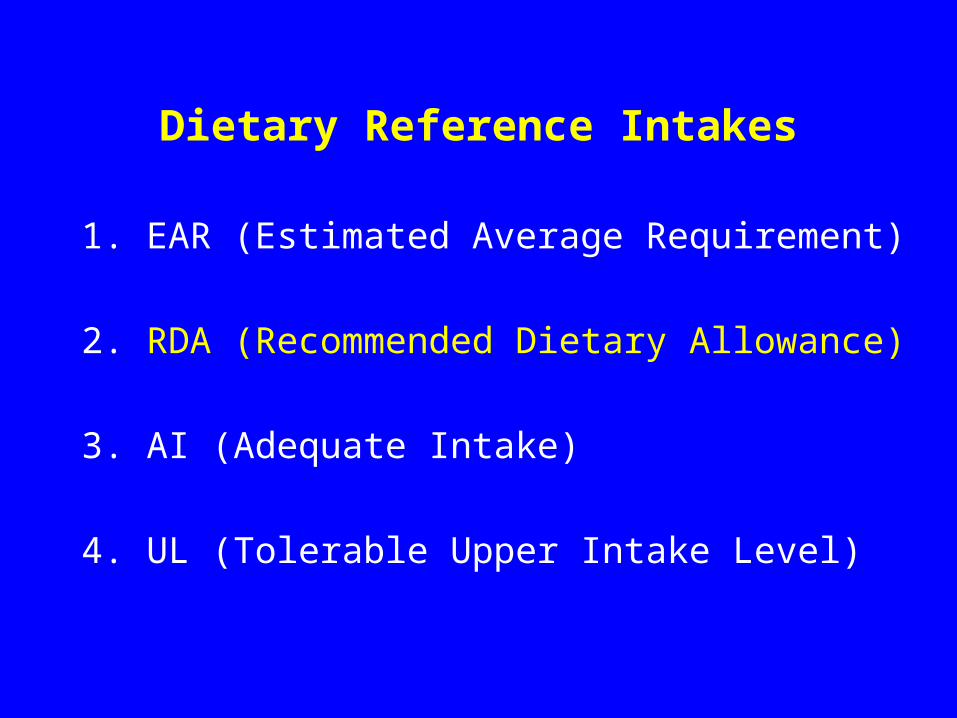
Dietary Reference Intakes
1. EAR (Estimated Average Requirement)
2. RDA (Recommended Dietary Allowance)
3. AI (Adequate Intake)
4. UL (Tolerable Upper Intake Level)
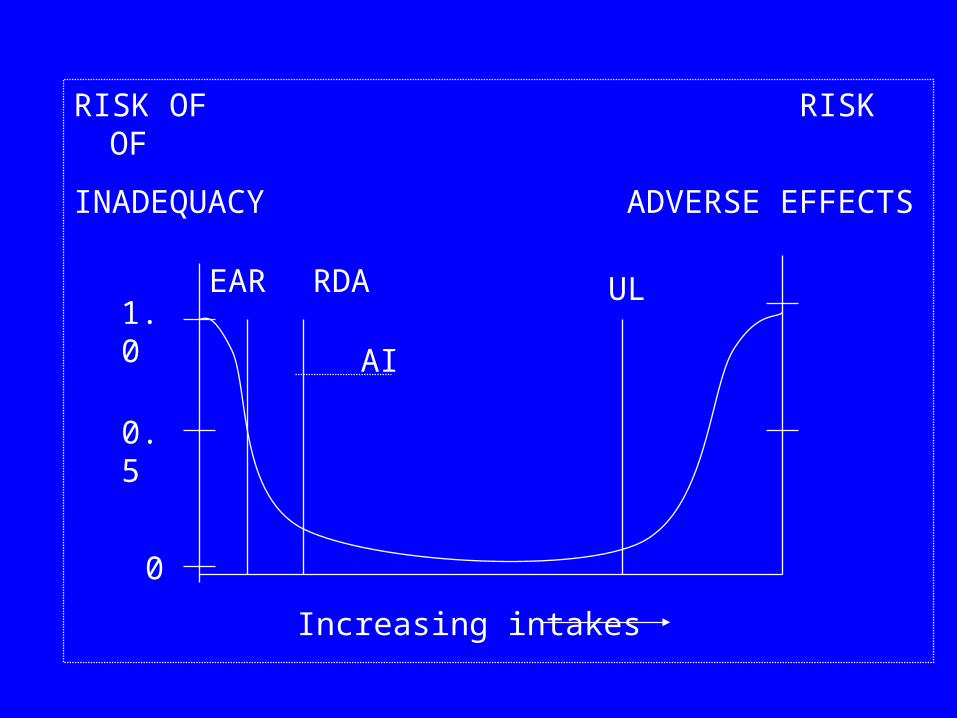
EAR
RISK OF RISK OF
INADEQUACY ADVERSE EFFECTS
RDA
AI
UL1.0
0.5
0
Increasing intakes

Vitamin D: Dietary Reference Intakes
• Vitamin D intake may come from diet or sun exposure.
• RDA recently increased (previously, no RDA, just AI)
• People age 71 and above may require up to 800 IUs/day due to potential body changes while aging.


Vitamin D: Dietary Reference Intakes
Vitamin D intake surpassing 4,000 IUs per day increases the risk for harm.
• Very high levels of Vitamin D (above 10,000 IUs per day) are known to cause tissue and kidney damage.
• Limited evidence on potential risks for low levels of Vitamin D intake, but preliminary studies suggests adverse health effects.

• Modulation of cell growth• Neuromuscular • Immune • Reduction of inflammation
Other functions of Vitamin D

Serum 25-hydroxy vitamin D & Health
From: http://ods.od.nih.gov/factsheets/VitaminD-HealthProfessional/

From Kaye, 2007. JADA 138:619
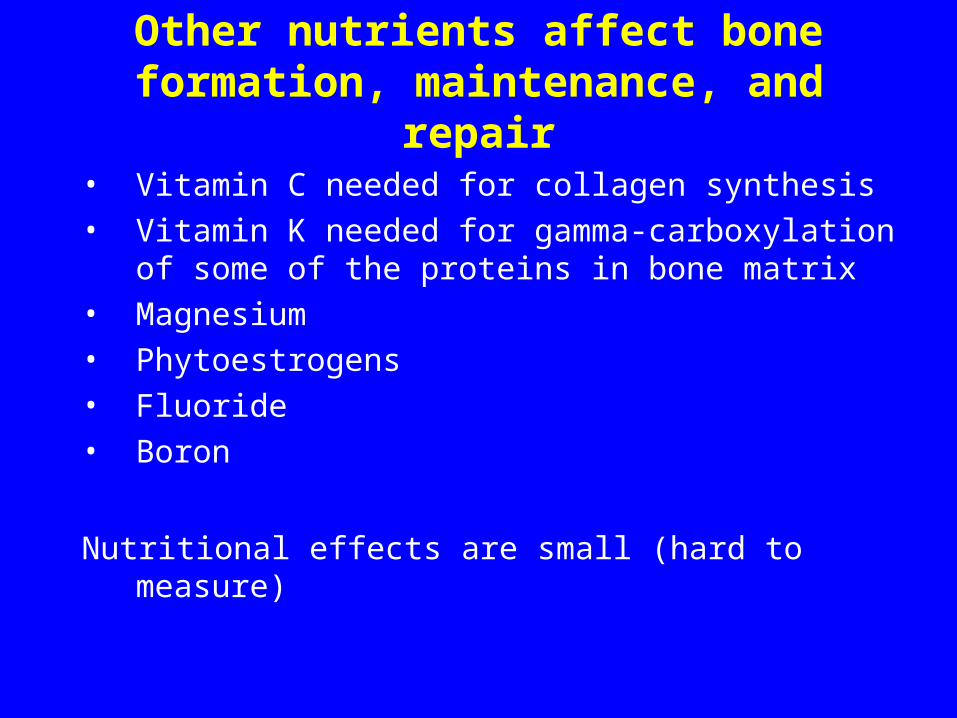
Other nutrients affect bone formation, maintenance, and repair
• Vitamin C needed for collagen synthesis• Vitamin K needed for gamma-carboxylation
of some of the proteins in bone matrix• Magnesium• Phytoestrogens• Fluoride• Boron
Nutritional effects are small (hard to measure)
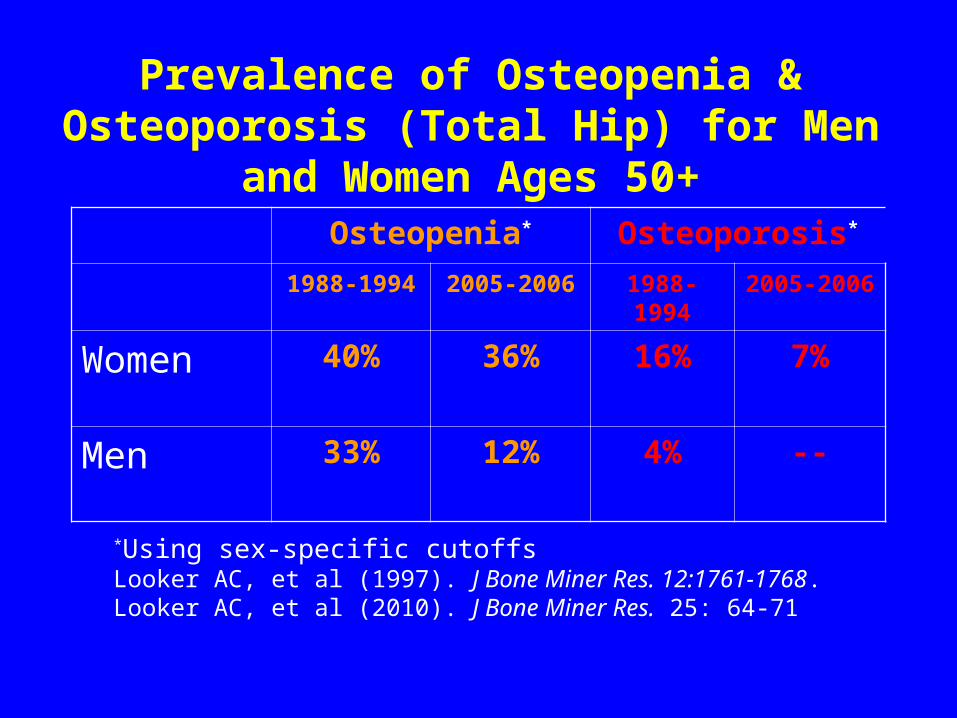
Prevalence of Osteopenia & Osteoporosis (Total Hip) for Men and Women Ages 50+
Osteopenia* Osteoporosis*
1988-1994 2005-2006 1988-1994 2005-2006
Women 40% 36% 16% 7%
Men 33% 12% 4% --
*Using sex-specific cutoffsLooker AC, et al (1997). J Bone Miner Res. 12:1761-1768.Looker AC, et al (2010). J Bone Miner Res. 25: 64-71

Prevalence of Osteopenia & Osteoporosis for Women Ages 50+ by race/ethnicity
Looker AC, et al (1997). J Bone Miner Res. 12:1761-1768.
Looker AC, et al (2010). J Bone Miner Res. 25: 64-71
Women Osteopenia Osteoporosis1988-1994 2005-2006 1988-1994 2005-2006
NH Whites 41% 39% 16% 8
NH Blacks 28% 25% 10% 8
Mexican American
38% 22% 18% 8
Total 39% 37% 16% 8
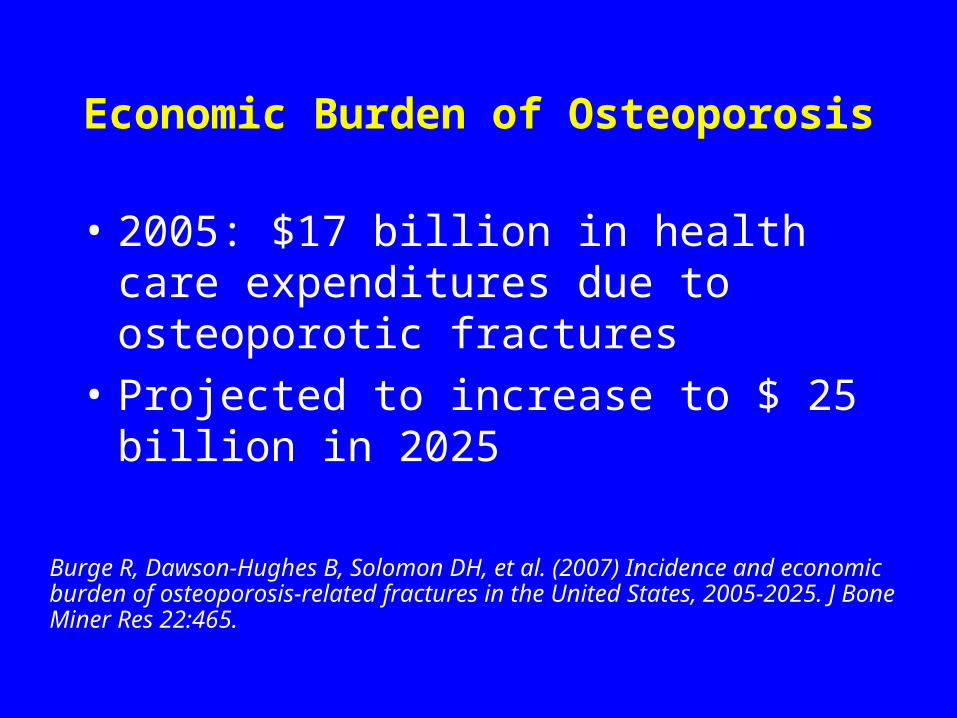
Economic Burden of Osteoporosis
• 2005: $17 billion in health care expenditures due to osteoporotic fractures
• Projected to increase to $ 25 billion in 2025
Burge R, Dawson-Hughes B, Solomon DH, et al. (2007) Incidence and economic burden of osteoporosis-related fractures in the United States, 2005-2025. J Bone Miner Res 22:465.

Promoting bone health - lifestyle
• Adequate calcium intake (from food and then supplements)http://depts.washington.edu/bonebio/ASBMRed/exercise/calcium.html
• Adequate fruits and vegetables
• Weight-bearing exercise http://depts.washington.edu/bonebio/ASBMRed/exercise.html

Some Resources
International Osteoporosis Foundation: www.iofbonehealth.orgNational Osteoporosis Foundation: www.nof.orgOsteoporosis Society of Canada: www.osteoporosis.caPowerful Bones. Powerful Girls: www.cdc.gov/powerfulbonesThe National Women's Health Information Center: www.4woman.govNational Dairy Council: http://www.nationaldairycouncil.org/Pages/Home.aspxDairy Council of California: www.dairycouncilofca.orgFoundation for Osteoporosis Research & Education: www.fore.orgIOM Report on calcium and Vitamin D: http://www.iom.edu/~/media/Files/Report%20Files/2010/Dietary-
Reference-Intakes-for-Calcium-and-Vitamin-D/Vitamin%20D%20and%20Calcium%202010%20Report%20Brief.pdf