Embed Size (px)
Citation preview
Bone Conduction Transducers:output force dependency on load condition
Diana Cortes
Department of Signals and SystemsChalmers University of Technology
SE-412 96 Goteborg, Sweden
September 4, 2002
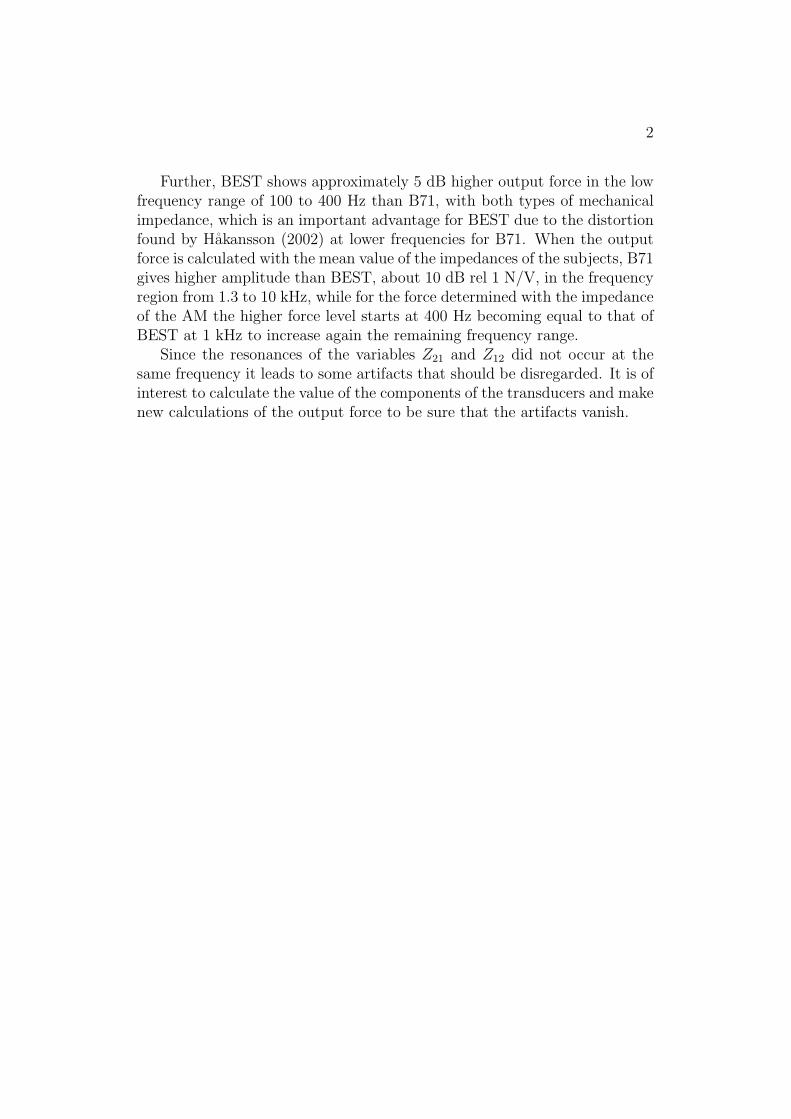
Abstract
The aim of this investigation is to determine the output force variability of thenew bone conduction transducer, called balanced electromagnetic separationtransducer (BEST), and of the conventional transducer from Radioear B71.The variability of the output force is dependent on different load conditions.The loads used were the mechanical impedance of the skull of thirty testpersons and the mechanical impedance of the artificial mastoid (AM) 4930from Bruel & Kjær. The hypothesis is that BEST has less variability sinceit has inherent damping of the spring elements, while B71’s damping takesplace through the skin and the soft tissue, i.e. the damping is mostly patientdependent. The output force of the transducers were determined in threedifferent ways:
1. Transducer modelled as a four pole equivalent.
2. Transducer modelled as an impedance analogy lumped parameter model.
3. Direct measurement using the AM (not completed in this study).
Models of the transducers were determined from frequency response mea-surements simply called variables in this report.
As it was expected the variation of the output force calculated with themechanical impedance of the test persons was less for BEST than for B71.For BEST, the standard deviation of the force is approximately +2 to −3 dBat 316 Hz while for B71 the deviation at 200 to 500 Hz is up to +4 to −10dB. Both transducers show greater load dependency at higher frequencies.BEST has a standard deviation range from +0.8/ − 1 dB to +3/ − 5 dB inthe frequency region from 0.8 to 3 kHz. B71 shows a standard deviation inforce of +4 to −6 dB from 1.2 to 10 kHz.
The results also show that, though the mechanical impedances of the testobjects and the impedance of the artificial mastoid are very different (about 7dB relative to 1 Ns/m between the mean and AM) the output force does notdiffer as much as the impedances. Comparing the output forces with BESTand the two impedances (mean human skull and AM), it yields lower forcemagnitude when the force is calculated with the mean value of the impedanceof the test objects (up to 10 dB rel 1 N/V for the frequencies from 1.3 to 10kHz). B71 shows also lower force magnitude with the impedance of the testpersons than with the impedance of AM but beginning at a lower frequencythan BEST, (from 6 up to 10 dB rel 1 N/V for 0.4 to 10 kHz).
2
Further, BEST shows approximately 5 dB higher output force in the lowfrequency range of 100 to 400 Hz than B71, with both types of mechanicalimpedance, which is an important advantage for BEST due to the distortionfound by Hakansson (2002) at lower frequencies for B71. When the outputforce is calculated with the mean value of the impedances of the subjects, B71gives higher amplitude than BEST, about 10 dB rel 1 N/V, in the frequencyregion from 1.3 to 10 kHz, while for the force determined with the impedanceof the AM the higher force level starts at 400 Hz becoming equal to that ofBEST at 1 kHz to increase again the remaining frequency range.
Since the resonances of the variables Z21 and Z12 did not occur at thesame frequency it leads to some artifacts that should be disregarded. It is ofinterest to calculate the value of the components of the transducers and makenew calculations of the output force to be sure that the artifacts vanish.
CONTENTS i
Contents
1 Introduction 1
2 Material, Methods and Apparatus 22.1 Mechanical Impedance Measurement . . . . . . . . . . . . . . 22.2 Two-port network - frequency response measurements . . . . . 52.3 The stimulation force . . . . . . . . . . . . . . . . . . . . . . . 10
3 Results 123.1 Mechanical impedance . . . . . . . . . . . . . . . . . . . . . . 123.2 Two-port frequency response functions . . . . . . . . . . . . . 123.3 The stimulation force . . . . . . . . . . . . . . . . . . . . . . . 12
4 Discussion 24
5 Conclusions 27
6 Acknowledgment 28

LIST OF FIGURES ii
List of Figures
1 Air view of measurement setup . . . . . . . . . . . . . . . . . 32 Measurement setup . . . . . . . . . . . . . . . . . . . . . . . . 43 Four pole equivalent . . . . . . . . . . . . . . . . . . . . . . . 64 Model of the bone conduction transducer . . . . . . . . . . . . 65 Measurement of the variable Z11. . . . . . . . . . . . . . . . . 76 Measurement of the variable Z21. . . . . . . . . . . . . . . . . 87 Measurement of the variable Z12. . . . . . . . . . . . . . . . . 98 Measurement of the variable Z22. . . . . . . . . . . . . . . . . 109 Magnitude and phase of mechanical impedance of test objects
and AM . . . . . . . . . . . . . . . . . . . . . . . . . . . . . . 1310 Mechanical impedance of the skull with different static forces . 1411 Magnitude and phase of Z11 with BEST and B71 . . . . . . . 1512 Magnitude and phase of Z21 with BEST and B71 . . . . . . . 1613 Magnitude and phase of Z12 with BEST and B71 . . . . . . . 1714 Magnitude and phase of Z22 with BEST and B71 . . . . . . . 1815 The stimulation force (SF) of BEST and B71 . . . . . . . . . . 1916 Mean value and standard deviation of stimulation force for
both transducers . . . . . . . . . . . . . . . . . . . . . . . . . 2017 SF for BEST and B71 with two different impedances . . . . . 2218 Comparison of SF with mean value impedance and with AM
impedance . . . . . . . . . . . . . . . . . . . . . . . . . . . . . 23
1 INTRODUCTION 1
1 Introduction
Conventional bone conduction transducers of the variable reluctance typeused in clinical audiometric testing of patients with different hearing impair-ments are usually calibrated with commercially available artificial mastoidsthat should have identical mechanical impedance as a normal patient in orderto avoid pronounced interference between the transducer and the impedanceof the patient. Therefore, if the impedances are not identical, the test resultmight not be as accurate as desired for the design purpose of an adequatehearing aid aimed to help the patient in question. Some bone conductiontransducers have not internal damping making their characteristics, for in-stance the output force, strongly patient dependent since the damping isperformed by the skin and underlying tissue of the patient.
The new bone conduction transducer called the balanced electromagneticseparation transducer, BEST, has inherent damping on the internal springsuspension which hypothetically should make it less patient dependent result-ing in smaller variations in output force and contributing to more accuratetesting results. Hakansson (2002) investigated the main characteristics, i.e.frequency response function, distortion and electrical input impedance, oftwo bone conduction transducers, BEST and B71 from Radioear, and foundthat BEST had higher amplification, lower distortion and higher electricalinput impedance than B71. Thus, BEST constitutes a significant improve-ment of the functional quality of a bone conduction transducer which is dueto the design with the balanced armature and the separated static- and signalfluxes. It is of interest to determine how the output force of the transducersare affected by the load condition. For that reason a new study has to bemade considering the differences in mechanical impedance that human be-ings can present and the model variables of the transducers, that may bemeasured or calculated.
The aims of this investigation are then to:
• measure the mechanical point impedance (skin impedance) of a largernumber of living subjects.
• model the transducers as a four pole equivalent and measure corre-sponding frequency response functions (FRF) and,
• with the impedances and the model variables determine the variabilityof the output force of the transducer assuming that the input voltageis constant.
The mechanical impedance of the artificial mastoid 4930 from B&K isalso used as a load ZL for comparison reasons.
2 MATERIAL, METHODS AND APPARATUS 2
2 Material, Methods and Apparatus
A group of thirty normal hearing subjects participated in the measurement ofmechanical point impedance of the temporal bone without skin penetration(Skin impedance). The group, mostly colleagues at the department of Signaland Systems, consisted of 18 males and 12 females with ages between 22 and51 with a mean of 30.6 years.
The measurements were performed with a two channel FFT-analyzer HP-3562A from Hewlett Packard, a mini-shaker type 4810 from Bruel & Kjær(B&K), the impedance heads 8000 and 8001 from B&K, the charge amplifierstype 2635 and 2651 from B&K and a power amplifier, Sony TA-N220. Themechanical impedance of the artificial mastoid B&K 4930 was also measuredfor reference purpose. The bone conduction transducer was modelled as afour pole equivalent or a two-port network. A two-port network has fourfrequency response functions or variables that have been measured. Thetransducers used in the measurement of the model parameters were: B71 nr.86-5 from Radioear and the balanced electromagnetic separation transducerBEST nr. 3. The latter is called B3 in this report. Both transducers wereencased in the same type of plastic housing. The weight varies, however.The B71 has a weight of 19.2 grams and BEST has a weight of 13 grams.
2.1 Mechanical Impedance Measurement
Mechanical impedance, Z, is a complex quantity that can be defined as theresistance of a structure to be set in motion. A dynamic force, F(jω), appliedto the structure will result in a certain velocity of the structure, v(jω), inaccordance with equation (1) where ω is the excitation angular frequency.Both the magnitude and the phase of the applied force and the resultantvelocity have to be determined for an accurate and complete measurement.Moreover, measurements have to be made at a large number of frequenciesto obtain an acceptable frequency resolution.
Z(jω) = F (jω)/v(jω) (1)
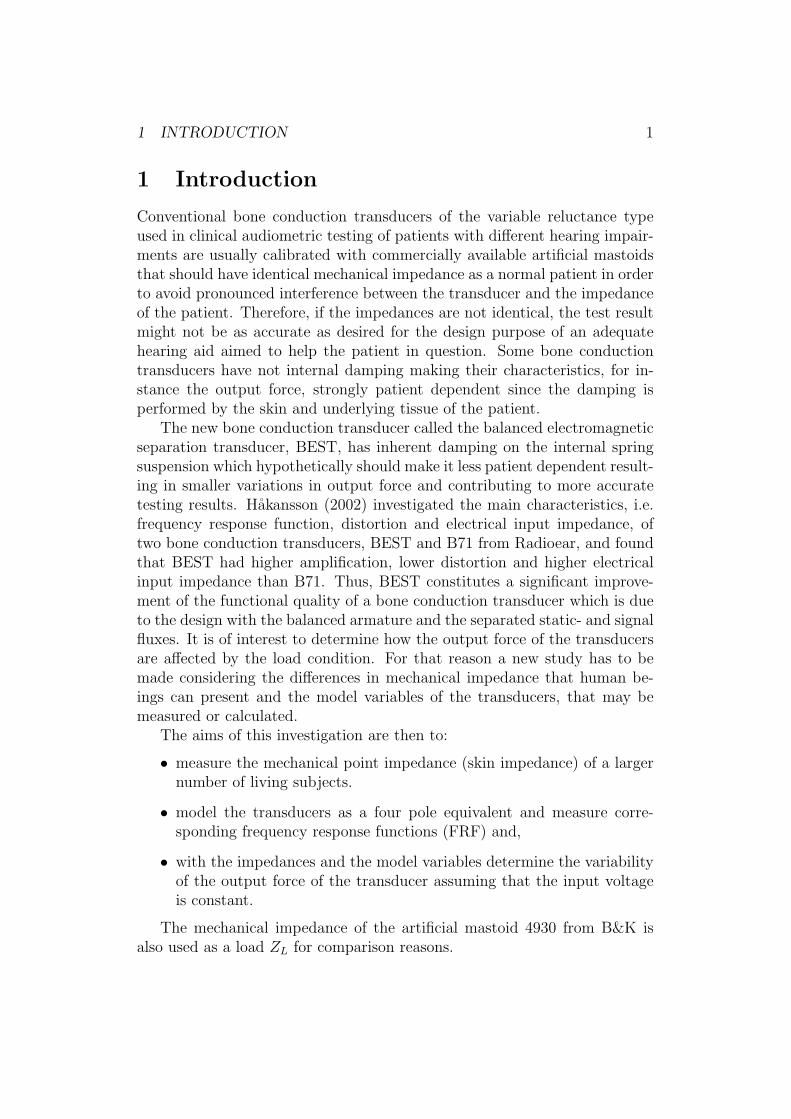
The impedance head type 8000 and the necessary adaptors were pressedagainst the right side of the head with a static force F, (approx. 5.9 N)generated by a weight (599 grams) as shown in figure 1. The neck wasresting on a V-formed cushion used to stabilize and reduce the movementartifacts from the head, avoiding contribution to the skin impedance. Theimpedance head was always placed on the flattest part of the mastoid portionof the temporal bone in order to obtain maximum contact with the skin.
2 MATERIAL, METHODS AND APPARATUS 3
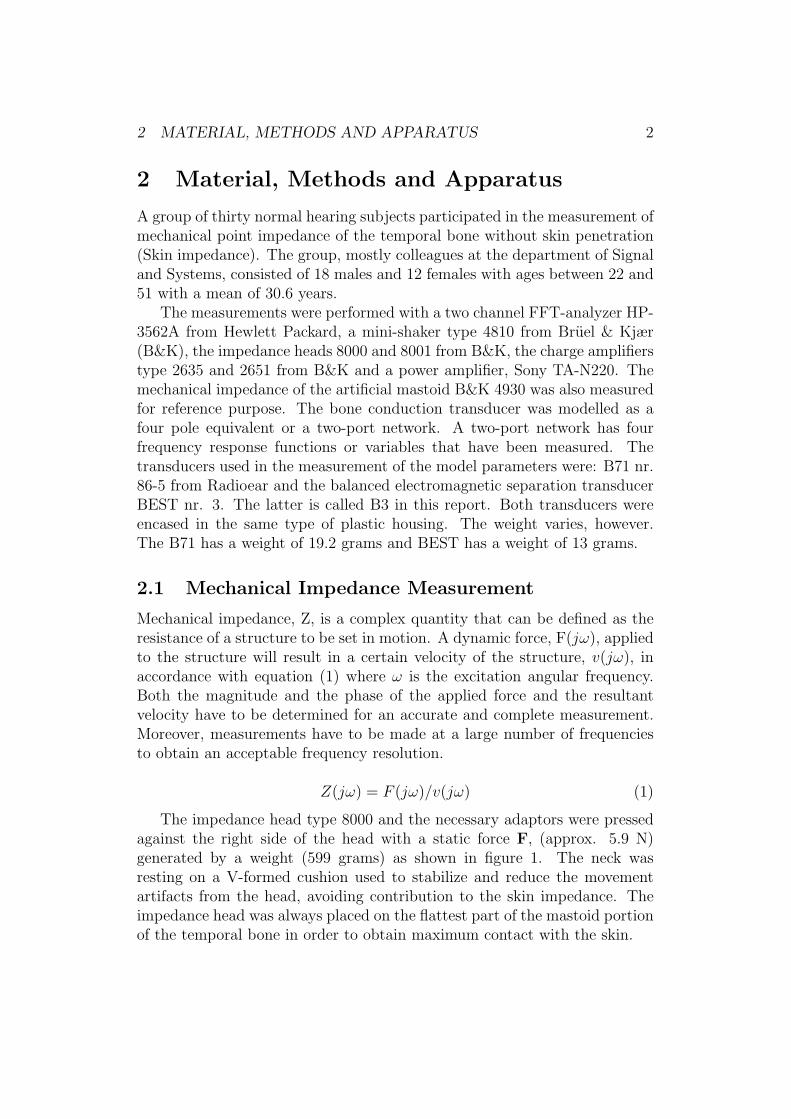
The mini-shaker 4810 was supplied with the source signal of the FFTanalyzer HP-3562A via a signal amplifier. Charge amplifiers amplified thesignals from the B&K impedance head type 8000. The signal for the outputforce F in equation (1) was registered on channel two and the accelerationsignal on channel one. A complete diagram of the measurement setup isshown in figure 2. Both random noise signal and a sinus sweep signal wereused in all measurements in this study.
MinishakerB&K 4810
ImpedanceHead
B&K 8000
Human Head
Weight
Angle 90º
Nose
Thread
Rotation center
Metal Bar
Generated Force
F
Figure 1: Mechanical impedance measurement setup seen from the air. Thedirection of the pressing static force F is shown with a white arrow.
Before starting the measurements, a calibration process for the impedancehead B&K 8000 was made. This calibration consisted of measurement of theapparent mass (force/acceleration) of a known mass (m = 49.9 grams). Thesensitivity of the analyzer was then adjusted so that its output at 0.1 kHzagreed with the known mass plus the mass, m0 = 1.1 grams, above the forcegauge of the impedance head. The adjustment was made in the engineerunits (EU) on channel two of the FFT-analyzer, with a value of 98 EU/V. Anew measurement was made without loading the impedance head in order toget the apparent mass of the mass above the force gauge inside the impedancehead for future compensation in the calculation of the mechanical impedance.
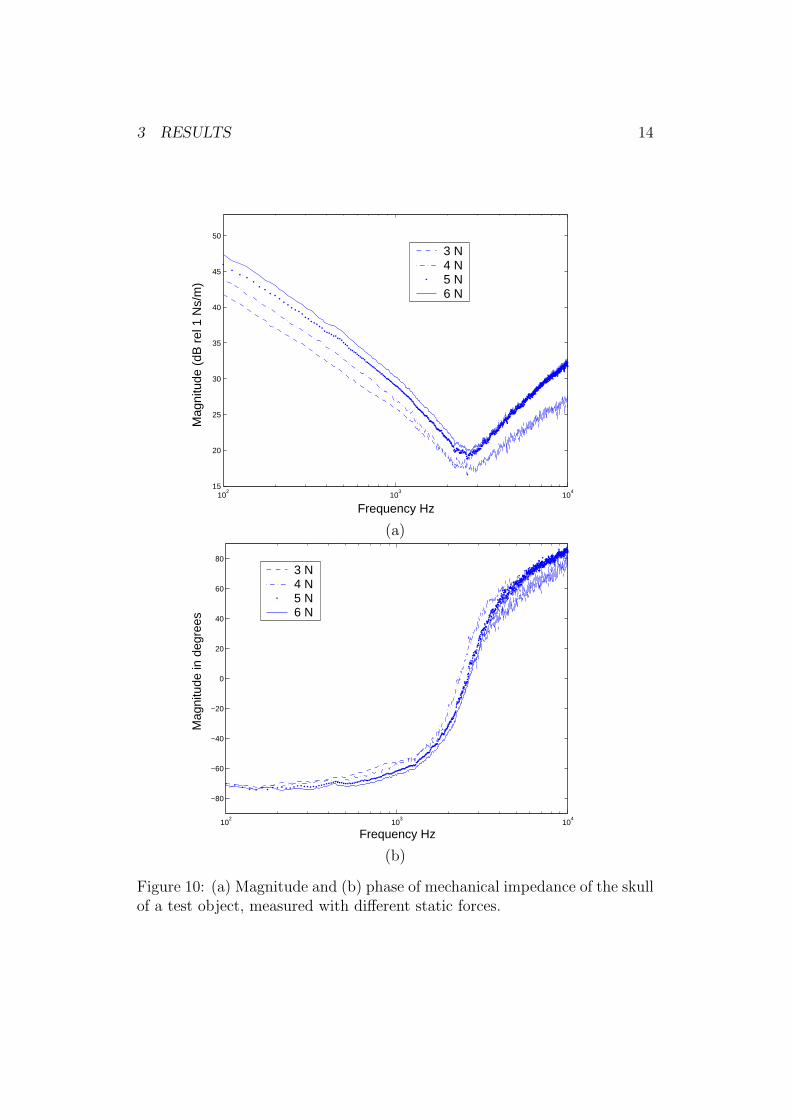
The skin impedance was also measured with four different weights, (300,400, 500 and 600 grams) corresponding to 3, 4, 5 and 6 Newton, to observehow the impedance of the skull changes with different static forces.
2 MATERIAL, METHODS AND APPARATUS 4
HumanHead
Back Side B&K 4810Mini shaker
PowerAmplifier
VA
VF
A
F
B&K 8000
Display HP 3562A
Source Ch1 Ch2
ChargeAmp.
ChargeAmp.
VA VF
Figure 2: Setup for the measurement of mechanical impedance.
A “quality” factor of the estimated frequency response is the coherencefunction γ2(jf), where 0 < γ2(jf) < 1. Under ideal circumstances, thecoherence function γ2(jf) is unity. The coherence function γ2(jf) was ex-amined for each person, to consider if the measurement should be accepted ornot. The acceptance limit was γ2(jf) > 0.95. In order to achieve maximumsignal-to-noise ratio, the measurements were performed at a loudness levelas high as possible but still comfortable for the test person.
Applying the signal via a power amplifier, vibrations were generated tothe mini-shaker B&K 4810. The impedance head was rigidly attached to themini-shaker. Force and acceleration outputs from the impedance head wereamplified by charge preamplifiers B&K 2651 and B&K 2635, respectively.From the measured frequency response F/A, the apparent mass of the massabove the force gauge was subtracted and the acceleration was integratedin order to convert it into velocity. This can easily be done with the FFTanalyzer by multiplying F/A by jω, where ω = 2πf and j is the complexconstant. The same calculation can also be accomplished in Matlab, whichwas the case in this study.
The FFT analyzer computes the mechanical point impedance Z(jf ) withthe two channels cross spectrum SFA and the channel one power spectrumSAA according to equation (2), where the subscript A stands for accelerationand the subscript F stands for force. The minus sign compensates for thesign shift introduced by the accelerometer.
Z(jf) = −jω · SFA
SAA
(2)
2 MATERIAL, METHODS AND APPARATUS 5
With random noise, averaging is necessary to achieve an acceptable signal-to noise ratio. Thirty consecutive time records (n = 30) have been usedfor the averaging process, since they are enough to reduce the stationaryrandom noise, but not too many to make the total measurement too long andannoying for the test person. The total measurement time was approximately45 seconds for the random noise and approximately 90 seconds for the sinussweep. No averaging was used when the sinus sweep measurements weremade.
The overall accuracy of the mechanical point impedance measurementwith the present method and apparatus is dependent on several factors ofwhich the following probably cause the most serious errors: (1) poor signal-to-noise ratios and nonlinearities, i.e., low coherence values; (2) calibrationaccuracy of gain factors; (3) interaction of the measuring force gauge compli-ance with the measured impedance and imperfect mass compensation; and(4) bias errors due to noise in the acceleration channel. The magnitude ac-curacy of the present measurement apparatus was estimated to +20% to−10% for 100 to 400 Hz and ±10% for 400 Hz to 10 kHz, the phase errorwas estimated to ±9 for 100 Hz to 5 kHz and ±15 for 5 to 10 kHz. Thesenumbers are based on a random error corresponding to a coherence value of0.95 and a confidence interval of 95%, a channel-to-channel match error andcalibration error of ±3.5% in magnitude and ±5 in phase. Further detailsof error analysis can be found in Bendat and Piersol (1980).
2.2 Two-port network - frequency response measure-ments
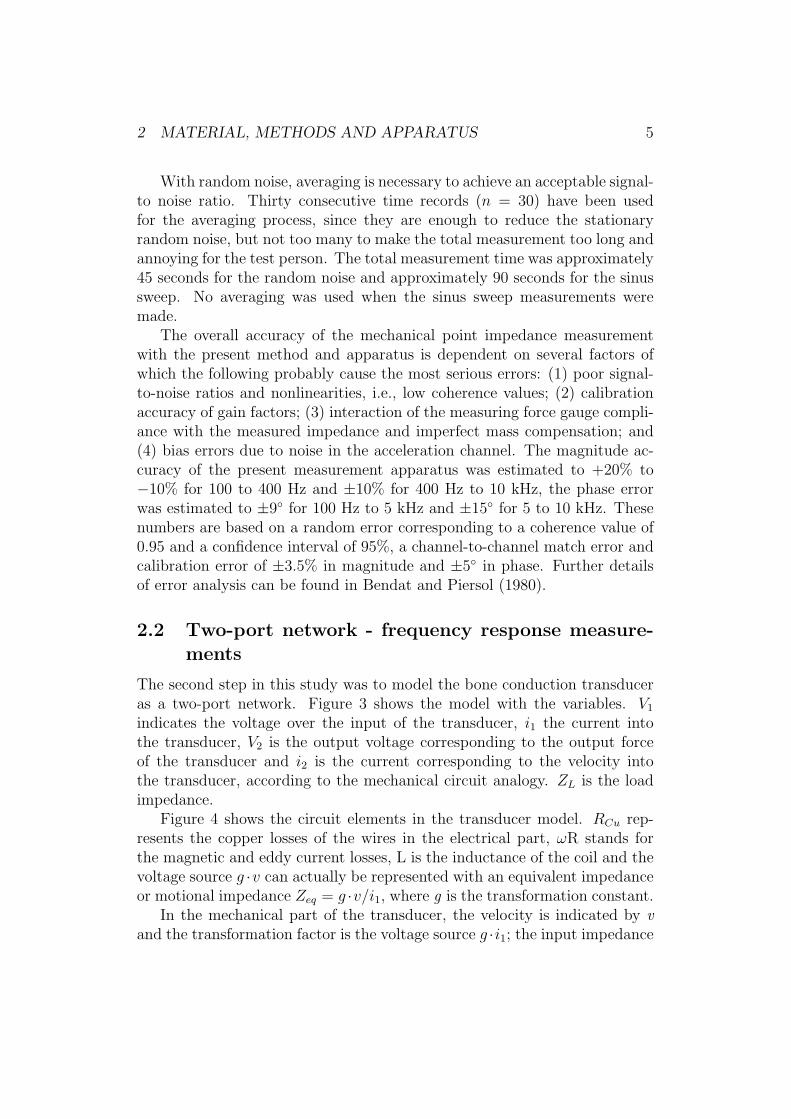
The second step in this study was to model the bone conduction transduceras a two-port network. Figure 3 shows the model with the variables. V1
indicates the voltage over the input of the transducer, i1 the current intothe transducer, V2 is the output voltage corresponding to the output forceof the transducer and i2 is the current corresponding to the velocity intothe transducer, according to the mechanical circuit analogy. ZL is the loadimpedance.
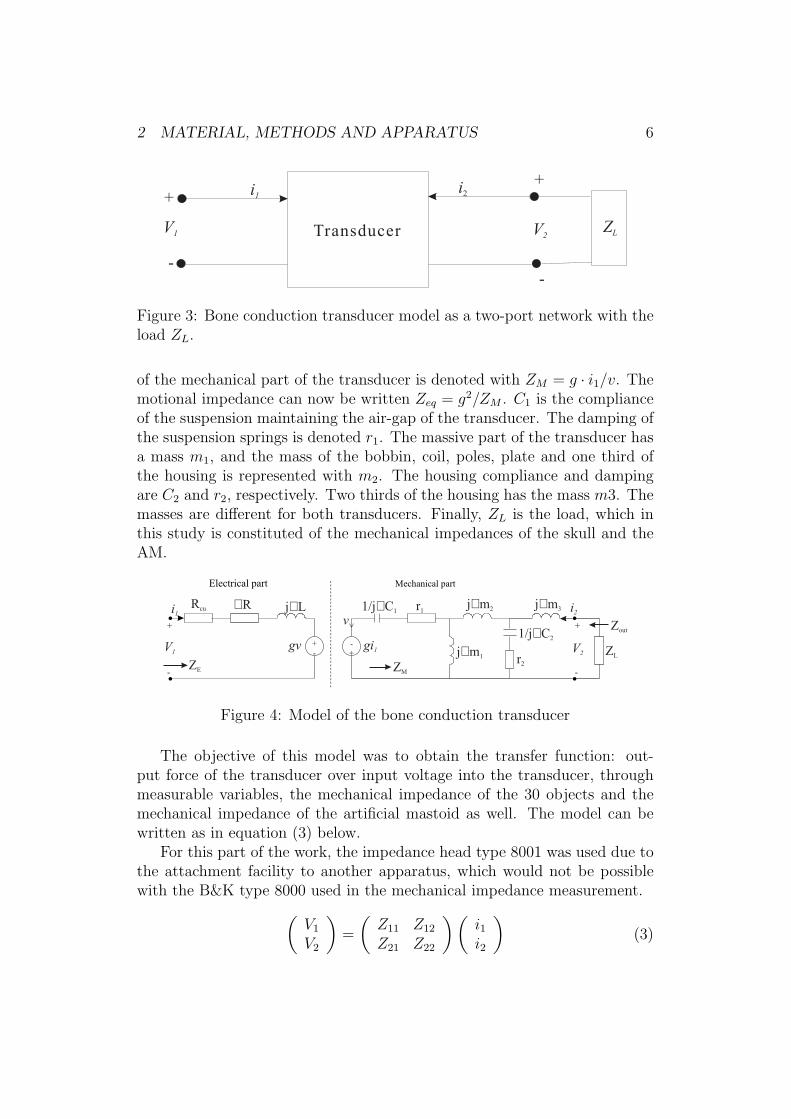
Figure 4 shows the circuit elements in the transducer model. RCu rep-resents the copper losses of the wires in the electrical part, ωR stands forthe magnetic and eddy current losses, L is the inductance of the coil and thevoltage source g ·v can actually be represented with an equivalent impedanceor motional impedance Zeq = g ·v/i1, where g is the transformation constant.
In the mechanical part of the transducer, the velocity is indicated by vand the transformation factor is the voltage source g ·i1; the input impedance
2 MATERIAL, METHODS AND APPARATUS 6
Transducer
i1
-
+
V1
+
-
V2
i2
ZL
Figure 3: Bone conduction transducer model as a two-port network with theload ZL.
of the mechanical part of the transducer is denoted with ZM = g · i1/v. Themotional impedance can now be written Zeq = g2/ZM . C1 is the complianceof the suspension maintaining the air-gap of the transducer. The damping ofthe suspension springs is denoted r1. The massive part of the transducer hasa mass m1, and the mass of the bobbin, coil, poles, plate and one third ofthe housing is represented with m2. The housing compliance and dampingare C2 and r2, respectively. Two thirds of the housing has the mass m3. Themasses are different for both transducers. Finally, ZL is the load, which inthis study is constituted of the mechanical impedances of the skull and theAM.
+
Electrical part
V1
ZE ZM
Zout
ZLV2
j m 3
j m 1
j m 2
r2
1/j C 2
1/j C 1 r1
gi1
i2
v
gv
j LRcu Ri1
Figure 4: Model of the bone conduction transducer
The objective of this model was to obtain the transfer function: out-put force of the transducer over input voltage into the transducer, throughmeasurable variables, the mechanical impedance of the 30 objects and themechanical impedance of the artificial mastoid as well. The model can bewritten as in equation (3) below.
For this part of the work, the impedance head type 8001 was used due tothe attachment facility to another apparatus, which would not be possiblewith the B&K type 8000 used in the mechanical impedance measurement.
(V1
V2
)=
(Z11 Z12
Z21 Z22
) (i1i2
)(3)
2 MATERIAL, METHODS AND APPARATUS 7
From equation (3) the different variables Z11, Z21, Z12 and Z22 can be ex-pressed in a manner that makes it possible to measure them assuming certainconditions. The calibration procedure was the same as described in section2.1. However, there was a difference in weight. A little cone, with a weight of2.15 grams, was used to attach the transducer to the B&K 8001 and the massabove the force gauge in the B&K 8001 is 2.2 grams. Thus, when compensat-ing the mechanical output impedance Z22, the apparent mass of the cone andthe mass above the force gauge, mk0, had to be subtracted from the measuredfrequency response F/A. Each FRF-measurement was performed using thetransducers B71 and the BEST in the place of the transducer appearing inthe figures below.
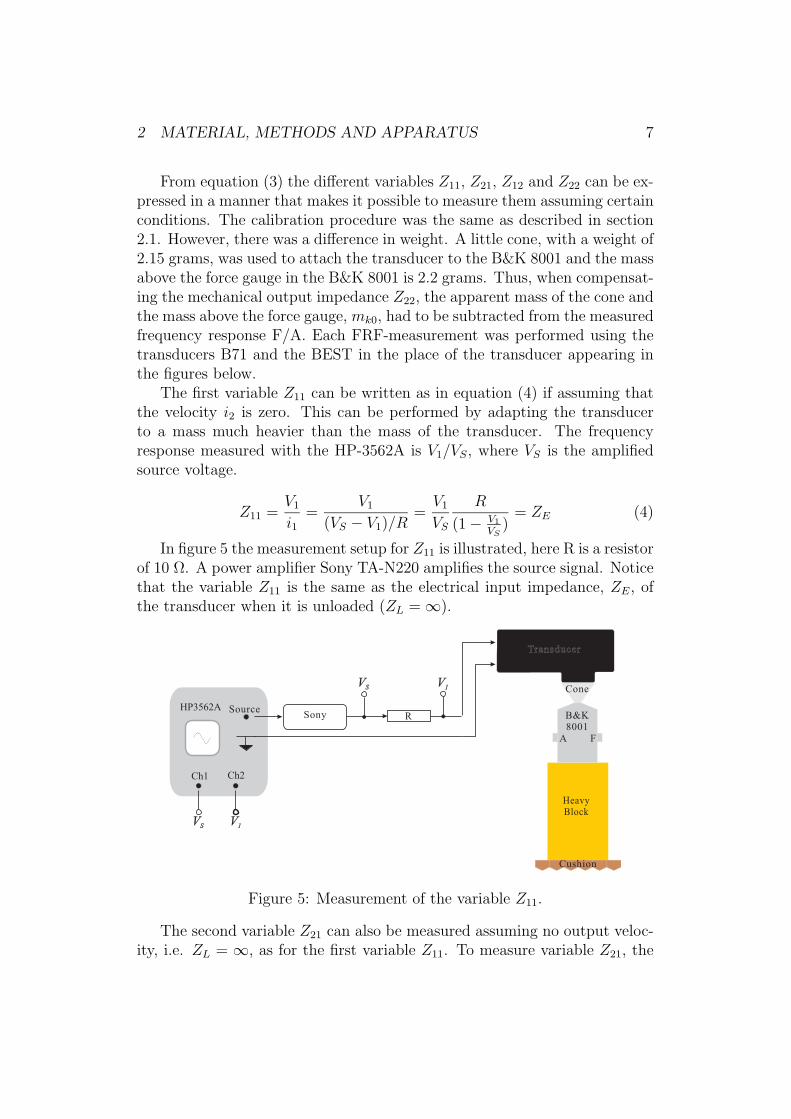
The first variable Z11 can be written as in equation (4) if assuming thatthe velocity i2 is zero. This can be performed by adapting the transducerto a mass much heavier than the mass of the transducer. The frequencyresponse measured with the HP-3562A is V1/VS, where VS is the amplifiedsource voltage.
Z11 =V1
i1=
V1
(VS − V1)/R=
V1
VS
R
(1 − V1
VS)
= ZE (4)
In figure 5 the measurement setup for Z11 is illustrated, here R is a resistorof 10 Ω. A power amplifier Sony TA-N220 amplifies the source signal. Noticethat the variable Z11 is the same as the electrical input impedance, ZE, ofthe transducer when it is unloaded (ZL = ∞).
SourceSony
HP3562AR
Ch1 Ch2
VSVS V1V1
VSVS V1V1 Cone
Transducer
B&K8001
HeavyBlock
Cushion
A F
Figure 5: Measurement of the variable Z11.
The second variable Z21 can also be measured assuming no output veloc-ity, i.e. ZL = ∞, as for the first variable Z11. To measure variable Z21, the
2 MATERIAL, METHODS AND APPARATUS 8
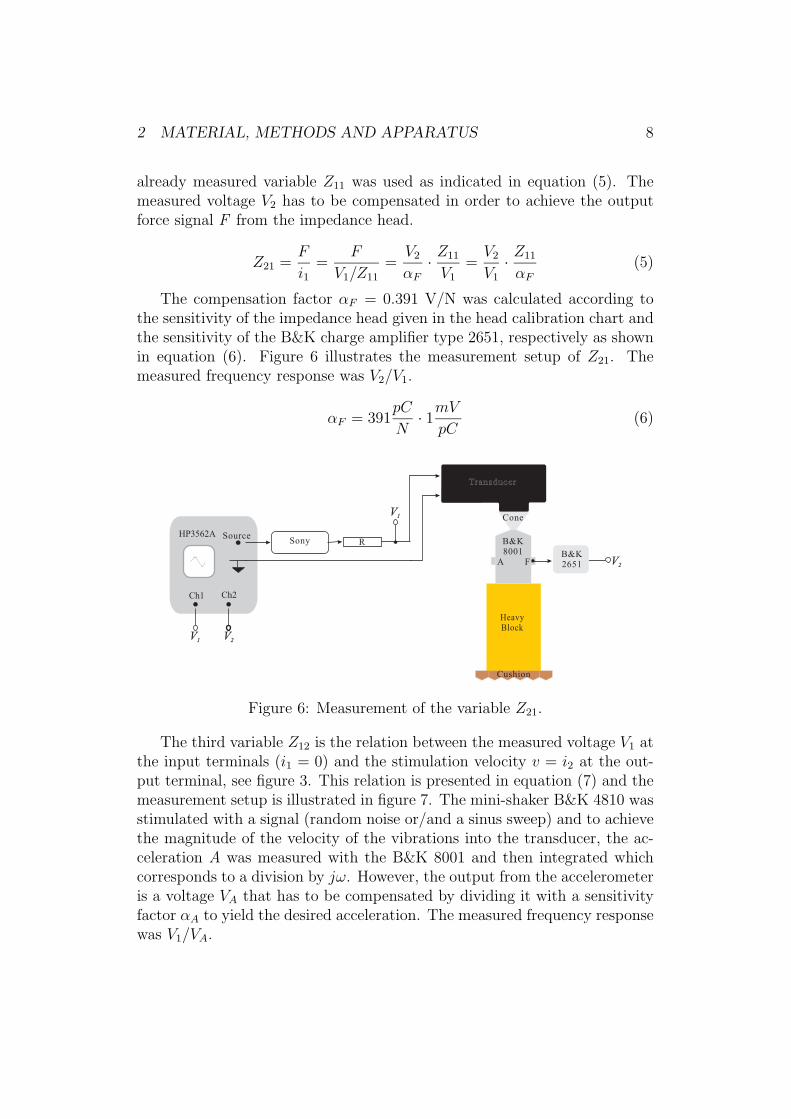
already measured variable Z11 was used as indicated in equation (5). Themeasured voltage V2 has to be compensated in order to achieve the outputforce signal F from the impedance head.
Z21 =F
i1=
F
V1/Z11
=V2
αF
· Z11
V1
=V2
V1
· Z11
αF
(5)
The compensation factor αF = 0.391 V/N was calculated according tothe sensitivity of the impedance head given in the head calibration chart andthe sensitivity of the B&K charge amplifier type 2651, respectively as shownin equation (6). Figure 6 illustrates the measurement setup of Z21. Themeasured frequency response was V2/V1.
αF = 391pC
N· 1mV
pC(6)
SourceSony
HP3562AR
Ch1 Ch2
V1V1 V2V2
V1V1 Cone
Transducer
B&K8001
HeavyBlock
Cushion
A FB&K2651 V2V2
Figure 6: Measurement of the variable Z21.
The third variable Z12 is the relation between the measured voltage V1 atthe input terminals (i1 = 0) and the stimulation velocity v = i2 at the out-put terminal, see figure 3. This relation is presented in equation (7) and themeasurement setup is illustrated in figure 7. The mini-shaker B&K 4810 wasstimulated with a signal (random noise or/and a sinus sweep) and to achievethe magnitude of the velocity of the vibrations into the transducer, the ac-celeration A was measured with the B&K 8001 and then integrated whichcorresponds to a division by jω. However, the output from the accelerometeris a voltage VA that has to be compensated by dividing it with a sensitivityfactor αA to yield the desired acceleration. The measured frequency responsewas V1/VA.
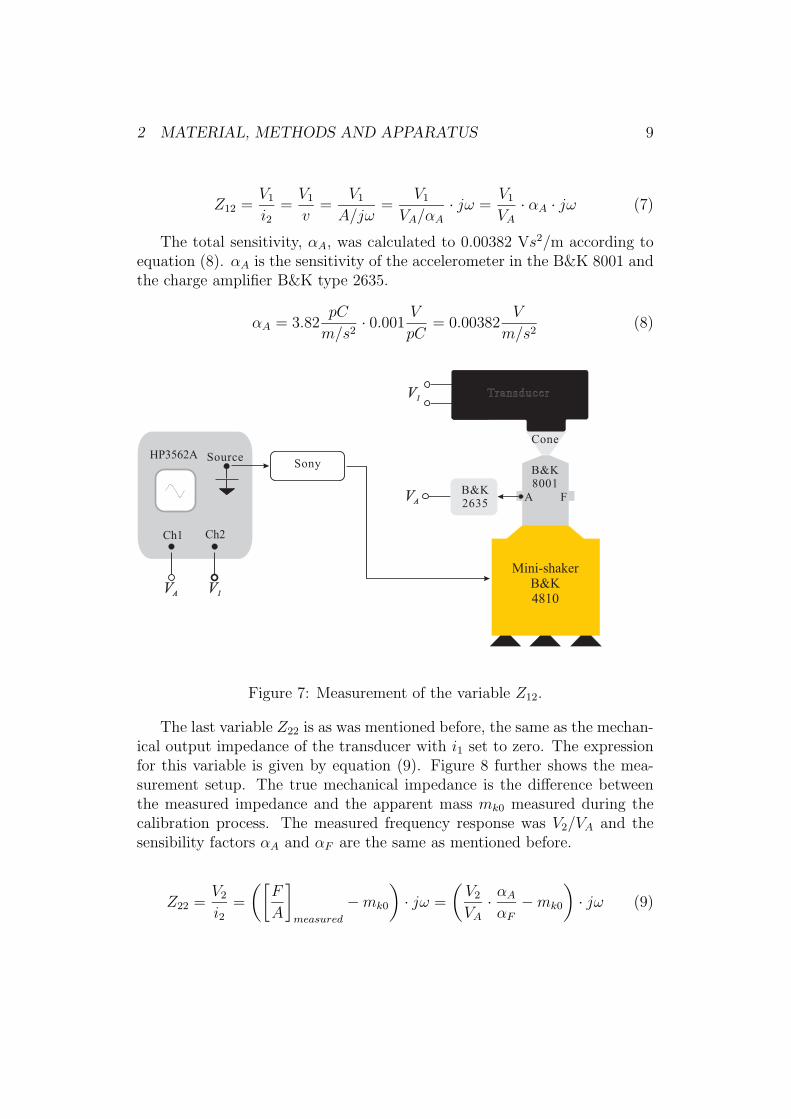
2 MATERIAL, METHODS AND APPARATUS 9
Z12 =V1
i2=
V1
v=
V1
A/jω=
V1
VA/αA
· jω =V1
VA
· αA · jω (7)
The total sensitivity, αA, was calculated to 0.00382 Vs2/m according toequation (8). αA is the sensitivity of the accelerometer in the B&K 8001 andthe charge amplifier B&K type 2635.
αA = 3.82pC
m/s2· 0.001
V
pC= 0.00382
V
m/s2(8)
SourceSony
HP3562A
Ch1 Ch2
VAVA V1V1
V1V1
Cone
Transducer
B&K8001
A FB&K2635
VAVA
Mini-shakerB&K4810
Figure 7: Measurement of the variable Z12.
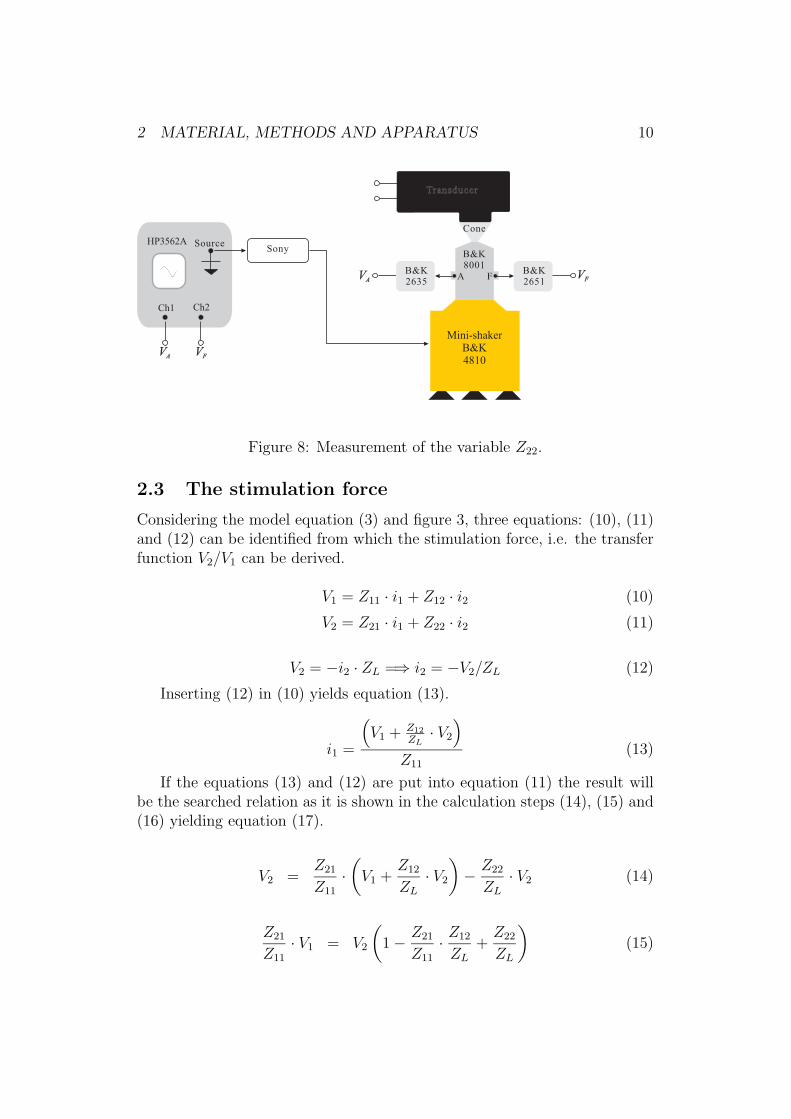
The last variable Z22 is as was mentioned before, the same as the mechan-ical output impedance of the transducer with i1 set to zero. The expressionfor this variable is given by equation (9). Figure 8 further shows the mea-surement setup. The true mechanical impedance is the difference betweenthe measured impedance and the apparent mass mk0 measured during thecalibration process. The measured frequency response was V2/VA and thesensibility factors αA and αF are the same as mentioned before.
Z22 =V2
i2=
([F
A
]measured
− mk0
)· jω =
(V2
VA
· αA
αF
− mk0
)· jω (9)
2 MATERIAL, METHODS AND APPARATUS 10
SourceSony
HP3562A
Ch1 Ch2
VAVA VFVF
VFVF
Cone
Transducer
B&K8001
A FB&K2635
VAVA
Mini-shakerB&K4810
B&K2651
Figure 8: Measurement of the variable Z22.
2.3 The stimulation force
Considering the model equation (3) and figure 3, three equations: (10), (11)and (12) can be identified from which the stimulation force, i.e. the transferfunction V2/V1 can be derived.
V1 = Z11 · i1 + Z12 · i2 (10)
V2 = Z21 · i1 + Z22 · i2 (11)
V2 = −i2 · ZL =⇒ i2 = −V2/ZL (12)
Inserting (12) in (10) yields equation (13).
i1 =
(V1 + Z12
ZL· V2
)Z11
(13)
If the equations (13) and (12) are put into equation (11) the result willbe the searched relation as it is shown in the calculation steps (14), (15) and(16) yielding equation (17).
V2 =Z21
Z11
·(
V1 +Z12
ZL
· V2
)− Z22
ZL
· V2 (14)
Z21
Z11
· V1 = V2
(1 − Z21
Z11
· Z12
ZL
+Z22
ZL
)(15)
2 MATERIAL, METHODS AND APPARATUS 11
Z21
Z11
· V1 = V2
(ZLZ11 − Z21Z12 + Z22Z11
ZLZ11
)(16)
V2
V1
=ZLZ21
ZLZ11 − Z21Z12 + Z22Z11
(17)
Equation (17) with units N/V shows the relation between the force outputfrom the transducer over the voltage applied to it. This transfer functioncan simply be called the stimulation voltage to output force sensitivity of thetransducer. Equation (17) was calculated and plotted in Matlab.
3 RESULTS 12
3 Results
Only the results from the swept sinus measurements are presented here dueto the similarity with the results obtained with the noise random signal.
3.1 Mechanical impedance
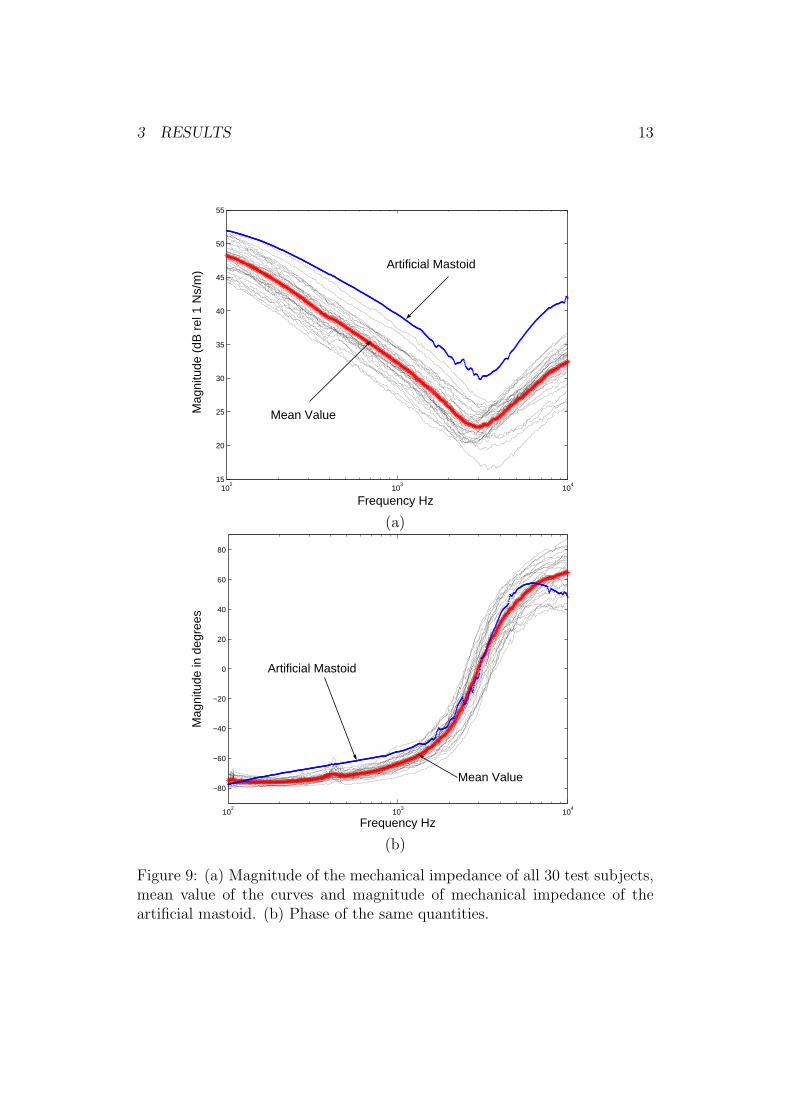
The magnitude and the phase of the mechanical impedance of the skull of allthe test persons are presented in figure 9. The frequency axis is logarithmicand the data covers the frequency range of 0.1 to 10 kHz. The mechanicalimpedance of the artificial mastoid 4930 from B&K is presented in each figurefor comparison purpose.
Figure 10 indicates how the mechanical impedance of the skull changeswith different static forces.
3.2 Two-port frequency response functions
In this section the magnitudes and the phases of the variables with the trans-ducers B71 and BEST are presented. The frequency range of the data is thesame as for the mechanical impedance data, 0.1 to 10 kHz. The transducerB71 nr. 86-5 is denoted as B71 and the BEST nr. 3 is denoted with thename B3.
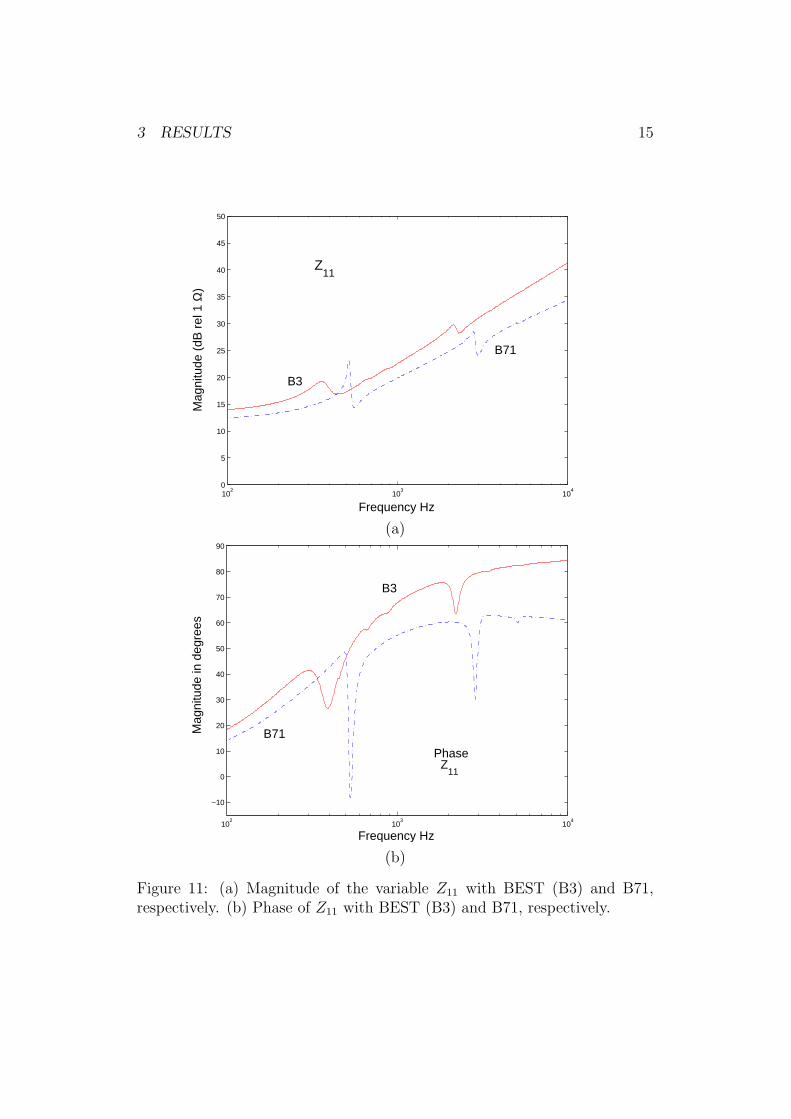
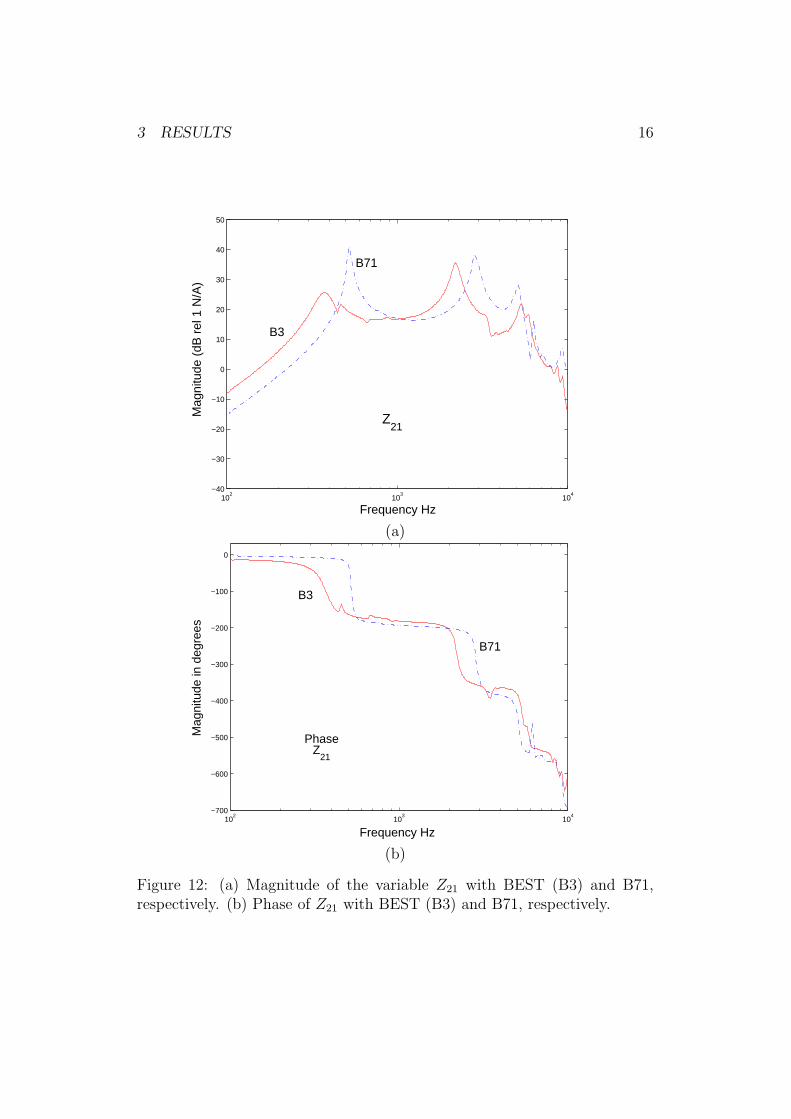
The results for Z11 appear in figure 11, Z21 are shown in figure 12, Z12
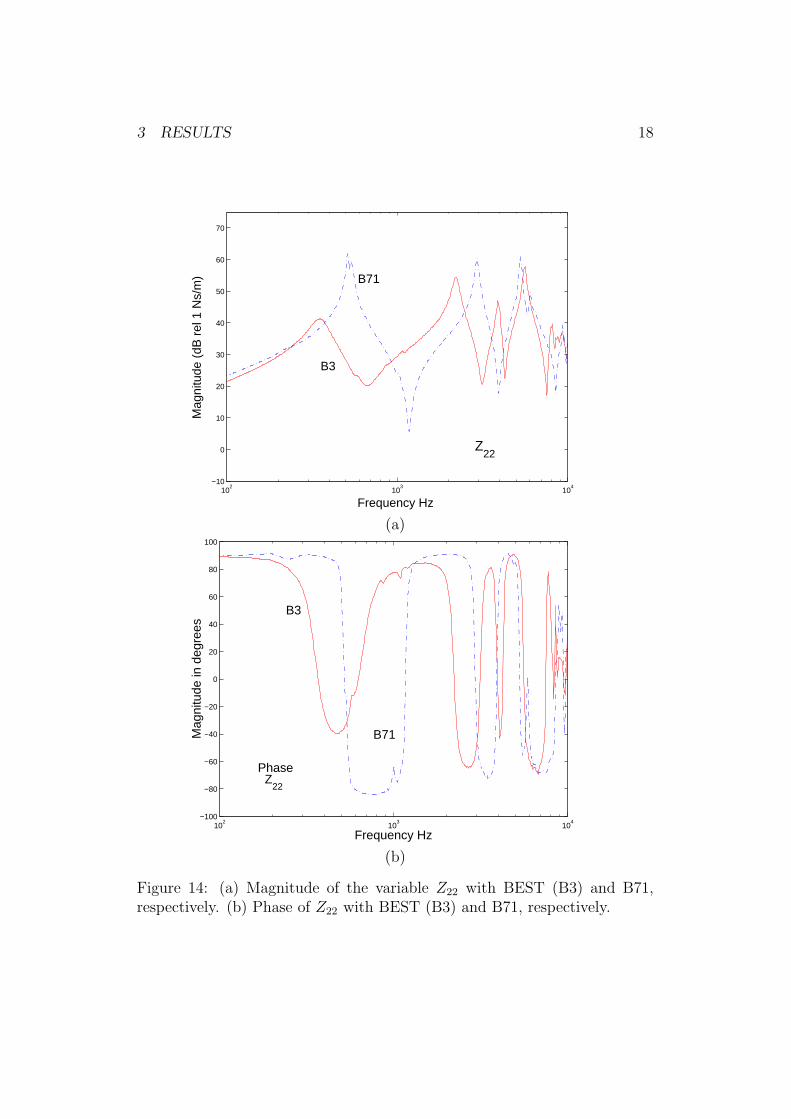
are illustrated in figure 13 and for the last variable Z22 in figure 14.
3.3 The stimulation force
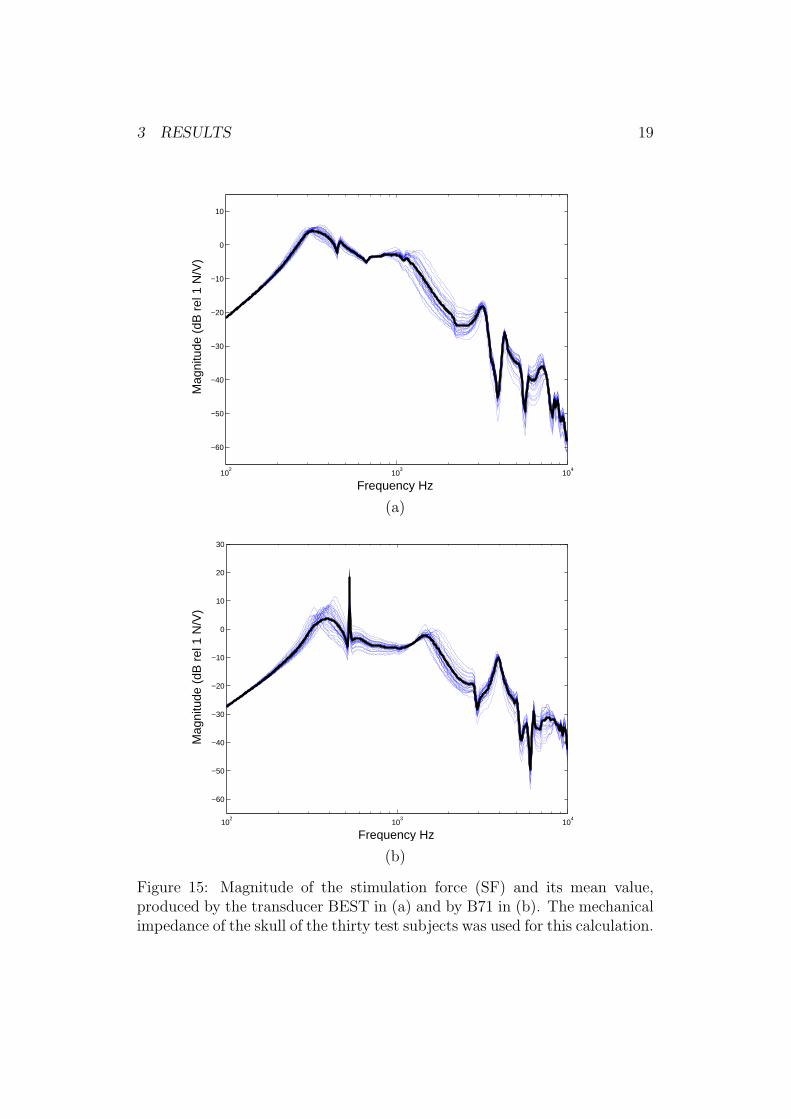
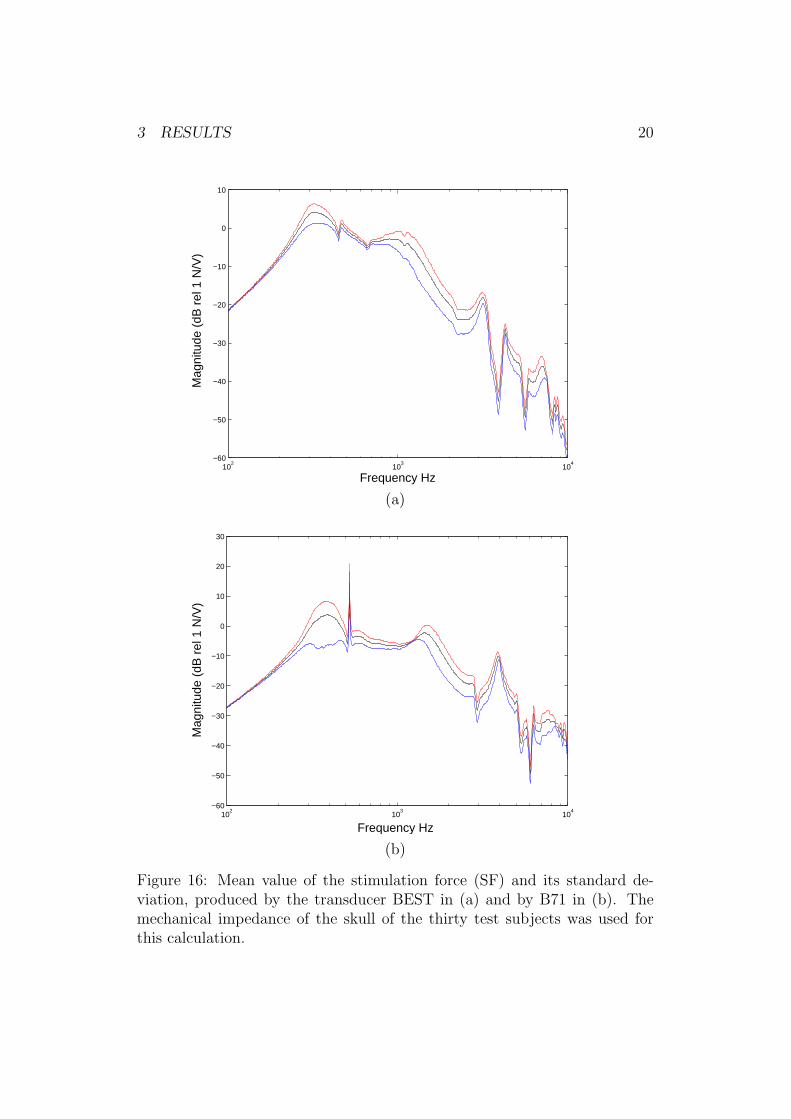
The results from the calculation of the frequency response from equation(17), i.e. the Stimulation Force (SF) are shown in the figures 15 to 18.The mechanical impedances of the test persons as well as the mechanicalimpedance of the Artificial Mastoid 4930 from B&K is used in the calculationsinstead of the load impedance ZL in figure 4. In figure 15(a) the magnitudeof the SF and its mean value are illustrated using the mechanical impedancesof the thirty tested subjects and the four pole model variables measured withthe transducer BEST nr. 3. Figure 15(b) shows the same quantities with thetransducer B71. The mean value and standard deviation of the stimulationforce for both transducers are presented in figure 16 (a) and (b).
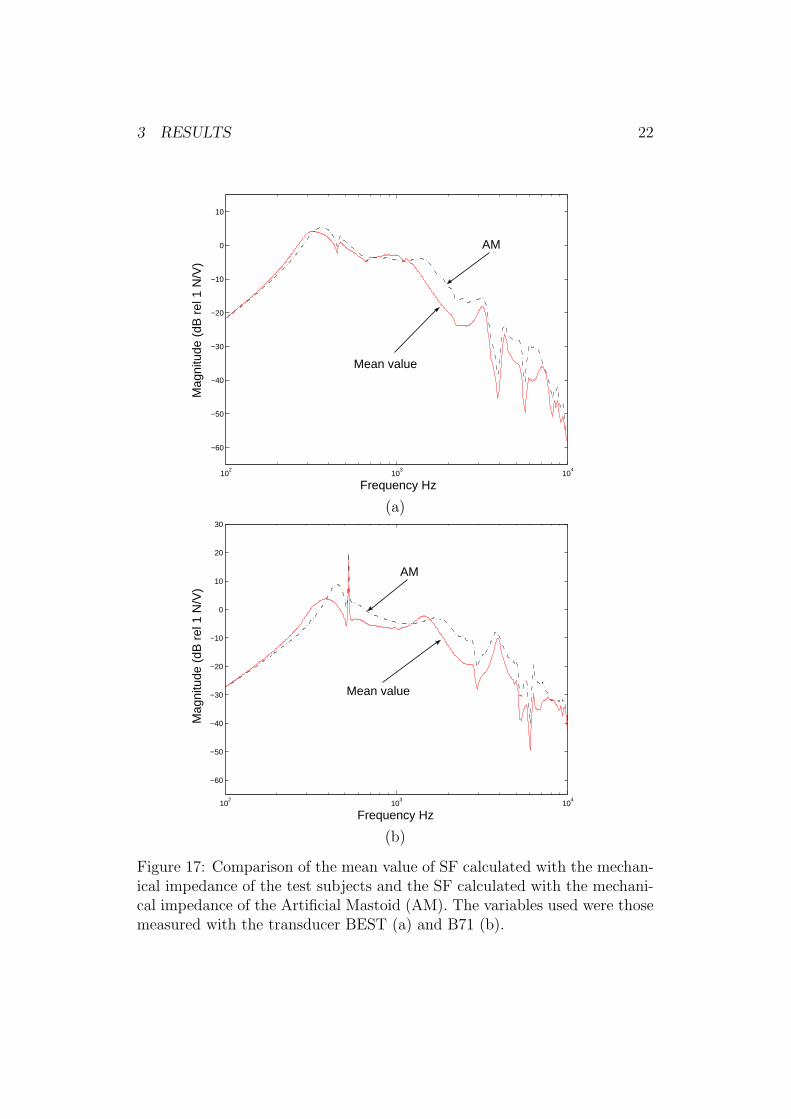
The SF calculated with the mechanical impedance of the artificial mastoidinstead of the tested subjects and with BEST is presented on figure 17(a).In the same figure, the mean value of the SF presented in figure 15(a) is
3 RESULTS 13
102
103
104
15
20
25
30
35
40
45
50
55
Frequency Hz
Mag
nitu
de (
dB r
el 1
Ns/
m) Artificial Mastoid
Mean Value
(a)
102
103
104
−80
−60
−40
−20
0
20
40
60
80
Frequency Hz
Mag
nitu
de in
deg
rees
Artificial Mastoid
Mean Value
(b)
Figure 9: (a) Magnitude of the mechanical impedance of all 30 test subjects,mean value of the curves and magnitude of mechanical impedance of theartificial mastoid. (b) Phase of the same quantities.
3 RESULTS 14
102
103
104
15
20
25
30
35
40
45
50
Frequency Hz
Mag
nitu
de (
dB r
el 1
Ns/
m)
3 N4 N5 N6 N
(a)
102
103
104
−80
−60
−40
−20
0
20
40
60
80
Frequency Hz
Mag
nitu
de in
deg
rees
3 N4 N5 N6 N
(b)
Figure 10: (a) Magnitude and (b) phase of mechanical impedance of the skullof a test object, measured with different static forces.
3 RESULTS 15
102
103
104
0
5
10
15
20
25
30
35
40
45
50
Frequency Hz
Mag
nitu
de (
dB r
el 1
Ω)
B3
B71
Z11
(a)
102
103
104
−10
0
10
20
30
40
50
60
70
80
90
Frequency Hz
Mag
nitu
de in
deg
rees
PhaseZ
11
B3
B71
(b)
Figure 11: (a) Magnitude of the variable Z11 with BEST (B3) and B71,respectively. (b) Phase of Z11 with BEST (B3) and B71, respectively.
3 RESULTS 16
102
103
104
−40
−30
−20
−10
0
10
20
30
40
50
Frequency Hz
Mag
nitu
de (
dB r
el 1
N/A
)
Z21
B3
B71
(a)
102
103
104
−700
−600
−500
−400
−300
−200
−100
0
Frequency Hz
Mag
nitu
de in
deg
rees
PhaseZ
21
B3
B71
(b)
Figure 12: (a) Magnitude of the variable Z21 with BEST (B3) and B71,respectively. (b) Phase of Z21 with BEST (B3) and B71, respectively.

3 RESULTS 17
102
103
104
−40
−30
−20
−10
0
10
20
30
40
50
60
Frequency Hz
Mag
nitu
de (
dB r
el 1
Vs/
m
B3
Z12
B71
(a)
102
103
104
−600
−500
−400
−300
−200
−100
0
100
200
Frequency Hz
Mag
nitu
de in
deg
rees
B3
B71
PhaseZ
12
(b)
Figure 13: (a) Magnitude of the variable Z12 with BEST (B3) and B71,respectively. (b) Phase of Z12 with BEST (B3) and B71, respectively.
3 RESULTS 18
102
103
104
−10
0
10
20
30
40
50
60
70
Frequency Hz
Mag
nitu
de (
dB r
el 1
Ns/
m)
Z22
B3
B71
(a)
102
103
104
−100
−80
−60
−40
−20
0
20
40
60
80
100
Frequency Hz
Mag
nitu
de in
deg
rees
B3
B71
PhaseZ
22
(b)
Figure 14: (a) Magnitude of the variable Z22 with BEST (B3) and B71,respectively. (b) Phase of Z22 with BEST (B3) and B71, respectively.
3 RESULTS 19
102
103
104
−60
−50
−40
−30
−20
−10
0
10
Frequency Hz
Mag
nitu
de (
dB r
el 1
N/V
)
(a)
102
103
104
−60
−50
−40
−30
−20
−10
0
10
20
30
Frequency Hz
Mag
nitu
de (
dB r
el 1
N/V
)
(b)
Figure 15: Magnitude of the stimulation force (SF) and its mean value,produced by the transducer BEST in (a) and by B71 in (b). The mechanicalimpedance of the skull of the thirty test subjects was used for this calculation.
3 RESULTS 20
102
103
104
−60
−50
−40
−30
−20
−10
0
10
Frequency Hz
Mag
nitu
de (
dB r
el 1
N/V
)
(a)
102
103
104
−60
−50
−40
−30
−20
−10
0
10
20
30
Frequency Hz
Mag
nitu
de (
dB r
el 1
N/V
)
(b)
Figure 16: Mean value of the stimulation force (SF) and its standard de-viation, produced by the transducer BEST in (a) and by B71 in (b). Themechanical impedance of the skull of the thirty test subjects was used forthis calculation.
3 RESULTS 21
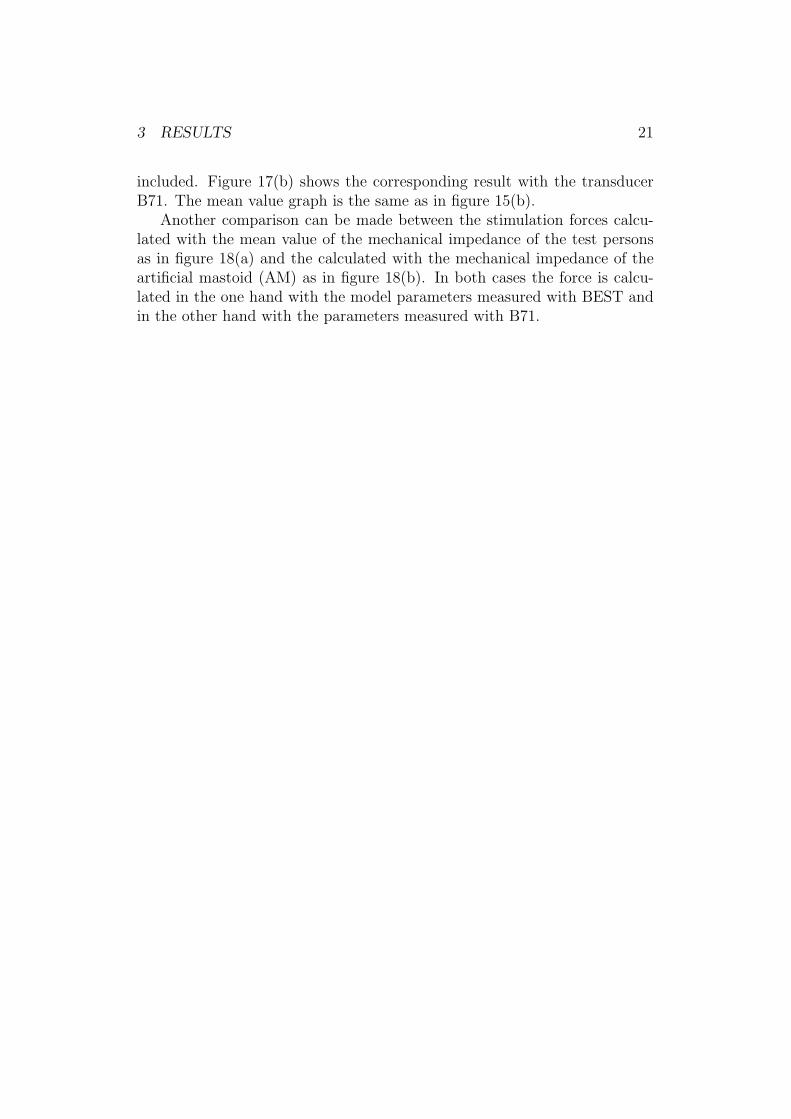
included. Figure 17(b) shows the corresponding result with the transducerB71. The mean value graph is the same as in figure 15(b).
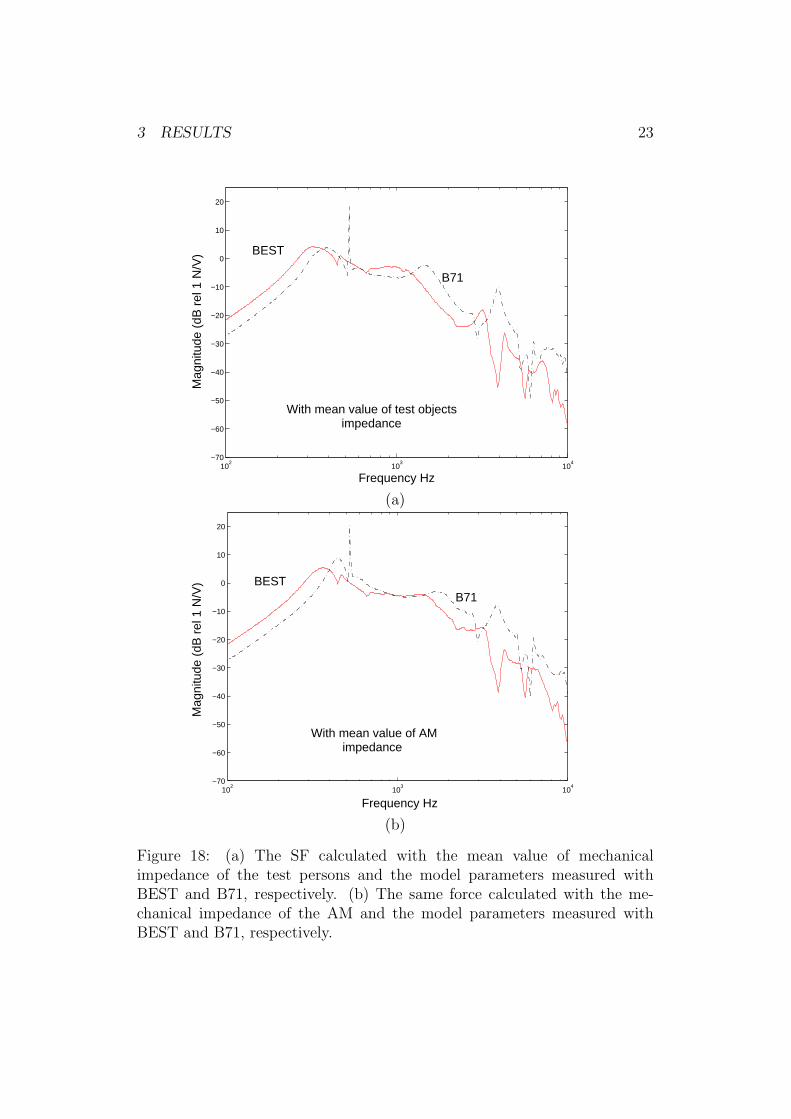
Another comparison can be made between the stimulation forces calcu-lated with the mean value of the mechanical impedance of the test personsas in figure 18(a) and the calculated with the mechanical impedance of theartificial mastoid (AM) as in figure 18(b). In both cases the force is calcu-lated in the one hand with the model parameters measured with BEST andin the other hand with the parameters measured with B71.
3 RESULTS 22
102
103
104
−60
−50
−40
−30
−20
−10
0
10
Frequency Hz
Mag
nitu
de (
dB r
el 1
N/V
)
AM
Mean value
(a)
102
103
104
−60
−50
−40
−30
−20
−10
0
10
20
30
Frequency Hz
Mag
nitu
de (
dB r
el 1
N/V
)
AM
Mean value
(b)
Figure 17: Comparison of the mean value of SF calculated with the mechan-ical impedance of the test subjects and the SF calculated with the mechani-cal impedance of the Artificial Mastoid (AM). The variables used were thosemeasured with the transducer BEST (a) and B71 (b).
3 RESULTS 23
102
103
104
−70
−60
−50
−40
−30
−20
−10
0
10
20
Frequency Hz
Mag
nitu
de (
dB r
el 1
N/V
) BEST
B71
With mean value of test objects impedance
(a)
102
103
104
−70
−60
−50
−40
−30
−20
−10
0
10
20
Frequency Hz
Mag
nitu
de (
dB r
el 1
N/V
) BESTB71
With mean value of AMimpedance
(b)
Figure 18: (a) The SF calculated with the mean value of mechanicalimpedance of the test persons and the model parameters measured withBEST and B71, respectively. (b) The same force calculated with the me-chanical impedance of the AM and the model parameters measured withBEST and B71, respectively.

4 DISCUSSION 24
4 Discussion
Mechanical impedance
To describe structural dynamic properties of the human skull by using afrequency response function, it is essential to assume that the system is lin-ear. Investigators as Corliss and Koidan (1955), Smith and Suggs (1976),Flottorp and Solberg (1976), Khalil et al. (1979), Hakansson et al. (1986)and Hakansson et al. (1996) have stated that vibration transmission throughthe skull is linear at normal hearing levels, i.e. ordinary speech, and forfrequencies ranging between 0.1 to 10 kHz.
In this investigation, no evident signs of nonlinear behavior was seen. Thecoherence values increased with increased signal levels, where the highestsignal level was the speech level. The magnitude and phase response, atthe same time, remained mainly unaffected. The mechanical impedance wasmeasured at the skin surface over the temporal bone on the right side ofthe test persons and the measurements were made from 0.1 to 10 kHz. AsHakansson et al. (1986) found, the slope of the magnitude curves is negativeand so is the phase up to 3000 Hz, which means that the impedance isstiffness controlled until it reaches the resonance frequency in the region of3000 Hz. Above 3000 Hz the mechanical point impedance is mainly massdominated. At the frequency of 3000 Hz the mass and the compliance causea series resonance. The impedance varies for different persons and for allthe test subjects, it appears to be generally lower than the impedance ofthe artificial mastoid (AM). The difference between the mean value of thesubjects impedance and the impedance of the AM is generally about 4 to 10dB. There is about 7 dB difference around the resonance frequency of 3000Hz.
Measurements with different static forces were made, and it was observedthat the impedance value became higher when the static force was increasedreaching a steady state at around 6 N. Thus, the fact that the bone con-duction hearing thresholds improve as the static force is increased and thatthe thresholds do not improve, reaching a steady state, for a static forcegreater that about 4-6 N is confirmed. According to the findings of Corlissand Koidan (1955), it is important that the static force is greater than 4 Nbut it seems unimportant whether the static force is 8 or 12 N.
The frequency response functions or variables
Using the model in figure 3 it is possible to measure the variables and calcu-late the transfer function in equation (17). The behavior of Z11 is in accor-
4 DISCUSSION 25
dance with earlier measurements of electrical input impedance, Hakansson(2002), where at low frequencies the impedances of both transducers are re-sistive and mostly determined by the ohmic losses in the coil wires inside thetransducers. BEST shows one first peak resonance, i.e. a parallel resonance,at 350 Hz that reflects the influence of the equivalent impedance Zeq insidethe transducer (fig. 4) which couples the electrical part of the transducerwith the mechanical part. The first peak resonance for B71 appears at 513Hz. A second, smaller peak resonance of both transducers appears around 1to 2 kHz also here at different frequencies for both transducers. The influenceof the equivalent impedance Zeq is smaller since the value of ZM increasesat higher frequencies which implies smaller current v. At higher frequenciesthe electrical input impedances become inductive with a great difference inphase as seen in fig. 11(b), at the end of the frequency region. It indicatesthat the magnetic losses for B71 are greater that for BEST. BEST showsmostly inductive behavior reaching a phase near to 90 degrees, while B71has a phase of 60 degrees. As earlier results has showed, Hakansson (2002),the magnitude of the parameter is 5 dB greater for BEST than for B71 overthe whole frequency region.
Figures 12(a) and 13(a) shows two main anti-resonances caused by thecompliances and the masses in parallel in the mechanical part of the trans-ducers. The first resonance is found at approximately 500 Hz and the secondat approximately 2 kHz. At higher frequencies the housing of the transduc-ers starts resonating in several modes causing resonances at the end of thefrequency region. Unfortunately the variables do not present the peaks atexactly the same frequency which results in several artifacts when the calcu-lation of the transfer function V2/V1 is made. The reason of the displacementmay be the assumption of no velocity in the measurement of Z21, since theheavy block in figure 5 can be not enough heavy resulting in i2 = 0. The dif-ference in magnitude for both parameters is at least 10 dB at low frequenciesuntil the firs peak and at last 15 dB.
Variable Z22, that is the mechanical output impedance of the transducers,is mass dominated at low frequencies causing one first anti-resonance (a max-imum in impedance) at approximately 350 Hz for BEST and 500 Hz for B71.What follows is a series resonance at 700 Hz for BEST and 1.2 kHz for B71.A second anti-resonance appears due to the mass of the transducer’s bobbin,coil, poles, vibrator plate and 1/3 of the housing and the compliance of thehousing, at 2.2 kHz for BEST and 3 kHz for B71. A third anti-resonance at4 and 5 kHz for BEST and B71, respectively, is caused by the mass of 2/3of the housing and its compliance. BEST has 20 dB lower magnitude at thefirst anti-resonance frequency.
Figures 11(a), 12(a), 13(a) and 14(a) show that the damping of the spring
4 DISCUSSION 26
elements in BEST is better than in B71 since the resonance peaks are not sosharp. The resonances occur at a much lower frequency than for B71 whichis due to the balanced construction of the suspension.
Stimulation Force
It is important to compare the force calculated with the mechanical impedanceof the test objects with that calculated with the mechanical impedance ofthe artificial mastoid, since the calibration of the measurement apparatus andhearing aids, at the audiology department at Sahlgren Hospital in Goteborg,is performed in accordance with the characteristics of the artificial mas-toid. Specially since the results of the measurement of mechanical impedanceshow a mean difference of 7 dB between the test objects impedance and theimpedance of the artificial mastoid.
The force for BEST does not differ so much from the force calculated withthe AM’s mechanical impedance, see fig. 17(a), except for the frequency re-gion of 1.3 to 10 kHz where the difference can reach 10 dB. The B71 however,shows a similar difference between the force calculated with the same typeof impedances but much earlier than BEST, from 400 Hz and along the re-maining frequency range as seen in figure 17(b). Further, when comparingthe force calculated with each transducer and each mechanical impedance(fig.18) it is observed that BEST gives some 5 dB higher amplitude from 100to 400 Hz, in both cases of impedance, than B71. In the remaining frequencyrange, the magnitude of the force for B71 is higher (8 dB) between 1.2 to3 kHz (mechanical impedance of test objects) and 1.5 to 3 kHz (mechanicalimpedance of AM).
A number of resonances appear along the frequency range which may de-pend on the fact that the parameters Z21 and Z12 do not have their resonancefrequencies at the same place, they are displaced in relation with each otherwhich might depend on the heavy block used for the measurement, since itwas not an infinitely heavy mass. The force calculated with the parametersof BEST shows less spread than the force calculated with the parameters ofB71 which is in accordance with the expected results.
Further comparisons can be performed if the component values of thetransducers are computed from the parameter curves obtained in this workin order to do the same calculation of the force to observe if the appearingresonances are vanished or by measuring the frequency response Vout/Vin thatHakansson (2002) performed with the artificial mastoid and the HP-3562A.
5 CONCLUSIONS 27
5 Conclusions
Measurements of mechanical skin impedance of the human skull and mechan-ical impedance of the artificial mastoid (AM) from Bruel & Kjær has beenperformed. A four pole equivalent model of a bone conduction transducerwith four variables that could be measured, was also made. Two transducerswere used to measure the variables of the model in order to compare how thecalculated output force of the transducers varies with load condition, wherethe load was the mechanical impedances of the test objects and the AM. Theresults obtained show what follows:
• The mechanical impedance of the human skull is lower than the me-chanical impedance of the artificial mastoid from Bruel & Kjær with amean difference of about 7 dB.
• The frequency response measurement shows lower amplitude for BESTthan for B71 with an amount of 5 to 20 dB dependent of the measuredvariable, which depends on better damping of the spring elements inBEST.
• The resonance frequencies for BEST occur at a lower frequency thanfor B71 due the balanced construction of BEST.
• Though the great difference for the two mechanical impedances (humanskull and AM), the output force calculated with the impedances doesnot differ so much for BEST as for B71, where the difference is moreevident from 400 Hz and upwards. For BEST the main difference is ofapproximately 8 dB in the frequency range of 1 to 3 kHz. See fig. 17.
• In the comparison of the output force obtained with each transducerand the same load impedance, shown in fig.18 it is observed that BESThas 5 dB higher amplitude in the low frequency region between 100and 400 Hz. In the high frequency region beginning at 1.3 to 1.5 kHzhowever, B71 has a higher amplitude of about 8 dB.

6 ACKNOWLEDGMENT 28
6 Acknowledgment
I have to thank my supervisor Bo Hakansson for all the time he was sitting,discussing and explaining different things I did not see as easily as he does.He has been an inspiration for me during this work.
I would also like to thank all the voluntaries for helping me during themeasurements of mechanical impedance. Further, I want to thank FredrikAthley, Christopher Brown, Jesper Bank and Karin Althoff at the depart-ment of Signals and Systems because they introduce me to the world of LATEXand patiently helped me when I got frustrated.
Finally, I want to thank Andreas and my children for all support theyalways give to me.
This investigation was financially supported by a grant from Stinger-fonden.
REFERENCES 29
References
Bendat, J. and Piersol, A. (1980). Engineering Applications of Correlationsand Spectral Analysis. McGraw-Hill, New York.
Corliss, E. L. R. and Koidan, W. (1955). “Mechanical impedance of theforehead and mastoid”. J. Acoust. soc. Am., 27(6):1164–1172.
Flottorp, G. and Solberg, S. (1976). “Mechanical impedance of human head-bones (forehead and mastoid portion of temporal bone) measured underISO/IEC conditions”. J. Acoust. soc. Am., 59(4):899–906.
Hakansson, B., Carlsson, P., Brandt, A., and Stenfelt, S. (1996). “Linearityof sound transmission through the human skull in vivo”. J. Acoust. Am.,99(4):2239–2243.
Hakansson, B., Carlsson, P., and Tjellstrom, A. (1986). “The mechanicalpoint impedance of the human head, with and without skin penetration”.J. Acoust. Am., 80(4):1065–1075.
Hakansson, B. E. V. (2002). “The Balanced Electromagnetic SeparationTransducer: A new bone conduction transducer”. Submitted to J. Acoust.Soc. Am.
Khalil, T., Viano, D., and Smith, D. L. (1979). “Experimental analysis of thevibrational characteristics of the human skull”. J. Sound Vib., 63(3):351–376.
Smith, J. B. and Suggs, C. W. (1976). “Dynamic properties of the humanhead”. J. Sound Vib., 48(1):35–43.