Embed Size (px)
Citation preview
page 1
Financial Sector Development IndicatorsComprehensive assessment through enhanced information capacity
Contact: [email protected]
Financial Sector Operations and Policy
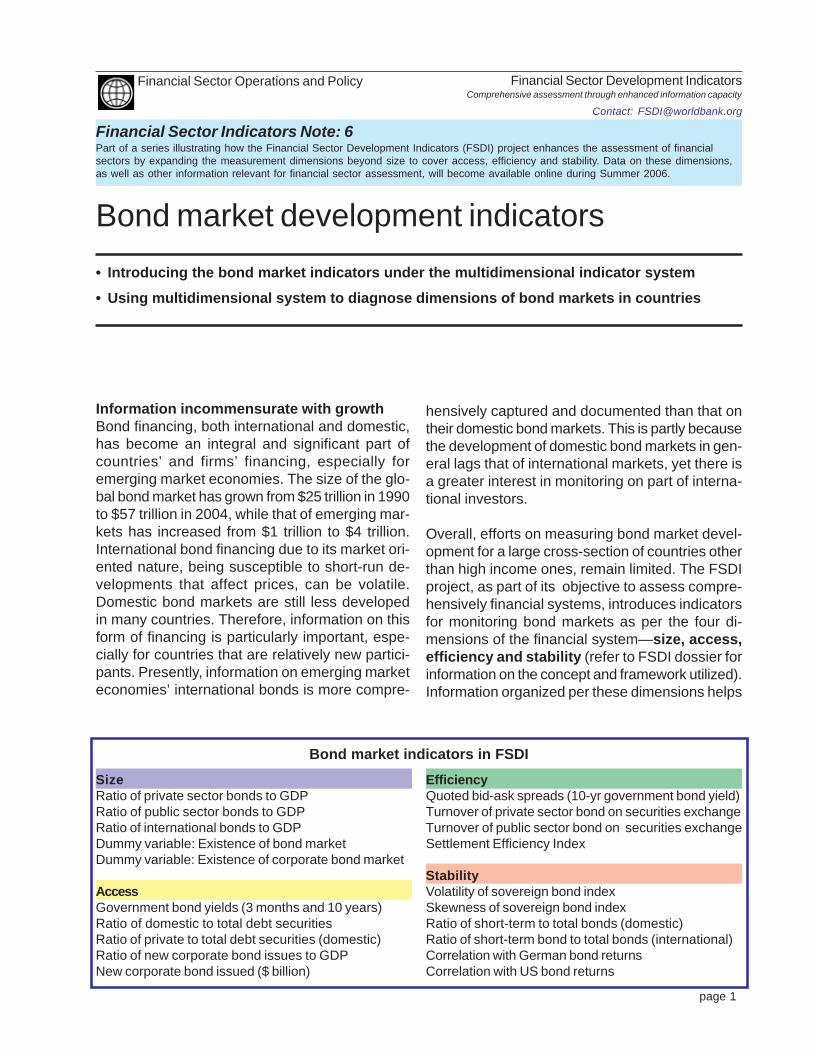
• Introducing the bond market indicators under the multidimensional indicator system
• Using multidimensional system to diagnose dimensions of bond markets in countries
Financial Sector Indicators Note: 6Part of a series illustrating how the Financial Sector Development Indicators (FSDI) project enhances the assessment of financialsectors by expanding the measurement dimensions beyond size to cover access, efficiency and stability. Data on these dimensions,as well as other information relevant for financial sector assessment, will become available online during Summer 2006.
Bond market development indicators
Information incommensurate with growthBond financing, both international and domestic,has become an integral and significant part ofcountries’ and firms’ financing, especially foremerging market economies. The size of the glo-bal bond market has grown from $25 trillion in 1990to $57 trillion in 2004, while that of emerging mar-kets has increased from $1 trillion to $4 trillion.International bond financing due to its market ori-ented nature, being susceptible to short-run de-velopments that affect prices, can be volatile.Domestic bond markets are still less developedin many countries. Therefore, information on thisform of financing is particularly important, espe-cially for countries that are relatively new partici-pants. Presently, information on emerging marketeconomies’ international bonds is more compre-
hensively captured and documented than that ontheir domestic bond markets. This is partly becausethe development of domestic bond markets in gen-eral lags that of international markets, yet there isa greater interest in monitoring on part of interna-tional investors.
Overall, efforts on measuring bond market devel-opment for a large cross-section of countries otherthan high income ones, remain limited. The FSDIproject, as part of its objective to assess compre-hensively financial systems, introduces indicatorsfor monitoring bond markets as per the four di-mensions of the financial system—size, access,efficiency and stability (refer to FSDI dossier forinformation on the concept and framework utilized).Information organized per these dimensions helps
SizeRatio of private sector bonds to GDPRatio of public sector bonds to GDPRatio of international bonds to GDPDummy variable: Existence of bond marketDummy variable: Existence of corporate bond market
AccessGovernment bond yields (3 months and 10 years)Ratio of domestic to total debt securitiesRatio of private to total debt securities (domestic)Ratio of new corporate bond issues to GDPNew corporate bond issued ($ billion)
EfficiencyQuoted bid-ask spreads (10-yr government bond yield)Turnover of private sector bond on securities exchangeTurnover of public sector bond on securities exchangeSettlement Efficiency Index
StabilityVolatility of sovereign bond indexSkewness of sovereign bond indexRatio of short-term to total bonds (domestic)Ratio of short-term bond to total bonds (international)Correlation with German bond returnsCorrelation with US bond returns
Bond market indicators in FSDI
page 2
Financial Sector Development IndicatorsComprehensive assessment through enhanced information capacity
Contact: [email protected]
Financial Sector Operations and Policy
understand better the relative development of bondmarkets around the world, as well as the strengthsand weaknesses of each dimension.
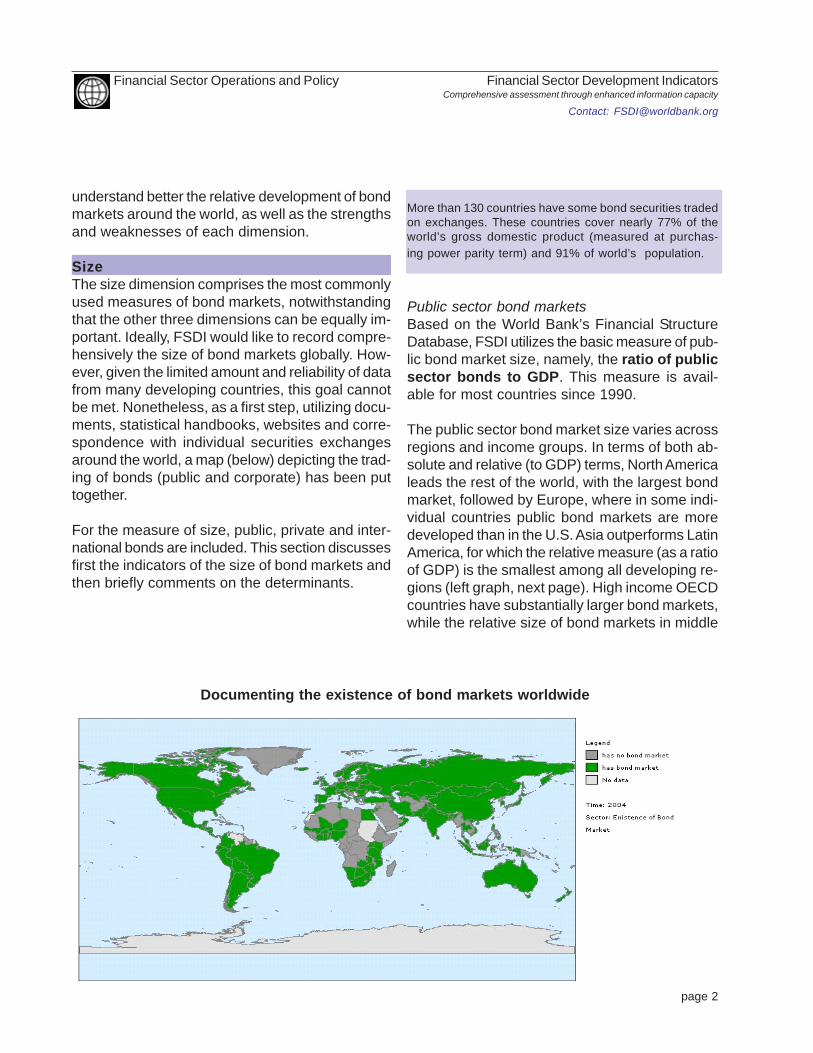
SizeThe size dimension comprises the most commonlyused measures of bond markets, notwithstandingthat the other three dimensions can be equally im-portant. Ideally, FSDI would like to record compre-hensively the size of bond markets globally. How-ever, given the limited amount and reliability of datafrom many developing countries, this goal cannotbe met. Nonetheless, as a first step, utilizing docu-ments, statistical handbooks, websites and corre-spondence with individual securities exchangesaround the world, a map (below) depicting the trad-ing of bonds (public and corporate) has been puttogether.
For the measure of size, public, private and inter-national bonds are included. This section discussesfirst the indicators of the size of bond markets andthen briefly comments on the determinants.
Public sector bond marketsBased on the World Bank’s Financial StructureDatabase, FSDI utilizes the basic measure of pub-lic bond market size, namely, the ratio of publicsector bonds to GDP. This measure is avail-able for most countries since 1990.
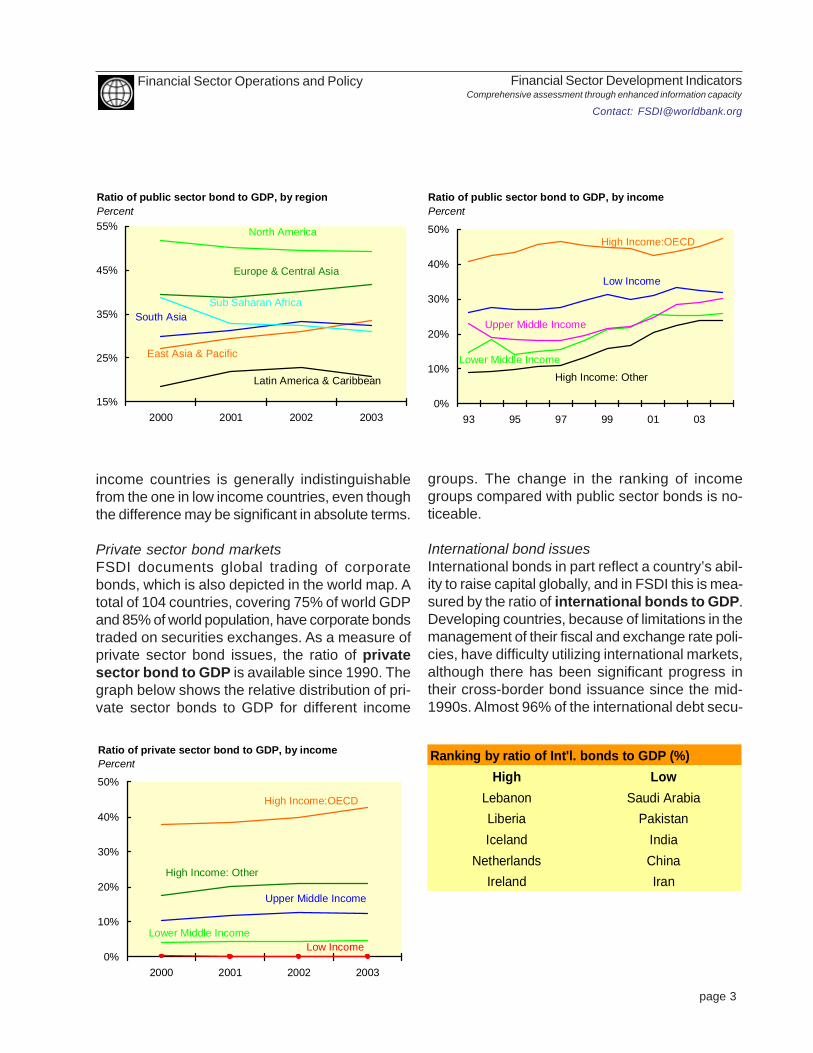
The public sector bond market size varies acrossregions and income groups. In terms of both ab-solute and relative (to GDP) terms, North Americaleads the rest of the world, with the largest bondmarket, followed by Europe, where in some indi-vidual countries public bond markets are moredeveloped than in the U.S. Asia outperforms LatinAmerica, for which the relative measure (as a ratioof GDP) is the smallest among all developing re-gions (left graph, next page). High income OECDcountries have substantially larger bond markets,while the relative size of bond markets in middle
Documenting the existence of bond markets worldwide
More than 130 countries have some bond securities tradedon exchanges. These countries cover nearly 77% of theworld’s gross domestic product (measured at purchas-ing power parity term) and 91% of world’s population.
page 3
Financial Sector Development IndicatorsComprehensive assessment through enhanced information capacity
Contact: [email protected]
Financial Sector Operations and Policy
income countries is generally indistinguishablefrom the one in low income countries, even thoughthe difference may be significant in absolute terms.
Private sector bond marketsFSDI documents global trading of corporatebonds, which is also depicted in the world map. Atotal of 104 countries, covering 75% of world GDPand 85% of world population, have corporate bondstraded on securities exchanges. As a measure ofprivate sector bond issues, the ratio of privatesector bond to GDP is available since 1990. Thegraph below shows the relative distribution of pri-vate sector bonds to GDP for different income
groups. The change in the ranking of incomegroups compared with public sector bonds is no-ticeable.
International bond issuesInternational bonds in part reflect a country’s abil-ity to raise capital globally, and in FSDI this is mea-sured by the ratio of international bonds to GDP.Developing countries, because of limitations in themanagement of their fiscal and exchange rate poli-cies, have difficulty utilizing international markets,although there has been significant progress intheir cross-border bond issuance since the mid-1990s. Almost 96% of the international debt secu-
High LowLebanon Saudi ArabiaLiberia PakistanIceland India
Netherlands ChinaIreland Iran
Ranking by ratio of Int'l. bonds to GDP (%)
0%
10%
20%
30%
40%
50%
93 95 97 99 01 03
Ratio of public sector bond to GDP, by incomePercent
High Income:OECD
Lower Middle IncomeHigh Income: Other
Low Income
Upper Middle Income
0%
10%
20%
30%
40%
50%
2000 2001 2002 2003
Ratio of private sector bond to GDP, by incomePercent
High Income:OECD
Lower Middle Income
High Income: Other
Low Income
Upper Middle Income
15%
25%
35%
45%
55%
2000 2001 2002 2003
Ratio of public sector bond to GDP, by regionPercent
North America
Sub Saharan Africa
Europe & Central Asia
East Asia & Pacific
South Asia
Latin America & Caribbean
page 4
Financial Sector Development IndicatorsComprehensive assessment through enhanced information capacity
Contact: [email protected]
Financial Sector Operations and Policy
rities outstanding are accounted for by high-incomecountries. Most developing countries, e.g., Paki-stan, Iran etc., have low international bond to GDPratios. However, some developing countries, likeLebanon and Liberia, have a high internationalbond to GDP ratio (table, previous page).
Determinants of bond market sizeThe size of a country plays an important role indetermining whether it operates a securities ex-change (Clayton, Jorgensen, and Kavajecz, 2006).A literature survey suggests that this is also appli-cable to bond markets. Countries with less devel-oped or non-existent domestic bond markets arein general small countries. And countries with smallfinancial markets tend to have small bond mar-kets. The correlation coefficient between the ra-tios of international bond to GDP and private creditto GDP has a value of 35%. However, small coun-tries can overcome the size constraint and de-velop bond markets by issuing bonds in foreigncountries and foreign currencies, or by developingcommon securities exchanges and spreading theinfrastructure costs among members.
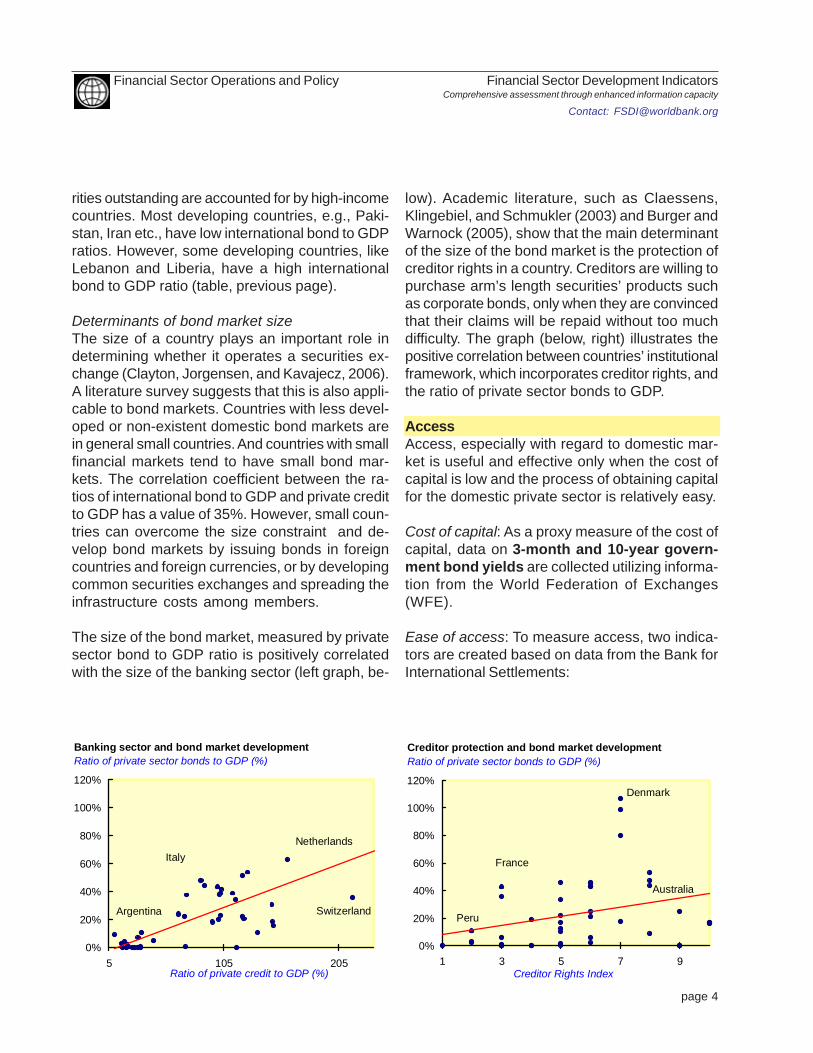
The size of the bond market, measured by privatesector bond to GDP ratio is positively correlatedwith the size of the banking sector (left graph, be-
low). Academic literature, such as Claessens,Klingebiel, and Schmukler (2003) and Burger andWarnock (2005), show that the main determinantof the size of the bond market is the protection ofcreditor rights in a country. Creditors are willing topurchase arm’s length securities’ products suchas corporate bonds, only when they are convincedthat their claims will be repaid without too muchdifficulty. The graph (below, right) illustrates thepositive correlation between countries’ institutionalframework, which incorporates creditor rights, andthe ratio of private sector bonds to GDP.
AccessAccess, especially with regard to domestic mar-ket is useful and effective only when the cost ofcapital is low and the process of obtaining capitalfor the domestic private sector is relatively easy.
Cost of capital: As a proxy measure of the cost ofcapital, data on 3-month and 10-year govern-ment bond yields are collected utilizing informa-tion from the World Federation of Exchanges(WFE).
Ease of access: To measure access, two indica-tors are created based on data from the Bank forInternational Settlements:
0%
20%
40%
60%
80%
100%
120%
1 3 5 7 9
Creditor protection and bond market developmentRatio of private sector bonds to GDP (%)
Creditor Rights Index
Denmark
Australia
Peru
France
0%
20%
40%
60%
80%
100%
120%
5 105 205
Banking sector and bond market developmentRatio of private sector bonds to GDP (%)
Ratio of private credit to GDP (%)
ItalyNetherlands
SwitzerlandArgentina
page 5
Financial Sector Development IndicatorsComprehensive assessment through enhanced information capacity
Contact: [email protected]
Financial Sector Operations and Policy
(i) Ratio of domestic bonds to total bonds out-standing. This reflects the capacity of local mar-kets to provide capital for issuers. It is assumedthat in order to reduce currency mismatch, an is-suer would prefer raising capital domestically thaninternationally, unless the domestic market is un-derdeveloped.
(ii) Ratio of private sector bonds to total do-mestic bonds outstanding. This indicator helpsmeasure the convenience of obtaining capital forthe domestic private sector. The composition of acountry’s outstanding debt securities also reflectsthe ease of access to capital for private borrow-ers. This information is important from the per-spective of borrowers, and the private sector inparticular, as it makes apparent the degree of ac-cessibility and thus affects financing decisions.
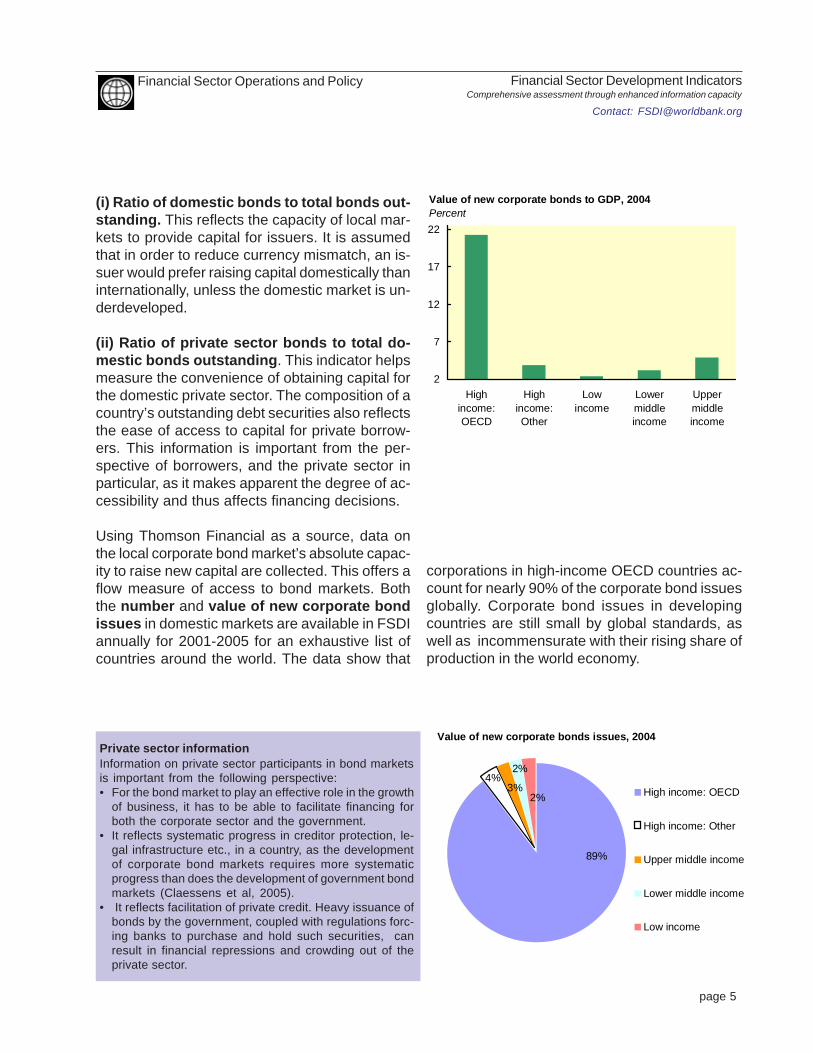
Using Thomson Financial as a source, data onthe local corporate bond market’s absolute capac-ity to raise new capital are collected. This offers aflow measure of access to bond markets. Boththe number and value of new corporate bondissues in domestic markets are available in FSDIannually for 2001-2005 for an exhaustive list ofcountries around the world. The data show that
corporations in high-income OECD countries ac-count for nearly 90% of the corporate bond issuesglobally. Corporate bond issues in developingcountries are still small by global standards, aswell as incommensurate with their rising share ofproduction in the world economy.
2
7
12
17
22
Highincome:OECD
Highincome:Other
Lowincome
Lowermiddleincome
Uppermiddleincome
Value of new corporate bonds to GDP, 2004Percent
Private sector informationInformation on private sector participants in bond marketsis important from the following perspective:• For the bond market to play an effective role in the growth
of business, it has to be able to facilitate financing forboth the corporate sector and the government.
• It reflects systematic progress in creditor protection, le-gal infrastructure etc., in a country, as the developmentof corporate bond markets requires more systematicprogress than does the development of government bondmarkets (Claessens et al, 2005).
• It reflects facilitation of private credit. Heavy issuance ofbonds by the government, coupled with regulations forc-ing banks to purchase and hold such securities, canresult in financial repressions and crowding out of theprivate sector.
High income: OECD
High income: Other
Upper middle income
Lower middle income
Low income
Value of new corporate bonds issues, 2004
89%
4%2%
2%3%
page 6
Financial Sector Development IndicatorsComprehensive assessment through enhanced information capacity
Contact: [email protected]
Financial Sector Operations and Policy
EfficiencyEfficiency of bond markets is as important as theirsize. More than 130 countries operate some formof organized bond market, but only about 50 havebecome substantial in size, and an even smallernumber are efficient by international standards.
To measure the efficiency of bond markets, FSDIfocuses on the liquidity of markets as reflected bythe tightness of the quoted bid-ask spread andthe turnover ratio. Substantial and adequate li-quidity enables markets to fulfill their roles in di-versifying risks, monitoring issuers, and allocat-ing resources for more productive purposes.
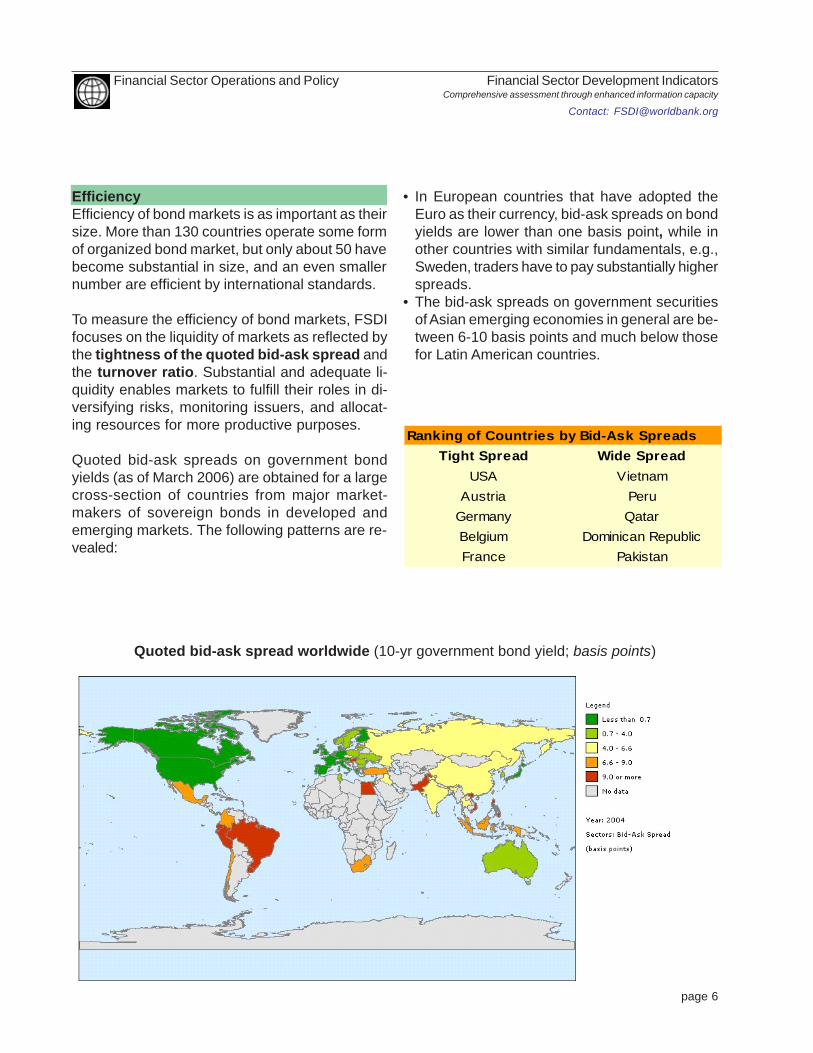
Quoted bid-ask spreads on government bondyields (as of March 2006) are obtained for a largecross-section of countries from major market-makers of sovereign bonds in developed andemerging markets. The following patterns are re-vealed:
• In European countries that have adopted theEuro as their currency, bid-ask spreads on bondyields are lower than one basis point, while inother countries with similar fundamentals, e.g.,Sweden, traders have to pay substantially higherspreads.
• The bid-ask spreads on government securitiesof Asian emerging economies in general are be-tween 6-10 basis points and much below thosefor Latin American countries.
Tight Spread Wide SpreadUSA Vietnam
Austria PeruGermany QatarBelgium Dominican RepublicFrance Pakistan
Ranking of Countries by Bid-Ask Spreads
Quoted bid-ask spread worldwide (10-yr government bond yield; basis points)
page 7
Financial Sector Development IndicatorsComprehensive assessment through enhanced information capacity
Contact: [email protected]
Financial Sector Operations and Policy
The data on turnover ratio (from WFE) for bothprivate and public sector bonds traded on sec-ondary markets is another efficiency indicator.However, these numbers do not include the manytrades that settle outside the stock exchangesbetween, for example, financial institutions andover the counter markets.
StabilityLack of stability in bond markets can contribute toa higher cost of capital and discourage investorsfrom entering the markets. For example, high vola-tility in the price of benchmark government bondshampers the development of yield curves and theadequate pricing of corporate bonds. Due to pau-city of high frequency data on corporate bonds,FSDI primarily focuses on government bonds.Daily return index of sovereign bonds are collectedfrom both Datastream (for developed economies)and Citibank (for mainly emerging markets). Basedon the daily return indices, volatility (annualizedstandard deviation), skewness, maturity struc-
ture and correlation between bond returns areanalyzed.
Volatility: This is the commonly used measure ofstability. Analysis highlights that volatility in selectdeveloping countries is below that in developedmarkets. This maybe the outcome of (i) trading ofbonds being less active in developing countries,and in many instances prices remain unchangedfor several weeks; and (ii) interest rate regulationin some markets sometimes distorts the true costof capital. As such, underestimation of instabilityin developing countries remains a distinct possi-bility.
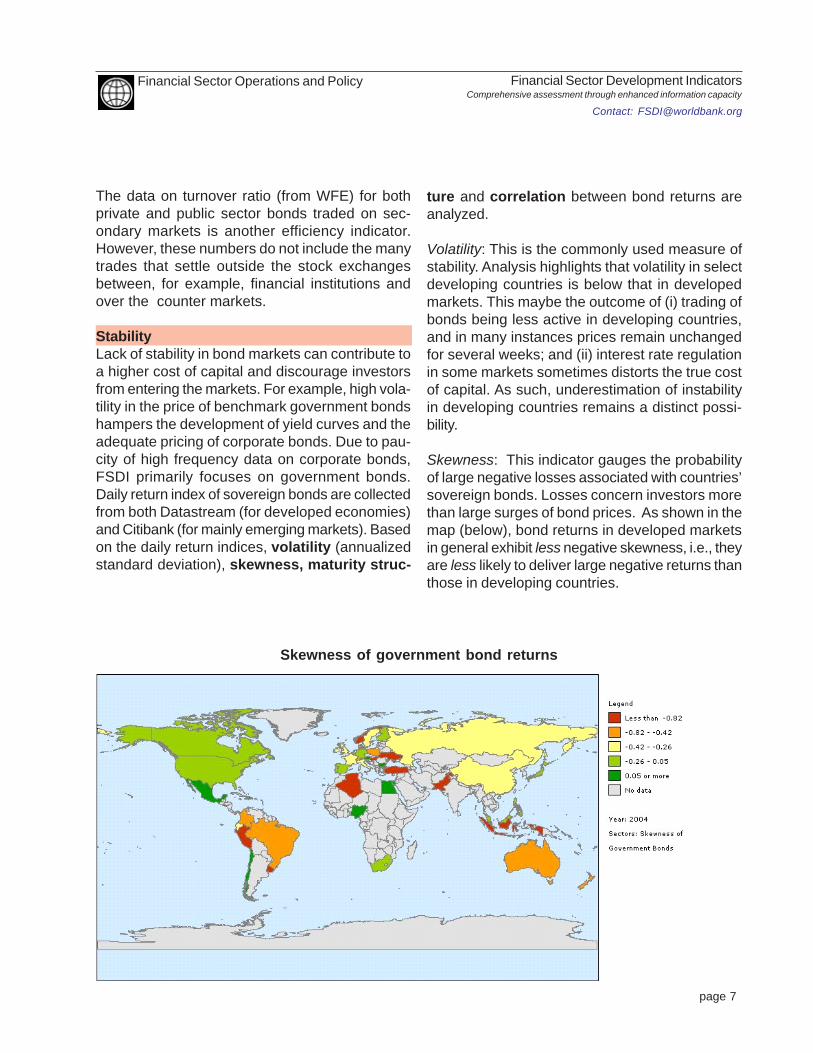
Skewness: This indicator gauges the probabilityof large negative losses associated with countries’sovereign bonds. Losses concern investors morethan large surges of bond prices. As shown in themap (below), bond returns in developed marketsin general exhibit less negative skewness, i.e., theyare less likely to deliver large negative returns thanthose in developing countries.
Skewness of government bond returns
page 8
Financial Sector Development IndicatorsComprehensive assessment through enhanced information capacity
Contact: [email protected]
Financial Sector Operations and Policy
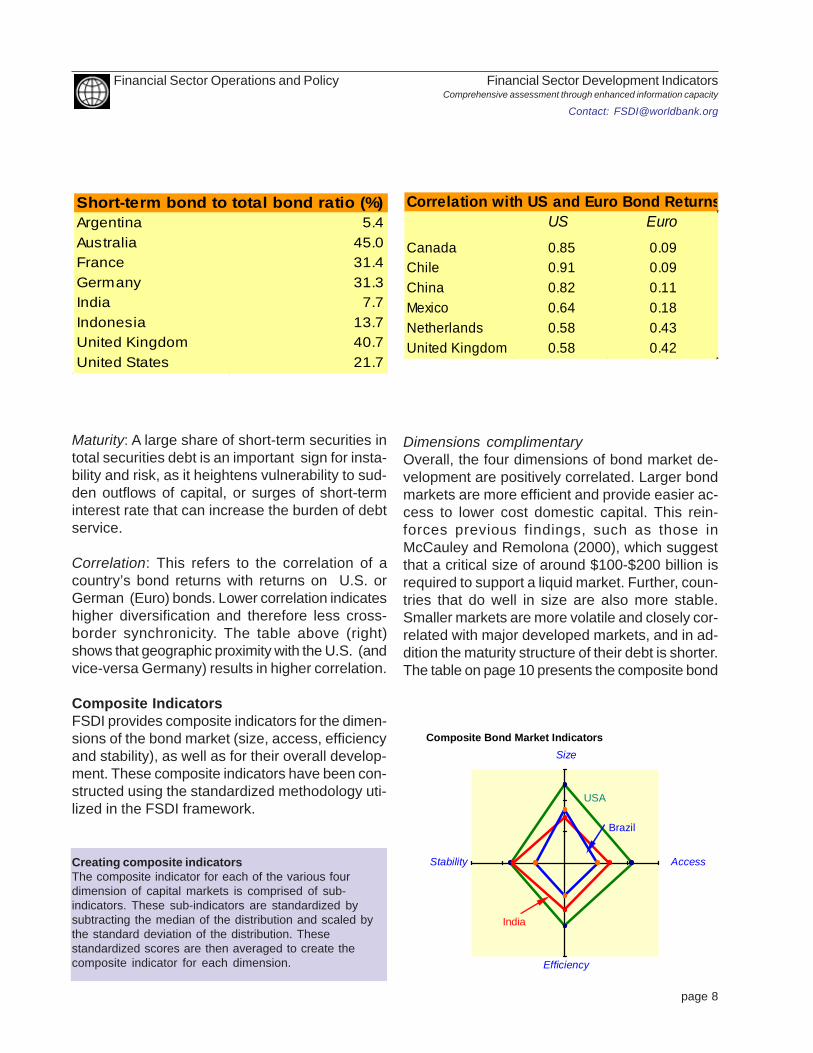
Maturity: A large share of short-term securities intotal securities debt is an important sign for insta-bility and risk, as it heightens vulnerability to sud-den outflows of capital, or surges of short-terminterest rate that can increase the burden of debtservice.
Correlation: This refers to the correlation of acountry’s bond returns with returns on U.S. orGerman (Euro) bonds. Lower correlation indicateshigher diversification and therefore less cross-border synchronicity. The table above (right)shows that geographic proximity with the U.S. (andvice-versa Germany) results in higher correlation.
Composite IndicatorsFSDI provides composite indicators for the dimen-sions of the bond market (size, access, efficiencyand stability), as well as for their overall develop-ment. These composite indicators have been con-structed using the standardized methodology uti-lized in the FSDI framework.
Argentina 5.4Australia 45.0France 31.4Germany 31.3India 7.7Indonesia 13.7United Kingdom 40.7United States 21.7
Short-term bond to total bond ratio (%)US Euro
Canada 0.85 0.09Chile 0.91 0.09China 0.82 0.11Mexico 0.64 0.18Netherlands 0.58 0.43United Kingdom 0.58 0.42
Correlation with US and Euro Bond Returns
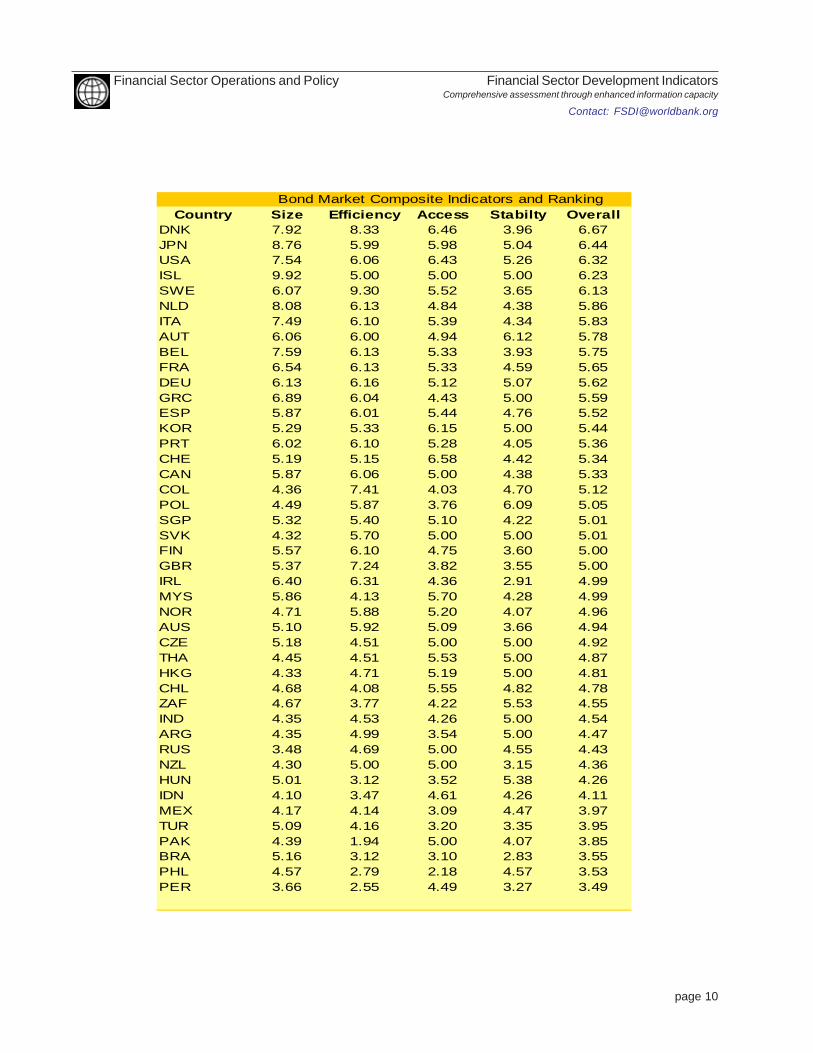
Dimensions complimentaryOverall, the four dimensions of bond market de-velopment are positively correlated. Larger bondmarkets are more efficient and provide easier ac-cess to lower cost domestic capital. This rein-forces previous findings, such as those inMcCauley and Remolona (2000), which suggestthat a critical size of around $100-$200 billion isrequired to support a liquid market. Further, coun-tries that do well in size are also more stable.Smaller markets are more volatile and closely cor-related with major developed markets, and in ad-dition the maturity structure of their debt is shorter.The table on page 10 presents the composite bond
Creating composite indicatorsThe composite indicator for each of the various fourdimension of capital markets is comprised of sub-indicators. These sub-indicators are standardized bysubtracting the median of the distribution and scaled bythe standard deviation of the distribution. Thesestandardized scores are then averaged to create thecomposite indicator for each dimension.
Size
Stability
Efficiency
Access
Composite Bond Market Indicators
USA
India
Brazil
page 9
Financial Sector Development IndicatorsComprehensive assessment through enhanced information capacity
Contact: [email protected]
Financial Sector Operations and Policy
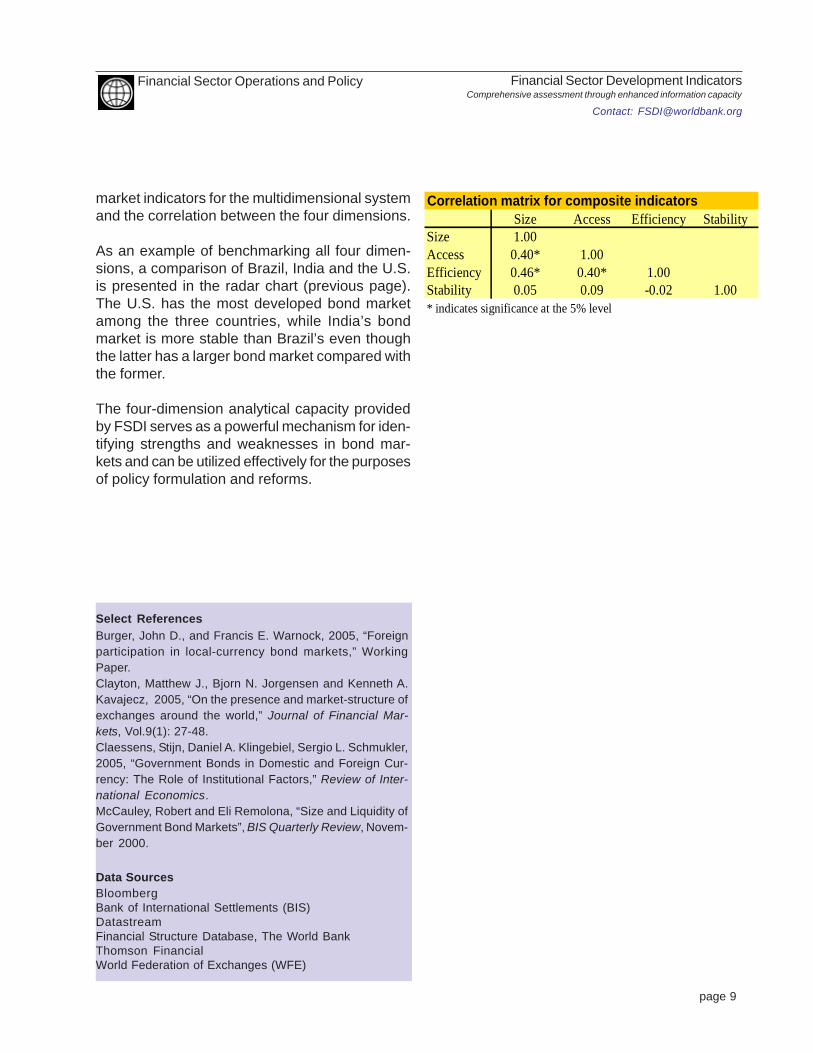
market indicators for the multidimensional systemand the correlation between the four dimensions.
As an example of benchmarking all four dimen-sions, a comparison of Brazil, India and the U.S.is presented in the radar chart (previous page).The U.S. has the most developed bond marketamong the three countries, while India’s bondmarket is more stable than Brazil’s even thoughthe latter has a larger bond market compared withthe former.
The four-dimension analytical capacity providedby FSDI serves as a powerful mechanism for iden-tifying strengths and weaknesses in bond mar-kets and can be utilized effectively for the purposesof policy formulation and reforms.
Select ReferencesBurger, John D., and Francis E. Warnock, 2005, “Foreignparticipation in local-currency bond markets,” WorkingPaper.Clayton, Matthew J., Bjorn N. Jorgensen and Kenneth A.Kavajecz, 2005, “On the presence and market-structure ofexchanges around the world,” Journal of Financial Mar-kets, Vol.9(1): 27-48.Claessens, Stijn, Daniel A. Klingebiel, Sergio L. Schmukler,2005, “Government Bonds in Domestic and Foreign Cur-rency: The Role of Institutional Factors,” Review of Inter-national Economics.McCauley, Robert and Eli Remolona, “Size and Liquidity ofGovernment Bond Markets”, BIS Quarterly Review, Novem-ber 2000.
Data SourcesBloombergBank of International Settlements (BIS)DatastreamFinancial Structure Database, The World BankThomson FinancialWorld Federation of Exchanges (WFE)
Size Access Efficiency StabilitySize 1.00Access 0.40* 1.00Efficiency 0.46* 0.40* 1.00Stability 0.05 0.09 -0.02 1.00* indicates significance at the 5% level
Correlation matrix for composite indicators
page 10
Financial Sector Development IndicatorsComprehensive assessment through enhanced information capacity
Contact: [email protected]
Financial Sector Operations and Policy
Country Size Efficiency Access Stabilty OverallDNK 7.92 8.33 6.46 3.96 6.67JPN 8.76 5.99 5.98 5.04 6.44USA 7.54 6.06 6.43 5.26 6.32ISL 9.92 5.00 5.00 5.00 6.23SWE 6.07 9.30 5.52 3.65 6.13NLD 8.08 6.13 4.84 4.38 5.86ITA 7.49 6.10 5.39 4.34 5.83AUT 6.06 6.00 4.94 6.12 5.78BEL 7.59 6.13 5.33 3.93 5.75FRA 6.54 6.13 5.33 4.59 5.65DEU 6.13 6.16 5.12 5.07 5.62GRC 6.89 6.04 4.43 5.00 5.59ESP 5.87 6.01 5.44 4.76 5.52KOR 5.29 5.33 6.15 5.00 5.44PRT 6.02 6.10 5.28 4.05 5.36CHE 5.19 5.15 6.58 4.42 5.34CAN 5.87 6.06 5.00 4.38 5.33COL 4.36 7.41 4.03 4.70 5.12POL 4.49 5.87 3.76 6.09 5.05SGP 5.32 5.40 5.10 4.22 5.01SVK 4.32 5.70 5.00 5.00 5.01FIN 5.57 6.10 4.75 3.60 5.00GBR 5.37 7.24 3.82 3.55 5.00IRL 6.40 6.31 4.36 2.91 4.99MYS 5.86 4.13 5.70 4.28 4.99NOR 4.71 5.88 5.20 4.07 4.96AUS 5.10 5.92 5.09 3.66 4.94CZE 5.18 4.51 5.00 5.00 4.92THA 4.45 4.51 5.53 5.00 4.87HKG 4.33 4.71 5.19 5.00 4.81CHL 4.68 4.08 5.55 4.82 4.78ZAF 4.67 3.77 4.22 5.53 4.55IND 4.35 4.53 4.26 5.00 4.54ARG 4.35 4.99 3.54 5.00 4.47RUS 3.48 4.69 5.00 4.55 4.43NZL 4.30 5.00 5.00 3.15 4.36HUN 5.01 3.12 3.52 5.38 4.26IDN 4.10 3.47 4.61 4.26 4.11MEX 4.17 4.14 3.09 4.47 3.97TUR 5.09 4.16 3.20 3.35 3.95PAK 4.39 1.94 5.00 4.07 3.85BRA 5.16 3.12 3.10 2.83 3.55PHL 4.57 2.79 2.18 4.57 3.53PER 3.66 2.55 4.49 3.27 3.49
Bond Market Composite Indicators and Ranking