Embed Size (px)
Citation preview

Strictly private and confidential 1
Bond investor updateNovember 2019

Strictly private and confidential 2
Presenting today
Per Lindsjö
CEO
~2 years at Euroflorist
Jörgen Ekberg
Managing partner
Litorina
Euroflorist’s Chairman
of the board

Strictly private and confidential
Scandinavia39%
UK & Ireland34%
Central Europe
27%
E-commerce66%
Florist20%
Corporate10%
Other4%
• Established 1982 in Sweden,
Malmö
• Leading e-commerce flower gift
business with operations in 12
countries
• Unique distribution network
through associated florist shops
providing same day delivery
capabilities
• >2,000,000 orders per year and
interaction with 4,000,000
customers and receivers
• Track-record of long profitable
e-commerce growth
• Proprietary IT and web platform
across all countries
• Scalability and best practice
within e-commerce across the
geographies
Regional HQ / Customer service
E-commerce HQ
3
Euroflorist at a glance – the leading pan-European flower gift company
Country Business unit # of orders1
Scandinavia
UK & Ireland
~720k
~750k
Central
Europe~580k
Market position2
#2
#2
#4
1) 2018 2) By volume (management estimates)
Comments Pan-European presence spanning 12 countries
Revenue by geography Revenue by channel
Q3 2019YTD
SEK ~1bnQ3 19’ LTM revenue
SEK 284mQ3 19’ LTM gross
profit
>35years history
~80%of GP from e-commerce
SEK 58mQ3 19’ LTM EBITDA
~150employees in 5 offices
Q3 2019YTD

Strictly private and confidential
Reorganised geographical approach
Focus on increase accountability across the
organisation
New organisational spirit
4
Recent events
New CEO
Reorganised geographical approach
Focus on increased accountability across the
organisation
New organisational spirit
Clarity - Simplicity - Team work
Management seminars - Management training
- increased transparency
Regional responsibility – reduced headcount
Recent company events update:

Strictly private and confidential
51% 47%
26% 34%
8% 7%5% 4%9% 8%
2018A 2019YTD
48% 48%
13% 18%
24% 20%
10% 10%3% 2%
2018A 2019YTD
5
Diversified, but increasingly online-focused, revenue and profit streams
1) Note that the gift cards are also sold directly to corporate customers
Euroflorist’s principle revenue streams
Revenue s
plit
2018 -
Q3 2
019Y
TD
Gro
ss p
rofit
split
2018 -
Q3 2
019Y
TD
• Flower orders generated online or
through a mobile phone
• Flowers delivered by florists in
Euroflorist’s network
• Flowers can be delivered the same day
E-commerce
Florist delivered
• Flower orders generated through a
florist and delivered by a florist
Florist generated
orders
• Flower orders from companies and
white-label partners
• Order can be delivered by florists or
through box supplier
Corporate orders
• Fees paid by florists to be part of the
Euroflorist network
Service fees
• Sale of gift cards to florists that can be
resold to consumers and redeemed at
any Euroflorist florist
• Gift cards are also sold directly to
corporate customers
Gift cards
E-commerce –
Florist delivered
E-commerce –
Boxed flowers
Florist generated
orders
Corporate orders
Service fees
Gift cards
• Flower orders generated online or
through a mobile phone
• Orders delivered by a box supplier
• Flowers can be delivered the next day
E-commerce
Boxed flowers
Revenues generated from consumers and corporate customers
Revenues generated from florists1
100% 100%
100% 100%
61% 66%
77% 81%
Products

Strictly private and confidential
110
256292
328 336 347
518
617
789
995 1,021
1,221
1,337 1,3621,330
1,390
73117
161196 178
264 265 250 248281 309
197 202 210 213
787
1,0981,031
965
828
747
989
872
823
773707
638 611568
509457
0
200
400
600
800
1,000
1,200
1,400
1,600
Ecommerce Corporate Florist
2,060
(2,133)
Orders 65%
25%
10%
E-com67%
Florist22%
Corporate, 10%
Share of total volumes:
E-commerce 17%
Corporate 2%
Florist -5%
Total 6%
6
Euroflorist has grown into an e-commerce business
Development of orders and e-commerce penetration
E-commerce has grown from constituting ~10% of orders in 2004/05 to ~67% in LTM Q3 2019
Orders (‘000)
CAGR: 2009/10 – 2019Q3Volume development, all regions
Q3 2019LTM(2017 inside)

Strictly private and confidential
Q3 ‘19
LTM
49 57 70 67 71 62 56 48 58
131 134 132 134 140 139 140 144 135
2737
45 6781 76 77 82 91
678690
746769
804 811765 746 754
885918
993
1,037
1,095 1,088
1,0381,020
1,038
0
200
400
600
800
1,000
1,200
Jul-Jun Jul-Jun Jul-Jun Jul-Jun Jan-Dec Jan-Dec Jan-Dec Jan-Dec Q3 LTM
2011/12 2012/13 2013/14 2014/15 2015 2016 2017 2018 2019
Normalised EBITDA Opex Direct marketing costs Flower costs
7
Stable revenue and margin development in 2019
1) Gross profit 1 is calculated by subtracting flower costs as well as COGS related to florist networks, gift cards and products from net sales
2) Gross profit 2 includes direct marketing costs for e-commerce sales (pay per click, commission to affiliates and partners)
3) Jan-Dec 2015 does not represent reported figures and are potentially misleading due to including two book closings
• Stable margins due to
commission based model
and a profitable customer
acquisition strategy within
e-commerce
• As the business model is
commission based, with the
company collecting a share
of the order value, the flower
cost does not impact
Euroflorist’s margins
• Figures are adjusted for
extraordinary costs and
changes in accounting
principles in accordance with
IFRS
• Important to note that
management accounts for
Jan-Dec 2015 are not fully
comparable and includes two
book closings (and e.g.
misrepresentation of gift
cards due to change in
accounting principle)
• EBITDA 2017 is adjusted for
the capex/opex allocation of
SEK 2,5m that occurred
during Q4 2017
Comments Revenue and cost structure 2011 / Q3 2019 LTM
%
Normalised EBITDA margin%
Gross profit 2 margin2
Gross profit 1 margin1%
6%
18%
25%
5%
19%
26%
6%
25%
21%
6%
23%
20%
7%
25%
20%
Management
accounts3
SEK million
6%
19%
27%26%
6%
19%
5%
19%
27%
6%
19%
27%

Strictly private and confidential
46%
34%
20%
Scandinavia40%
UK & Ireland42%
Central Europe18%
68%
11%
6%
14%
E-commerce70%
Florist10%
Corporate6%
Other13%
180191
202 201211
201 196 192 193
27
37
4567
81
76 77 8291
207
228
247
268
291
277 273 274284
23%25% 25%
26%27%
25%26% 27% 27%
20% 21% 20%19% 19%
18% 19% 19% 19%
0%
5%
10%
15%
20%
25%
30%
35%
40%
45%
50%
0
50
100
150
200
250
300
350
Jul-Jun Jul-Jun Jul-Jun Jul-Jun Jan-Dec Jan-Dec Jan-Dec Jan-Dec Q3 LTM
2011/12 2012/13 2013/14 2014/15 2015 2016 2017 2018 2019
Gross profit 2 Direct marketing costs
Gross profit 1 margin Gross profit 2 margin
8
Stable gross margin development
• Gross profit 1 is calculated
by subtracting flower costs
as well as COGS related to
florist networks, gift cards
and products from net sales
• Gross profit 2 includes direct
marketing costs for
e-commerce sales (pay per
click, commission to affiliates
and partners)
• Gross profit from service
fees has decreased from
SEK 40m in 2011/12 to SEK
22m in 2018 as a result of
fewer florists in the network
(enough to ensure delivery
coverage)
• Continuous strong
competition for ad-words in
our markets, driving the
increased Direct marketing
costs.
Comments Development of gross profit, 2011/12 – Q3 2019LTM Gross profit splits
Gross profit 2 by segment
Q3 2019YTD(2018 inside)
Gross profit 2 by geography
Q3 2019YTD(2018 inside)
1) Jan-Dec 2015 does not represent reported figures and are potentially misleading due to including two book closings
Management
accounts1
SEK million, gross profit
SEK 144m
SEK 144m
Q3 ‘19
LTM

Strictly private and confidential
Management
accounts1
8 9 7 7 5
5 4 4 44
6 6 8 118
19 22 2422
23
68 7
1012
96 90 9189
84
131134 132
134
140 139 140144
135
Jul-Jun Jul-Jun Jul-Jun Jul-Jun Jan-Dec Jan-Dec Jan-Dec Jan-Dec Q3 LTM
2011/12 2012/13 2013/14 2014/15 2015 2016 2017 2018 2019
Building Travelling Marketing Office External Personnel
15% 15% 13% 13% 14%
9
Lower opex following reorganizational change
• Stable opex costs throughout
the period
• Personnel costs decreased
in 2016 due to management
changes and efficiency
savings in personnel
• Fixed costs amounts to
approximately 9% of
revenues, more variable
costs are customer support
and corporate customers
costs
• Moreover, historically and
going forward, costs can be
shifted internally from florist
business to
e-commerce, ensuring
stability in operating
expenses
• Reorganization launched in
June driving the lower
Personnel costs
• Decreases in absolute
numbers are due to
efficiency savings in
personnel when launching
the new organisation during
Q2 2019
Comments Development of operating costs, 2011/12 – Q3 2019 LTM
SEK million % of revenue
13%13%
1) Jan-Dec 2015 does not represent reported figures and are potentially misleading due to including two book closings
14%
Q3 ‘19
LTM
12%

Strictly private and confidential 10
Seasonal pattern following trigger events primarily from December to May
Several specific and general annual events trigger flower orders
Pers
onal annual
trig
gers
Specific
annual
trig
gers
Q3 is characterised by
low sales due to lack of
popular floral and
gift-giving holidays
January February March April May June July August September October November December
Mother’s Day (UK)
Three weeks before
Easter
March
Mother’s Day (Austria,
Belgium, Denmark, Finland,
Germany, Holland and
Norway) 2nd Sunday in May
May
Mother’s Day (Sweden
and France)
Last Sunday in May
May
Midsummer’s Eve
June 21st
June
Christmas
December 24th
December
Easter
March 22nd - April 25th
March – April
Mother’s Day (Poland)
May 26th
May
Students’ Graduation
Day Late
May/Beginning of June
May – June
Remembrance Day
(Commonwealth
countries)
November 11th
November
Valentine’s Day:
February 14th
February
Ord
er
develo
pm
ent
over
a y
ear
3 events of the
year stand for
~20% of total
orders
Christmas, Valentine’s & Mother’s day orders, % of total
Other
anniversariesThank youGet well soonGraduationsFuneralsWeddingsBirthdays
~20%
~80%

Strictly private and confidential
0%
5%
10%
15%
20%
25%
30%
J F M A M J J A S O N D
2016 2017 2018 2019LTM
0%
2%
4%
6%
8%
10%
12%
14%
16%
J F M A M J J A S O N D
2016 2017 2018 2019LTM
83
112
114
75
115
81
63
72
73
75
79
147
75
117
115
73
111
80
61
65
72
69
71
128
71
114
115
72
106
73
59
72
71
70 73
123
74
119
117
75
112
72
62 6
9 72
J F M A M J J A S O N D J F M A M J J A S O N D J F M A M J J A S O N D J F M A M J J A S
2016 2017 2018 2019
0
6
11
4
11
2
1
2
3
2
3
16
2
11
10
2
9
3
1
2
3
2
3
9
1
10
10
27
1 1 1 23
91
10
13
38
3 3 2 2
J F M A M J J A S O N D J F M A M J J A S O N D J F M A M J J A S O N D J F M A M J J A S
2016 2017 2018 2019
11
Profit and cash flow follow Euroflorist’s seasonal pattern, with Q3 being
the smallest quarter every year in EBITDA and cash flow
Monthly Sales
Monthly EBITDA
• Euroflorist’s order volumes are
driven by personal recurring
events such as birthdays and
anniversaries, as well as general
recurring events including
Valentine’s Day, Mother’s Day
and Christmas. The recurring
events fuel strong demand in
certain periods
– Strong revenue in December,
February, March and May
• Higher EBITDA margin during
peak months demonstrate
scalability in business model
• The EBITDA for December 2017
includes a capex to opex
adjustment of SEK ~3m of which
SEK ~2.5m is attributed to Q1-Q3
2017
Comments
SEK million % of FY sales
SEK million % of FY EBITDA
Strictly private and confidential
48%52%
58%
29% 30%33%
37% 38% 38%
0%
10%
20%
30%
40%
50%
60%
70%
Jul-Jun Jul-Jun Jul-Jun Jul-Jun Jan-Dec Jan-Dec Jan-Dec Jan-Dec Q3 LTM
2011/12 2012/13 2013/14 2014/15 2015 2016 2017 2018 2019
173 189 206
177 145125
317 302257 249
281 274
350334 331 317
302
257 249281 274
7.1x
5.8x
4.7x4.7x
4.3x 4.1x4.5x
5.8x4.7x
0x
1x
2x
3x
4x
5x
6x
7x
8x
0
50
100
150
200
250
300
350
400
Jul-Jun Jul-Jun Jul-Jun Jul-Jun Jan-Dec Jan-Dec Jan-Dec Jan-Dec Q3 LTM
2011/12 2012/13 2013/14 2014/15 2015 2016 2017 2018 2019
Shareholder loans Interest-bearing debt and cash Net debt / EBITDA
12
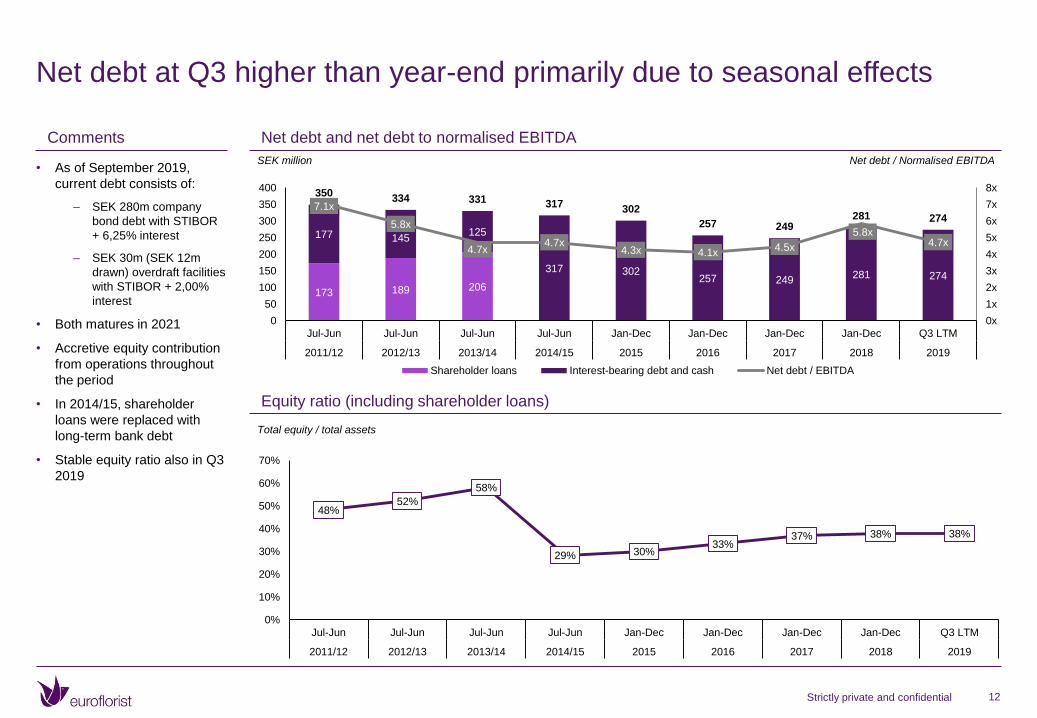
Net debt at Q3 higher than year-end primarily due to seasonal effects
• As of September 2019,
current debt consists of:
– SEK 280m company
bond debt with STIBOR
+ 6,25% interest
– SEK 30m (SEK 12m
drawn) overdraft facilities
with STIBOR + 2,00%
interest
• Both matures in 2021
• Accretive equity contribution
from operations throughout
the period
• In 2014/15, shareholder
loans were replaced with
long-term bank debt
• Stable equity ratio also in Q3
2019
Comments Net debt and net debt to normalised EBITDA
Equity ratio (including shareholder loans)
SEK million Net debt / Normalised EBITDA
Total equity / total assets

Strictly private and confidential 13
Thank you!