Embed Size (px)
Citation preview

Bond Cap Allocation Program The 2016 Biennial Policy Report and Activity Summary
February 2016
Report to the Legislature Brian Bonlender, Director
2016 Bond Cap Allocation Program Biennial Report to the Legislature
Acknowledgements
Washington State Department of Commerce
Nick Demerice, Director of the Office of External Relations Allan Johnson, Bond Cap Program Manager/Writer Amber Siefer, Program Coordinator Steve Salmi, Research Services Manager/Editor Liz Green-Taylor, Project Advisor/Writer Allan Johnson, 360-725-5033 [email protected] Washington State Department of Commerce Research Services/Bond Cap Allocation Program 1011 Plum St. SE P.O. Box 42525 Olympia, WA 98504-2525 www.commerce.wa.gov/bondcap
For people with disabilities, this report is available on request in other formats. To submit a request, please call 360-725-4000 (TTY 360-586-0772).

2016 Bond Cap Allocation Program Biennial Report to the Legislature
Table of Contents
Notes on Reading the Bond Cap Report ............................................................................. 1
Executive Summary ............................................................................................................. 2
Introduction ........................................................................................................................ 6
Bond Cap Policy Issues ...................................................................................................... 11
Bond Cap Categories ......................................................................................................... 19
Allocation Procedures and Criteria ................................................................................... 25
Qualified Energy Conservation Bonds .............................................................................. 32
2014-2015 Program Activity Summaries .......................................................................... 37
Public Benefits of Bond Cap .............................................................................................. 41
Long-Term Bond Cap Data and Trends ............................................................................. 46
2016 Initial Allocations ...................................................................................................... 54
Appendix A: Acronyms and Definitions ............................................................................ 55
Appendix B: Required Bond Cap Application Documentation ......................................... 59
Appendix C: Project Lists 2000-2013 ................................................................................ 61

2016 Bond Cap Allocation Program Biennial Report to the Legislature 1
Notes on Reading the Bond Cap Report
For the most part, the report subscribes to the standards published in the Associated Press (AP) Stylebook. However, there are a few exceptions, primarily involving technical terms used in the bond industry. For cases in which the accepted industry use of a term does not conform to AP guidelines, the report uses the industry standard. The list below may not be exhaustive, but it will alert the reader to the most frequent variations from AP style in an effort to prevent confusion. Capitalization of “Bond Cap” – When referring to the Bond Cap Allocation Program, the report capitalizes “Bond Cap” and “Bond Cap Program.” When referring to the federal limit on tax-exempt private activity bonds, the report does not capitalize “bond cap.” Example: The Bond Cap Program authorizes use of the federal bond cap. Punctuation of technical terms – The report adopts the punctuation as used in the industry. The most common occurrence of this is leaving out hyphens and commas in most technical terms where AP style would have included them. The only technical term routinely hyphenated is the term “tax-exempt.” Most other technical terms are used without hyphens or commas, including:
Small issue manufacturing bonds; the small issue category
Exempt capital facilities; the exempt facilities category
Industrial development bonds; industrial development revenue bonds Use of the term “Carryforward” – The noun “carryforward” is a one-word, non-hyphenated technical term that refers to bond cap that is unused at the end of the year in which it was first allocated. Federal law allows states to use carryforward for up to three years following the end of the original allocation year. For example, bond cap authority from 2015 that was not used during the year, if allocated by the state as “carryforward,” expires on December 31, 2018. On the other hand, to “carry forward” is a verb for the action of allocating that unused cap (carryforward) at the end of the calendar year. Carry forward as a verb is two words with no hyphen. Acronyms and definitions – The report defines acronyms on first use in each section for the reader’s convenience. In addition, a complete list of acronyms and definitions for technical terms is included in Appendix A, which begins on page 61. Bond cap authority – It is important to note the nature of the resource allocated by the Bond Cap Program. The program authorizes the issuance of bonds under the federal bond volume cap. It does not directly fund or finance projects. Funds used for projects receiving permission to issue tax-exempt private activity bonds come from private investors who purchase the bonds, and not from governmental entities.
2016 Bond Cap Allocation Program Biennial Report to the Legislature 2
Executive Summary
Overview
Since its inception in 1987, the Bond Cap Allocation Program has approved more than $12.2 billion in tax-exempt private activity bond issuing authority for a variety of economic and industrial development, housing, hydroelectric power, exempt capital facilities projects, and student loans in Washington State. During 2014 and 2015, projects financed with bond cap allocations created 14,929 construction and permanent jobs, and created or rehabilitated 7,093 units of rental housing for the state’s low income residents, seniors, and individuals with disabilities.
Because the proceeds benefit businesses or individuals, private activity bonds are ordinarily not eligible for tax-exempt status, according to the federal Tax Reform Act of 1986. However, if issued under the authority of the bond cap allocation, many projects that have public benefits accompanying their private benefits are able to access lower-cost, tax-exempt bond financing. The “cap” is a limitation on the total volume of these tax-exempt private activity bonds that may be issued annually in each state.
The Bond Cap Allocation Program, administered by the Washington State Department of Commerce (Commerce), reviews project applications to ensure conformance with federal and state guidelines, approves projects for bond issuance, and monitors the total amount of tax-exempt private activity bond financing permitted under federal law. The Internal Revenue Code allows states to determine how to distribute cap authority among five categories of projects: exempt facilities, housing, public utility district (for specific hydroelectric projects), small issue manufacturing, and student loans. Washington State law sets percentages for each category, criteria for allocation within the categories, and timelines for set-asides in some categories that encourage development in Eastern and distressed areas of the state.
The Bond Cap Allocation Program’s authorizing statute, RCW 39.86, requires Commerce to report biennially to the Legislature on policy issues affecting the program and on program activities. The report is due on February 1 in even-numbered years. This is the report for 2016.
Key Policy Issue – Housing
The primary policy focus of this report concerns the substantial increase in use of the bond cap for affordable housing projects and programs during 2014 and 2015. Affordable housing activities used $1.05 billion in 2014 and $819 million in 2015, compared with the state’s annual allocations of $697 million and $706 million for those two years. The ability to issue more bonds than the annual cap allocation was possible only because large amounts of unused annual cap (called “carryforward”) had accumulated during the 2008 recession years. Carryforward

2016 Bond Cap Allocation Program Biennial Report to the Legislature 3
authority is available for use for three additional years beyond the original allocation date, once allocated to a specific issuer.
However, that high level of affordable housing development using bond cap allocations is not sustainable. Excess carryforward amounts are expected to be exhausted by early- to mid-2017. Should the current level of need for affordable housing cap continue beyond the exhaustion of carryforward, competition for bond cap authority will reach an all-time high. Insufficient housing cap to meet the need could negatively impact the state’s lower income families, the homeless, seniors, and individuals with disabilities.
If current trends continue, the state’s entire bond cap will not be enough to meet the housing need, let alone the anticipated increased need in other categories of projects eligible for bond cap due to rising interest rates. In addition, the state’s initial allocation structure currently limits allocations for housing to 32 percent of the total annual cap amount during the first half of the calendar year, putting further pressure on affordable housing developers.
The report outlines three options for providing the flexibility to allocate additional cap to housing early in the year, without impacting the initial allocations for exempt facilities or small issue bonds. Options include:
Reduce the initial allocation to the student loan category – currently 15 percent of the state’s total cap – and direct the balance to housing. Student loan bonds have not been issued in the state since 2004, primarily due to changes in federal student aid. Even a large reduction in the student loan initial allocation would not change the ultimate use of the bond cap, barring a return to pre-recession federal student aid policies. However, it probably would not be advisable to eliminate the student loan category entirely, as a return to traditional federal student aid policy is possible.
Release the student loan initial allocation much earlier in the calendar year. Current statute releases all initial allocations on July 1, after which any unused annual cap may be reallocated for use in any category of project. By mid-January, the student loan industry will know whether state bonds for student loans are needed for the following school year, so releasing the initial allocation early will not have a negative impact on the state’s higher education students.
A combination of the above: reduce the student loan initial allocation percentage and release the balance much earlier than July 1 to be used for housing.
The report’s policy section goes into more detail not only regarding these options, but also regarding why affordable housing’s need for bond cap allocations is unique among the eligible cap categories. The policy discussion begins on page 11.

2016 Bond Cap Allocation Program Biennial Report to the Legislature 4
Additional Policy Issues
The balance of the report’s policy focus is on preparing for updates to the program’s statutes and rules that will be needed in response to economic impacts and proposed tax reforms that may affect the Bond Cap Program. Federal tax reform that could impact the program is slow in being developed, but still on the table. Following the federal tax reform discussion is one of the essential program activities at this time.
Effects of the recession continue to impact the program. During 2014 and 2015, no exempt facility bonds and only three small issue bonds totaling just $14.8 million have been issued in the state. In comparison, five exempt facilities bonds and 10 small issue bonds were issued in 2007 alone, the state’s last pre-recession year. However, with interest rates rising, demand for exempt facilities and small issue allocations is expected to increase. In addition to recessionary impacts that directly affect the program, several tax reform proposals aimed at reducing the federal deficit could affect program policy and operations. Proposals current before Congress could impact the Bond Cap Program either negatively or positively. The proposals range from increasing the total allowable bond cap and the type of projects eligible for exempt facilities and small-issue allocations, both of which could benefit the program, to eliminating tax-exempt bonds altogether, which could eliminate the need for the program altogether, depending on alternatives adopted. The policy section of the report covers the program’s plans for taking advantage of the benefits while mitigating the negative impacts of these changes. Policy initiatives include:
Increasing use of industrial development bonds and public-private partnerships.
Monitoring federal tax reform issues.
Creating efficiencies in program operations, including
Adopting a new legislative report date.
Eliminating obsolete references in statute.
Evaluating job creation and retention criteria.
Reinstating the program’s advisory group.
Program Activity Highlights
As noted, a key policy issue for the Bond Cap Program is the historically high use of the bond cap for affordable housing in 2014 and 2015, during which a total of $1.870 billion in in bond cap was used for housing, including $810.7 million to create 7,093 units of multifamily rental housing, $99.3 million for first time homebuyer assistance, and $960.0 million in mortgage credit certificates (a type of tax credit for homebuyers who meet certain criteria). Housing, far and away, has been the bond cap story for the past two years.

2016 Bond Cap Allocation Program Biennial Report to the Legislature 5
In addition to housing bonds, small issue projects made a bit of a comeback, from none issued during 2012 or 2013, to four issuances in the past two years – two manufacturing projects and two new farmer/rancher projects, totaling $15.0 million.
The use of carryforward that was allocated to the Washington State Housing Finance Commission is another highlight of the past two years. Because such a large amount of carryforward had accumulated during the recession years, Commerce teamed up with the commission to allocate to local housing authorities from the carryforward instead of from current year cap. This strategy benefited all bond cap issuers in the state as it acted to prevent older carryforward amounts from expiring unused, preserving as much capacity as possible into the future. For more detail on carryforward use and trends, see page 29.
Conclusion
Activity in the tax-exempt private activity bond arena was slow to recover from the recession, but trends in 2014 and 2015 appear to indicate that affordable housing has not only recovered, but is seeing historically high volume, and recovery in other bond cap areas is beginning. However, trends in affordable housing may suggest that the state’s initial allocation distribution needs to be adjusted to align with actual use trends.

2016 Bond Cap Allocation Program Biennial Report to the Legislature 6
Introduction
What Is the Bond Cap?
In the mid-1980s, federal observers became concerned about revenue shortfalls that were due in part to increasingly large numbers of tax-exempt municipal bond issuances over the previous decade. Congress responded to the concerns by passing the Deficit Reduction Act of 1984, then two years later the Tax Reform Act of 1986. These acts set a limit – the “cap” or “ceiling” – on the total volume of tax-exempt private activity bonds that states may issue annually, and established bond use categories eligible to issue bonds under the cap.
In response, Washington’s Governor, then the Legislature, created procedures for allocating the state’s cap among the categories and establishing priorities among applicants. Program administration was assigned to the Department of Community Development, which later merged with the Department of Trade and Economic Development to become the Department of Community, Trade and Economic Development (CTED). In 2009, CTED became the Department of Commerce.1
The Bond Cap Allocation Program has authorized approximately $10.8 billion in tax-exempt private activity bond issuances since its inception. These bonds have contributed to the development of thousands of housing units and new jobs in Washington’s communities; industry, infrastructure, and clean energy production across the state; and low-cost student loans to educate thousands of Washington’s citizens.
How Much Cap Authority Is Available?
The total amount of tax-exempt private activity bond authority each state is allowed is calculated using a per capita formula. In 1984, the federal Deficit Reduction Act set the volume cap at $150 per capita. This was reduced to $50 per capita by the Tax Reform Act of 1986. In 2001, the Internal Revenue Service (IRS) began periodic increases in the per capita volume cap rate to adjust for inflation. For January 1, 2014, the cap was raised to $100 per capita. Each December, when the U.S. Census Bureau releases its official population figures, the total cap for the following year is calculated. For calendar year 2016, the per capita multiplier will be $100, resulting in a total of $717 million in bond cap authority available in Washington State. Cap authority is divided among the eligible categories by percentages described in Washington statute.2
1 RCW 39.86
2 RCW 39.86.120

2016 Bond Cap Allocation Program Biennial Report to the Legislature 7
Figure 1: Bond Cap History Timeline

2016 Bond Cap Allocation Program Biennial Report to the Legislature 8
What Is a Tax-Exempt Private Activity Bond?
A bond is a means for an investor to lend money to a corporate or governmental entity that borrows the funds for a defined period of time at a specified interest rate. Because the bond investor is not required to pay federal taxes on interest earned on tax-exempt bonds, these bonds can qualify for lower interest rates than conventional financing, thus saving the borrower money. For projects with benefits that are considered essentially public – roads and most infrastructure, for example – tax-exempt bonds may be issued without cap authority. Bonds for projects with a high level of private benefit or participation are not tax-exempt unless they meet specific IRS criteria and are issued under the authority of the bond cap allocation. A bond is considered a private activity bond if it meets one of two tests:
1. It meets both of the private business use tests: a. Greater than 10 percent of its proceeds are used for any private business
purpose, AND b. Greater than 10 percent of its proceeds are either secured by property used for
private business purposes or are to be repaid from private business sources. 2. OR, it meets the private loan financing test:
a. Greater than 5 percent (or $5 million, whichever is less) of its proceeds are used for loans to persons other than governmental entities.3
What Kinds of Projects Are Eligible?
The Tax Reform Act of 1986 established five categories of projects eligible to issue bonds under cap authority.
Exempt Facilities – Certain types of capital transportation, waste management, energy, and environmental facilities as defined in the IRS Code.
Housing – In Washington, this includes both affordable multifamily rental housing and single family homeownership projects.
Small Issue – Industrial development projects with less than $20 million in capital expenditures over six years. Bonds are limited to $10 million in par value.
Student Loans – Higher education loans for qualifying students.
Public Utility District (PUD) – Efficiency and environmental enhancements for certain hydroelectric facilities. The state’s public utility district volume cap was further limited in federal law to a lifetime maximum of $750 million. In 2007, Washington’s PUDs used the last of their $750 million cap, so the public utility district category no longer exists in the state.
3 Federal Taxation of Municipal Bonds Deskbook; Third Edition; August 2010; Lexis Nexis; Newark, New Jersey;
page 10; Referring to 26, U.S.C Section 141, Paragraph 2.01(a) and (b)
2016 Bond Cap Allocation Program Biennial Report to the Legislature 9
How Does a Project Apply for Cap Authority?
In Washington State, bonds may only be issued by authorized governmental entities, so a private business developing a project typically works with either a state or local bond issuer to arrange tax-exempt private activity bond financing. The bond issuer then applies to Commerce for authorization to issue the bond. In the case of multifamily housing projects, certain exempt facilities, and student loans, the governmental issuer might also be the project developer. Bonds must be issued within the calendar year, typically no later than December 15. Any cap authority that is unused at the end of the year may be carried forward into the next three years. Commerce is responsible for taking applications, evaluating projects, authorizing bond issuances under the cap, and ensuring the state does not exceed its cap authority.
How Does Commerce Decide Which Projects Get Cap Allocations?
Washington’s Legislature has established in statute a formula for initial allocations – set-asides of cap authority – for each category. Since the 2007 expiration of the PUD category, the initial allocations have included:
Exempt facility – 20 percent
Housing – 32 percent, divided between
Housing Finance Commission – 80 percent (25.6 percent of total cap)
Local housing authorities – 20 percent (6.4 percent of total cap)
Small issue – 25 percent
Student loans – 15 percent
Remainder – 8 percent During the calendar year, timelines apply to some of the category set-asides. No exempt facilities projects may receive more than 30 percent of the total exempt facilities set-aside prior to September 1 each year. Prior to June 1, portions of the small issue set-aside are reserved for Eastern Washington distressed counties, eastern non-distressed counties, and Western Washington distressed counties. After July 1, unused cap from any category may be reallocated to any other category, although 50 percent of any unused cap is prioritized for housing. The authority in the remainder category may be used for any eligible category of project at any time, thus creating flexibility in the program early in the year. Each category has a set of basic eligibility criteria in the IRS code and in state statute and agency rule that guide allocation decisions. These criteria help Commerce prioritize projects for allocations by assessing the public benefit of each project.
Small issue projects are evaluated based on the number of retained and new jobs created per dollar of cap authority, and by the need in a particular community for industrial development. Exempt facilities projects are evaluated based on the number of jobs created and the degree to
2016 Bond Cap Allocation Program Biennial Report to the Legislature 10
which the project reduces environmental pollution, produces lower cost energy, or diverts solid waste from disposal and remanufactures it into value-added products.
Housing projects are evaluated based on the number of housing units created or rehabilitated per dollar of cap authority, and the degree to which the project meets each community’s highest affordable housing needs.
How Do Economic Fluctuations Impact Bond Cap Allocations?
For most of the program’s history, Commerce has been able to allocate to eligible projects in every category on a first-come, first-served basis. Rarely have projects experienced allocation delays, even in the context of the statutory set-asides, limitations, and timelines for allocations. A notable exception occurred in 2007, when market factors combined to increase demand for cap authority, particularly for housing cap. Commerce received more applications for housing allocations than there was cap available. The Housing Finance Commission absorbed the worst of the impact of the cap shortfall by curtailing both their Single Family Homeownership and Multifamily Rental Housing programs. This allowed most other issuers to eventually receive the cap they needed that year, although many experienced delays waiting for the release of the category set-asides. The year ended with a record-setting low amount of cap available to be carried forward into future years.
At the beginning of 2008, Commerce again received more housing applications than there was cap authority available in the housing and remainder set-asides combined. For the first time, the program had to establish a competitive process with which to prioritize housing applications and allocate cap. The need for additional housing cap remained high for several more months and in mid-2008 Congress provided $11 billion nationwide in additional cap authority for housing in the Housing and Economic Recovery Act of 2008 (HERA), of which Washington’s share totaled $202 million. Nevertheless, the national housing crisis began to make itself felt in our state, and many housing developers that had competed for available cap at the beginning of the year were unable to issue their bonds before the annual deadline.
Since then, economic uncertainty and low interest rates on conventional loans caused demand for bond cap allocations in most categories to remain weak. Each year since 2008, large amounts of unused cap have been carried forward into future years. At the beginning of 2014, nearly $1.7 billion in carryforward had accumulated unused at the Housing Finance Commission. Commerce has traditionally chosen to allocate most or all of the carryforward each year to the commission, which may use it for its own programs or may reallocate the carryforward to other housing issuers.
However, while other category activity remained slow, affordable housing finally began to recover in 2014, when the Housing Finance Commission and local housing authorities together used $1.05 billion in carryforward bond cap. In 2015, $819 million in carryforward was used for affordable housing projects.

2016 Bond Cap Allocation Program Biennial Report to the Legislature 11
Bond Cap Policy Issues
Very little has changed in the bond cap realm since the previous biennial report in 2014. Tax reform proposals have languished in Congress. Even with the recent incremental increase by the Federal Reserve Board, interest rates remain low, making conventional bank financing more cost effective for small issue and exempt facilities projects than bond financing. While the affordable housing industry has bounced back from recession levels, several years of low use of available bond cap authority still mean large amounts of bond cap annually carried forward into future years.
Affordable Housing and Bond Cap
Affordable housing has always been the largest user of Washington’s allocation of bond cap authority, and in recent years, the amount of the state’s total bond cap used for affordable housing has exceeded 90 percent. In part this is due to inactivity in other categories of projects. However, more importantly, it is due to the increasing need for affordable housing in the state and the unique way in which affordable housing projects are dependent on bond cap allocations. Increasing demand for affordable housing and bond cap allocations for housing may indicate the need to reevaluate the state’s current category distribution.
Washington’s Housing Affordability
While housing prices in the state dipped slightly during the height of the recession, in some areas of the state, and particularly in some areas in the Puget Sound region, prices bounced back quickly and continued to rise. According to the University of Washington’s Runstad Center for Real Estate Studies’ Housing Market Snapshot for the third quarter of 2015, the average affordability index for first-time homebuyers in the state was 78.8.4 In King County it was 58.1, and in the 12 counties bordering Puget Sound, the first-time homebuyer affordability index was only 78.9.
The housing affordability index is a measure of whether or not a typical family earns enough income to qualify for a mortgage loan on a typical home based on the most recent monthly price and income data, assuming a 25 percent qualifying ratio for monthly housing expense to gross monthly income and a 20 percent down payment. Affordability index numbers above 100 indicate homes in the area are relatively affordable; below 100, homes in the area are out of reach for most first-time homebuyers.5 The lower the index below 100, the fewer families can afford to purchase a home.
4 University of Washington, Runstad Center for Real Estate Research; Housing Market Snapshot, State of
Washington and Counties, Third Quarter 2015; http://realestate.washington.edu/research/wcrer/reports/ 5 National Association of Realtors; Housing Affordability Index Methodology;
http://www.realtor.org/topics/housing-affordability-index/methodology: “To interpret the indices, a value of 100
2016 Bond Cap Allocation Program Biennial Report to the Legislature 12
Affordable Housing Need for Bond Cap
While exempt facilities and small issue projects can benefit from lower interest rates created by using a bond cap allocation, most can still go forward without bond cap – by using either a taxable bond or conventional bank financing. Affordable housing projects, on the other hand, almost always require bond cap allocations to even be feasible. By definition, affordable housing projects are not market rate. They do not supply market rate rental revenue with which a housing developer could repay a lender, and therefore cannot qualify for conventional financing.
Most affordable rental housing projects must have financing from multiple sources in order to be feasible. In addition to an allocation of the state’s bond cap, other sources may include 4 or 9 percent low income housing tax credits (LIHTCs), federal grants or loans, private foundation grants, local government grants, proceeds from various housing voucher programs, contractor concessions, and developer or housing authority equity. To qualify for 4 percent LIHTCs, a project is required to have an allocation of bond cap authority. Federal Department of Housing and Urban Development (HUD) grants or loans typically require a project to have a cap allocation guaranteed, usually several years in advance of planned ground-breaking.
In addition, single-family homeownership assistance, whether in the form of mortgage revenue bonds or mortgage credit certificates (a form of tax credit), also requires bond cap allocations under federal law. Without a bond cap allocation, most affordable housing efforts – whether multifamily rental projects or single family homeownership programs – cannot go forward.
Potential Policy Implications
Nationwide, upwards of 60 percent of bonds issued under the bond cap are used for affordable housing.6 In Washington, the trend is even more marked, with a historical use of 73 percent of the state’s total bond cap since the program’s inception in 1987, more than 90 percent over the past ten years, and approaching 99 percent since 2009.
In addition to the high percent of bond cap being used for housing category projects, during 2014 and 2015, Washington’s affordable housing projects used more bond cap than each year’s
means that a family with the median income has exactly enough income to qualify for a mortgage on a median-priced home. An index above 100 signifies that family earning the median income has more than enough income to qualify for a mortgage loan on a median-priced home, assuming a 20 percent down payment. For example, a composite HAI of 120.0 means a family earning the median family income has 120% of the income necessary to qualify for a conventional loan covering 80 percent of a median-priced existing single-family home. An increase in the HAI, then, shows that this family is more able to afford the median priced home.
The calculation assumes a down payment of 20 percent of the home price and it assumes a qualifying ratio of 25 percent. That means the monthly P&I payment cannot exceed 25 percent of the median family monthly income.” 6 Council of Development Finance Agencies; CDFA Annual Volume Cap Report, An Analysis of 2014 Private Activity
Bond & Volume Cap Trends; July 2015; http://www.cdfa.net/cdfa/cdfaweb.nsf/ordredirect.html?open&id=201507-2014VolumeCapReport.html

2016 Bond Cap Allocation Program Biennial Report to the Legislature 13
annual allocation. In 2014, housing issuances exceeded $1 billion, compared with the annual 2014 cap of $697 million. The 2015 annual bond cap was $706 million, and housing issues topped $819 million. The ability to issue more in bonds than the state’s annual allocation was made possible by several years of low overall use of the cap during the recession, which allowed large amounts of carryforward to accumulate. However, if the current use trend continues, by the beginning of 2017, the carryforward pool will be nearly exhausted, putting the state back into a situation in which demand for housing cap could exceed the supply.
The last time this kind of competitive environment occurred, in 2007, the state ran completely out of cap. Several housing authorities did not get needed allocations, and the Housing Finance Commission was forced to curtail both their Multifamily and Single Family programs. The potential for this situation to negatively impact Washington’s lower income families is significant.
With affordable housing currently requiring more cap than the state’s entire annual allocation, and carryforward reserves potentially running out in the next year, the 32 percent initial housing allocation may prove especially challenging for the state’s affordable housing developers. Particularly during the first half of the year when cap is reserved for other categories of projects, the possibility exists for affordable housing projects to miss construction windows, lose other time-sensitive sources of financing, or experience cost increases. The 32 percent initial allocation for housing has been in place since 2003. In 2010, the Legislature changed the date for releasing initial allocations from September 1 to July 1. That allowed reallocations to housing projects earlier in the year than previously, but did not increase the amount available during the first six months of the calendar year. It may be time to consider adjusting the state’s initial allocation structure to make additional cap available to housing earlier during the year.
Policy Options
One option the Legislature could consider would be to significantly reduce the initial allocation for the student loan category and move the balance to the housing category. Due to changes in federal student aid, the state has not used its student loan allocation for many years. No student loan bonds have been issued since 2004. Reducing the initial allocation for the student loan category and increasing the initial allocation for housing by the same amount would ease the housing cap situation without impacting exempt facilities and small issue category issuers.
Alternatively, by mid-January each year, the need for the state to create student loan capacity for the following school year will be apparent. If no student loans will be needed in a give year, the initial allocation could be released much earlier than the July 1 release date for the other categories. For example, a February 1 date for releasing the student loan initial allocation to housing would allow additional housing allocations well in advance of the summer construction season.

2016 Bond Cap Allocation Program Biennial Report to the Legislature 14
Furthermore, the Legislature could consider a combination of the two strategies; that is, a reduction of the total initial allocation for student loans along with releasing the remaining initial allocation earlier than July 1 would allow additional flexibility for housing allocations, again without negative impacts on the remaining categories.
While these options may work in the short-run, over time continuing increases in demand for affordable housing may call for additional policy changes, including further reductions in other bond cap categories. However, evaluating the need for additional changes is difficult at this time given uncertainty at the federal level regarding private activity bonds specifically and tax-exempt bonds in general. Federal tax reform proposals that would reduce use of tax-exempt private activity bonds would tighten competition for housing cap. On the other hand, other federal proposals could increase the available cap, making adjustments in the student loan allocation sufficient to meet the need over the long haul.
In addition, it is not immediately clear how much of the current increased use of housing cap is due to pent-up demand caused by deferred maintenance and construction during the recession. It may be possible that demand will normalize over several more years, once that maintenance and construction has been accomplished. However, it appears that the state’s new normal need for housing cap will almost certainly be higher than when the current category structure was adopted several years prior to the 2008 recession. Nevertheless, caution is warranted when considering adjustments beyond freeing up student loan cap, as the likelihood is high that other categories’ demand for cap, particularly in the exempt facilities and small issue categories, will also increase as interest rates rise.
Other Bond Cap Policy Issues
Aside from the affordable housing arena, bond cap policy and program initiatives remain substantially as they were two years ago. For additional detail on the following policy issues, see the policy section in the 2014 Bond Cap Biennial Report.
Impacts of Federal Tax Reform
A variety of tax reforms have been proposed as a means of reducing the federal deficit. While there seems to be some agreement at the federal level that deficit reduction via tax reform might be in order, there is little agreement as to how to achieve it. There is also vocal opposition to all the measures that have been proposed thus far. At the time of the 2014 biennial report, most analysts expected Congress to begin dealing with tax reform in 2015; however, that effort still has not gained much traction. Nevertheless, as it did in 2009 when Congress passed the American Recovery and Reinvestment Act, the Bond Cap Program needs to be prepared to respond quickly should any reforms impacting its operations be adopted.
Examples of current tax reform proposals that could impact the program include:

2016 Bond Cap Allocation Program Biennial Report to the Legislature 15
Limiting investor use of the tax exemption on municipal bonds. Several proposals – including President Obama’s proposal – suggest limiting the amount of interest income an investor can claim as tax-exempt to 28 percent of municipal bond investment income. This proposal would tend to reduce tax-exempt private activity bond activity even further than economic factors already have.
Eliminating tax-exempt bonds altogether. Along with significant negative impacts on state and local government infrastructure investments, this proposal, if adopted, would completely eliminate the need for the Bond cap program.
Replacing tax-exempt bonds with direct subsidy bonds. The direct subsidy bonds that were available as economic stimulus during the recession, such as Build America Bonds and Recovery Zone Facility Bonds, were well received in the market. The direct subsidy concept is offered as a companion proposal to eliminating tax-exempt bonds altogether. Bond investors would pay taxes on interest income from municipal bonds, but the issuer’s interest costs would be reduced by a subsidy directly from the U.S. Treasury, reducing the negative impact on municipal issuers of the elimination of the tax-exemption. If direct subsidy bonds become capped, as Recovery Zone Facility Bonds were, this would change the focus of the Bond Cap program, but the program would still be needed. If the bonds are not capped, there would, again, be no need for the program.
Eliminating the tax-exemption for all private activity bonds. Not only would this negatively impact issuers of bonds under the authority of the bond cap, but it would also negatively impact non-profit 501c3 bonds, and bonds for private activities that are exempt from bond cap, such as docks, wharves, and airport bonds. As would the proposal to eliminate all tax-exempt bonds, this proposal would make the Bond Cap program unnecessary.
As much as was possible at the time, the Bond Cap program built into its 2010 legislative request and rule adoption the flexibility to respond quickly to changes at the federal level. In addition, the program continues to actively monitor federal tax reform developments, and is ready to respond as needed with further rule adoption or a request for an executive order or legislation, should a proposal pass in Congress that changes the program’s scope of work.
Increasing Use of Exempt Facilities and Small Issue Bonds
The large accumulation of carryforward available to support financing for affordable housing makes this a perfect time for the Bond Cap Allocation Program to concentrate on increasing visibility and use of the other categories – specifically exempt facilities and small issue.
In the early days of the program, both exempt facilities and small issue bonds were more active than they have been for the past several years. Even 2007’s activity spike did not come close to

2016 Bond Cap Allocation Program Biennial Report to the Legislature 16
the activity that took place in the 1990s (see Figure 7 below). Stricter lending standards, lower interest rates, and post-recession borrower caution have combined over the past few years to reduce demand for bond cap in the small issue and exempt facilities categories.
Figure 2: Small Issue and Exempt Facilities Percent of State’s Total Cap
However, rising interest rates should increase demand for tax-exempt private activity bond financing, particularly if proposed tax reform measures are adopted that broaden both the small issue and exempt facilities categories to include additional types of businesses. The Bond Cap program needs to proactively market to potential small issue and exempt facilities stakeholders to make them aware of the resource when the need for lower cost financing occurs. The program’s marketing plan includes:
Work with program stakeholders, such as local economic or industrial development corporations, and state issuers, such as the Washington Economic Development Finance Authority, to continue lender outreach.
Produce press releases on projects receiving allocations.
Include regular articles in the agency’s Municipal Finance newsletter.
Provide relevant articles for publications from partner organizations, such as those from the Association of Washington Cities and the Washington Association of Counties.
Reach out to industry groups and publications.
Resume letters to legislators when allocations are made to businesses in their districts.
Partner with the agency’s business development staff.
Partner with Commerce Business Development and external stakeholders to promote public-private partnerships, particularly those that facilitate infrastructure development.
Consider advocating for CDFA’s federal initiatives (see below).
2016 Bond Cap Allocation Program Biennial Report to the Legislature 17
National Tax Initiatives Impacting the Bond Cap Program
Two national-level initiatives focus on bringing the exempt facilities and small issue categories up-to-date with proposed changes to federal law. The Council of Development Finance Agencies (CDFA), in partnership with the Clean Energy Group, points out that federal private activity bond law does not clearly address clean energy. To remedy that situation, the partners have proposed the “Clean Energy + Bond Finance Initiative,” which would add provisions for renewable energy resource facilities, and conservation and efficiency facilities and projects to federal private activity bond law.7
Under current law, energy projects are allowed only if the energy produced is distributed in a limited area – a city plus the contiguous county or two contiguous counties. The proposal would eliminate that restriction, increase the number and type of energy facilities eligible for bond cap allocations, and create a separate category for those projects, which would include:
Renewable energy facilities such as solar, wind, geothermal, marine and hydrokinetic renewable energy, incremental hydropower, biomass, and landfill gas facilities.
Conservation and efficiency facilities and projects such as facilities for conservation or efficient use of energy, retrofitting of existing buildings, efficient storage, transmission or distribution of energy, “smartgrid” technologies, and water conservation facilities.
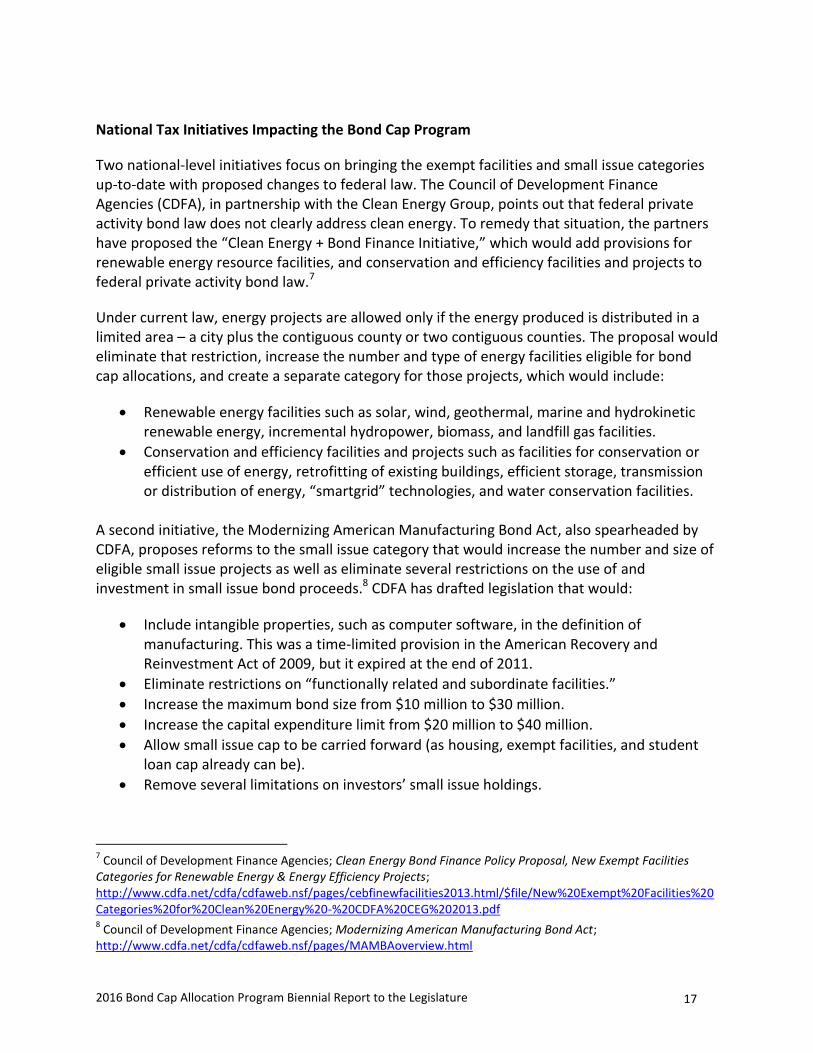
A second initiative, the Modernizing American Manufacturing Bond Act, also spearheaded by CDFA, proposes reforms to the small issue category that would increase the number and size of eligible small issue projects as well as eliminate several restrictions on the use of and investment in small issue bond proceeds.8 CDFA has drafted legislation that would:
Include intangible properties, such as computer software, in the definition of manufacturing. This was a time-limited provision in the American Recovery and Reinvestment Act of 2009, but it expired at the end of 2011.
Eliminate restrictions on “functionally related and subordinate facilities.”
Increase the maximum bond size from $10 million to $30 million.
Increase the capital expenditure limit from $20 million to $40 million.
Allow small issue cap to be carried forward (as housing, exempt facilities, and student loan cap already can be).
Remove several limitations on investors’ small issue holdings.
7 Council of Development Finance Agencies; Clean Energy Bond Finance Policy Proposal, New Exempt Facilities
Categories for Renewable Energy & Energy Efficiency Projects; http://www.cdfa.net/cdfa/cdfaweb.nsf/pages/cebfinewfacilities2013.html/$file/New%20Exempt%20Facilities%20Categories%20for%20Clean%20Energy%20-%20CDFA%20CEG%202013.pdf 8 Council of Development Finance Agencies; Modernizing American Manufacturing Bond Act;
http://www.cdfa.net/cdfa/cdfaweb.nsf/pages/MAMBAoverview.html

2016 Bond Cap Allocation Program Biennial Report to the Legislature 18
If either of the measures are adopted, the Bond Cap Program should be prepared to draft any necessary legislative and rule updates, as well as to include information about them in marketing exempt facilities and small issues.
Creating Efficiencies in Program Operations
If Congress enacts tax reform legislation that impacts tax-exempt bonds in general or tax-exempt private activity bonds in particular, the Bond Cap Program will need to be prepared to respond appropriately with legislative or rule changes. However, even if Congress does not adopt changes affecting the program, there are a handful of small technical changes the program is looking at, some of which will require statutory changes. Program initiatives include:
Adopting a more workable legislative report due date. The current February 1 due date conflicts with important program data collection and activities, and is also not timed conveniently for OFM or legislators.
Eliminating obsolete references in statute. A couple of old references to Community Economic Development Board functions that no longer exist need to be cleaned up.
Evaluating job creation and retention criteria. These criteria were last adjusted in 1997 and are overdue to be reassessed to determine if they are still appropriate.
Reconvening the Bond Cap Advisory Committee. This informal committee last met during 2009, when preparing for impacts of the American Recovery and Reinvestment Act (ARRA). With federal tax reform efforts on the horizon, it is time to proactively revive the committee to help inform any needed program changes.

2016 Bond Cap Allocation Program Biennial Report to the Legislature 19
Bond Cap Categories
Exempt Facilities – 20 Percent Initial Allocation
Exempt facilities are capital projects that do not qualify for tax-exempt status unless issued under the bond cap because of a high level of private involvement or benefit. Exempt facilities include:
Solid and hazardous waste disposal.
Wastewater/sewage treatment.
Water facilities.
Mass commuting facilities.
Local district heating and cooling.
Local furnishing of electricity or gas Over the past several years, tax-exempt private activity bonds have been used to finance innovative recycling, alternative energy, and waste management projects in the exempt facilities category.
Among examples of recent exempt facilities projects are four dairy manure digesters — one in Lynden, two in Yakima, and one in Mesa in Franklin County. These digesters take dairy wastes out of the waste stream, clean up local air and water, compost the wastes at high temperatures to produce electricity to run the dairy and sell back to the grid, and produce value-added garden products from the decontaminated waste.
In addition to removing tons of waste and pollution, creating value-added consumer products, and providing power, sewer, and water facilities, exempt facilities projects have created or retained more than 1,800 jobs for Washington residents since 2007.
2016 Bond Cap Allocation Program Biennial Report to the Legislature 20
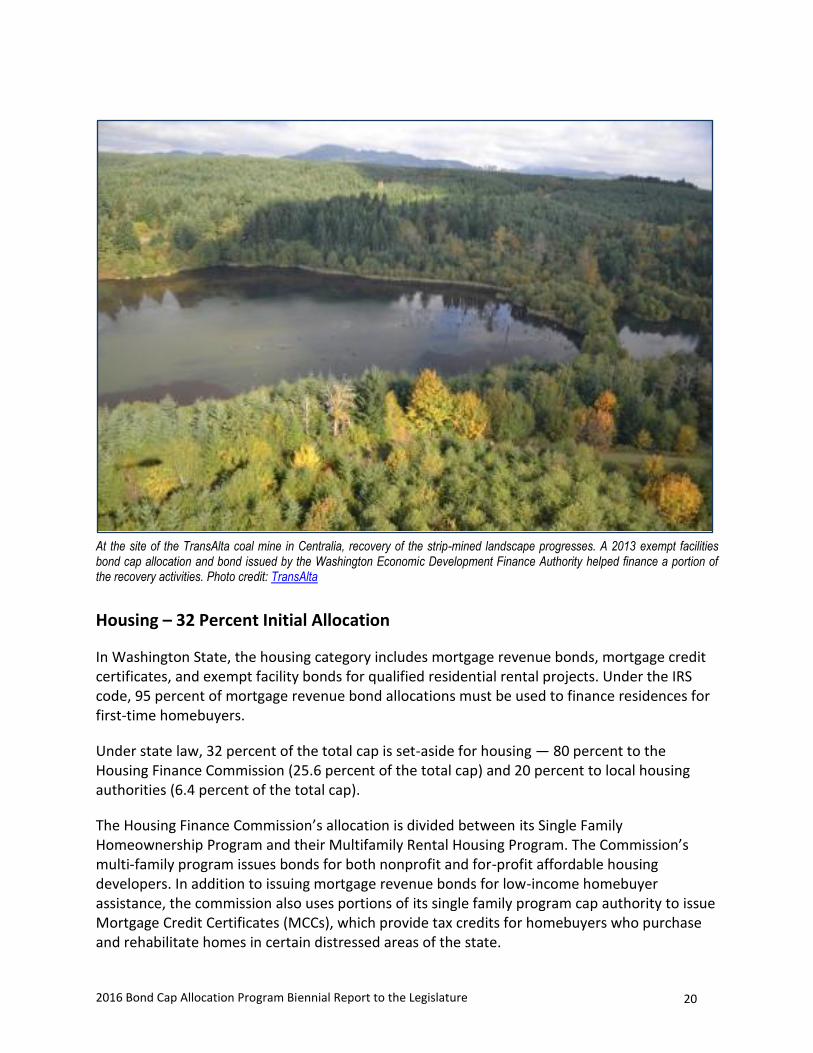
At the site of the TransAlta coal mine in Centralia, recovery of the strip-mined landscape progresses. A 2013 exempt facilities bond cap allocation and bond issued by the Washington Economic Development Finance Authority helped finance a portion of the recovery activities. Photo credit: TransAlta
Housing – 32 Percent Initial Allocation
In Washington State, the housing category includes mortgage revenue bonds, mortgage credit certificates, and exempt facility bonds for qualified residential rental projects. Under the IRS code, 95 percent of mortgage revenue bond allocations must be used to finance residences for first-time homebuyers.
Under state law, 32 percent of the total cap is set-aside for housing — 80 percent to the Housing Finance Commission (25.6 percent of the total cap) and 20 percent to local housing authorities (6.4 percent of the total cap).
The Housing Finance Commission’s allocation is divided between its Single Family Homeownership Program and their Multifamily Rental Housing Program. The Commission’s multi-family program issues bonds for both nonprofit and for-profit affordable housing developers. In addition to issuing mortgage revenue bonds for low-income homebuyer assistance, the commission also uses portions of its single family program cap authority to issue Mortgage Credit Certificates (MCCs), which provide tax credits for homebuyers who purchase and rehabilitate homes in certain distressed areas of the state.

2016 Bond Cap Allocation Program Biennial Report to the Legislature 21
Local housing authorities in the state issue bonds for their own projects and for nonprofit affordable housing developers. All local housing authority cap is used for multifamily rental projects.
Since 2007, housing category bond cap allocations helped create or rehabilitate more than 22,093 units of low income, senior, and special needs housing statewide.
A bird’s eye view of the scope of Seattle Housing Authority’s Yesler Terrace redevelopment. The project includes affordable housing, market-rate housing, retail, arts space, and a variety of other community amenities. Seattle Housing Authority bond issuances, facilitated by allocations of housing category bond cap authority, have contributed to the financing for the affordable housing portions of the project. Photo credit: Seattle Housing Authority
Small Issue – 25 Percent Initial Allocation
A small issue project, as described in the IRS code, is an industrial development/manufacturing project with a maximum of $20 million in capital expenditures over a six-year period – three years prior and three years after the issuance of the tax-exempt private activity bond. An allocation request for a single project in this category may not exceed $10 million.
In addition to the traditional small issue manufacturing projects, in 2006 the state adopted legislation to create the Beginning Farmer/Rancher or “Aggie Bond” Program, administered by the Housing Finance Commission. Bonds to support new farming operations were first issued in

2016 Bond Cap Allocation Program Biennial Report to the Legislature 22
early 2008. Since then, aggie bonds have assisted 23 families to establish new agricultural businesses.
During the time the American Recovery and Reinvestment Act (ARRA) of 2009 was in effect (through the end of 2010), manufacturers of intangible properties, such as software, were authorized to use the small issue category of bond cap. While that provision dissolved along with the rest of the ARRA, there are proposals before Congress to reinstate it and make it permanent.
Aside from the Beginning Farmer/Rancher Program, activity in the small issue category has been slower than usual since the beginning of the recession. Nevertheless, since 2007 bonds issued in the small issue category helped create or retain 1,245 jobs in Washington communities.
Shining Ocean, a seafood processing facility in Puyallup. A 2015 bond cap small issue allocation helped finance upgrades to processing equipment to enhance worker and food safety, and to meet current environmental standards for air emissions and water discharge. The Pierce County Economic Development Corporation served as issuer for the project, which retained 154 jobs in the community. Photo credit: Shining Ocean
Student Loans – 15 Percent Initial Allocation
The student loan category is reserved for bonds issued to finance loans for students who are either enrolled in higher education within Washington or are legal residents of the state.
Washington was without a qualified student loan bond issuer for three years after the Student Loan Finance Association (SLFA) assets were sold in late 2004 to a for-profit corporation. During the 2007 legislative session, the Washington Higher Education Facilities Authority (WHEFA) was appointed to be the new authorized student loan bond issuer in the state. The authority spent the balance of 2007 setting up the program and identifying vendors for the loan services it planned to offer. However, beginning in 2008, changes in federal financial aid procedures have made it difficult or unnecessary for the state to issue student loan bonds. Consequently, no bonds have been issued in this category since 2004.
Depending on student financial aid developments at the federal level, WHEFA expects to be able to offer both federally insured student loans and alternative loans, increasing educational
2016 Bond Cap Allocation Program Biennial Report to the Legislature 23
opportunities for students in a wider variety of educational settings and with more diverse economic needs. The approximate $100 million in annual student loan bond cap capacity is enough to provide access to higher education for between 10,000 and 20,000 Washington students annually.
Remainder and Redevelopment – 8 Percent Initial Allocation
“Remainder and Redevelopment” is a miscellaneous category that may be allocated to projects eligible under any of the other bond use categories throughout the year if the initial allocation in the project’s category has been depleted, or if the set-aside structure or timelines limit the availability of cap for a specific project. At the beginning of each year, 8 percent of the state’s total bond cap authority is banked in the remainder category, providing flexibility to make more allocations earlier in the year.
In addition, state law provides that if an issuer in a category has received a large carryforward allocation from the previous year, the initial allocation in that category for the next year may be reduced by the carryforward amount.9 When this occurs, that amount may be reallocated into the remainder category, providing even more flexibility to make allocations to categories with higher needs earlier in the year.
Most often the remainder cap is used for housing category projects, particularly for local housing authority allocations over the initial set-aside. Remainder cap is also used for exempt facilities projects that are larger than the 30 percent of the initial allocation allowable for any one project early in the year.
Historical Category Use
Over the years of the program’s history, the housing category has traditionally used the largest share of the state’s total bond cap authority. From the program’s start in 1987, housing has used an average 73.3 percent of the state’s total cap. Over the past 10 years, the housing percentage went up to 83.2 percent. Since 2008, more than 90 percent of the annual cap has been issued as housing bonds or allocated as carryforward designated for housing purposes.
9 RCW 39.86.120(2)
2016 Bond Cap Allocation Program Biennial Report to the Legislature 24
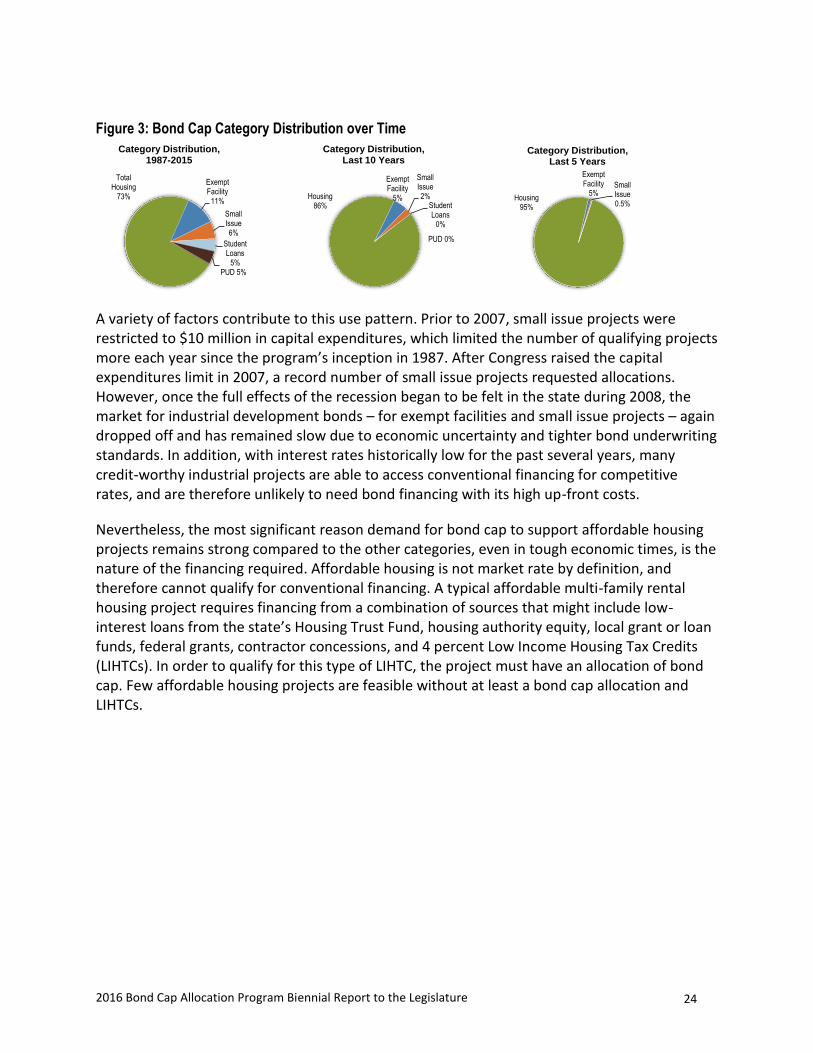
Figure 3: Bond Cap Category Distribution over Time
A variety of factors contribute to this use pattern. Prior to 2007, small issue projects were restricted to $10 million in capital expenditures, which limited the number of qualifying projects more each year since the program’s inception in 1987. After Congress raised the capital expenditures limit in 2007, a record number of small issue projects requested allocations. However, once the full effects of the recession began to be felt in the state during 2008, the market for industrial development bonds – for exempt facilities and small issue projects – again dropped off and has remained slow due to economic uncertainty and tighter bond underwriting standards. In addition, with interest rates historically low for the past several years, many credit-worthy industrial projects are able to access conventional financing for competitive rates, and are therefore unlikely to need bond financing with its high up-front costs.
Nevertheless, the most significant reason demand for bond cap to support affordable housing projects remains strong compared to the other categories, even in tough economic times, is the nature of the financing required. Affordable housing is not market rate by definition, and therefore cannot qualify for conventional financing. A typical affordable multi-family rental housing project requires financing from a combination of sources that might include low-interest loans from the state’s Housing Trust Fund, housing authority equity, local grant or loan funds, federal grants, contractor concessions, and 4 percent Low Income Housing Tax Credits (LIHTCs). In order to qualify for this type of LIHTC, the project must have an allocation of bond cap. Few affordable housing projects are feasible without at least a bond cap allocation and LIHTCs.
Total Housing
73%
Exempt Facility
11%
Small Issue 6%
Student Loans
5%PUD 5%
Category Distribution, 1987-2015
Housing 86%
Exempt Facility
5%
Small Issue 2%
Student Loans
0%
PUD 0%
Category Distribution, Last 10 Years
Housing 95%
Exempt Facility
5%Small Issue 0.5%
Category Distribution, Last 5 Years
2016 Bond Cap Allocation Program Biennial Report to the Legislature 25
Allocation Procedures and Criteria
Annual Bond Cap
State law and agency rule provide criteria with which to evaluate individual projects’ eligibility for bond cap allocations and to prioritize among eligible projects when there is competition for available cap, such as early in the year when the set-asides are in place, or during times of high demand, as happened in 2007 and early 2008.
Under the statute, the Bond Cap manager has 15 days once the program has received a completed application in which to review an application and approve or deny an allocation. The application review consists of confirming that the application form is filled out completely and that all the required documents plus the application fee are attached. State law also allows Commerce to request any additional information necessary to conduct a thorough review of the application. 10
In addition to ensuring all the required pieces are in place, the Bond Cap manager conducts an assessment of the public benefit of each project using criteria in statute and agency rule. Industrial development projects, which fall in the exempt facilities and small issue categories, are assessed for the number of jobs created and retained, the ratio of bond cap authority to jobs created and retained, the degree to which the project provides jobs to low-income residents, and the need for jobs in the community based on the local unemployment rate compared with state and national averages. Exempt facilities projects are also assessed for the degree to which the project reduces environmental pollution or diverts solid waste into value-added products, or the amount of energy the project will produce.
Housing applications are assessed for the number of affordable housing units constructed or rehabilitated, the ratio of bond cap authority to housing units, the income levels or special needs of the population served, and the need for additional affordable housing units in the local community.
In addition to category-specific criteria, applicants are asked to describe the project’s need to issue tax-exempt private activity bonds, and the cost and availability of alternative financing options. State law also states that readiness and likelihood to issue bonds prior to the issuance deadline are important criteria for all categories of applications.11
Once eligibility and priority are satisfactorily established, the Bond Cap manager approves the allocation and prepares an official allocation certificate and cover letter. The original documents, signed by a Commerce assistant director, are sent to the applicant, with copies to
10
RCW 39.86.140(2)(e) 11
RCW 39.86.140(6)(a)

2016 Bond Cap Allocation Program Biennial Report to the Legislature 26
the bond counsel. Once the bond is issued, the issuer provides Commerce with a Notification of Issuance form and the transaction is complete.
Figure 4: Important Dates in the Bond Cap Allocation Process

2016 Bond Cap Allocation Program Biennial Report to the Legislature 27
Figure 5: Bond Cap Allocation Flow Chart

2016 Bond Cap Allocation Program Biennial Report to the Legislature 28
Carryforward
“Carryforward” is the term used for allocations of bond cap authority that went unused during the calendar year, but are made available to be “carried forward” to be used in subsequent years. Under the IRS code, the state must allocate any carryforward amounts to specific issuers before December 31, or the bond cap authority is no longer available to be used. Carryforward allocations must be used within three calendar years. Under federal law, carryforward may only be allocated in the housing, student loan, and exempt facility categories. Carryforward must be allocated to a specific project or program, and once allocated, is not transferrable to another project or program. Allocating Carryforward to Programs Rather than Projects
Allocating carryforward to a specific project carries the risk that the cap will be lost if that project hits a snag and is unable to issue a bond within the time limit. Washington State has chosen to allocate nearly all carryforward on a program basis rather than allocating to individual projects in order to avoid the potential loss of cap. Most carryforward amounts in the state have been allocated to the Housing Finance Commission, not only because the commission is able to use carryforward on a program basis, but also because the Commission is a sub-allocating agency of Commerce, and therefore may reallocate housing cap to other issuers, such as local housing authorities. However, those reallocations must be within the same bond cap category for which the commission elected the carryforward. For example, carryforward allocated to the commission for multifamily rental housing may only be reallocated to other issuers of multifamily rental housing bonds.
In the past, the state’s student loan issuer used carryforward amounts several times. Carryforward was allocated in the exempt facilities category twice – in 1992 and 1994 – but hasn’t been since then because of the risks associated with allocating to specific projects.
Timelines for Allocating Carryforward
The Bond Cap manager keeps in close touch with issuers who have outstanding allocations to ensure that bonds are issued by the deadline or that allocations are reverted to Commerce to be allocated as carryforward. Final carryforward amounts are calculated after Commerce has received Notification of Issuance forms or reversion acknowledgements for all outstanding allocations, typically during the last two weeks of December each year.
Reducing Initial Allocations by Carryforward Amounts
Under state law, if an issuer has received a carryforward allocation, their initial allocation for the following year may be reduced by the amount of the carryforward received, and those

2016 Bond Cap Allocation Program Biennial Report to the Legislature 29
amounts moved into the remainder category.12 This allows additional flexibility in making allocations outside of the set-aside structure early in the year.
Several times in the history of the program, the Housing Finance Commission’s initial allocation has been reduced by carryforward amounts, facilitating local housing authorities and exempt facilities projects to get the cap they need without having to wait for the category set-asides to be released on September 1 (prior to 2010) or July 1 (since 2010).
Carryforward Trends
The percentage of the annual bond cap that is used during the year varies depending on market factors such as interest rates and economic growth, as well as changes in federal policy. In slow economic times, less cap tends to be used during the year, and more is carried forward into future years.
In 2007, demand for cap in all categories was at an all-time high, and more projects became eligible due to the change in federal law that allowed small issue projects to have $20 million in capital expenditures instead of $10 million. These factors combined to cause virtually all the annual cap to be used that year. However, since 2008, economic factors, including low interest rates on conventional financing, caused more cap to be carried forward than used during each allocation year. In 2014, only $6.6 million of the current year’s allocation was issued as bonds during the year, and only $8.2 million in 2015.
Figure 6: Current Year Allocations Issued and Carried Forward, 1987-2015
Although very little of the annual cap has been used during each allocation year since 2008, nearly $3.6 billion of bond activity has occurred in the housing category using carryforward cap.
12
RCW 39.86.120(2)

2016 Bond Cap Allocation Program Biennial Report to the Legislature 30
For the past three years, housing bond issuances using carryforward cap have averaged more than $762 million, more than the state’s annual total of bond cap authority.
Figure 7: Volume of Housing Bonds Using Carryforward, 2008-2015
In spite of the ongoing housing activity, a large amount of unused carryforward has accumulated with the Housing Finance Commission. With the allocation of the 2015 cap as carryforward, there will be nearly $1.205 billion in unused bond cap authority to begin 2016:
$242 from 2013, which expires at the end of 2016
$265 from 2014, which expires at the end of 2017
$698 from 2015, which expires at the end of 2018 Using Carryforward for Local Housing Authority Projects
Because of the large accumulation of carryforward, Commerce has arranged with the Housing Finance Commission to refer local housing authorities to the Commission to receive bond cap authority from carryforward, rather than using current year cap. This arrangement preserves as much cap authority as possible as far into the future as possible, benefitting all state issuers of tax-exempt private activity bonds.
Using the oldest carryforward first – before the current year cap as well as before any other carryforward amounts – allows each year’s carryforward to be added to the pool with an expiration date an additional year into the future. This avoids having to abandon any of the cap authority, and insures as much as possible against another situation like that of 2007, when there was not enough cap to meet the need.
In addition to preserving as much cap as possible, this arrangement allows the Commission to provide guarantees of cap to housing authorities that are applying for funding from the U.S.

2016 Bond Cap Allocation Program Biennial Report to the Legislature 31
Department of Housing and Urban Development (HUD). This federal agency requires a guaranteed reservation of cap for projects applying to some of its grant programs.
Commerce is unable to guarantee that cap will be available for a specific project on a specific date in a future year for two reasons. First, the amount of cap authority available in a given year cannot be calculated until after the IRS releases the multiplier, which it does in November, and the U.S. Census Bureau releases the new population estimates, which it does in late December for the following year. Commerce cannot allocate cap it does not yet have and for which it cannot yet calculate the amount.
Second, while a housing authority may need a cap reservation for its HUD application, it may not actually be planning to issue a bond using the cap reservation until two or three years in the future. Under state law, Commerce may not receive applications for bond cap for a specific year earlier than October 1 of the previous year. This statutory timeline does not allow Commerce to promise future year’s cap to a project.
Using carryforward allocated to the Commission for future cap reservations solves both the federal and the state timeline issues, and is a routine process that Commerce, the Commission, and the state’s local housing authorities have been using for many years.
2016 Bond Cap Allocation Program Biennial Report to the Legislature 32
Qualified Energy Conservation Bonds
Background
Qualified Energy Conservation Bonds (QECBs) were originally created by the Tax Extenders Act in October 2008, with a nationwide cap of $800 million. Then, in early 2009, the American Recovery and Reinvestment Act (ARRA) increased the QECB cap to $3.2 million nationwide, to be distributed to states, then to large municipalities (with populations greater than 100,000) within the states, by a formula based on population. Washington’s share of the QECB cap was $67.9 million, with most of the original allocations under the population formula originally allocated to 17 large cities and counties, a small amount to tribes in Washington, and the balance to the state itself.
QECBs may be issued for a variety of energy conservation purposes, such as energy retrofits of government facilities, research, and community education programs. Under the federal law, at least 70 percent of the state’s QECB allocation must be used for governmental purposes, and no more than 30 percent may be used for private activities. Unlike other economic stimulus bond authorities, QECBs do not have an issuance deadline in federal law.
QECBs were originally created to be tax-credit bonds; that is, QECB investors received a credit they could apply against their income tax liability. However, because few investors needed tax credits as investment income declined during the recession, the market for QECBs and other tax credit bonds was virtually non-existent. In addition, for many issuers the formula allocations were so small that they were not particularly useful.
Another ARRA economic stimulus bond authority, Build America Bonds (BABs), were very well received in the market. BABs were also tax-credit bonds, but unlike QECBs, the tax credits on BABs could be converted – at the discretion of the issuer – to a direct interest rate subsidy, payable to the issuer from the U.S. Treasury. With the direct subsidy option, the investor receives the full taxable interest rate, but the issuer’s net interest is significantly reduced by the subsidy. Virtually all BAB issuers elected the direct subsidy option.
In 2010, Congress converted all the economic stimulus tax-credit bonds, including QECBs, to direct subsidy bonds. After the “BABification” of the tax-credit bonds, they became more attractive to investors, and QECBs began to sell, although still slowly.
Allocating and Reallocating QECB Authority
Commerce established an application procedure for the state’s portion of the QECB cap, initially under the authority of a Governor’s Executive Order. In 2009, the procedure was adopted into WAC and into RCW in 2010. The procedure required jurisdictions with original formula allocations to report their intention to use or waive their allocations to the agency.

2016 Bond Cap Allocation Program Biennial Report to the Legislature 33
Early on, most local governments with allocations reported an intention to use their QECB allocations.
Eventually, however, between the unusably small allocations and the slow bond market, many issuers in Washington with original formula allocations decided that they did not have a use for their QECB authority after all, and chose to waive their allocations, returning them to the state for distribution to other issuers. To date, four bonds have been issued by originally awarded localities, and part or all of 13 original allocations have been waived and aggregated by the Housing Finance Commission. In addition, one county reallocated its QECB authority to a city within the county. Only two original allocations are still outstanding – Seattle’s and Skagit County’s.
Aggregating QECB Authority
In order to make the best use of QECB allocations for the state as a whole, small formula allocations, as well as portions of allocations left over after bond issuances, needed to be aggregated into amounts large enough to attract an investor. The Housing Finance Commission submitted a proposal to Commerce to aggregate QECB authority – both the state’s original allocation and other jurisdictions’ waived allocations – as part of the commission’s activities under its State Energy Trust.
As a result, when Commerce receives a waived QECB allocation, it reallocates it to the commission to be combined with other allocations. The QECB authority may then be used for the commission’s own bond issuances or reallocated to other jurisdictions with active projects that are ready to issue. To date, the commission has issued two private activity QECBs totaling $10.15 million and has reallocated aggregated authority to six additional local government projects.
Local governments with viable QECB projects make a request for a portion of the aggregated authority to the commission, which then reallocates the needed amount to Commerce for further reallocation to the local government. In the early stages of this collaboration, the commission anticipated using the QECB authority primarily for projects applying to the commission’s State Energy Trust. However, many of the projects that initially expressed interest in using the commission’s QECB authority have been slow to develop, have fallen through, or have ended up using other financing methods. In the meantime, several local governments developed creative energy conservation projects of their own using reallocated QECB authority.
QECB Projects
After getting off to a slow start in the bond market, QECBs have finally gained some traction. Among the U.S. states and territories, Washington State to date has used one of the highest percentages of its QECB authority. As of the most recent Energy Programs Consortium report
2016 Bond Cap Allocation Program Biennial Report to the Legislature 34
on nationwide QECB use, the average utilization rate is 37 percent.13 Washington’s rate, according to the report, is 64 percent. Nineteen states had not yet issued any QECBs at the time of the report. Eleven states have issued more than 64 percent of their QECB allocations. Since data was gathered for the report, three additional QECBs have been issued in Washington, bringing the state’s total use of QECB authority to more than $46.3 million, or 68 percent of the state’s total allocation. Of the $46.3 million issued thus far, 22 percent was used for private activities, and 78 percent for governmental activities.
The majority of QECBs have been issued for energy-efficiency measures in government facilities. In particular, upgrades to heating, ventilation, and air conditioning (HVAC) and conversion of streetlights from sodium or mercury vapor lamps to light-emitting diode (LED) lamps have characterized most of the conservation projects. LED lamps are smaller, lighter weight, last several times longer than vapor lamps, and use a fraction of the energy. Conversion to LEDs not only saves the issuer on energy costs, but it also saves on maintenance and replacement costs.
Federal law requires that when QECBs are used for energy upgrades in government buildings, the issuer must be able to document energy savings of at least 20 percent. To ensure the likelihood that planned upgrades will meet that standard, most issuers have worked with Energy Services Companies (ESCOs) that perform careful evaluations of the jurisdiction’s properties then make targeted recommendations. When a jurisdiction follows the recommendations, the ESCO is also able to guarantee the amount of energy savings. In many cases the ESCO is also able to guarantee that the energy cost savings will be equal to or greater than the jurisdiction’s debt service on the bond. The state Department of Enterprise Services’ Energy Savings Performance Contracting program certifies many of the ESCOs and assists state and local governments with contracting for energy services, including when planning a QECB issuance.14
The Housing Finance Commission reports having already received applications that could potentially use most of the approximately $14 million balance the commission has currently aggregated. However, some of those projects have been coming together slowly, and are not necessarily certain to use a QECB allocation. The commission, therefore, is still able to allocate from its balance to shovel-ready projects.
13
http://www.energyprograms.org/wp-content/uploads/2015/10/QECBchartsSept.pdf 14
http://www.des.wa.gov/services/facilities/Energy/ESPC/Pages/default.aspx

2016 Bond Cap Allocation Program Biennial Report to the Legislature 35
Table 1: Qualified Energy Conservation Bond Issuances
Date Issuer Amount Project Description
9/22/2010 Yakima County $2,430,000 Energy conservation upgrades for the county courthouse
11/9/2010 Thurston County $2,040,000 Energy conservation measures for several county buildings, including installation of geothermal and solar energy systems
12/1/2010 King County $5,825,000 New HVAC equipment in two county buildings; energy efficient boilers and other energy improvements for the courthouse and correctional facility
12/28/2010 Kitsap County $1,110,000 Energy efficiency upgrades for the county’s sewer system
4/27/2011 City of Bellingham $6,480,000 Energy efficiency upgrades in 20 city buildings
12/19/2012 King County $6,020,000 New HVAC equipment for the county correctional facility
12/19/2012 King County $6,020,000 New HVAC equipment for the county correctional facility
12/27/2012 WSHFC $9,000,000 McKinstry Swauk wind farm project
4/18/2013 City of Longview $3,560,000 Green Communities Program; energy improvements for city facilities, infrastructure, and vehicles
7/1/2013 City of Renton $3,200,000 Green Communities Program; streetlight LED conversion
7/30/2013 City of Centralia $1,100,000 Energy upgrades for city facilities; streetlight LED conversion; Borst Park lighting; new HVAC equipment in several city buildings
9/5/2013 Okanogan County $1,115,000
Energy upgrades for courthouse, jail, and juvenile services buildings; geothermal heat pump installation; new controls and systems to connect heat pump to buildings; replace courthouse windows
10/2/2013 City of Blaine $1,670,000 Green Communities Program; energy upgrades for city facilities, including energy efficient streetlights, HVAC, and lighting; energy upgrades for wastewater treatment plant
12/10/2013 Mason County $1,620,000 Energy improvements to the county jail utilities, roof, HVAC, and water systems
3/6/2014 WSHFC $1,150,000 Town & Country Markets Project; energy-efficient refrigeration equipment
Total QECBs Issued $46,320,000

2016 Bond Cap Allocation Program Biennial Report to the Legislature 36
Table 2: Status of Original QECB Allocations
Jurisdiction Original Allocation
Amount Status
Most Recent Status Change Date
City of Seattle $6,164,528.95 Unused
City of Bellevue $1,258,893.48 Reallocated to state 5/9/2012
King County $12,033,825.30 $11,845,000 issued, balance reallocated to state
6/13/2013
City of Tacoma $2,038,762.78 Reallocated to state 3/4/2013
Pierce County $6,111,713.25 Reallocated to state 5/17/2012
Snohomish County $7,092,460.64 Reallocated to state 7/1/2010
City of Spokane $2,084,980.40 Reallocated to state 8/28/2014
Spokane County $2,714,982.17 Reallocated to state 10/8/2013
Vancouver $1,674,789.88 Reallocated to state 12/22/2009
Clark County $2,731,529.22 Reallocated to state 5/29/2012
Thurston County $2,543,587.91 $2,040,000 issued, balance reallocated to state
11/9/2010
Kitsap County $2,487,442.05 $1,110,000 issued; balance reallocated to state
5/29/2012
Yakima County $2,433,443.68 $2,430,000 issued, balance reallocated to state
7/7/2015
Whatcom County $2,038,856.15 Reallocated to City of Bellingham 1/1/2011
Benton County $1,691,617.04 Reallocated to state 7/16/2013
Skagit County $1,224,170.61 Unused
Cowlitz County $1,050,442.12 Reallocated to state 1/21/2010
Tribes $710,081.20 Reallocated to state 7/11/2012
State $9,857,893.17 Reallocated to WSHFC 10/09/2013
Total $67,944,000.00

2016 Bond Cap Allocation Program Biennial Report to the Legislature 37
2014-2015 Program Activity Summaries
During 2014 and 2015, nearly all bond cap activity took place using previous years’ carryforward allocations. All projects were in the housing category but three:
The Housing Finance Commission issued a $200,000 small issue beginning farmer/rancher bond during 2014
The Washington Economic Development Finance Authority (WEDFA) issued a $6.4 million small issue manufacturing bond to finance expansion of and equipment for a box manufacturing facility in Spokane during 2014.
The Pierce County Economic Development Corporation issued an $8.2 million small issue manufacturing bond for new equipment at a fish processing facility in Puyallup during 2015.
Thus, nearly all – 99 percent – of the state’s tax-exempt private activity bond volume cap for the past two years was carried forward for use in future years.
2014 Bond Cap Issuances
In addition to the two small issue bonds, 4,460 affordable multifamily rental housing projects issued bonds totaling $320.6 million, and the Housing Finance Commission issued $74.3 million in mortgage revenue bonds and $480.0 million in Mortgage Credit Certificates (MCCs) during 2014. All of the housing bonds and MCCs were issued from carryforward. During the year, all remaining 2011 carryforward was used, so no carryforward amounts expired or were abandoned.
Table 3: 2014 Bond Cap Projects
Date Issuer Project Amount Allocation Source15
1/28 WSHFC16 Single family homeownership assistance statewide
$36,700,000 2011 CF
2/3 WSHFC Rehab 119 multifamily rental units at Lynnwood Beaver Creek
$6,700,000 2011 CF
2/12 Vancouver HA17 Build 152 new multifamily rental units at 1st Street Apartments
$16,000,000 2011 CF
2/29 WSHFC Mortgage Credit Certificates $240,000,000 2011/2012 CF
3/14 WSHFC Rehab 379 multifamily rental units at Lake $28,000,000 2011 CF
15
Under Allocation Source, “Current” means issued from the current year’s annual allocation during the calendar year; “CF” means issued from a previous year’s carryforward allocation. 16
WSHFC: Washington State Housing Finance Commission 17
HA: Housing Authority

2016 Bond Cap Allocation Program Biennial Report to the Legislature 38
Date Issuer Project Amount Allocation Source15
Washington II
4/3 WSHFC Build 197 new multifamily rental units at Vintage at Lakewood
$20,200,000 2011 CF
4/15 WEDFA18 Acquire and install new equipment in box manufacturing facility in Spokane
$6,400,000 Current
4/21 WSHFC Land, equipment, livestock, and other farming/ranching needs for new farmers or ranchers statewide
$200,000 Current
5/2 Bellingham HA Rehab 469 multifamily rental units at NW Corner Affordable Housing
$32,300,000 2011 CF
5/5 WSHFC Build 141 new multifamily rental units at Olympia Vista Apartments
$10,500,000 2011 CF
5/16 WSHFC Build 96 new multifamily rental units at Hirabayashi Place
$15,250,000 2011 CF
5/23 WSHFC Build 47 new multifamily rental units at Monroe Family Village
$6,800,000 2011 CF
5/29 Seattle HA Build 83 new multifamily rental units at 820 Yesler Way
$15,000,000 2011 CF
6/4 WSHFC Build 26 new multifamily rental units at Bayview Greens
$3,068,000 2011 CF
6/10 WSHFC Build 189 new multifamily rental units at Celebration Senior Living
$22,400,000 2011/2012 CF
6/13 Walla Walla HA Rehab 43 multifamily rental units at Lariat Housing
$5,000,000 2012 CF
7/2 WSHFC Build 120 new multifamily rental units at 15 West
$12,850,000 2012 CF
7/14 Pasco/Franklin Co HA
Build 38 new multifamily rental units at Fourth and Pearl Family Housing
$4,725,000 2012 CF
7/30 WSHFC Build 219 new multifamily rental units at Reserve at Renton
$24,000,000 2012 CF
8/5 Seattle HA Rehab 50 multifamily rental units at Parker Apartments
$6,665,000 2012 CF
9/5 WSHFC Rehab 40 multifamily rental units at Town Square
$3,600,000 2012 CF
9/11 WSHFC Build 300 new multifamily rental units at $44,000,000 2012 CF
18
WEDFA: Washington Economic Development Finance Authority

2016 Bond Cap Allocation Program Biennial Report to the Legislature 39
Date Issuer Project Amount Allocation Source15
High Point 320
9/12 WSHFC Build 216 new multifamily rental units at Kitts Corner
$27,500,000 2012 CF
9/29 Everett HA Rehab 299 multifamily rental units at Bakerview/Grandview
$31,750,000 2012 CF
9/30 Everett HA Rehab 159 multifamily rental units at Everett Affordable Housing Portfolio
$15,400,000 2012 CF
9/30 Capitol Hill Housing Improvement Project
Rehab 30 multifamily rental units at Haines Apartments
$3,650,000 2012 CF
10/15 WSHFC Build 280 new multifamily rental units at AXIS Apartments
$41,500,000 2012 CF
10/23 WSHFC Build 261 new multifamily rental units at Grandview Apartments
$42,000,000 2012 CF
10/28 WSHFC Build 120 new multifamily rental units at Summit Ridge
$11,600,000 2012 CF
11/20 WSHFC Mortgage Credit Certificates $240,000,000 2012/2013 CF
11/25 WSHFC Build 200 new multifamily rental units at Polaris at Covington
$24,800,000 2012 CF
12/1 WSHFC Rehab 125 multifamily rental units at Reliant Market Street
$12,000,000 2012 CF
12/18 WSHFC Single family homeownership assistance statewide
$37,626,494 2013 CF
12/23 WSHFC Rehab 62 multifamily rental units at The Douglas
$9,000,000 2012 CF
Total bond cap used $1,057,184,494
2015 Bond Cap Issuances
During 2015, in addition to one small issue project, local housing authorities issued 5 affordable multifamily rental housing bonds using 2012 and 2013 carryforward allocations, and the Housing Finance Commission issued 11 multifamily rental housing bonds from 2012 and 2013 carryforward. In addition, the commission used $480 million for Mortgage Credit Certificates and $40 million for Single Family homeownership bonds from 2013 and 2014 carryforward. During the year, all remaining 2012 carryforward was used for bond issuances, so no carryforward amounts expired unused.

2016 Bond Cap Allocation Program Biennial Report to the Legislature 40
Table 4: 2015 Bond Cap Projects
Date Issuer Project Amount Allocation Source19
1/28 WSHFC20 Copper Lane Apartments $19,000,000 2012 CF
3/2 WSHFC Scriber Creek Apartments $44,400,000 2012 CF
3/5/15 WSHFC Reserve at SeaTac $33,000,000 2012 CF
4/9 King County HA21 Ashwood Community Redevelopment $5,500,000 2012 CF
5/5 WSHFC The Winthrop $28,000,000 2012 CF
6/3 WSHFC Mortgage Credit Certificates $240,000,000 2013/2014 CF
7/9 WSHFC Marion Court Preservation $13,200,000 2012 CF
7/17 Pierce County EDC Shining Ocean Seafoods $8,200,000 Current
8/31 Seattle HA Jackson Workforce Apartments $9,775,000 2012 CF
9/10 WSHFC CAC 515 Preservation Association $6,450,000 2012 CF
9/10 Vancouver HA Skyline Crest LLLP $17,000,000 2012 CF
9/11 WSHFC City Center Apartments, Lynnwood $43,150,000 2012 CF
9/24 WSHFC Mortgage Credit Certificates $240,000,000 2014 CF
9/30 Spokane HA Cedar Haven LLLP $11,500,000 2012/2013 CF
9/30 WSHFC South Hill by Vintage LLC $25,000,000 2013 CF
10/2 WSHFC Mountlake Senior Living Association LP $13,209,000 2013 CF
10/8 WSHFC BOH Portfolio Preservation Assoc LLLP $13,000,000 2013 CF
11/16 WSHFC REACH Isabella Court LLC $7,000,000 2013 CF
11/18 WSHFC Farmer/Rancher Program $215,000 Current
12/10 WSHFC Single Family Program Bonds $25,000,026 2014 CF
12/21 Seattle HA Hoa Mai Gardens $25,300,000 2013 CF
Total bond cap used $827,899,026
19
Under Allocation Source, “Current” means issued from the current year’s annual allocation during the calendar year; “CF” means issued from a previous year’s carryforward allocation. 20
WSHFC: Washington State Housing Finance Commission 21
HA: Housing Authority

2016 Bond Cap Allocation Program Biennial Report to the Legislature 41
Public Benefits of Bond Cap
Tax-exempt private activity bond issuances must, by definition, be used for projects with measurable public benefits. State law and agency rules provide Commerce with guidance for evaluating the public benefit of projects applying for cap, and for prioritizing projects in the event that demand for cap exceeds the cap available.
Affordable Housing Units Created or Rehabilitated
In the case of housing projects, the primary public benefit criteria in statute include:
Amount of housing to be made available.
Population within the jurisdiction.
Need for a particular type of affordable housing in the community.
Coordination with other applicable federal and state housing programs.
Likelihood of implementing the financing during that calendar year.
Consistency with the plan of the Housing Finance Commission. Particularly important is the fact that a bond cap issuance is needed to qualify for federal 4 percent Low Income Housing Tax Credits (LIHTCs). To qualify for these tax credits, 50 percent of the project’s financing must come from the tax-exempt bond cap issuance. During 2014 and 2015, a total of 7,093 units of affordable multifamily rental housing were created or rehabilitated with tax-exempt private activity bonds (bond cap) as part of the financing package.
Table 5: Affordable Multifamily Rental Housing Units Created or Rehabilitated, 2014- 2015
HFC/LHA Housing Units Bond Cap Used Bond Cap/Unit
Housing Finance Commission 5,217 $611,117,000 $117,140
Local Housing Authorities 1,876 $199,565,000 $106,377
Totals 7,093 $810,682,000 $114,293
Job Creation and Retention
Small issue public benefit criteria include the number and type of new and retained jobs, the level of unemployment in the project community, creation of skilled or semi-skilled jobs, the economic status of the community in which the project is being created, and the ratio of the dollars allocated per job. Until June 1 every year, portions of the small issue cap are set aside for Eastern distressed, Western distressed, and Eastern non-distressed areas of the state.

2016 Bond Cap Allocation Program Biennial Report to the Legislature 42
In addition to economic development criteria similar to those for small issue, exempt facilities projects are evaluated on the degree to which the project reduces environmental pollution, diverts solid waste from disposal and manufactures it into value-added products, produces lower cost energy, and environmentally benefits the community.
Both small issue and exempt facilities bond cap applicants are required to work with the state Employment Security Department to ensure that new jobs are advertised and offered to low income Washington residents whenever possible.
During 2014 and 2015, bond cap activity in the small issue and exempt facilities categories was low. After a burst of activity in 2007, the number of small issue and exempt facilities bonds has stayed low, in spite of other signs of recovery in the economy in general. Based on activity over the past five years, it appears that the low level of activity may be due as much to record low interest rates on conventional loans as it is to the nation’s slow recovery from the recession.
Table 6: Small Issue and Exempt Facilities Projects, 2007-2015
Farmer/Rancher22 Small Issue Manufacturing Exempt Facilities
Year Number Par Value Number Par Value Number Par Value
2007 10 $59,856,000 5 $103,200,000
2008 6 $1,168,800 5 $16,240,000 3 $45,000,000
2009 7 $1,543,603 1 $1,928,000 2 $54,685,000
2010 7 $1,691,000 1 $5,200,000 1 $20,980,000
2011 2 $459,500 0 $0 0 $0
2012 1 $150,000 0 $0 0 $0
2013 0 $0 0 $0 1 $26,500,000
2014 1 $200,000 1 $6,400,000 0 $0
2015 1 $215,000 1 $8,200,000 0 $0
Totals 25 $5,427,903 19 $97,824,000 12 $250,365,000
Low use of the bond cap limited job development contributions of both the exempt facilities and the small issue categories during 2014 and 2015. No exempt facilities had job impacts during that period. However, a total of 285 manufacturing jobs were created or retained by small issue manufacturing projects. Additional new agricultural jobs were created by first-time farmer/rancher “aggie” bond issuances.
22
The Beginning Farmer/Rancher Program began issuing bonds in 2008.
2016 Bond Cap Allocation Program Biennial Report to the Legislature 43
Estimated Job Creation Impacts of Affordable Multifamily Rental Housing
Affordable housing development serves several functions in communities. Not only does it provide the public benefits of creating and maintaining rental housing and assisting low income homebuyers, but it also provides job creation benefits in the construction, property management, and social services industries.
The U.S. Bureau of Economic Analysis and the National Association of Home Builders (NAHB) have studied the issue and have published data on the estimated job benefits of housing construction. According to the NAHB report, construction of 100 new multifamily rental housing units creates approximately 161 jobs during construction and 44 jobs on an ongoing annual basis due to increased economic activity in the local area. For residential remodeling (rehabilitation in this context), NAHB estimates that 11.5 jobs are created for each $1 million in project costs. The study assumes that remodeling only creates construction jobs during year one, and has no ongoing annual job creation impacts.23
NAHB data shows that the estimated one-year impacts (i.e., during the first year after construction begins) of building 100 new rental apartments in a typical local area include:
$11.7 million in local income
$2.2 million in taxes and other revenue for local governments
161 local jobs24 According to the NAHB research, one-year community impacts of each $1 million spent on residential remodeling (“rehabilitation” in this context) include:
$841,000 in local income
$71,000 in taxes and other revenue for local governments
11.5 local jobs25
23
National Association of Home Builders (NAHB); The Economic Impact of Home Building in a Typical Local Area – Income, Jobs, and Taxes Generated; April 2015; https://www.nahb.org/~/media/Sites/NAHB/Economic%20studies/1-REPORT_local_20150318115955.ashx?la=en 24
NAHB, page 2 25
NAHB, page 3

2016 Bond Cap Allocation Program Biennial Report to the Legislature 44
Table 7: Estimated Year One Job Creation Impacts of Construction and Rehabilitation of Affordable Multifamily Housing, 2014-2015
HFC/LHA New or Rehab
Units Bond Cap Used
Estimated Total Project
Costs26
Estimated Jobs in First
Year27
Bond Cap/First Year Job
Housing Finance Commission
New 3,901 $491,227,000 6,281 $78,208
Local Housing Authorities
New 452 $70,800,000 728 $97,253
Housing Finance Commission
Rehab 1,316 $119,950,000 $239,900,000 2,759 $43,475
Local Housing Authorities
Rehab 1,424 $128,765,000 $257,530,000 2,961 $43,487
Totals 7,093 $810,742,000 $1,485,884,000 12,729 $63,693
In addition to one-year impacts, construction of every 100 multifamily rental housing units provides recurring community impacts, including:
$2.6 million in local income
$503,000 in taxes and other revenue for local governments
44 local jobs28
Table 8: Estimated Ongoing Annual Job Creation Impacts of Construction of New Affordable Multifamily Housing, 2012-2013
HFC/LHA Units Bond Cap Used Estimated Ongoing Jobs29
Bond Cap/ Ongoing Job
Housing Finance Commission 3,901 $611,117,000 1,716 $356,128
Local Housing Authorities 452 $70,800,000 199 $355,779
Totals 4,353 $681,917,000 1,915 $356,092
26
Total rehabilitation project costs and jobs are estimates. At least 50 percent of total costs must come from a bond cap allocation in order for the project to qualify for 4 percent Low Income Housing Tax Credits. For this illustration, we have assumed that bond cap constitutes 50 percent of total project costs, but the actual percentage varies from project to project. Final costs will be available three years after the allocation of tax credits, when the developers file their final cost certifications with the Housing Finance Commission’s Tax Credit Division. 27
For new construction, estimated first year jobs = each 100 units x 161. For rehab, estimated first year jobs = each $1 million in project costs x 11.5. 28
NAHB, page 3 29
Estimated ongoing jobs = each 100 units x 44

2016 Bond Cap Allocation Program Biennial Report to the Legislature 45
Job Creation Data Notes
Housing job estimates are based on national rather than local averages, as well as estimated construction costs. On the other hand, jobs created and retained by exempt facility and small issue bond cap projects represent actual jobs created or retained in specific Washington businesses, as indicated on the projects’ applications for bond cap authority.
Bond cap per job created by new construction does not represent actual project costs per job created because there are always additional funding sources that go into each project. The ratio of bond cap used to total project costs varies from project to project.

2016 Bond Cap Allocation Program Biennial Report to the Legislature 46
Long-Term Bond Cap Data and Trends
Total Annual Bond Cap
The total volume of tax-exempt private activity bonds allowable under the bond cap is equal to a state’s population multiplied by a specified number of dollars. The current dollar multiplier is $100. That amount has been in place since 2014, and will continue to be in place during 2016. Because both the state’s population and the multiplier tend to increase over time, so does the total amount of bond cap authority each year.
The official population estimates used to calculate the bond cap are released each year in late December by the U.S. Census Bureau. Since Congress established the tax-exempt private activity bond ceiling in the mid-1980s, the population of Washington state has increased by 61 percent. With the population increase and the adjustment of the per capita rate for inflation, the total cap available has more than doubled during the program’s history.
Because it was the first full year after both the federal regulations and the Washington State bond cap statutes were adopted, 1987 was very different from subsequent years. The per capita multiplier was $75 for the program’s first year, in accordance with the federal Tax Reform Act. Beginning in 1988, the per capita rate was established at $50, where it remained through 2000. In 2001, cost-of-living increases in the per capita rate began. The rate has historically been adjusted approximately every two to three years since then. Each year in November, the IRS publishes the multiplier for the following year.30
Use of the cap among the categories – as well as the percentage of the cap used annually – has also varied over the years. For example, in the program’s first year, the housing category was initially allocated only 5 percent of the cap under state law, compared with today’s 32 percent initial allocation. In 2000, the category divisions were adjusted closer to the current configuration. The most recent update of the category structure was adopted into statute in 2010, after the Public Utility District (PUD) special allocation for hydroelectric facilities was used up.
30
Internal Revenue Bulletins; https://apps.irs.gov/app/picklist/list/internalRevenueBulletins.html
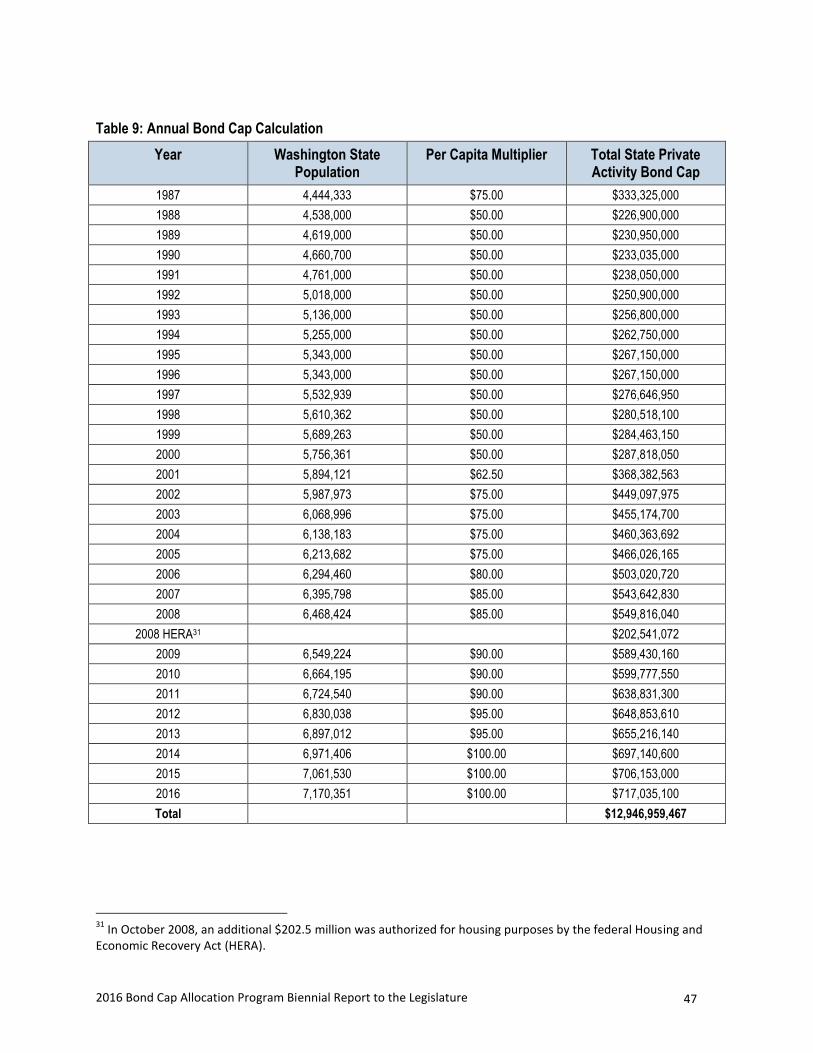
2016 Bond Cap Allocation Program Biennial Report to the Legislature 47
Table 9: Annual Bond Cap Calculation
Year Washington State Population
Per Capita Multiplier Total State Private Activity Bond Cap
1987 4,444,333 $75.00 $333,325,000
1988 4,538,000 $50.00 $226,900,000
1989 4,619,000 $50.00 $230,950,000
1990 4,660,700 $50.00 $233,035,000
1991 4,761,000 $50.00 $238,050,000
1992 5,018,000 $50.00 $250,900,000
1993 5,136,000 $50.00 $256,800,000
1994 5,255,000 $50.00 $262,750,000
1995 5,343,000 $50.00 $267,150,000
1996 5,343,000 $50.00 $267,150,000
1997 5,532,939 $50.00 $276,646,950
1998 5,610,362 $50.00 $280,518,100
1999 5,689,263 $50.00 $284,463,150
2000 5,756,361 $50.00 $287,818,050
2001 5,894,121 $62.50 $368,382,563
2002 5,987,973 $75.00 $449,097,975
2003 6,068,996 $75.00 $455,174,700
2004 6,138,183 $75.00 $460,363,692
2005 6,213,682 $75.00 $466,026,165
2006 6,294,460 $80.00 $503,020,720
2007 6,395,798 $85.00 $543,642,830
2008 6,468,424 $85.00 $549,816,040
2008 HERA31 $202,541,072
2009 6,549,224 $90.00 $589,430,160
2010 6,664,195 $90.00 $599,777,550
2011 6,724,540 $90.00 $638,831,300
2012 6,830,038 $95.00 $648,853,610
2013 6,897,012 $95.00 $655,216,140
2014 6,971,406 $100.00 $697,140,600
2015 7,061,530 $100.00 $706,153,000
2016 7,170,351 $100.00 $717,035,100
Total $12,946,959,467
31
In October 2008, an additional $202.5 million was authorized for housing purposes by the federal Housing and Economic Recovery Act (HERA).

2016 Bond Cap Allocation Program Biennial Report to the Legislature 48
Overall Bond Cap Use Trends, 2007-2015
According to the most recent Council of Development Finance Agencies’ analysis of bond cap trends, nationwide bond cap issuances, which had been trending downward since 2008, finally began to trend upward in 2014.32 The 2007 nationwide pre-recession high usage rate was 100 percent of current-year cap and 58 percent of the total available capacity.33 That year, Washington used 99.4 percent of current-year cap and 91.7 percent of accumulated carryforward, issuing $782.7 million in bonds, or 96.9 percent of that year’s $807.9 million available capacity.34
Nationwide, bond cap issuances in 2013 were at their lowest point following the recession, but in Washington they had already started an upward trend. The year with the state’s lowest total value of issuances was 2008 with $245.0 million, but 2012 was the lowest in percent of available capacity used at 19.5 percent. That year only 0.02 percent of current year cap was used during the year; all 2012 bond cap except $150,000 was carried forward.
In 2014, an all-time high of $1.057 billion in bond cap authority was used, either for bond issuances or for tax credits in the form of mortgage credit certificates – higher even than in 2007. That represented only 44.4 percent of the $2.384 billion in available capacity due to the large carryforward accumulations. Nevertheless, with the large amount of bond cap activity during 2014, 2015 was the first year since 2009 that started with a smaller balance of accumulated carryforward than the previous year. Even so, 2015’s carryforward balance at the beginning of the year totaled $1.326 billion, which, when added to the $706.1 million in 2015 current year cap, resulted in $2.033 billion in available capacity at the beginning of the year.
In 2015, bond cap activity was slightly less than in the previous year: $827.9 million in bond cap authority was used, 40.7 percent of the total available. Of the total used, 98.9 percent was used for housing programs and projects. As has been true for the past several years, 2016 will start with a large amount of bond cap authority available, including $1.205 billion in carryforward and $717.0 million in 2016 current year cap, for a total of $1.922 billion in usable cap.
32
Council of Development Finance Agencies; CDFA Annual Volume Cap Report; An Analysis of 2014 Private Activity Bond & Volume Cap Trends; July 2015; https://www.cdfa.net/cdfa/cdfaweb.nsf/ordredirect.html?open&id=201507-2014VolumeCapReport.html 33
“Available capacity” equals the current year’s annual allocation plus any unused carryforward from previous years. 34
The 2008 current year data and 2009 carryforward data include additional housing cap authorized by the October 2008 Housing and Economic Recovery Act (HERA). Of the HERA cap, Washington’s share was $202.5 million. By the end of 2009, all the state’s HERA cap allocations had been used up.

2016 Bond Cap Allocation Program Biennial Report to the Legislature 49
Figure 8: Percent of Total Capacity Used, 2007-2015
Figure 9: Total Volume Issued, 2007-2015
Category Distribution
A trend toward more bond cap going to housing projects in the years since the Great Recession has skewed the ratio of initial allocations to actual usage for all the categories. Although every category has had individual years in which more cap was used than the initial allocation, in the history of the program, all the categories except housing have gone underused compared with the initial allocation percentages in statute.
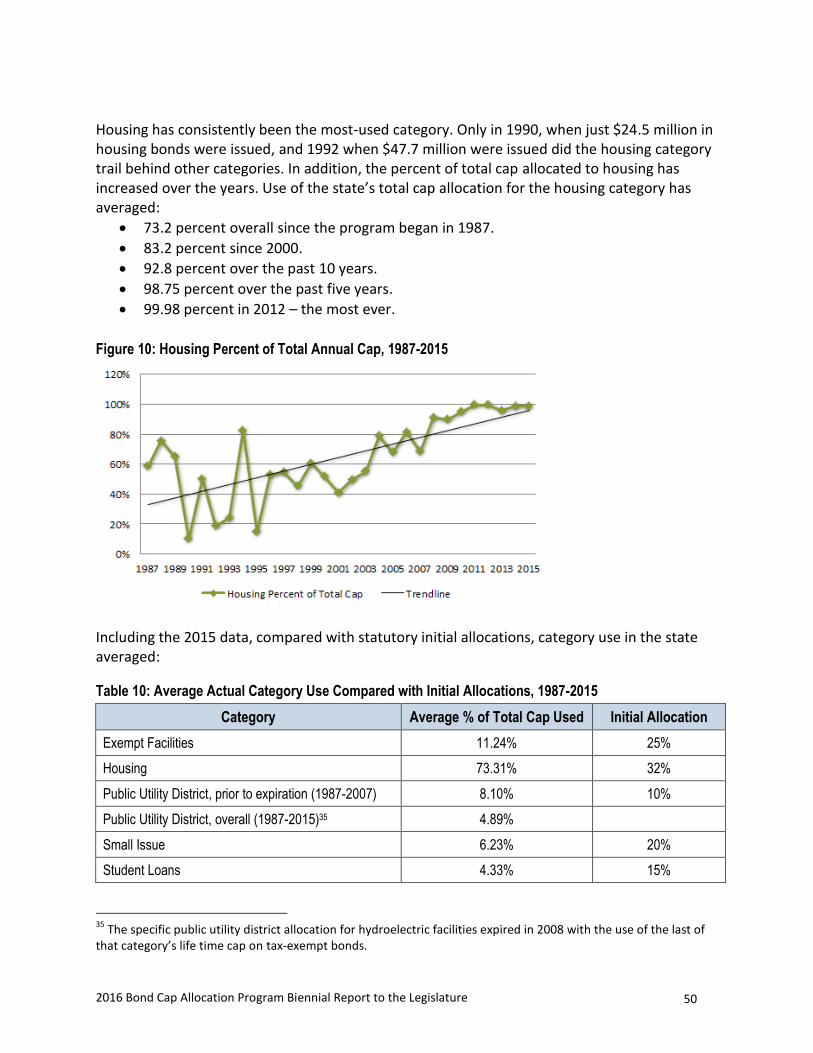
2016 Bond Cap Allocation Program Biennial Report to the Legislature 50
Housing has consistently been the most-used category. Only in 1990, when just $24.5 million in housing bonds were issued, and 1992 when $47.7 million were issued did the housing category trail behind other categories. In addition, the percent of total cap allocated to housing has increased over the years. Use of the state’s total cap allocation for the housing category has averaged:
73.2 percent overall since the program began in 1987.
83.2 percent since 2000.
92.8 percent over the past 10 years.
98.75 percent over the past five years.
99.98 percent in 2012 – the most ever.
Figure 10: Housing Percent of Total Annual Cap, 1987-2015
Including the 2015 data, compared with statutory initial allocations, category use in the state averaged:
Table 10: Average Actual Category Use Compared with Initial Allocations, 1987-2015
Category Average % of Total Cap Used Initial Allocation
Exempt Facilities 11.24% 25%
Housing 73.31% 32%
Public Utility District, prior to expiration (1987-2007) 8.10% 10%
Public Utility District, overall (1987-2015)35 4.89%
Small Issue 6.23% 20%
Student Loans 4.33% 15%
35
The specific public utility district allocation for hydroelectric facilities expired in 2008 with the use of the last of that category’s life time cap on tax-exempt bonds.

2016 Bond Cap Allocation Program Biennial Report to the Legislature 51
Housing aside, exempt facilities and the PUD category prior to its expiration have come the closest to using their initial allocations, with exempt facilities averaging approximately one-half its initial allocation and PUDs averaging 81 percent of their initial allocation.
The student loan category has not always had an authorized issuer, and between 1988 and 1997 then again since 2004, student loans had no issuances at all. The category has nevertheless averaged 4.3 percent of the total cap, about one-third of its 15 percent initial allocation percentage. Prior to the loss of the state’s original student loan issuer in 2004, the category hadaveraged 18.8 percent, 25 percent more than its 15 percent initial allocation. During the 2007 legislative session, the Washington Higher Education Facilities Authority was appointed as the new student loan bond issuer, but federal student loan changes have altered the viability of the student loan category and have thus far prevented an issuance of student loan bonds in the state since the beginning of the recession.
Only in 1990 and 1996 did the small issue category exceed its 25 percent initial allocation. Overall, small issue has used only 6.2 percent of the total cap, approximately one-third of the category’s initial allocation. An increase in the capital expenditures allowance for small issue projects from $10 million to $20 million over six years, which made more projects eligible for allocations, caused a surge in small issue bonds in 2007 before the recession again reduced the demand. Despite its increase, the capital expenditures limit along with the $10 million bond size restriction reduce the number of manufacturing projects that can take advantage of bond cap financing. In addition to the 2007 capital expenditures increase, in 2009 the American Recovery and Reinvestment Act (ARRA) temporarily added intangible properties – items such as computer software – to the definition of manufacturing for the purpose of small issue bonds for two years, but even that did not increase the use of small issue bond authority post-recession.
Table 11: Bond Cap Category Allocations, 1987-2015
Year Housing Small Issue Exempt Facility Student Loans PUD36 Annual Total
1987 $195,755,000 $34,100,000 $0 $50,000,000 $53,470,000 $333,325,000
1988 $172,000,000 $31,900,000 $0 $0 $23,000,000 $226,900,000
1989 $150,200,000 $68,800,000 $0 $0 $12,000,000 $231,000,000
1990 $24,465,000 $60,350,000 $79,875,000 $0 $68,345,000 $233,035,000
1991 $120,045,000 $15,660,000 $77,910,000 $0 $24,435,000 $238,050,000
1992 $47,725,000 $14,350,000 $138,455,000 $0 $50,370,000 $250,900,000
1993 $62,965,000 $1,800,000 $149,355,000 $0 $42,680,000 $256,800,000
1994 $217,325,000 $15,125,000 $30,300,000 $0 $0 $262,750,000
1995 $40,061,000 $44,680,000 $182,409,000 $0 $0 $267,150,000
36
The PUD category, which was specific to certain kinds of environmental enhancements of hydroelectric facilities, had a lifetime limitation in federal law. Washington’s lifetime limitation was $750 million. The state’s hydroelectric facilities used the last of that lifetime cap in 2007, so beginning in 2008, that category no longer exists in the state. PUD hydroelectric bonds include $107.1 million issued in 1986; that issuance is not reflected in the above table because it occurred prior to the 1987 adoption of the balance of the bond cap category structure.

2016 Bond Cap Allocation Program Biennial Report to the Legislature 52
Year Housing Small Issue Exempt Facility Student Loans PUD36 Annual Total
1996 $140,483,000 $76,852,000 $21,600,000 $0 $26,715,000 $265,650,000
1997 $151,602,000 $58,385,000 $19,000,000 $0 $47,660,000 $276,647,000
1998 $127,682,000 $64,786,000 $0 $60,000,000 $28,050,000 $280,518,000
1999 $173,368,000 $28,100,000 $50,850,000 $0 $32,145,000 $284,463,000
2000 $149,034,000 $39,425,000 $49,359,000 $50,000,000 $0 $287,818,000
2001 $151,252,563 $22,195,000 $60,915,000 $68,400,000 $65,620,000 $368,382,563
2002 $201,347,975 $17,520,000 $77,475,000 $107,850,000 $0 $404,192,975
2003 $251,609,700 $16,820,000 $46,365,000 $123,700,000 $16,680,000 $455,174,700
2004 $387,739,400 $3,191,141 $30,935,000 $68,650,000 $0 $490,515,541
2005 $338,374,187 $14,400,000 $44,850,000 $0 $98,678,853 $496,303,040
2006 $410,445,720 $28,290,000 $64,285,000 $0 $0 $503,020,720
2007 $372,581,129 $59,719,365 $103,200,000 $0 $8,142,336 $543,642,830
200837
$688,948,312 $18,408,800 $45,000,000 $0 $752,357,112
200938 $518,021,631 $3,472,203 $54,685,000 $0 $576,178,834
201039
$549,635,224 $6,891,000 $34,231,326 $0 $590,757,550
2011 $638,371,800 $459,500 $0 $0 $638,831,300
2012 $648,703,610 $150,000 $0 $0 $648,853,610
2013 $628,716,140 $0 $26,500,000 $0 $655,216,140
2014 $690,540,600 $6,600,000 $0 $0 $697,140,600
2015 $697,738,000 $8,400,000 $0 $0 $706,153,000
Totals $8,959,987,317 $760,830,009 $1,374,303,000 $528,600,000 $597,991,189 $12,221,711,515
Percent 73.31% 6.23% 11.24% 4.33% 4.89% 100.00%
37
Housing totals from 2008 include an additional $202,541,072 in cap authorized by the Housing and Economic Recovery Act of 2008 (HERA). 38
The actual total of 2009 total bond cap was $589,430,160.An IRS rule change in December 2010 caused two 2009 local housing authority draw-down bonds to revert a portion of their 2009 cap that was originally recorded as having been issued in 2009. The portion of those bonds that had not yet been drawn down by the end of 2009 is reflected in this table as $13,251,326 in abandoned 2009 cap. The same amount in 2010 carryforward was allocated to those projects to cover the shortfall in cap authority. 39
The actual total of 2010 bond cap was $599,777,550. An Exempt Facilities allocation late in 2010 reverted $9,020,000 after the carryforward amounts were allocated; the reverted amount was abandoned.

2016 Bond Cap Allocation Program Biennial Report to the Legislature 53
Unused Bond Cap
Over the past 22 years, Washington State has almost always succeeded in using its entire cap allocation, whether issued during the year or as carryforward within three years of allocation. Only very small amounts of cap have ever been lost, and no cap has been lost through expiration since the state began allocating all carryforward on a program basis, primarily to the Housing Finance Commission.
The Commission has thus far expressed the intention to continue to absorb whatever carryforward becomes available. In spite of the current high rate of carryforward use – $1.051 million in 2014 and $827.9 million in 2015, because the annual cap has barely been used during the year, it could be another year or more before carryforward totals go down to their pre-recession average. With the 2015 carryforward allocation of approximately $697.7 million, the Commission will begin 2016 with $1.205 billion in accumulated carryforward, all of which must be used within three years after the year in which it was allocated. While this is less than 2014’s high of $1.7 billion in accumulated carryforward, it still represents a huge amount of cap going unused each year. See page 29 for more details on carryforward history and use.

2016 Bond Cap Allocation Program Biennial Report to the Legislature 54
2016 Initial Allocations
For 2016, the IRS left the bond cap multiplier at the $100 per capital level it has been since 2014. According to official U.S. Census Bureau population estimates, Washington’s population increased by 1.5 percent to 7,170,351 between 2015 and 2016, increasing the total cap available to the state to $717,035,100. The category percentages used to divide the 2016 cap are set out in RCW 39.86.120.
Table 12: 2016 Bond Cap Initial Allocations: 7,170,351 (population) x $100 per capita = $717,035,100 total bond cap
Category Percentage Allocation
(per RCW 39.86.120)40
Initial Allocations
Exempt Facility 20.0% $141,230,600
Housing – Housing Finance Commission41 26.5% $180,775,168
Housing – Local Housing Authorities 6.4% $45,193,792
Small Issue 25.0% $176,538,250
Student Loans 15.0% $105,922,950
Remainder 8% $56,492,240
Total 100% $717,035,100
40
RCW 39.86.120 allows Commerce to reduce the initial allocation of a category by an amount equal to the amount of carryforward that category received from the previous year. When a category’s initial allocation is reduced because of a carryforward allocation, the initial allocation is moved into the remainder category. Although the Housing Finance Commission received a large amount of carryforward from 2015, due to the overall low amount of activity in the other bond cap categories, Commerce had not yet moved any of the Commission’s 2016 initial allocation at the time of publication. If demand for remainder cap increases beyond the supply, Commerce will meet the need by moving some or all of the Commission’s initial allocation into the remainder category. 41
RCW 39.86.120 also sets the initial allocation for the housing category at 32 percent of the total cap. The housing category’s initial allocation is further divided between the Housing Finance Commission at 80 percent (25.6 percent of the total cap), and local housing authorities at 20 percent (6.4 percent of the total cap) under the Commission’s statute (RCW 43.180.200).

2016 Bond Cap Allocation Program Biennial Report to the Legislature 55
Appendix A: Acronyms and Definitions
Acronyms
No government report would be complete without at least a few acronyms to save time and space. We’ve tried to define these in the text when possible. In case space dictates prevailed, we’ve missed some, or you are looking for a handy quick reference, here is a list of acronyms common to the Bond Cap Program.
ARRA – American Recovery and Reinvestment Act of 2009
BAB – Build America Bond
BCAP – Bond Cap Allocation Program
CDFA – Council of Development Finance Agencies
CERB – Community Economic Revitalization Board
CFR – Code of Federal Regulations
EDC – Economic Development Corporation
ESCO – Energy Services Company
FTE – Full Time Equivalent (2,080 staff hours per year)
HERA – Housing and Economic Recovery Act of 2008
HFC – Housing Finance Commission
IDB – Industrial Development Bond
IDC – Industrial Development Corporation
IRB or IDRB – Industrial (Development) Revenue Bond
IRC – Internal Revenue Code
IRS – Internal Revenue Service
LHA – Local Housing Authority
LIHTC – Low Income Housing Tax Credits

2016 Bond Cap Allocation Program Biennial Report to the Legislature 56
LLC – Limited Liability Company
LP – Limited Partnership
OFM – Office of Financial Management (state)
PAB – Private Activity Bond
PUD – Public Utility District
QECB – Qualified Energy Conservation Bond
RCW – Revised Code of Washington
WAC – Washington Administrative Code
WEDFA – Washington Economic Development Finance Authority
WHEFA – Washington Higher Education Facilities Authority
WSHFC – Washington State Housing Finance Commission (also HFC or the Commission)
Definitions
Allocation – For bond cap purposes, the total dollar amount of bond issuing authority available to the state during a calendar year for any bond types limited or “capped” under federal law; or the amount available in a specific bond use category, awarded to a specific project, or awarded to a specific issuer.
Bond Counsel – An attorney specializing in advising clients on bond issuances, especially on the Internal Revenue Code (IRC) and tax implications of bond issuances. The bond counsel provides a legal opinion on whether a particular project meets the criteria in federal law for a specific type of bond issuance as established in the IRC and the Revised Code of Washington (RCW).
Bond Use Category – There are four categories of activities that may use tax-exempt private activity bond financing, plus a “remainder” category that may be used if the initial allocation in another category is depleted. The four categories are housing, student loans, small issue, and exempt facility. A fifth category, public utility district, was officially retired after 2007.
Cap – The ceiling, or limit, on the total dollar amount of specific bond types that may be issued in the state during a calendar year as defined in federal law (also “bond cap”).
Carryforward – Any portion of the cap that is not used during the allocation year, but instead is “carried forward” into subsequent years. Carryforward amounts expire after three years, or as

2016 Bond Cap Allocation Program Biennial Report to the Legislature 57
specified for the bond type in federal law. Once expired, carryforward cap is no longer available for use.
Code – The federal Internal Revenue Code, especially the Tax Reform Act of 1986.
Exempt Facilities – Certain types of transportation, solid waste management, energy, and environmental facilities as described in the IRC. Some exempt facilities must be owned by a governmental entity in order to qualify for tax-exempt private activity bonds.
Housing – In Washington State for the purposes of the bond cap allocation, housing includes mortgage revenue bonds for homebuyer assistance, mortgage credit certificates (a type of tax credit), and exempt facilities bonds for multifamily rental housing.
Initial Allocation – The percentage of the state’s total annual tax-exempt private activity bond cap set aside for each bond use category at the beginning of the calendar year.
Issuer – The state, any agency of the state, any political subdivision, or any other public entity authorized to issue private activity bonds under state law.
Original Allocation – An allocation granted by formula in federal law to a specific city or county for Recovery Zone Economic Development Bonds, Recovery Zone Facility Bonds, or Qualified Energy Conservation Bonds.
Originally Awarded Locality – A unit of local government granted an allocation by a formula in federal law for Recovery Zone Economic Development Bonds, Recovery Zone Facility Bonds, or Qualified Energy Conservation Bonds.
Private Activity – Any activity that has significant private involvement. The Internal Revenue Code describes three tests to determine if a project has significant private involvement for the purpose of a tax-exempt bond issuance. A project only needs to meet one of the two tests to be considered a private activity:
1. It meets both of the private business use tests: a. Greater than 10 percent of its proceeds are used for any private business
purpose, AND b. Greater than 10 percent of its proceeds are either secured by property used for
private business purposes or are to be repaid from private business sources. 2. OR, it meets the private loan financing test:
a. Greater than 5 percent (or $5 million, whichever is less) of its proceeds are used for loans to persons other than governmental entities.42
42
Lexis Nexis; Federal Taxation of Municipal Bonds Deskbook; Third Edition; August 2010; Newark, New Jersey; page 10; Referring to 26, U.S.C Section 141, Paragraph 2.01(a) and (b)
2016 Bond Cap Allocation Program Biennial Report to the Legislature 58
Reallocation – When an initial allocation goes unused or an original allocation has been returned to Commerce, and Commerce has distributed it to another issuer.
Small Issue Aggie – Also known as the Beginning Farmer/Rancher Loan Program. Created by the state Legislature in 2006, this program provides loans for first-time farmers and ranchers to establish their businesses. Bonds in this category are issued by the Housing Finance Commission, and individual farmers or ranchers apply to the Commission for financing. Aggie bonds are in the small issue category. Federal law currently limits individual loans under the program to $517,700 per family.
Small Issue Manufacturing – Industrial development projects that have capital expenditures of $20 million or less during a six year period – three years prior to and three years after the issuance of the tax-exempt private activity bond. Small Issue allocations are limited to $10 million per project.
Tax-exempt – Bond investors are not required to pay federal taxes on interest earned on the bonds. Tax-exempt bonds are more attractive to investors, and can therefore be easier to sell. Because of this, tax-exempt bonds can qualify for lower interest rates, which means lower costs for the issuer and user.
Underwriter – A financial or investment institution, usually a large bank, that guarantees the purchase of a full issue of bonds.
User – The governmental entity, business, or individual who is the primary beneficiary of the bond proceeds.

2016 Bond Cap Allocation Program Biennial Report to the Legislature 59
Appendix B: Required Bond Cap Application Documentation
Applications to the Bond Cap Program are intended to provide Commerce with the information needed to apply the criteria in statute and agency rule, assess the public benefit of each project, compare relative merits of competing projects, and determine whether projects are ready to issue bonds. Each category has its own application form that provides guidance for applicants to address the specific criteria that pertains to their project type.
In addition, several attachments to the application are required, primarily to document the involvement of financing team members (underwriter, bond counsel, etc.) and readiness of the project to issue. Finally, the Bond Cap manager is authorized in statute to request any additional information that may be needed to thoroughly evaluate an application and make an allocation decision.
Application Form Contents
Allocation application forms include questions designed to provide a detailed description of each project, including:
Primary project contacts
Project location
Legislative district
Detailed project budget, including sources of financing and total project costs
List of permits with dates, or anticipated dates, of issue
Project development timeline
For exempt facilities and small issue applications:
Local unemployment rate
Job creation and retention information, including type of positions and pay range
Estimated number and type of spin-off jobs (such as construction jobs)
For exempt facilities applications, the extent to which the project:
Removes solid waste from the waste stream
Manufactures waste into value-added products
Provides locally distributed heat or electricity
Has environmental benefits
Provides water or sewer service
For housing applications:
Site control information
Information on the relationships among the developing parties
2016 Bond Cap Allocation Program Biennial Report to the Legislature 60
Required Attachments
A completed application includes, in addition to the filled out application form:
An allocation fee of 0.000277 times the requested allocation amount (or $500, whichever is greater)
A signed Bond Counsel Statement of Intent form
A signed Underwriter Statement of Intent form
An Employment Form signed by at least the employer, and preferably both the employer and a representative from the Employment Security Department
An official copy of an inducement resolution from the issuer’s governing board
A copy of an Environmental Impact Statement or Mitigated Determination of Non-Significance (new construction only)
A statement of the local government priority (if submitting more than one application)
A letter from the local planning jurisdiction indicating consistency with the local comprehensive plan
An architect’s certification (new construction only)
Anything else the Bond Cap manager needs to make an eligibility determination

Appendix C: Bond Cap Projects 2000-2013
Exempt Facility
2000
Issuer Name Principal User Authorized Issuance DateIssued
City of Cashmere Tree Top Inc $4,500,000 5/22/2000$4,230,000
EDC of Port of Benton ATG Inc $7,100,000 $0
IDC of Port of Centralia Centralia Steam Plant $36,648,000 $0
IDC of Port of Grays Harbor Boise Cascade Corp $17,269,083 $0
King Co Economic Enterprise Corp Cedar Grove Composting Inc $2,500,000 $0
State of Washington Stadium & Exhibition Center $4,694,427 8/11/2000$4,694,427
WEDFA Earth Tech Inc $7,000,000 12/7/2000$5,900,000
WEDFA Waste Connections Inc $6,720,000 $0
WEDFA Waste Management Inc $34,535,000 10/5/2000$34,535,000
Annual Total $120,966,510 $49,359,427
2001
Issuer Name Principal User Authorized Issuance DateIssued
EDC of Port of Benton ATG Inc $7,100,000 $0
IDC of Port of Bellingham Atlantic Richfield Company $23,000,000 12/19/2001$23,000,000
IDC of Port of Grays Harbor Boise Cascade Corporation $17,730,917 $0
WEDFA Art Mensonides $2,240,000 10/10/2001$2,240,000
WEDFA Earth Tech Inc $3,000,000 5/1/2001$3,000,000
WEDFA Smith Brothers Farms Inc $4,000,000 9/25/2001$3,300,000
WEDFA Waste Management Inc $22,000,000 2/28/2001$22,000,000
WEDFA WestFarm Foods $10,000,000 8/16/2001$7,375,000
Annual Total $89,070,917 $60,915,000
2002
Issuer Name Principal User Authorized Issuance DateIssued
IDC of City of Everett Kimberly-Clark Corporation $16,000,000 6/5/2002$15,300,000
IDC of Port of Bellingham BP West Coast Products LLC $22,000,000 3/26/2002$22,000,000
Port of Sunnyside Port of Sunnyside $175,000 9/12/2002$175,000
WEDFA Waste Management Inc $20,000,000 10/4/2002$20,000,000
WEDFA Waste Management Inc $20,000,000 7/24/2002$20,000,000
2016 Bond Cap Allocation Program Biennial Report to the Legislature Page 61
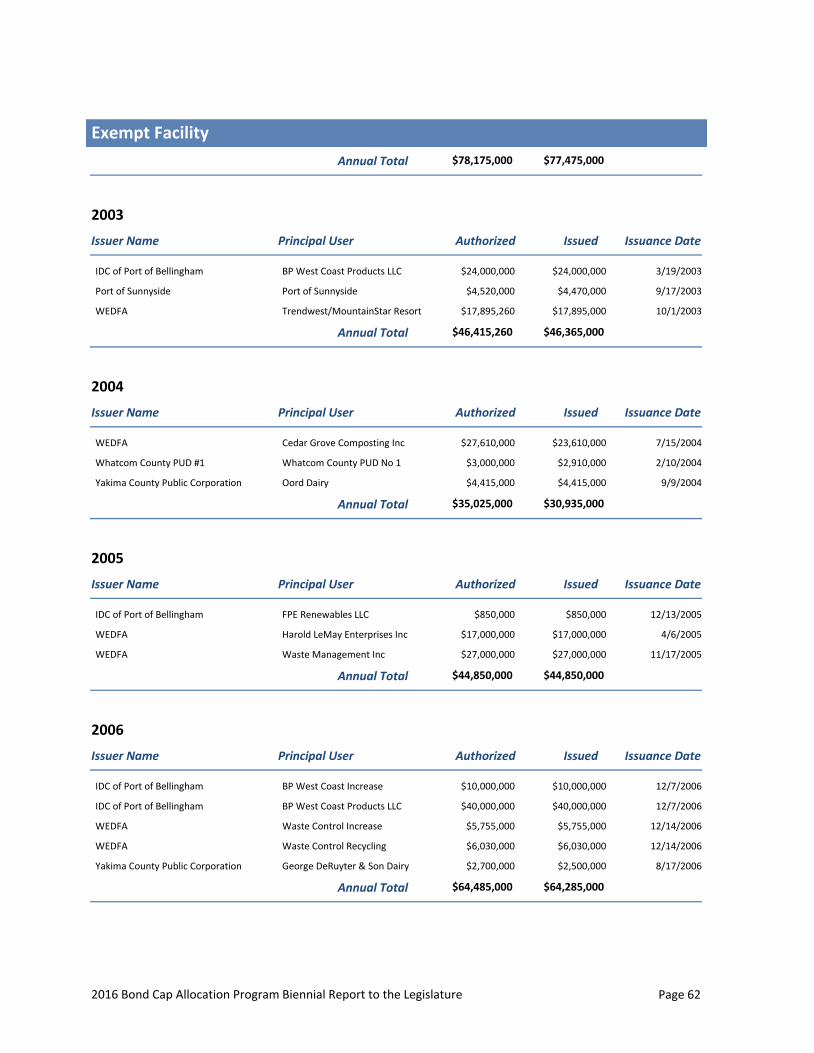
Exempt Facility
Annual Total $78,175,000 $77,475,000
2003
Issuer Name Principal User Authorized Issuance DateIssued
IDC of Port of Bellingham BP West Coast Products LLC $24,000,000 3/19/2003$24,000,000
Port of Sunnyside Port of Sunnyside $4,520,000 9/17/2003$4,470,000
WEDFA Trendwest/MountainStar Resort $17,895,260 10/1/2003$17,895,000
Annual Total $46,415,260 $46,365,000
2004
Issuer Name Principal User Authorized Issuance DateIssued
WEDFA Cedar Grove Composting Inc $27,610,000 7/15/2004$23,610,000
Whatcom County PUD #1 Whatcom County PUD No 1 $3,000,000 2/10/2004$2,910,000
Yakima County Public Corporation Oord Dairy $4,415,000 9/9/2004$4,415,000
Annual Total $35,025,000 $30,935,000
2005
Issuer Name Principal User Authorized Issuance DateIssued
IDC of Port of Bellingham FPE Renewables LLC $850,000 12/13/2005$850,000
WEDFA Harold LeMay Enterprises Inc $17,000,000 4/6/2005$17,000,000
WEDFA Waste Management Inc $27,000,000 11/17/2005$27,000,000
Annual Total $44,850,000 $44,850,000
2006
Issuer Name Principal User Authorized Issuance DateIssued
IDC of Port of Bellingham BP West Coast Increase $10,000,000 12/7/2006$10,000,000
IDC of Port of Bellingham BP West Coast Products LLC $40,000,000 12/7/2006$40,000,000
WEDFA Waste Control Increase $5,755,000 12/14/2006$5,755,000
WEDFA Waste Control Recycling $6,030,000 12/14/2006$6,030,000
Yakima County Public Corporation George DeRuyter & Son Dairy $2,700,000 8/17/2006$2,500,000
Annual Total $64,485,000 $64,285,000
2016 Bond Cap Allocation Program Biennial Report to the Legislature Page 62
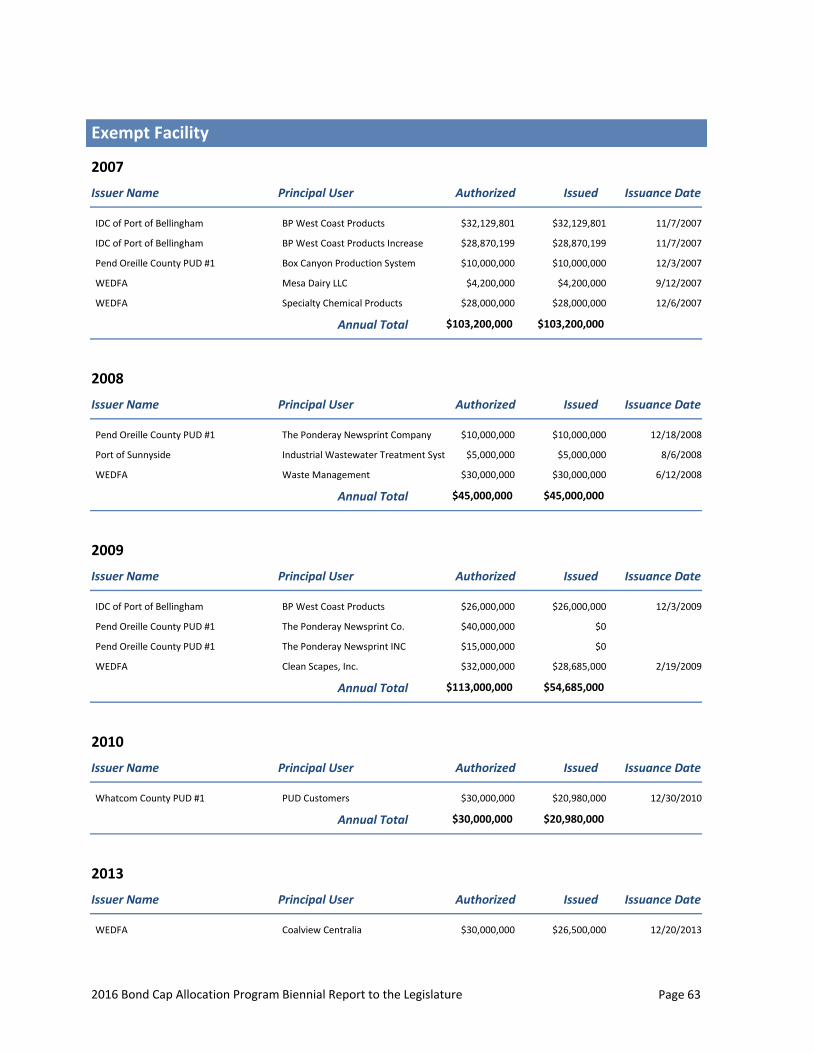
Exempt Facility
2007
Issuer Name Principal User Authorized Issuance DateIssued
IDC of Port of Bellingham BP West Coast Products $32,129,801 11/7/2007$32,129,801
IDC of Port of Bellingham BP West Coast Products Increase $28,870,199 11/7/2007$28,870,199
Pend Oreille County PUD #1 Box Canyon Production System $10,000,000 12/3/2007$10,000,000
WEDFA Mesa Dairy LLC $4,200,000 9/12/2007$4,200,000
WEDFA Specialty Chemical Products $28,000,000 12/6/2007$28,000,000
Annual Total $103,200,000 $103,200,000
2008
Issuer Name Principal User Authorized Issuance DateIssued
Pend Oreille County PUD #1 The Ponderay Newsprint Company $10,000,000 12/18/2008$10,000,000
Port of Sunnyside Industrial Wastewater Treatment Syst $5,000,000 8/6/2008$5,000,000
WEDFA Waste Management $30,000,000 6/12/2008$30,000,000
Annual Total $45,000,000 $45,000,000
2009
Issuer Name Principal User Authorized Issuance DateIssued
IDC of Port of Bellingham BP West Coast Products $26,000,000 12/3/2009$26,000,000
Pend Oreille County PUD #1 The Ponderay Newsprint Co. $40,000,000 $0
Pend Oreille County PUD #1 The Ponderay Newsprint INC $15,000,000 $0
WEDFA Clean Scapes, Inc. $32,000,000 2/19/2009$28,685,000
Annual Total $113,000,000 $54,685,000
2010
Issuer Name Principal User Authorized Issuance DateIssued
Whatcom County PUD #1 PUD Customers $30,000,000 12/30/2010$20,980,000
Annual Total $30,000,000 $20,980,000
2013
Issuer Name Principal User Authorized Issuance DateIssued
WEDFA Coalview Centralia $30,000,000 12/20/2013$26,500,000
2016 Bond Cap Allocation Program Biennial Report to the Legislature Page 63
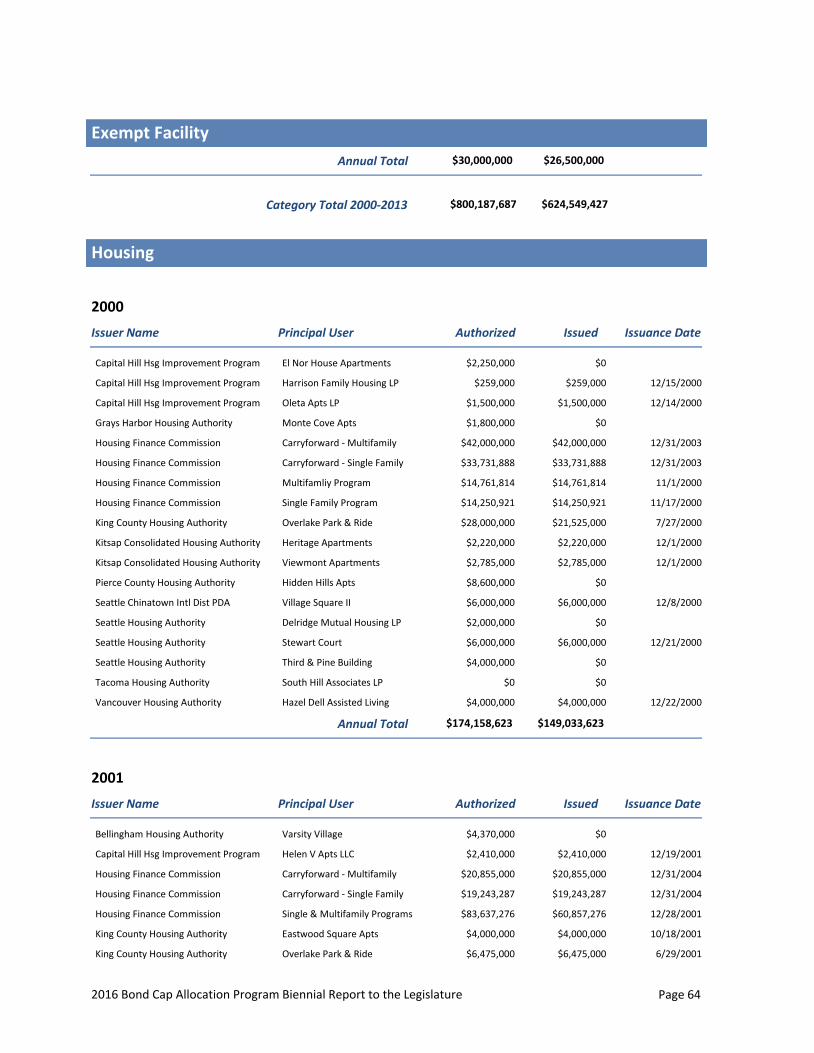
Exempt Facility
Annual Total $30,000,000 $26,500,000
Category Total 2000-2013 $800,187,687 $624,549,427
Housing
2000
Issuer Name Principal User Authorized Issuance DateIssued
Capital Hill Hsg Improvement Program El Nor House Apartments $2,250,000 $0
Capital Hill Hsg Improvement Program Harrison Family Housing LP $259,000 12/15/2000$259,000
Capital Hill Hsg Improvement Program Oleta Apts LP $1,500,000 12/14/2000$1,500,000
Grays Harbor Housing Authority Monte Cove Apts $1,800,000 $0
Housing Finance Commission Carryforward - Multifamily $42,000,000 12/31/2003$42,000,000
Housing Finance Commission Carryforward - Single Family $33,731,888 12/31/2003$33,731,888
Housing Finance Commission Multifamliy Program $14,761,814 11/1/2000$14,761,814
Housing Finance Commission Single Family Program $14,250,921 11/17/2000$14,250,921
King County Housing Authority Overlake Park & Ride $28,000,000 7/27/2000$21,525,000
Kitsap Consolidated Housing Authority Heritage Apartments $2,220,000 12/1/2000$2,220,000
Kitsap Consolidated Housing Authority Viewmont Apartments $2,785,000 12/1/2000$2,785,000
Pierce County Housing Authority Hidden Hills Apts $8,600,000 $0
Seattle Chinatown Intl Dist PDA Village Square II $6,000,000 12/8/2000$6,000,000
Seattle Housing Authority Delridge Mutual Housing LP $2,000,000 $0
Seattle Housing Authority Stewart Court $6,000,000 12/21/2000$6,000,000
Seattle Housing Authority Third & Pine Building $4,000,000 $0
Tacoma Housing Authority South Hill Associates LP $0 $0
Vancouver Housing Authority Hazel Dell Assisted Living $4,000,000 12/22/2000$4,000,000
Annual Total $174,158,623 $149,033,623
2001
Issuer Name Principal User Authorized Issuance DateIssued
Bellingham Housing Authority Varsity Village $4,370,000 $0
Capital Hill Hsg Improvement Program Helen V Apts LLC $2,410,000 12/19/2001$2,410,000
Housing Finance Commission Carryforward - Multifamily $20,855,000 12/31/2004$20,855,000
Housing Finance Commission Carryforward - Single Family $19,243,287 12/31/2004$19,243,287
Housing Finance Commission Single & Multifamily Programs $83,637,276 12/28/2001$60,857,276
King County Housing Authority Eastwood Square Apts $4,000,000 10/18/2001$4,000,000
King County Housing Authority Overlake Park & Ride $6,475,000 6/29/2001$6,475,000
2016 Bond Cap Allocation Program Biennial Report to the Legislature Page 64

Housing
King County Housing Authority Southwood Square Apts $5,200,000 10/4/2001$5,200,000
King County Housing Authority The Cone Apts $0 $0
King County Housing Authority Washington Court Apts $6,937,000 12/27/2001$6,900,000
Pierce County Housing Authority Hidden Hills Apts Assoc LLC $8,600,000 $0
Seattle Housing Authority Delridge Mutual Housing LP $2,000,000 7/31/2001$1,571,000
Seattle Housing Authority NewHolly Phase III $0 $0
Seattle Housing Authority Plymouth Housing Group $4,750,000 $0
Seattle Housing Authority Third & Pine Building $5,000,000 12/24/2001$5,000,000
Seattle Housing Authority YWCA Opportunity Place $8,500,000 $0
Tacoma Housing Authority Sunset Apartments $13,250,000 5/17/2001$13,250,000
Vancouver Housing Authority Hazel Dell Assisted Living $475,000 7/17/2001$475,000
Vancouver Housing Authority Lewis and Clark Plaza $4,600,000 $0
Vancouver Housing Authority Uptown Village $5,016,000 12/14/2001$5,016,000
Annual Total $205,318,563 $151,252,563
2002
Issuer Name Principal User Authorized Issuance DateIssued
Anacortes Housing Authority Bayview Apartments $1,450,000 9/26/2002$1,450,000
Housing Finance Commission Carryforward - Multifamily $21,614,461 12/31/2005$21,614,461
Housing Finance Commission Multifamily Program $62,000,000 12/15/2002$62,000,000
Housing Finance Commission Single Family Program $25,783,514 5/30/2002$25,783,514
King County Housing Authority Angle Lake Senior Housing $5,500,000 12/30/2002$5,000,000
Pierce County Housing Authority Hidden Hills Apts $8,600,000 1/30/2002$8,100,000
Pierce County Housing Authority Sumner Commons Housing LP $2,000,000 12/20/2002$1,750,000
Seattle Chinatown Intl Dist PDA Village Square 2 $1,700,000 12/12/2002$1,700,000
Seattle Housing Authority NewHolly Phase III $22,500,000 12/4/2002$22,500,000
Seattle Housing Authority Rainier Vista $22,500,000 12/19/2002$22,500,000
Seattle Housing Authority YWCA Opportunity Place $9,700,000 12/19/2002$9,700,000
Tacoma Housing Authority Golden Hemlock Apts $0 $0
Tacoma Housing Authority Hillside Terrace Apts $2,500,000 12/19/2002$2,250,000
Vancouver Housing Authority Esther Short Apts $12,000,000 12/13/2002$12,000,000
Vancouver Housing Authority Teal Point Apts $5,000,000 9/30/2002$5,000,000
Annual Total $202,847,975 $201,347,975
2003
Issuer Name Principal User Authorized Issuance DateIssued
Housing Finance Commission Carryforward - Multifamily $81,647,059 12/31/2006$81,647,059
Housing Finance Commission Multifamily Program $33,050,000 12/15/2003$24,635,174
2016 Bond Cap Allocation Program Biennial Report to the Legislature Page 65
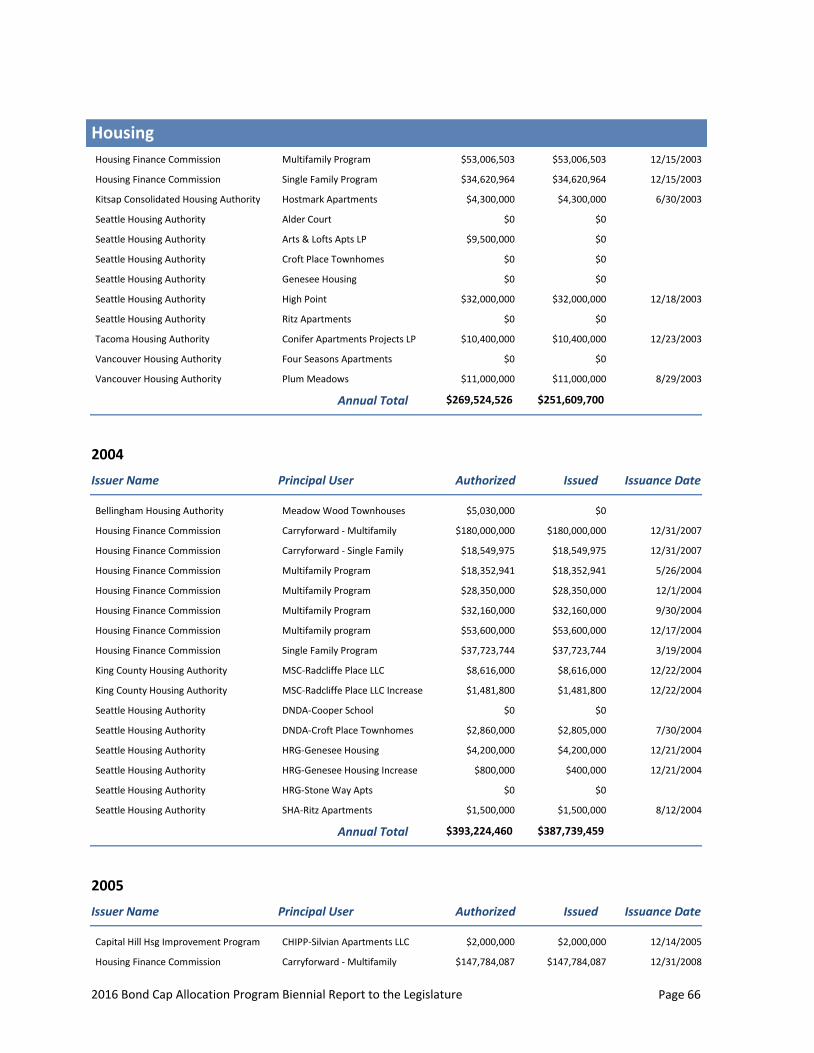
Housing
Housing Finance Commission Multifamily Program $53,006,503 12/15/2003$53,006,503
Housing Finance Commission Single Family Program $34,620,964 12/15/2003$34,620,964
Kitsap Consolidated Housing Authority Hostmark Apartments $4,300,000 6/30/2003$4,300,000
Seattle Housing Authority Alder Court $0 $0
Seattle Housing Authority Arts & Lofts Apts LP $9,500,000 $0
Seattle Housing Authority Croft Place Townhomes $0 $0
Seattle Housing Authority Genesee Housing $0 $0
Seattle Housing Authority High Point $32,000,000 12/18/2003$32,000,000
Seattle Housing Authority Ritz Apartments $0 $0
Tacoma Housing Authority Conifer Apartments Projects LP $10,400,000 12/23/2003$10,400,000
Vancouver Housing Authority Four Seasons Apartments $0 $0
Vancouver Housing Authority Plum Meadows $11,000,000 8/29/2003$11,000,000
Annual Total $269,524,526 $251,609,700
2004
Issuer Name Principal User Authorized Issuance DateIssued
Bellingham Housing Authority Meadow Wood Townhouses $5,030,000 $0
Housing Finance Commission Carryforward - Multifamily $180,000,000 12/31/2007$180,000,000
Housing Finance Commission Carryforward - Single Family $18,549,975 12/31/2007$18,549,975
Housing Finance Commission Multifamily Program $18,352,941 5/26/2004$18,352,941
Housing Finance Commission Multifamily Program $28,350,000 12/1/2004$28,350,000
Housing Finance Commission Multifamily Program $32,160,000 9/30/2004$32,160,000
Housing Finance Commission Multifamily program $53,600,000 12/17/2004$53,600,000
Housing Finance Commission Single Family Program $37,723,744 3/19/2004$37,723,744
King County Housing Authority MSC-Radcliffe Place LLC $8,616,000 12/22/2004$8,616,000
King County Housing Authority MSC-Radcliffe Place LLC Increase $1,481,800 12/22/2004$1,481,800
Seattle Housing Authority DNDA-Cooper School $0 $0
Seattle Housing Authority DNDA-Croft Place Townhomes $2,860,000 7/30/2004$2,805,000
Seattle Housing Authority HRG-Genesee Housing $4,200,000 12/21/2004$4,200,000
Seattle Housing Authority HRG-Genesee Housing Increase $800,000 12/21/2004$400,000
Seattle Housing Authority HRG-Stone Way Apts $0 $0
Seattle Housing Authority SHA-Ritz Apartments $1,500,000 8/12/2004$1,500,000
Annual Total $393,224,460 $387,739,459
2005
Issuer Name Principal User Authorized Issuance DateIssued
Capital Hill Hsg Improvement Program CHIPP-Silvian Apartments LLC $2,000,000 12/14/2005$2,000,000
Housing Finance Commission Carryforward - Multifamily $147,784,087 12/31/2008$147,784,087
2016 Bond Cap Allocation Program Biennial Report to the Legislature Page 66

Housing
Housing Finance Commission Carryforward - Single Family $95,000,000 12/31/2008$95,000,000
Housing Finance Commission Multifamily Program $28,800,000 8/12/2005$28,800,000
King County Housing Authority DASH-Bellevue Portfolio $7,600,000 8/1/2005$7,320,000
King County Housing Authority Eernisse Apartments $3,800,000 12/20/2005$3,550,000
Renton Housing Authority DASH-Renton Fifth & Williams $7,600,000 $0
Seattle Housing Authority DNDA-Cooper School $3,600,000 6/21/2005$3,600,000
Seattle Housing Authority High Rise Increase $5,000,000 12/22/2005$5,000,000
Seattle Housing Authority High Rise Increase $8,000,000 12/22/2005$5,800,000
Seattle Housing Authority High Rise Renovation Phase I $12,000,000 12/22/2005$12,000,000
Seattle Housing Authority HRG-Stone Way Apts $8,600,000 7/28/2005$8,600,000
Seattle Housing Authority HRG-Stone Way Apts Increase $300,000 7/28/2005$300,000
Snohomish Co Housing Authority HASCO-Whispering Pines LP $1,690,000 12/21/2005$1,593,279
Snohomish Co Housing Authority Housing Hope/Avondale Village $1,450,000 11/4/2005$1,450,000
Tacoma Housing Authority Conifer Portfolio $12,200,000 3/18/2005$12,175,000
Tacoma Housing Authority Parkland Family Vista LLC $3,400,000 12/14/2005$3,400,000
Vancouver Housing Authority Mill Creek Projects $6,900,000 $0
Annual Total $355,724,087 $338,372,366
2006
Issuer Name Principal User Authorized Issuance DateIssued
Housing Finance Commission Carryforward - Multifamily $107,644,169 12/31/2009$107,664,169
Housing Finance Commission Carryforward - Single Family $100,000,000 12/31/2009$100,000,000
Housing Finance Commission Multifamily Program $17,300,000 11/30/2006$17,300,000
Housing Finance Commission Multifamily Program $30,200,000 12/7/2006$30,200,000
Housing Finance Commission Single Family Program $55,000,000 10/12/2006$55,000,000
Housing Finance Commission Single Family Program $55,000,000 8/23/2006$55,000,000
King County Housing Authority Nia Apartments HOPE VI $3,000,000 12/12/2006$3,000,000
Renton Housing Authority DASH/Fifth & Williams Project $7,600,000 $0
Seattle Housing Authority HomeWorks LP $25,000,000 12/21/2006$25,000,000
Seattle Housing Authority HomeWorks LP 2nd Increase $52,000 12/21/2006$51,551
Seattle Housing Authority HomeWorks LP Increase $3,000,000 12/21/2006$3,000,000
Seattle Housing Authority Urban League Increase $750,000 12/11/2006$750,000
Seattle Housing Authority Urban League/Colman School $5,000,000 12/11/2006$5,000,000
Vancouver Housing Authority Mill Creek Projects $6,900,000 6/23/2006$6,900,000
Vancouver Housing Authority Mill Creek Projects Increase $1,600,000 6/23/2006$1,600,000
Annual Total $418,046,169 $410,465,720
2016 Bond Cap Allocation Program Biennial Report to the Legislature Page 67

Housing
2007
Issuer Name Principal User Authorized Issuance DateIssued
Bellingham Housing Authority Meadow Wood Associates II LLC $2,500,000 11/9/2007$2,400,000
Capital Hill Hsg Improvement Program Woodland Park Avenue LLC $2,500,000 8/31/2007$2,500,000
Capital Hill Hsg Improvement Program Woodland Park Increase $200,000 8/31/2007$200,000
Capital Hill Hsg Improvement Program Woodland Park Increase 2 $250,000 8/31/2007$238,000
Housing Finance Commission Carryforward - Multifamily $3,164,023 12/31/2010$3,164,023
Housing Finance Commission Multifamily Program $1,000,000 10/4/2007$1,000,000
Housing Finance Commission Multifamily Program $4,255,000 10/4/2007$4,255,000
Housing Finance Commission Multifamily Program $11,000,000 10/4/2007$11,000,000
Housing Finance Commission Multifamily Program $23,000,000 10/4/2007$23,000,000
Housing Finance Commission Multifamily Program $34,745,000 10/4/2007$34,745,000
Housing Finance Commission Multifamily Program $41,250,000 11/9/2007$41,250,000
Housing Finance Commission Single Family Program $3,664,567 10/4/2007$3,664,567
Housing Finance Commission Single Family Program $10,000,000 4/17/2007$10,000,000
Housing Finance Commission Single Family Program $25,000,000 4/17/2007$25,000,000
Housing Finance Commission Single Family Program $76,335,433 10/25/2007$76,335,433
King County Housing Authority Capital Fund Partnership $35,000,000 9/6/2007$35,000,000
King County Housing Authority Capital Fund Partnership Inc #2 $100,000 9/6/2007$100,000
King County Housing Authority Capital Fund Partnership Increase $5,000,000 9/6/2007$5,000,000
King County Housing Authority Salmon Creek HOPE VI $3,500,000 12/6/2007$3,500,000
King County Housing Authority Salmon Creek HOPE VI Inc $500,000 12/6/2007$500,000
King County Housing Authority Salmon Creek HOPE VI Inc #2 $250,000 12/6/2007$250,000
King County Housing Authority St. Andrew's Housing Group $200,000 11/1/2007$200,000
King County Housing Authority St. Andrew's Housing Group $300,000 11/1/2007$300,000
King County Housing Authority St. Andrew's Housing Group $4,000,000 11/1/2007$4,000,000
Kitsap Consolidated Housing Authority Kitsap Apartments 2006 LP $16,100,000 6/29/2007$11,845,000
Kitsap Consolidated Housing Authority Poplars Apartments LP $3,400,000 $0
Renton Housing Authority DASH - Fifth & Williams $9,000,000 3/19/2007$9,000,000
Seattle Housing Authority High Point South HOPE VI $36,000,000 3/6/2007$36,000,000
Seattle Housing Authority Housing Resources Group $1,200,000 11/7/2007$1,200,000
Seattle Housing Authority Seattle High Rise LP $20,000,000 12/19/2007$19,950,000
Snohomish Co Housing Authority HASCO-Cedar Street LP $515,000 5/1/2007$484,106
Snohomish Co Housing Authority Olympic & Sound View Apts $5,800,000 10/31/2007$5,800,000
Snohomish Co Housing Authority Olympic & Sound View Increase $700,000 10/31/2007$700,000
Annual Total $380,429,023 $372,581,129
2016 Bond Cap Allocation Program Biennial Report to the Legislature Page 68
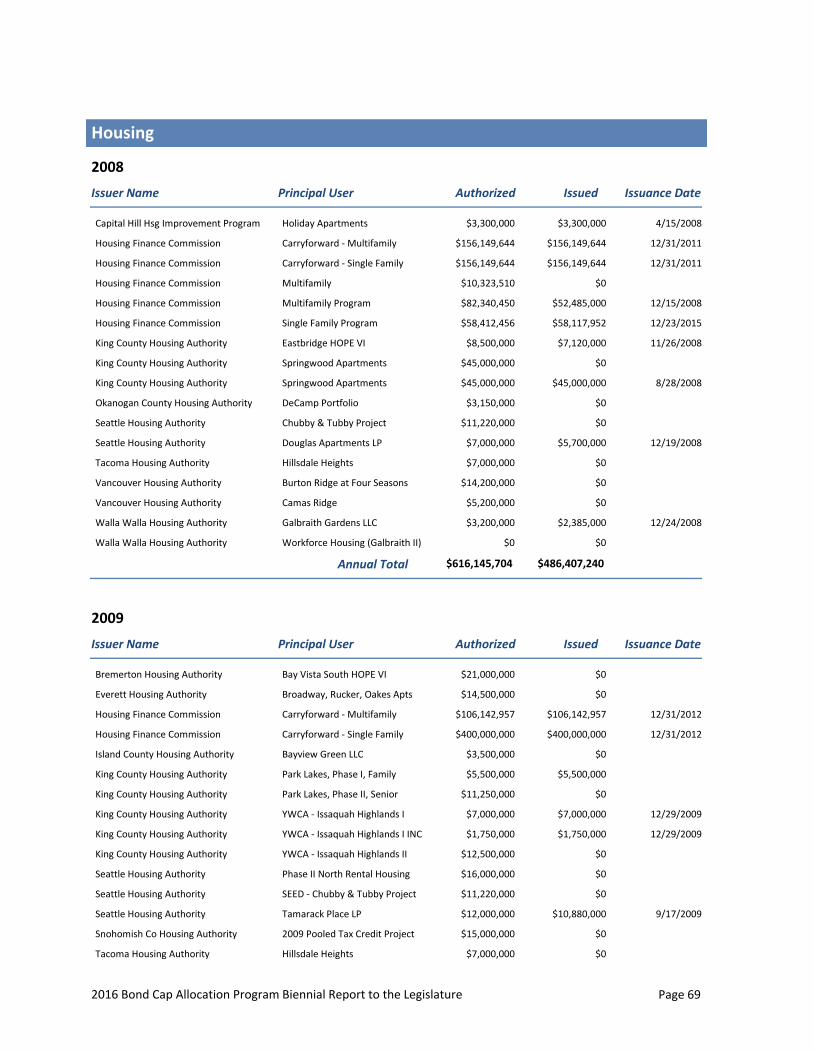
Housing
2008
Issuer Name Principal User Authorized Issuance DateIssued
Capital Hill Hsg Improvement Program Holiday Apartments $3,300,000 4/15/2008$3,300,000
Housing Finance Commission Carryforward - Multifamily $156,149,644 12/31/2011$156,149,644
Housing Finance Commission Carryforward - Single Family $156,149,644 12/31/2011$156,149,644
Housing Finance Commission Multifamily $10,323,510 $0
Housing Finance Commission Multifamily Program $82,340,450 12/15/2008$52,485,000
Housing Finance Commission Single Family Program $58,412,456 12/23/2015$58,117,952
King County Housing Authority Eastbridge HOPE VI $8,500,000 11/26/2008$7,120,000
King County Housing Authority Springwood Apartments $45,000,000 $0
King County Housing Authority Springwood Apartments $45,000,000 8/28/2008$45,000,000
Okanogan County Housing Authority DeCamp Portfolio $3,150,000 $0
Seattle Housing Authority Chubby & Tubby Project $11,220,000 $0
Seattle Housing Authority Douglas Apartments LP $7,000,000 12/19/2008$5,700,000
Tacoma Housing Authority Hillsdale Heights $7,000,000 $0
Vancouver Housing Authority Burton Ridge at Four Seasons $14,200,000 $0
Vancouver Housing Authority Camas Ridge $5,200,000 $0
Walla Walla Housing Authority Galbraith Gardens LLC $3,200,000 12/24/2008$2,385,000
Walla Walla Housing Authority Workforce Housing (Galbraith II) $0 $0
Annual Total $616,145,704 $486,407,240
2009
Issuer Name Principal User Authorized Issuance DateIssued
Bremerton Housing Authority Bay Vista South HOPE VI $21,000,000 $0
Everett Housing Authority Broadway, Rucker, Oakes Apts $14,500,000 $0
Housing Finance Commission Carryforward - Multifamily $106,142,957 12/31/2012$106,142,957
Housing Finance Commission Carryforward - Single Family $400,000,000 12/31/2012$400,000,000
Island County Housing Authority Bayview Green LLC $3,500,000 $0
King County Housing Authority Park Lakes, Phase I, Family $5,500,000 $5,500,000
King County Housing Authority Park Lakes, Phase II, Senior $11,250,000 $0
King County Housing Authority YWCA - Issaquah Highlands I $7,000,000 12/29/2009$7,000,000
King County Housing Authority YWCA - Issaquah Highlands I INC $1,750,000 12/29/2009$1,750,000
King County Housing Authority YWCA - Issaquah Highlands II $12,500,000 $0
Seattle Housing Authority Phase II North Rental Housing $16,000,000 $0
Seattle Housing Authority SEED - Chubby & Tubby Project $11,220,000 $0
Seattle Housing Authority Tamarack Place LP $12,000,000 9/17/2009$10,880,000
Snohomish Co Housing Authority 2009 Pooled Tax Credit Project $15,000,000 $0
Tacoma Housing Authority Hillsdale Heights $7,000,000 $0
2016 Bond Cap Allocation Program Biennial Report to the Legislature Page 69

Housing
Vancouver Housing Authority Burton Ridge at Four Seasons $14,200,000 $0
Vancouver Housing Authority Burton Ridge Increase $6,400,000 $0
Vancouver Housing Authority Camas Ridge $5,200,000 $0
Walla Walla Housing Authority Workforce Housing (Galbraith II) $3,000,000 $0
Annual Total $673,162,957 $531,272,957
2010
Issuer Name Principal User Authorized Issuance DateIssued
Everett Housing Authority Broadway Plaza, Rucker, Oakes Apts $14,500,000 $0
Housing Finance Commission Carryforward - Multifamily $265,567,612 12/31/2013$265,567,612
Housing Finance Commission Carryforward - Single Family $265,567,612 12/31/2013$265,567,612
Island County Housing Authority Sunny View Village/Bayview Greens $3,500,000 $0
King County Housing Authority Greenbridge Sixth Place Apartments $5,500,000 4/30/2010$5,500,000
King County Housing Authority Zephyr Apartments $4,450,000 $0
Seattle Housing Authority Rainer Vista Phase III (HOPE VI) $16,000,000 7/16/2010$13,000,000
Seattle Housing Authority SHA - Tamarack Place $8,801,326 $0
Snohomish Co Housing Authority 2010 Pooled Tax Credit Projects $15,000,000 $0
Tacoma Housing Authority Hillsdale Heights $7,000,000 $0
Vancouver Housing Authority Battle Ground Village Apartments $10,000,000 $0
Vancouver Housing Authority Burton Ridge $20,600,000 $0
Annual Total $636,486,550 $549,635,224
2011
Issuer Name Principal User Authorized Issuance DateIssued
Everett Housing Authority Broadway Plaza $13,000,000 6/29/2011$12,500,000
Housing Finance Commission Carryforward - Multifamily $312,935,900 12/31/2013$312,935,900
Housing Finance Commission Carryforward - Single Family $312,935,900 12/31/2013$312,935,900
Seattle Housing Authority Yesler Terrace $20,000,000 $0
Annual Total $658,871,800 $638,371,800
2012
Issuer Name Principal User Authorized Issuance DateIssued
Housing Finance Commission Carryforward - Multifamily $548,703,610 $548,703,610
Housing Finance Commission Carryforward - Single Family $100,000,000 $100,000,000
Annual Total $648,703,610 $648,703,610
2016 Bond Cap Allocation Program Biennial Report to the Legislature Page 70

Housing
2013
Issuer Name Principal User Authorized Issuance DateIssued
Housing Finance Commission Carryforward - Multifamily $328,716,140 $54,067,576
Housing Finance Commission Carryforward - Single Family $300,000,000 $300,000,000
Seattle Housing Authority Leshi Housing Rehab & Addition $10,000,000 $0
Annual Total $638,716,140 $354,067,576
Category Total 2000-2013 $6,271,360,186 $5,470,860,941
PUD
2000
Issuer Name Principal User Authorized Issuance DateIssued
Chelan County PUD #1 Rocky Reach & Rock Island $28,781,805 $0
Annual Total $28,781,805 $0
2001
Issuer Name Principal User Authorized Issuance DateIssued
Chelan County PUD #1 Rocky Reach & Rock Island $65,620,061 3/15/2001$65,620,000
Annual Total $65,620,061 $65,620,000
2002
Issuer Name Principal User Authorized Issuance DateIssued
Chelan County PUD #1 Chelan County PUD $44,909,797 12/12/2002$44,905,000
Annual Total $44,909,797 $44,905,000
2003
Issuer Name Principal User Authorized Issuance DateIssued
Grant County PUD #2 Wanapum Hydroelectric $16,680,000 2/13/2003$16,680,000
Annual Total $16,680,000 $16,680,000
2016 Bond Cap Allocation Program Biennial Report to the Legislature Page 71

PUD
2005
Issuer Name Principal User Authorized Issuance DateIssued
Douglas County PUD #1 Wells Hydroelectric Project $43,232,989 7/27/2005$43,232,989
Grant County PUD #2 Priest Rapids Hydroelectric $8,333,774 12/13/2005$8,330,763
Grant County PUD #2 Wanapum Hydroelectric $51,000,000 2/1/2005$47,115,102
Annual Total $102,566,763 $98,678,853
2007
Issuer Name Principal User Authorized Issuance DateIssued
Chelan County PUD #1 Rock Island Hydro Project/ PSE $8,146,147 5/31/2007$8,142,336
Annual Total $8,146,147 $8,142,336
Category Total 2000-2013 $266,704,573 $234,026,189
Small Issue
2000
Issuer Name Principal User Authorized Issuance DateIssued
Adams County Port District No.1 SVZ USA Washington Inc $5,000,000 $0
IDC of Port of Chehalis Cascade Hardwoods Inc $8,000,000 11/16/2000$8,000,000
IDC of Spokane County Mackay Manufacturing Inc $2,000,000 10/4/2000$2,000,000
WEDFA Canam Steel Corp $7,000,000 7/17/2000$7,000,000
WEDFA Clabag Services LLC $1,100,000 5/5/2000$1,000,000
WEDFA Garco Building Systems $1,400,000 8/1/2000$1,400,000
WEDFA GRK LLC $3,000,000 $0
WEDFA Houk Brooklyn LLC $2,400,000 3/24/2000$2,400,000
WEDFA Pacific Coast Feather Co $2,850,000 12/8/2000$1,000,000
WEDFA Ronald E Leuning $4,200,000 5/16/2000$4,125,000
Yakima County Public Corporation Columbia Ready-Mix Inc $1,300,000 11/22/2000$1,300,000
Yakima County Public Corporation Michelsen Packaging Co $4,200,000 11/9/2000$4,200,000
Yakima County Public Corporation Printing Press Inc $4,500,000 6/29/2000$2,500,000
Yakima County Public Corporation Valley Processing Inc $4,500,000 2/3/2000$4,500,000
Annual Total $51,450,000 $39,425,000
2016 Bond Cap Allocation Program Biennial Report to the Legislature Page 72

Small Issue
2001
Issuer Name Principal User Authorized Issuance DateIssued
IDC of Port of Chehalis JR Braun Northwest Inc $3,200,000 $0
Pilchuck Development Public Corp HCI Steel Building Systems Inc $2,500,000 5/10/2001$2,440,000
Port of Douglas County Berglin Corporation $1,200,000 12/20/2001$1,200,000
WEDFA GRK LLC $3,000,000 $0
WEDFA Half Diamond JL LLC $1,275,000 2/1/2001$1,275,000
WEDFA Proto Manufacturing Inc $1,125,000 2/1/2001$1,125,000
WEDFA RMI Investors LLC $5,000,000 8/30/2001$5,000,000
WEDFA Royal Ridge Fruit & Cold Storage $4,955,000 4/4/2001$4,955,000
WEDFA Vectra LLC $2,400,000 $0
WEDFA WestFarm Foods $1,000,000 11/5/2001$1,000,000
Yakima County Public Corporation Seneca Foods Corporation $3,200,000 5/16/2001$3,200,000
Yakima County Public Corporation Valley Processing Inc $2,000,000 7/9/2001$2,000,000
Annual Total $30,855,000 $22,195,000
2002
Issuer Name Principal User Authorized Issuance DateIssued
EDC of Pierce County True World Foods International Inc $8,100,000 6/21/2002$6,930,000
IDC of Port of Chehalis JR Braun Northwest Inc $3,200,000 $0
IDC of Spokane County Ecolite Manufacturing Co $2,500,000 3/28/2002$2,500,000
Port of Port Angeles Port of Port Angeles $500,000 3/26/2002$500,000
WEDFA Absorption Corporation $7,288,500 $0
WEDFA Hillstrom LLC $4,000,000 12/10/2002$3,265,000
WEDFA Mountlake LLC $2,250,000 10/1/2002$2,225,000
WEDFA Nature's Path Foods USA Inc $2,040,364 $0
WEDFA U.S. Pies Realty LLC $2,100,000 4/25/2002$2,100,000
Annual Total $31,978,864 $17,520,000
2003
Issuer Name Principal User Authorized Issuance DateIssued
EDC of Pierce County SeaTac Packaging Mfg Corp $6,500,000 8/5/2003$5,300,000
IDC of Kitsap County CARA Land Co LLC $2,000,000 3/19/2003$2,000,000
IDC of Port of Chehalis JR Braun Northwest Inc $3,200,000 3/11/2003$3,200,000
Port of Shelton Port of Shelton $1,100,000 10/14/2003$1,085,000
WEDFA Absorption Corporation $2,900,000 3/19/2003$2,335,000
WEDFA Belina Interiors Inc $1,800,000 10/28/2003$1,110,000
2016 Bond Cap Allocation Program Biennial Report to the Legislature Page 73

Small Issue
WEDFA Jacoshop LLC $2,000,000 11/14/2003$1,790,000
Annual Total $19,500,000 $16,820,000
2004
Issuer Name Principal User Authorized Issuance DateIssued
WEDFA Lawrence B. Stone Properties LLC $2,631,000 8/13/2004$2,512,500
WEDFA Posey Properties/Lamiglas Inc $678,641 11/4/2004$678,641
WEDFA PSPL Inc $2,800,000 $0
Annual Total $6,109,641 $3,191,141
2005
Issuer Name Principal User Authorized Issuance DateIssued
IDC of Spokane County Sonderen Packaging Inc $2,000,000 12/20/2005$2,000,000
WEDFA Four Corners Capital LLC $7,500,000 12/22/2005$7,500,000
WEDFA PSPL Inc $2,000,000 5/25/2005$2,000,000
WEDFA Sumner Bldg LLC/Sound Sleep $2,900,000 12/20/2002$2,900,000
Annual Total $14,400,000 $14,400,000
2006
Issuer Name Principal User Authorized Issuance DateIssued
EDC of Pierce County JNB Enterprises/Print NW $3,000,000 12/13/2006$2,200,000
EDC of Pierce County Quality Stamping & Machining $2,250,000 12/7/2006$2,225,000
EDC of Pierce County SeaTac Packaging Mfg Corp $5,800,000 $0
Housing Finance Commission Beginning Farmer/Rancher $2,000,000 $0
IDC of Kitsap County CARA Land Co LLC $5,000,000 6/8/2006$5,000,000
IDC of Port of Bellingham Hempler Foods Group LLC $6,125,000 7/27/2006$6,125,000
IDC of Port of Bellingham Wood Stone Corporation $3,400,000 8/17/2006$3,400,000
IDC of Spokane County MacKay Manufacturing Inc $1,300,000 4/13/2006$1,300,000
WEDFA Absorption Corporation $1,600,000 9/14/2006$1,600,000
WEDFA DVF LLC/Wesmar Company $2,745,000 7/26/2006$2,745,000
WEDFA Green Garden Food Products $4,295,000 7/13/2006$3,695,000
Annual Total $37,515,000 $28,290,000
2007
Issuer Name Principal User Authorized Issuance DateIssued
2016 Bond Cap Allocation Program Biennial Report to the Legislature Page 74
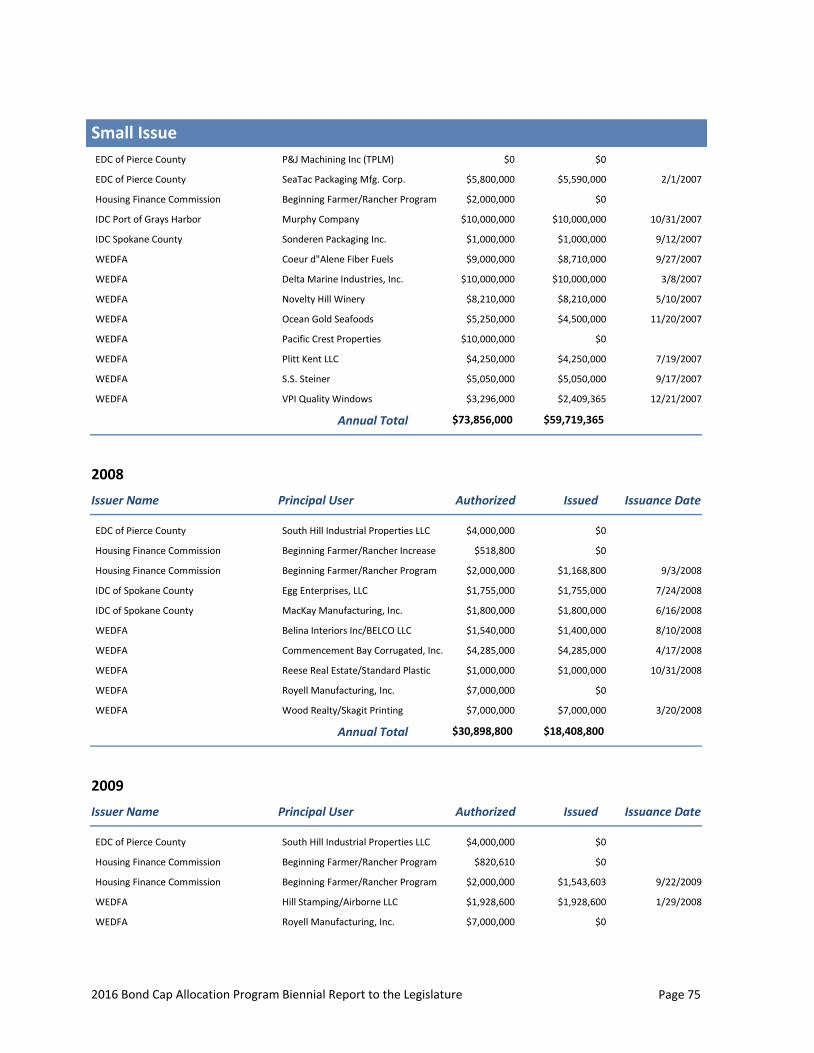
Small Issue
EDC of Pierce County P&J Machining Inc (TPLM) $0 $0
EDC of Pierce County SeaTac Packaging Mfg. Corp. $5,800,000 2/1/2007$5,590,000
Housing Finance Commission Beginning Farmer/Rancher Program $2,000,000 $0
IDC Port of Grays Harbor Murphy Company $10,000,000 10/31/2007$10,000,000
IDC Spokane County Sonderen Packaging Inc. $1,000,000 9/12/2007$1,000,000
WEDFA Coeur d"Alene Fiber Fuels $9,000,000 9/27/2007$8,710,000
WEDFA Delta Marine Industries, Inc. $10,000,000 3/8/2007$10,000,000
WEDFA Novelty Hill Winery $8,210,000 5/10/2007$8,210,000
WEDFA Ocean Gold Seafoods $5,250,000 11/20/2007$4,500,000
WEDFA Pacific Crest Properties $10,000,000 $0
WEDFA Plitt Kent LLC $4,250,000 7/19/2007$4,250,000
WEDFA S.S. Steiner $5,050,000 9/17/2007$5,050,000
WEDFA VPI Quality Windows $3,296,000 12/21/2007$2,409,365
Annual Total $73,856,000 $59,719,365
2008
Issuer Name Principal User Authorized Issuance DateIssued
EDC of Pierce County South Hill Industrial Properties LLC $4,000,000 $0
Housing Finance Commission Beginning Farmer/Rancher Increase $518,800 $0
Housing Finance Commission Beginning Farmer/Rancher Program $2,000,000 9/3/2008$1,168,800
IDC of Spokane County Egg Enterprises, LLC $1,755,000 7/24/2008$1,755,000
IDC of Spokane County MacKay Manufacturing, Inc. $1,800,000 6/16/2008$1,800,000
WEDFA Belina Interiors Inc/BELCO LLC $1,540,000 8/10/2008$1,400,000
WEDFA Commencement Bay Corrugated, Inc. $4,285,000 4/17/2008$4,285,000
WEDFA Reese Real Estate/Standard Plastic $1,000,000 10/31/2008$1,000,000
WEDFA Royell Manufacturing, Inc. $7,000,000 $0
WEDFA Wood Realty/Skagit Printing $7,000,000 3/20/2008$7,000,000
Annual Total $30,898,800 $18,408,800
2009
Issuer Name Principal User Authorized Issuance DateIssued
EDC of Pierce County South Hill Industrial Properties LLC $4,000,000 $0
Housing Finance Commission Beginning Farmer/Rancher Program $820,610 $0
Housing Finance Commission Beginning Farmer/Rancher Program $2,000,000 9/22/2009$1,543,603
WEDFA Hill Stamping/Airborne LLC $1,928,600 1/29/2008$1,928,600
WEDFA Royell Manufacturing, Inc. $7,000,000 $0
2016 Bond Cap Allocation Program Biennial Report to the Legislature Page 75

Small Issue
Annual Total $15,749,210 $3,472,203
2010
Issuer Name Principal User Authorized Issuance DateIssued
EDC of Pierce County Frederico Enterprises I, LLC $5,280,000 10/27/2010$5,200,000
Housing Finance Commission Beginning Farmer/Rancher INC $1,691,000 $0
Housing Finance Commission Beginning Farmer/Rancher Program $2,250,000 8/6/2010$1,691,000
Annual Total $9,221,000 $6,891,000
2011
Issuer Name Principal User Authorized Issuance DateIssued
Housing Finance Commission Ranchers and Farmers $2,000,000 11/30/2011$459,500
Annual Total $2,000,000 $459,500
2012
Issuer Name Principal User Authorized Issuance DateIssued
Housing Finance Commission Beginning Farmer/Rancher Program $2,000,000 5/18/2012$150,000
Annual Total $2,000,000 $150,000
Category Total 2000-2013 $325,533,515 $230,942,009
Student Loans
2000
Issuer Name Principal User Authorized Issuance DateIssued
Student Loan Finance Association Student Loan Finance Association $50,000,000 7/26/2000$50,000,000
Annual Total $50,000,000 $50,000,000
2001
Issuer Name Principal User Authorized Issuance DateIssued
Student Loan Finance Association Student Loan Finance Association $68,415,472 11/28/2001$68,400,000
2016 Bond Cap Allocation Program Biennial Report to the Legislature Page 76

Student Loans
Annual Total $68,415,472 $68,400,000
2002
Issuer Name Principal User Authorized Issuance DateIssued
Student Loan Finance Association Student Loan Finance Association $107,873,717 11/19/2002$107,850,000
Annual Total $107,873,717 $107,850,000
2003
Issuer Name Principal User Authorized Issuance DateIssued
Student Loan Finance Association Carryforward - SLFA $60,000,000 3/23/2004$60,000,000
Student Loan Finance Association Student Loan Finance Association $63,724,458 7/24/2003$63,700,000
Annual Total $123,724,458 $123,700,000
2004
Issuer Name Principal User Authorized Issuance DateIssued
Student Loan Finance Association Student Loan Finance Association $68,672,184 3/23/2004$68,650,000
Annual Total $68,672,184 $68,650,000
Category Total 2000-2013 $418,685,830 $418,600,000
2016 Bond Cap Allocation Program Biennial Report to the Legislature Page 77