Embed Size (px)
Citation preview

BON SECOURS REDSKINS ECONOMIC AND FISCAL IMPACT OF TRAINING CAMP AND ASSOCIATED DEVELOPMENT
REVISED MARCH 2019

ABOUT THE WILDER SCHOOL AND THE CENTER FOR PUBLIC POLICYThe L. Douglas Wilder School of Government and Public Affairs at Virginia Commonwealth Univer-sity informs public policy through cutting-edge research and community engagement while pre-paring students to be tomorrow’s leaders. The Wilder School’s Center for Public Policy conducts research, translates VCU faculty research into policy briefs for state and local leaders, and pro-vides leadership development, education and training for state and local governments, nonprofit organizations and businesses across Virginia and beyond.
ABOUT CURAThe Center for Urban and Regional Analysis (CURA) is the economic and policy research center of the L. Douglas Wilder School of Government & Public Affairs at Virginia Commonwealth Universi-ty. The Center serves stakeholders and organizations at all levels of focus, providing information systems support, program impact analysis, public policy evaluation, targeted investment models, and strategic plans to state agencies, regional and metropolitan organizations, planning districts, cities, counties and towns, as well as businesses and non-profit organizations.
SPECIAL NOTEThis report has been revised in March 2019 to reflect additional information on the value and own-ership of the Leigh Street site. The initial report did not include the asset value of the Leigh Street site, while erroneously including the appraisal value of the entire site in the estimate of the ROI beyond 2033. With this revision, there have been changes to pages 22-25 which are additionally reflected in the Executive Summary section of this report. The original publication of this report without the Leigh Street site asset value can be provided upon request by e-mailing [email protected].
COVER PHOTO CREDIT: Bon Secours

REDSKINS BON SECOURS
ECONOMIC AND FISCAL IMPACT OF TRAINING CAMP AND ASSOCIATED DEVELOPMENT
Prepared for:
RICHMOND DEPARTMENT OF ECONOMIC DEVELOPMENTPrepared at:
CENTER FOR URBAN AND REGIONAL ANALYSIS
L. DOUGLAS WILDER SCHOOL OF GOVERNMENT AND PUBLIC AFFAIRS
AT VIRGINIA COMMONWEALTH UNIVERSITY
REVISED MARCH 2019
921 W. Franklin Street • PO Box 842028 • Richmond, Virginia 23284-2028(804) 828-2274 • www.cura.vcu.edu

TABLE OF CONTENTS
EXECUTIVE SUMMARY ..........................................................................................................I ECONOMIC IMPACT KEY FINDINGS ................................................................................I FISCAL IMPACT KEY FINDINGS ...................................................................................... II
INTRODUCTION .....................................................................................................................1 BACKGROUND AND HISTORY ..........................................................................................1 SECTION 1: ECONOMIC IMPACT OF THE TEAM PERIOD (2013-2020) ..........................5 ECONOMIC IMPACT 101 ....................................................................................................5 THE ECONOMIC IMPACT MODEL ....................................................................................6 ECONOMIC IMPACT RESULTS .........................................................................................8
SECTION 2: FISCAL IMPACT ANALYSIS/ROI ....................................................................9 PART 1: COSTS ....................................................................................................................9 PART 2: BENEFITS ............................................................................................................11 FISCAL ANALYSIS COST-BENEFIT SUMMARY OF RESULTS ....................................22 RETURN ON INVESTMENT (ROI) ...................................................................................25 BENEFITS BEYOND 2033 .................................................................................................25
CONCLUSION .......................................................................................................................26 REFERENCES ........................................................................................................................i

■ ■ ■ ■ ■ ■ ■ ■ ■ ■ ■ ■ ■ ■ ■ ■ ■ ■ ■ ■ ■ ■ ■ ■ ■ ■ ■ I
EXECUTIVE SU
MM
ARY
EXECUTIVE SUMMARYThis report provides analyses of the economic activity related to the Washington Redskins Train-ing Center and associated Bon Secours investments in the East End and Westhampton areas of Richmond, Virginia. The study is comprised of two analyses:
• An economic impact analysis, estimating the economic impact to the City of Richmond of spending associated with the 2013 to 2020 team agreement period.
• A fiscal impact analysis to estimate the return on investment for the city through the life of financing (2013-2033).
- This section considers expenses compared against sources of revenue generated by the team, visitors, sponsor, and the city itself.
It should be noted as the scope of this project was strictly to document both the economic and investment impact, a cost-opportunity analysis was not conducted. All dollar values in this report are in the form of 2018 dollars unless otherwise stated.
ECONOMIC IMPACT KEY FINDINGSThe economic impact analysis was conducted to understand the direct, indirect, and induced impact on the Richmond economy. Economic impact analyses focus on project-related spending and the interconnected nature of businesses. Spending considered in this analysis included:
• Leigh Street Site construction spending • Training camp attendee spending• Training camp team spending• Leigh Street Site year-round opera-
tions• Team and sponsor philanthropy
A summary of inputs and outputs follow (all dollar figures are standardized to 2018 dollar values):
• CURA researchers estimate the total spending in Richmond related to the training center from 2013 to 20201 to be approximately $41,806,087. The breakdown of spending input share can be seen in Figure ES.1 to the right.
• The total estimated economic impact of the project from 2013 to 2020 is
1 Results for 2019-2020 are based on historic projections.
2.1%2.2%
6.8%
11.0%
11.1%
66.9%
Philanthropy (Team ) Philanthropy (Sponsor)
SMG Operations Team Spending
Construction Attendees
FIGURE ES.1: SHARE OF SPENDING BY CATEGORY

EXEC
UTI
VE S
UM
MA
RY
■ ■ ■ ■ ■ ■ ■ ■ ■ ■ ■ ■ ■ ■ ■ ■ ■ ■ ■ ■ ■ ■ ■ ■ ■ ■ ■ ■ ■ ■ ■ ■ ■ ■ ■ ■ ■ ■ II
$47,181,642. Given this value, hosting the Redskins training camp from 2013 to 2020 exhibits a 1.13 economic multiplier for the City of Richmond. This means that for every $1 spent in the City of Richmond, the city economy saw an overall impact of $1.13. For a full accounting of summary results, please refer to table ES.2 below.
TABLE ES.1: ESTIMATED ECONOMIC IMPACTS OF THE TRAINING CAMP TEAM AGREEMENTS 2013-2020
IMPACT TYPE
SUPPORTED EMPLOYMENT
ASSOCIATED LABOR INCOME
ECONOMIC IMPACT
Direct Effect 489 14,990,910 $31,352,678
Indirect Effect 55 $3,245,875 $9,061,770
Induced Effect 44 $2,376,806 $6,767,194
Total Effect 578 $20,613,591 $47,181,642
SOURCE: IMPLAN Pro™, VCU Center for Sport Leadership, Washington Redskins, City of Richmond, Bon Secours, SMG, CURA
FISCAL IMPACT KEY FINDINGSThe fiscal impact analysis focuses on costs and s in terms of revenue to the city rather than the spending considered in the economic impact analysis. The analysis covers three distinct time periods due to the structure of the economic development project:
• The period of the agreement with the Team (2013-2020)• The remaining period of the life of the Leigh Street loan (2021-2033)• Potential revenues and opportunities for Richmond beyond 2033
A summary of the key findings includes:
• Assuming an up-front cost of the Leigh Street Site financing, the initial period of the study, 2013 through 2020, is negative—that is, the costs of the project outweigh the new, additional revenues through 2020.
• The asset value of the Leigh Street site minus depreciation in 2020 is calculated to be $8,783,967.
• The second portion of the analysis (focused on the sponsor development activities more than the team) will provide additional revenues.
• The project is projected to be net positive beginning in 2023. • The return on investment (ROI) of the project from 2013 through 2033 is 102.4 percent.
The annualized ROI of the project is 3.4 percent over the 21-year observed period.
Beyond 2033 there are additional continuing revenues which add up to nearly $1,000,000 per year. In addition to these s, the city is and will continue to be in possession of an asset recently appraised at $17,050,000. This asset, the Leigh Street Site, is located in a rapidly developing area of Richmond, and its sale or redevelopment for other uses could drive the ROI of the project higher.
Table ES.2, on the following page, outlines detailed findings of CURA’s estimates.

■ ■ ■ ■ ■ ■ ■ ■ ■ ■ ■ ■ ■ ■ ■ ■ ■ ■ ■ ■ ■ ■ ■ ■ ■ ■ ■ III
EXECUTIVE SU
MM
ARY
TABLE ES.2: SUMMARY OF FISCAL ANALYSIS – COST- FOR TRAINING CAMP AND ASSOCIATED DEVELOPMENT AGREEMENTS (2013-2033)
CATEGORY
TEAM AGREEMENT
PERIOD (2013-2020)
REMAINING LIFE OF LOAN
PERIOD (2021-2033)
GRAND TOTAL
(2013-2033)
CIT
Y
Cost of Construction Loan Debt Service $(10,945,403) - $(10,945,403)
Contributions to Team $(2,926,332) - $(2,926,332)
Cash $(1,972,880) - $(1,972,880)
In-Kind $(953,452) - $(953,452)
Sponsorship Credit* $1,154,513 - $1,154,513
TOTAL COST $(13,871,735) - $(13,871,735)
CIT
Y TRG by Leigh Street Construction Spending $55,911 - $55,911
Net RG by SMG at Leigh Street Site $368,339 $1,497,542 $1,865,880
TEA
M
TRG by Training Camp Attendees $1,366,272 - $1,366,272
TRG by Team Spending $428,594 - $428,594
TRG by Visiting Media $39,479 - $39,479
TRG by Visiting Teams and Associated Media $38,763 - $38,763
SP
ON
SO
R
RG by Naming/Sponsorship Right Payments $3,526,844 - $3,526,844
RG by Naming/Sponsorship Right Payments to RPS $821,771 $189,308 $1,011,079
RG by BSHS Rent Payments† $2,237,215 $4,522,752 $6,759,967
TRG by BSHS Construction Activities - $336,649 $336,649
TRG by BSHS Real Estate Taxes $991,575 $7,874,078 $8,865,654
TRG by BSHS Westhampton Commercial - $2,855,568 $2,855,568
TRG by BSHS Westhampton Residential Spending - $927,917 $927,917
TOTAL REVENUES $9,874,762 $18,203,815 $28,078,577
NET BENEFIT (REVENUES MINUS COSTS) $(3,996,973) $18,203,815 $14,206,842
DEPRECIATED ASSET VALUE IN FINAL YEAR $8,783,967 $6,128,349 $6,128,349
NET BENEFIT AND ASSET VALUE $4,786,994 $24,332,164 $20,335,191
SOURCE: VCU Center for Sport Leadership, Washington Redskins, City of Richmond, Bon Secours, SMG, CURA NOTE: RG = Revenue Generation, TRG = Tax Revenue Generation* Sponsorship Credit is not included as a cost or a revenue as it is a credit not paid by the city which offsets payments to the team† RG by BSHS Rent Payments includes $28,000 (CY) payments for Westhampton field maintenance

CONFIDENTIAL DRAFT: NOT FOR CIRCULATION
■ ■ ■ ■ ■ ■ ■ ■ ■ ■ ■ ■ ■ ■ ■ ■ ■ ■ ■ ■ ■ ■ ■ ■ ■ ■ ■ ■ ■ ■ ■ ■ ■ ■ ■ ■ ■ ■ ■
PAGE LEFT INTENTIONALLY
BLANK

1
INTRO
DU
CTION
■ ■ ■ ■ ■ ■ ■ ■ ■ ■ ■ ■ ■ ■ ■ ■ ■ ■ ■ ■ ■ ■ ■ ■ ■ ■ ■
INTRODUCTIONIn 2017 the Center for Urban and Regional Analysis (CURA) was contracted by the City of Rich-mond Department of Economic Development (DED) to provide consulting services that objec-tively analyze the fiscal and economic impacts of the City of Richmond’s Washington Redskins pre-season training camp and of the associated Bon Secours investments.
The goal of this report is twofold:
• To provide a detailed look at the economic impact of the series of agreements that brought the Washington Redskins’ training camp to Richmond, Virginia. This economic impact considers money spent by the EDA to construct the facility, financial and devel-opment agreements with the Naming Sponsor, spending by the overall team in the city, spending by training camp attendees within the geographic confines of Richmond, VA, and team and sponsor philanthropy through the length of the initial training camp agree-ment with the team.
• To provide a fiscal return on investment (ROI) analysis for the city’s administration and the community at large. The ROI will provide the financial net loss or gain to Richmond’s that was and will be realized by hosting to the Washington Redskins’ training camp.
The nature of the relationships that brought the Richmond Redskins’ training camp to Richmond is complex. There are multiple partners and numerous legal agreements that outline their relation-ships. For these reasons, prior to the fiscal impact and economic impact estimates, CURA has created a Background and History section of this report that outlines the history, relationships, and legal and financial agreements that have brought us to this point.
Note: All dollar values in this report are in 2018 dollar values unless otherwise stated.
BACKGROUND AND HISTORYThere are multiple organizations involved in the operation of the Washington Redskins’ training camp. These organizations and their roles are identified as:
• Richmond Economic Development Authority (EDA) - enters commercial arrangements on behalf of the City of Richmond, leveraging its powers to incentivize commercial investment for job creation, community well-being, and economic growth. They work in partnership with City Council, the Mayor’s Administration, and state officials to align strategic investments in key industry clusters.
• Richmond Department of Economic Development (DED) – The Department of Economic Development (DED) is responsible for and dedicated to building the Richmond economy through traditional economic development programs with the goals of encouraging the long-term growth and development of the City of Richmond and maximizing the city’s assets and advantages without compromising the health of its neighborhoods and resi-dents.

INTR
OD
UCT
ION
■ ■ ■ ■ ■ ■ ■ ■ ■ ■ ■ ■ ■ ■ ■ ■ ■ ■ ■ ■ ■ ■ ■ ■ ■ ■ ■ ■ ■ ■ ■ ■ ■ ■ ■ ■ ■ ■ 2
• Washington Redskins Football Franchise (The Team) – A franchise of the National Foot-ball League (NFL) which, prior to 2013, held its training camp in Loudon County, Virginia before agreeing to move training camp to Richmond, Virginia.
• Bon Secours Health System (BSHS) – A not-for-profit Catholic health system based in Richmond, VA, sponsored by Bon Secours Ministries. Bon Secours is the Naming Spon-sor and year-round tenant of the Washington Redskins training camp, and, as the Nam-ing Sponsor, has agreed to additional development projects in Richmond’s Westhampton and East End neighborhoods.
• SMG World (SMG) – A venue management, marketing, and development firm that is contracted as the managing partner of the training camp site.
STAKEHOLDER ORGANIZATIONS’ AGREEMENTSThe previously summarized organizations’ relationships are legally defined by numerous agree-ments with EDA and DED. The legal agreements of the relationships are outlined here. These outlines attempt to succinctly summarize complex legal documents in order to provide context for the methodology in following sections. In no way are they representative of the entire scope of the agreements. Instead, they strive to highlight the nature of the organizational relationships which informed CURA’s analysis process.
EDA AND THE REDSKINS’ AGREEMENTS
The primary agreement between the EDA and the Washington Redskins Football Franchise is set forth by a legal document between the Economic Development Authority of the City of Rich-mond, Virginia (“the Authority” in this report referred to as “EDA”) and Pro-Football, Inc. (“the Company” in this report referred to as “the Team”) entered into on the 14th of February, 2013. The stipulations of the agreement are summarized as follows:
• For a term of 8 years the Washington Redskins will host training camp in Richmond, VA. For this 8-year term the city will pay $500,000 per year to the Redskins Team to cover the costs of training camp. The payments can be made in cash or in goods and services (lodging, meals, transportation, security, etc.) as long as both parties agree to the credit. The agreement also outlines the terms of sponsorship into Crediting Company Sponsor-ships for which 10% of the value of the annual sponsorship fee shall be credited to the EDA. Additionally the agreement outlines Authority Sponsorships for which there is no obligation, monetary or otherwise, to the Redskins.
EDA AND BSHS’ AGREEMENTS
The agreements between the EDA and BSHS are primarily governed by four contracts which commenced on the 8th of July, 2013. They include: Naming Rights Agreement, Performance Agreement, the Deed of Ground Lease (5800 Patterson Avenue), and the Deed of Ground Lease (Bon Secours Washington Redskins Training Center). The agreements in the scope of these con-tracts go beyond requirements exclusively for the site of training camp and have impacts across the city. The stipulations of the agreements are summarized as follows:

3
INTRO
DU
CTION
■ ■ ■ ■ ■ ■ ■ ■ ■ ■ ■ ■ ■ ■ ■ ■ ■ ■ ■ ■ ■ ■ ■ ■ ■ ■ ■
• The Naming Rights Agreement is a sponsorship agreement between EDA and BSHS. It stipulates that BSHS will be the naming sponsor, with all associated opportunities for the total amount of $3,325,000 which will be paid in four payments of $831,250 on March 15 of 2013 through 2016. The agreement outlines the designation of the building name, logos, use of the fields when training camp is not operating, intellectual property rights, and sign specifications.
• The Performance Agreement outlines the commitments of EDA and BSHS to devel-op the Richmond Community Hospital (RCH) Project as well as the Westhampton School Project. According to the agreement BSHS will expand their East End hos-pital site by a minimum of 25,000 square feet with an associated minimum cost of $8,500,000. This expansion must create 75 new full time equivalent (FTE) jobs with a minimum of $6,700,000 in annual payroll. This agreement also outlines the require-ments of the Westhampton School Project on land that is currently owned by the city. BSHS is required to construct a minimum of 75,000 square feet, at a minimum cost of $24,000,000, which will create approximately 120 FTEs at a minimum of $10,800,000 in payroll. In September 2018, BSHS announced that the Westhampton project will have a cost of $53,000,000, more than double the minimum cost required by the Performance Agreement. This agreement also outlines an annual $100,000 payment to Richmond Public School for a ten-year period.
• The Deed of Ground Lease (5800 Patterson Avenue) is a landlord/tenant agreement between EDA and BSHS that rents the land of the Westhampton School Site to BSHS. The rent is $5,000 per year for the first sixty years with two renewal terms of 20 years each with increases in rent included in the renewal terms. BSHS is also required to pay $28,000 annually for the maintenance of the playing field on the leased site. These main-tenance payments will cease after the initial period.
• The Deed of Ground Lease (Bon Secours Washington Redskins Training Center) outlines the landlord/tenant agreement between the EDA and BSHS. The initial term of the lease is for 10 years with a base monthly rent of $22,916.67. There are additionally two five-year renewal terms which will include a 3% annual rent increase.
EDA AND SMG’S AGREEMENTS
The agreements between EDA and SMG outlines the management services provided by SMG to EDA for the Redskins training camp site. SMG does not directly manage the training camp itself, but other activities on the site when training camp is not in sessions. The agreement was signed on August 13th, 2013. The stipulations of the agreement are summarized as follows:
• The initial term of the management agreement is for 5 years. The initial annual cost of the management services shall be $85,000 for the first year and will increase 1% each subsequent year of the initial term. EDA, at its sole discretion may renew the agreement for another 5 years with the same terms including the 1% service fee increase. SMG is also entitled to 20% of the net revenues of non-fundraising events under incentive fee agreements.

INTR
OD
UCT
ION
■ ■ ■ ■ ■ ■ ■ ■ ■ ■ ■ ■ ■ ■ ■ ■ ■ ■ ■ ■ ■ ■ ■ ■ ■ ■ ■ ■ ■ ■ ■ ■ ■ ■ ■ ■ ■ ■ 4
FACILITY CONSTRUCTION AND FUNDING OF THE LEIGH STREET SITEThe training facility, located at 2401 West Leigh Street, is comprised of a 15-acre sports medicine and training facility which includes two practice fields, one drill field, and a field house designed to accommodate the needs of BSHS and the Team. The development of the site was funded by the EDA on land that was previously owned by the Commonwealth of Virginia. The development was contracted to Richmond’s Hourigan Construction, at a total cost of $9,489,223 (CY).
In order to fund construction, the city took out a $10 million PNC Variable Rate Loan (Series 2013C GO Bond) in November 2013 which was due in full in September 2018. The city made regular pay-ments on the interest of this loan totaling $445,324. Additionally, principal curtailment payments were made for $500,000 (CY) each in 2015, 2016, 2017, and 20181 totaling $2,000,000 (CY). Cu-mulatively, the city has payed $1,945,324 (CY) on the initial loan.
In February 2018 the loan was refinanced. With $8.6 million in debt, Richmond City Council voted to refinance the initial loan committing to payments between $536,539 (CY) and $737,050 (CY) annually for 15 years. Together, total payments will amount to $10,945,403 in 2018 adjusted dol-lars.
1 This payment was made by the EDA to city near the end of the 2018 calendar year. Given the date of this report the pay-ment has not been placed towards the loan. Total payments from the DED on the loan in the near future will amount to $ 2,445,324 (CY).

5
ECON
OM
IC IMPA
CT
■ ■ ■ ■ ■ ■ ■ ■ ■ ■ ■ ■ ■ ■ ■ ■ ■ ■ ■ ■ ■ ■ ■ ■ ■ ■ ■
SECTION 1: ECONOMIC IMPACT OF THE TEAM PERIOD (2013-2020)The agreements set forth allowing the Team to host a training camp in Richmond outlined future sponsor developments with the intent of positively impacting Richmond’s economy. The purpose of this section of the report is to estimate the impact of these activities through the team agree-ment period (2020) on the City of Richmond’s economy.
CURA identified two previous studies on the economic impact of the training camp: one by Chmura Economic & Analytics in 2012 which projected economic impact for 2013 and one by the Center for Sport Leadership at Virginia Commonwealth University. These reports projected and estimated a total impact of $8.5 million dollars and $10.5 million dollars, respectively, in the Richmond region.
The approach taken by CURA differs considerably from these previous economic impact reports. While previous reports have sought to determine the economic impact of spending associated with training camp in the Richmond region, this report takes a broader view of the process while focusing on impacts to the City of Richmond.
The following categories were considered in our economic impact estimates:
• Leigh Street Site construction spending • Training camp attendee spending• Training camp team spending• Leigh Street Site year-round operations• Team and sponsor philanthropy
ECONOMIC IMPACT 101This section of the report uses economic input-output analysis to illustrate the impact generated by activities to date and in the future associated with the training camp and associated develop-ment agreements through 2020. An input-output model measures the economic impact of an activity or entity by looking at the spending that goes into the activity, modeling the resultant economic output in dollars, and feeding those dollars into the model as an input for economically linked business sectors.
These economic linkages may be best described as an interconnected network, including suppli-ers manufacturers, retailers, and customers. When one part of the network increases or decreas-es production, it sends a pulse that is felt in other parts of the network, forwards and backwards. To better understand this concept, let’s consider a relatively simple example: a cup of coffee. Consider the sourcing of those beans, which then go to a roaster, which then must be marketed, sold, stored, transported, prepared, and sold. Along this process there are numerous govern-ments, industries, and employees involved. Even a cup of coffee is complex when it comes to calculating its economic impact.

ECO
NO
MIC
IMPA
CT
■ ■ ■ ■ ■ ■ ■ ■ ■ ■ ■ ■ ■ ■ ■ ■ ■ ■ ■ ■ ■ ■ ■ ■ ■ ■ ■ ■ ■ ■ ■ ■ ■ ■ ■ ■ ■ ■ 6
Using a software tool called IMPLAN Pro™, which is based on an input-output (I-O) model de-scribing production linkages of the economy, researchers can see what happens to the economy (local, regional, or national) when different inputs are considered. These inputs can be in the form of new jobs, adjustments in industry spending, government policies, and more. These inputs, af-ter appropriate modeling and assumptions, are then processed through socio-economic matrices of relationships to provide economic output.
I-O outputs tables like those modeled in IMPLAN Pro™ generate a variety of economic outcomes at multiple levels (direct, indirect, and induced) which create the total economic impact of an out-put. However, for the sake of simplicity and clarity, this report will be focused on the total impact of the activities connected with the development of the Washington Redskins Training Camp and associated development in the East End and Westhampton areas of the city. The results are presented in terms of:
• Economic Output – The entire value of goods and services produced as a result of inputs• Supported Jobs – The total number of full-time equivalent employees whose income
relies on these inputs• Labor Income (Wages) – The combined pay of employees whose income relies on these
inputs
THE ECONOMIC IMPACT MODELThe model used to determine the economic impact of the training camp agreements is com-prised of three main pillars:
• The Region• The Activity Type• The Input
THE REGIONThe region defines the relevant, or most appropriate, geography for the analysis. I-O can be per-formed at various scales from a ZIP code to a metropolitan statistical area (MSA), state, or coun-try. In this analysis we are specifically interested in the impacts to the City of Richmond. For this report, the region was defined to include solely the City of Richmond.
Due to the complexity of industry linkages, which often cross geo-political boundaries, there may be economic impacts from the selected inputs that occur outside of the region (economic leakages). However, for the sake of this analysis we are only interested in the impact to the City of Richmond.
THE ACTIVITY TYPEI-O models can include a wide variety of changes in economic activity. Activity types can include changes in industry spending, variations in the price of commodities, or differences in institutional spending patterns. This model’s focus is on the impacts of industry spending estimated by the training camp agreements. For this reason, the model utilizes an Industry Change activity type.

7
ECON
OM
IC IMPA
CT
■ ■ ■ ■ ■ ■ ■ ■ ■ ■ ■ ■ ■ ■ ■ ■ ■ ■ ■ ■ ■ ■ ■ ■ ■ ■ ■
THE INPUTHaving defined our region and our activity type we now turn to the input. In the case of the train-ing camp model, the input is money spent by the city, camp attendees, the Team, and the spon-sor from 2013 through 2020. All inputs that occurred or are anticipated to occur within the years 2013 to 2020 are specific to the City of Richmond (i.e. all spending happening outside the city is considered economic leakage, and therefore not included in our economic model). An important note about these inputs is that all values are standardized to 2018 dollars in this report, for the purposes of normalizing the inputs for IMPLAN Pro™.
The total estimated spending from 2013 through 2020 associated with the training camp activi-ties is $49,978,789. A breakdown of the percentage of each category can be seen in Figure 1.1.
FIGURE 1.1: SHARE OF SPENDING BY CATEGORY2.1%
2.2%
6.8%
11.0%
11.1%
66.9%
Philanthropy (Team ) Philanthropy (Sponsor)
SMG Operations Team Spending
Construction Attendees

ECO
NO
MIC
IMPA
CT
■ ■ ■ ■ ■ ■ ■ ■ ■ ■ ■ ■ ■ ■ ■ ■ ■ ■ ■ ■ ■ ■ ■ ■ ■ ■ ■ ■ ■ ■ ■ ■ ■ ■ ■ ■ ■ ■ 8
ECONOMIC IMPACT RESULTS The estimated overall economic impact of the training camp from 2013 through 2020 is $47,181,642. It is estimated that 578 FTE jobs are supported in the city by this activity with a total associated labor income of $20,613,591. The estimated results of the economic impact analysis are reported in Table 1.1 below.
TABLE 1.1: ESTIMATED ECONOMIC IMPACTS OF THE TRAINING CAMP AGREEMENTS 2013-2020
IMPACT TYPE
SUPPORTED FTE EMPLOYMENT
ASSOCIATED LABOR INCOME
ECONOMIC IMPACT
Direct Effect 489 14,990,910 $31,352,678
Indirect Effect 55 $3,245,875 $9,061,770
Induced Effect 44 $2,376,806 $6,767,194
Total Effect 578 $20,613,591 $47,181,642
SOURCE: IMPLAN Pro™, VCU Center for Sport Leadership, Washington Redskins, City of Richmond, Bon Secours, CURA
Given the calculated input value of $41,806,087 and an estimated total economic impact of $47,181,642, this analysis concludes that the project has a 1.13 economic impact multiplier. This means that for every $1 spent in the City of Richmond, the city economy saw an overall impact of $1.13.
Based on the nature of spending and their estimated impacts, most of the jobs supported by training camp spending occurs in the service industry. For aggregated results of supported jobs, please see Table 1.2.
TABLE 1.2: JOB SUPPORT BY AGGREGATED INDUSTRY
DESCRIPTION DIRECT INDIRECT INDUCED TOTAL
Total 489.2 44.9 44.0 578.1
Service 368.3 32.2 33.8 434.3
Trade 108.6 3.7 7.6 119.9
Construction 10.6 1.1 0.5 12.2
TIPU* 0.6 5.6 1.5 7.7
Government 0.0 1.8 0.5 2.4
Manufacturing 1.0 0.5 0.1 1.6
SOURCE: IMPLAN Pro™, VCU Center for Sport Leadership, Washington Redskins, City of Richmond, Bon Secours, CURA*TIPU - Transportation, information, and public utilities

9
FISCAL IM
PACT/RO
I
■ ■ ■ ■ ■ ■ ■ ■ ■ ■ ■ ■ ■ ■ ■ ■ ■ ■ ■ ■ ■ ■ ■ ■ ■ ■ ■
SECTION 2: FISCAL IMPACT ANALYSIS/ROIThis section of the report will detail the estimated fiscal impact to the city in three distinct time periods:
• The period of the agreement with the Team (2013-2020)• The remaining period of the Leigh Street development financing (2021-2033)• Potential opportunities for Richmond beyond 2033
The fiscal impact analysis aims to answer whether the agreements that brought the Team training camp to Richmond and associated development agreements with BSHS were or will be benefi-cial to the city financially on a net basis.
To answer this question, researchers at CURA performed a fiscal impact analysis that examines city expenses to construct the site and payments to the Team in the form of cash or in-kind goods and services. This negative value (cost) is then compared to the total city tax, rent, direct, and oth-er revenues (benefits) attestable to the Team training camp and associated BSHS development activities outlined in the agreements.
PART 1: COSTS1.1 CONSTRUCTIONBased on the data provided by DED, Richmond City Finance Staff, and Hourigan Construction, it was determined that the total cost for financing the Leigh Street development amounts to $12,076,452. While this amount is paid periodically over the initial construction loan and the subsequent refinancing through 2033, for the purpose of this analysis, it is treated as a one-time cost. This will allow our analysis to provide a ‘break-even year’ in which the total cost is surmounted by the total revenue.
TABLE 2.1 – COST OF CONSTRUCTION LOAN DEBT SERVICE (UP-FRONT DEBT)
TEAM AGREEMENT PERIOD (2013-2020)
$10,945,403
SOURCE: City of Richmond, CURA
The entire cost of the loans from 2013-2033 are both included in the Team Agreement Period (2013-2020) period. This value includes actual values for payments made to date and the assump-tion that regular payments will be made annually.

FISC
AL
IMPA
CT/R
OI
■ ■ ■ ■ ■ ■ ■ ■ ■ ■ ■ ■ ■ ■ ■ ■ ■ ■ ■ ■ ■ ■ ■ ■ ■ ■ ■ ■ ■ ■ ■ ■ ■ ■ ■ ■ ■ ■ 10
1.2 CONTRIBUTIONS TO THE TEAMContributions to the Team in the amount of $500,000 (CY) annually for 2013-2020 were stipulated in the aforementioned agreements. These payments include cash, in-kind, and sponsorship credit payments. As the sponsorship credit payments come at no cost to the city, they were removed from calculations of city payments.
For years 2013-2017, cash, in-kind, and sponsorship payments were calculated using actual values provided by DED in the Leigh Street Development Project Audit (City Auditor’s Office, 2018). Addi-tional future payments (2018-2020) were calculated based on averages derived from previous real values with consideration given for deferred payments. The results of costs to the city paid to the team can be viewed in Table 2.3 below. The final row, ‘Total Without Sponsorship Credit’ reflects the total cost of goods and services paid from the city to the Team.
TABLE 2.3 – COST OF CONTRIBUTIONS TO THE TEAM
CONTRIBUTION CATEGORY
TEAM AGREEMENT PERIOD (2013-2020)
Cash $(1,972,880)
In-Kind $(953,452)
Sponsorship Credit $1,154,513
Total with Sponsorship Credit ($4,080,845)
Total without Sponsorship Credit $(2,926,332)
SOURCE: City of Richmond
TOTAL COSTSThese two sub-categories, construction loan debt service and payments to team, include the costs associated with the agreements for the city. While there are additional costs associated with SMG’s management of the site, when aggregated they are net positive (more on this in a later section). The total costs of the agreements can be seen in Table 2.4.
TABLE 2.4 – TOTAL COSTS
TEAM AGREEMENT PERIOD (2013-2020)
$(13,871,735)

11
FISCAL IM
PACT/RO
I
■ ■ ■ ■ ■ ■ ■ ■ ■ ■ ■ ■ ■ ■ ■ ■ ■ ■ ■ ■ ■ ■ ■ ■ ■ ■ ■
PART 2: BENEFITS2.1 TAX REVENUE GENERATED BY LEIGH STREET CONSTRUCTION SPENDINGThe construction of the Leigh Street site generated revenues for the city in the form of sales taxes. Sales taxes were calculated by applying a one (1) percent sales tax rate to all expenditures for construction which were made with contractors located in the City of Richmond (roughly 55 percent of the total construction cost). Construction expenditures were detailed by Hourigan Con-struction and provided by DED. The results of construction sales tax can be viewed in Table 2.5.
TABLE 2.5 – TAX REVENUE GENERATED BY LEIGH STREET CONSTRUCTION SPENDING
TEAM AGREEMENT PERIOD (2013-2020)
$55,911
SOURCE: City of Richmond, CURA
2.2 NET REVENUE GENERATED BY SMG MANAGEMENT OF THE LEIGH STREET SITEEDA contracted with SMG Worldwide, a venue management company, to manage operations of the site outside of Bon Secours’ and the Team’s uses of the site. The events occurring outside of the time of training camp include private receptions, college, high school, and youth sports events, as well as concerts. SMG provided accounting ledgers for their operation of the site out-side of the training camp as well as their operation of the Second Floor area during training camp for 2014 through 2017 with projections for 2018. Utilizing these data points, researchers at CURA projected the site’s operational income to the city after management fees and additional costs. It should be noted that there are two years where the site failed to turn an annual profit. One of these years was the first year of operation in 2014 and the second year was projected for 2018. The total historic and projected revenues to the city by operating events at the site are detailed in Table 2.6.
TABLE 2.6 – REVENUE GENERATED BY SMG MANAGEMENT OF THE LEIGH STREET SITE
TEAM AGREEMENT PERIOD (2013-2020)
REMAINING LIFE OF LOAN PERIOD (2021-2033)
$368,339 $1,497,542
SOURCE: SMG, CURA

FISC
AL
IMPA
CT/R
OI
■ ■ ■ ■ ■ ■ ■ ■ ■ ■ ■ ■ ■ ■ ■ ■ ■ ■ ■ ■ ■ ■ ■ ■ ■ ■ ■ ■ ■ ■ ■ ■ ■ ■ ■ ■ ■ ■ 12
2.3 TAX REVENUE GENERATED BY TRAINING CAMP ATTENDEESVisitors to the Team’s training camp spend money in Richmond, generating additional tax reve-nues for the city. Training camp attendee taxes were calculated in a multi-step process for sales, meals, lodging, and admissions tax. To calculate taxes for attendees CURA followed several methodological steps:
A. Total number of visitors attending training camp by year
Based on data provided by the Team, the total attendance to the camp from 2013 through 2018 is displayed in Table 2.7, below. 2019 and 2020 have an assumed pro-jections that attendance will remain at 2018 levels as formulaic projection methods that take into account all completed years of attendance project negative atten-dance in 2019.
TABLE 2.7 – TEAM TRAINING CAMP ANNUAL TOTAL ATTENDEES (NON-UNIQUE)
YEAR TOTAL ATTENDEES (NON-UNIQUE)
2013 165,571
2014 167,749
2015 80,888
2016 45,100
2017 30,430
2018 33,759
2019* 33,759
2020* 33,759
Total 591,015
SOURCE: Washington Redskins, VCU Center for Sport Leadership, CURA * - Projected
B. Total number of attendees that were unique adult visitors annually
Due to the temporal nature of this project and delays in data provision, an updated survey of attendees was not feasible. As a proxy, data was collected from the VCU Center for Sport Leadership’s Economic Impact Report – Washington Redskins Training Camp. Included in the report was a survey measuring the amount and types of attendees to the training camp in 2013. This survey determined that 24.9 percent of the total attendance were unique attendees (individual persons who attended). Applying this coefficient to the Total Attendees (Non-Unique) provides us with the total unique attendees annually and is displayed in Table 2.8.

13
FISCAL IM
PACT/RO
I
■ ■ ■ ■ ■ ■ ■ ■ ■ ■ ■ ■ ■ ■ ■ ■ ■ ■ ■ ■ ■ ■ ■ ■ ■ ■ ■
TABLE 2.8 – TEAM TRAINING CAMP ANNUAL TOTAL UNIQUE ATTENDEES
YEAR TOTAL ATTENDEES (UNIQUE)
2013 41,258
2014 41,801
2015 20,156
2016 11,238
2017 7,583
2018 8,412
2019* 8,412
2020* 8,412
Total 147,273
SOURCE: Washington Redskins, VCU Center for Sport Leadership, CURA * Projected
C. The total number of local, non-local, and overnight visitors
Different categories of visitors produce different spending patterns, so CURA es-timated the total number of visitors within each category. According to the VCU Center for Sport Leadership 2013 survey, of all unique adult visitors, 10.5 percent were adult overnight visitors, 36.7 percent were adult day visitors, and 29.4 per-cent were adult local visitors. The remaining 23.5 percent were unique children visitors1.
Feedback from a number of professionals associated with the economic devel-opment deal indicated that the shares of attendees by type in 2013 are no longer representative. CURA adjusted the shares in consideration of falling overall atten-dance and a reduction in out of town visitors to ensure a conservative estimate of attendee impacts as a share of visitors.
The adjustment is based on the assumption that by 2020, overnight and day at-tendees (those from outside of the MSA) will have dropped 75 percent from their 2013 levels. This loss in out of town attendance share is replaced by local attend-ees. For example, overnight attendees accounted for 13.7 percent of all attenance in 2013, but were estimated to account for 6.3 percent of all visitors in 2018 and 3.4 percent of all attendees in 2020.
Although this may seem like a major assumption, the nature of limited attendance in recent years means that these share shifts have a relatively small impact when compared with earlier training camps (i.e., 2013-2015).
The totals by category of visitor annually are displayed in Table 2.9 on the following page.
1 Unique children’s visitor’s spending was not considered directly as survey data spending was collected for adults whose spending included children.

FISC
AL
IMPA
CT/R
OI
■ ■ ■ ■ ■ ■ ■ ■ ■ ■ ■ ■ ■ ■ ■ ■ ■ ■ ■ ■ ■ ■ ■ ■ ■ ■ ■ ■ ■ ■ ■ ■ ■ ■ ■ ■ ■ ■ 14
TABLE 2.9 – TEAM TRAINING CAMP ANNUAL TOTAL UNIQUE ATTENDEES
YEAR TOTAL UNIQUE ATTENDEES
UNIQUE OVER-NIGHT ATTENDEES
UNIQUE DAY ATTENDEES
UNIQUE LOCAL ATTENDEES
2013 41,258 5,642 19,773 15,843
2014 41,801 5,101 17,889 18,810
2015 20,156 2,163 7,592 10,401
2016 11,238 1,041 3,657 6,541
2017 7,583 591 2,079 4,914
2018 8,412 531 1,874 6,006
2019* 8,412 408 1,443 6,562
2020* 8,412 286 1,009 7,117
Total 147,273 15,763 55,317 76,193
SOURCE: Washington Redskins, VCU Center for Sport Leadership, CURA * - Projected
D. Amount spent by unique adult visitors annually by attendee category
With total adult attendees by category calculated, we now turn to the spending patterns of these unique adult attendees. Spending patterns are displayed in Table 2.10 below.
TABLE 2.10 – TEAM TRAINING CAMP ATTENDEE AVERAGE TRIP SPENDING
SPENDING CATEGORY
OVERNIGHT ATTENDEE SPENDING
DAY ATTENDEE SPENDING
LOCAL ATTENDEE SPENDING
Lodging $360.52 - -
Full Service Restaurants $122.42 $32.11 $17.11
Fast Food Restaurants $48.71 $26.18 $15.09
Grocery $25.23 $7.25 $9.83
Entertainment $22.43 $2.99 $7.24
Training Camp Merchandise $116.26 $71.18 $73.06
Shopping $90.47 $11.94 $16.12
Training Camp Food/Concessions $29.20 $20.74 $22.02
Gasoline $57.32 $33.09 $26.46
Rental Car $21.87 $5.73 $0.36
Bars & Nightlife $28.31 $2.92 $9.83
Other Expenditures $16.09 $2.77 $1.66
Parking $16.87 $9.64 $9.78
Total $955.69 $226.53 $208.57
SOURCE: VCU Center for Sport Leadership
15
FISCAL IM
PACT/RO
I
■ ■ ■ ■ ■ ■ ■ ■ ■ ■ ■ ■ ■ ■ ■ ■ ■ ■ ■ ■ ■ ■ ■ ■ ■ ■ ■
E. Discounting out-of-study area purchases
Table 2.11, on the previous page, represents the total spending of unique adult visitors. Not all of this spending can be considered in the model because not all of it occurs within Richmond. For example:
• Rental car spending of overnight unique adult attendees occurs at their origin, so this category is discounted entirely;
• Gas purchases for day unique adult attendees do not occur entirely in Rich-mond, so this value is halved;
• Not all overnight visitors stay in city lodging. Utilizing 2013 attendee survey data, it was determined that 72 percent of overnight attendees stayed at ho-tels in Richmond. This 72 percent figure also reduced associated expenses, including dining, shopping, and more;
• Training camp merchandise and food/concessions occur entirely within Rich-mond, so their entire value is considered.
These discount percentages create coefficients for spending that ensure conser-vative estimates of revenue to the city.
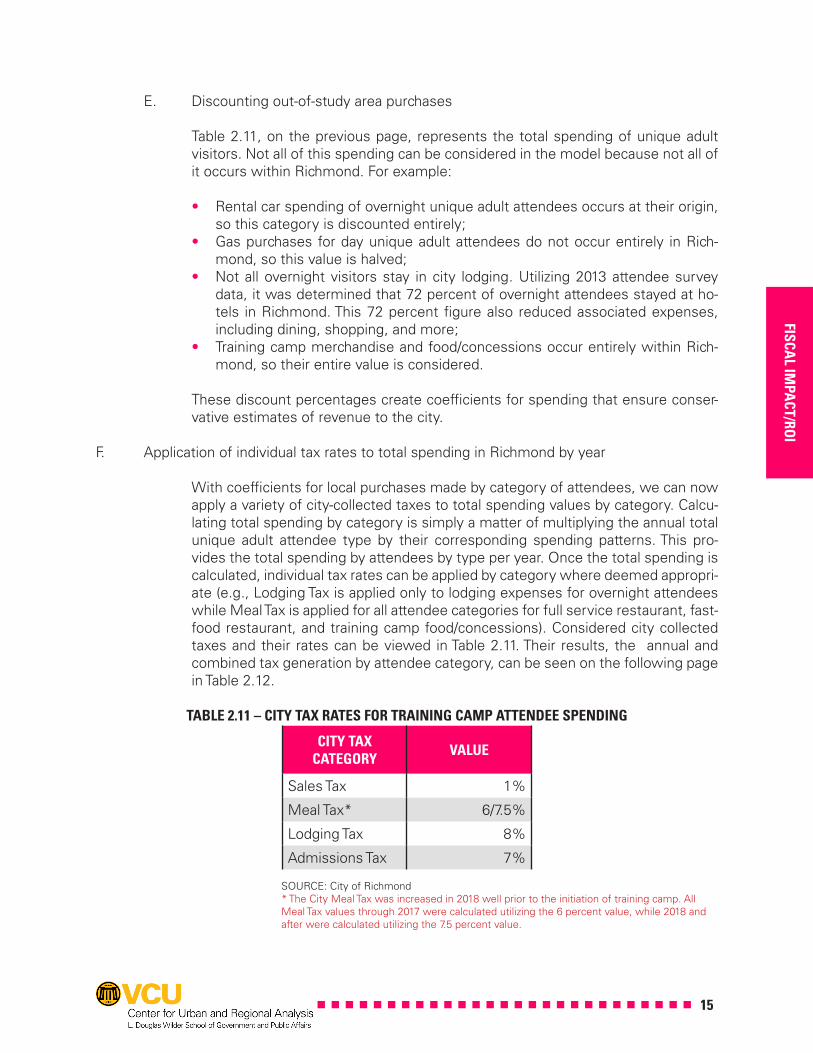
F. Application of individual tax rates to total spending in Richmond by year
With coefficients for local purchases made by category of attendees, we can now apply a variety of city-collected taxes to total spending values by category. Calcu-lating total spending by category is simply a matter of multiplying the annual total unique adult attendee type by their corresponding spending patterns. This pro-vides the total spending by attendees by type per year. Once the total spending is calculated, individual tax rates can be applied by category where deemed appropri-ate (e.g., Lodging Tax is applied only to lodging expenses for overnight attendees while Meal Tax is applied for all attendee categories for full service restaurant, fast-food restaurant, and training camp food/concessions). Considered city collected taxes and their rates can be viewed in Table 2.11. Their results, the annual and combined tax generation by attendee category, can be seen on the following page in Table 2.12.
TABLE 2.11 – CITY TAX RATES FOR TRAINING CAMP ATTENDEE SPENDING
CITY TAX CATEGORY VALUE
Sales Tax 1%
Meal Tax* 6/7.5%
Lodging Tax 8%
Admissions Tax 7%
SOURCE: City of Richmond* The City Meal Tax was increased in 2018 well prior to the initiation of training camp. All Meal Tax values through 2017 were calculated utilizing the 6 percent value, while 2018 and after were calculated utilizing the 7.5 percent value.

FISC
AL
IMPA
CT/R
OI
■ ■ ■ ■ ■ ■ ■ ■ ■ ■ ■ ■ ■ ■ ■ ■ ■ ■ ■ ■ ■ ■ ■ ■ ■ ■ ■ ■ ■ ■ ■ ■ ■ ■ ■ ■ ■ ■ 16
TABLE 2.12 – TRAINING CAMP ATTENDEE TAX GENERATION BY CATEGORY
YEAR ATTENDEE SALES TAX
ATTENDEE MEALS TAX
ATTENDEE LODGING TAX
ATTENDEE ADMISSIONS TAX
2013 $109,415 $181,868 $126,109 $16,301
2014 $105,526 $174,819 $112,248 $16,247
2015 $49,190 $81,199 $47,642 $7,835
2016 $26,098 $42,914 $22,611 $4,306
2017 $16,549 $27,100 $12,519 $2,833
2018 $17,303 $35,257 $11,036 $3,076
2019* $16,364 $33,181 $8,337 $3,027
2020* $15,457 $31,166 $5,758 $2,980
Subtotal $355,903 $607,503 $346,260 $56,606
Grand Total $1,366,272
SOURCE: Washington Redskins, VCU Center for Sport Leadership, City of Richmond, CURA
* - Projected
The summary of total city tax revenue generation by training camp attendee spending can be viewed in Table 2.13.
TABLE 2.13 – TAX REVENUE GENERATED BY TRAINING CAMP ATTENDEES
TEAM AGREEMENT PERIOD (2013-2020)
$1,366,272
2.4 TAX REVENUE GENERATED BY TEAM SPENDINGThe Team, in staying for an extended period of time in the City of Richmond, spends money lo-cally on purchases. These purchases generate additional tax revenue for the city. Based on data provided by the Team for 2013 through 2016, taxes were calculated and aggregated into three categories which are detailed in Table 2.14 on the following page. For years where data requests were not fulfilled and for the years of the Team’s term yet to be completed, linear projection was utilized to forecast tax revenues.

17
FISCAL IM
PACT/RO
I
■ ■ ■ ■ ■ ■ ■ ■ ■ ■ ■ ■ ■ ■ ■ ■ ■ ■ ■ ■ ■ ■ ■ ■ ■ ■ ■
TABLE 2.14 – TRAINING CAMP TEAM TAX GENERATION BY CATEGORY
YEAR TEAM SALES TAX TEAM MEALS TAX TEAM LODGING TAX
2013 $8,480 $22,130 $35,663
2014 $6,882 $20,620 $24,932
2015 $7,154 $21,099 $26,352
2016 $7,499 $21,156 $28,022
2017* $6,738 $20,300 $23,110
2018* $6,937 $20,269 $24,268
2019* $6,760 $19,957 $22,812
2020* $6,544 $19,671 $21,239
Subtotal $56,993 $165,203 $206,397
Grand Total $428,594
SOURCE: Washington Redskins, CURA* - Projected
A summary of this data for the fiscal impact analysis cost-benefit is shown in Table 2.15.
TABLE 2.15 – TAX REVENUE GENERATED BY TEAM SPENDING
TEAM AGREEMENT PERIOD (2013-2020)
$428,594
2.5 TAX REVENUE GENERATED BY VISITING MEDIAThe Team provided data on the total number of individual media requests for 2016 and 2017. These two data points of 61 and 67 media members were averaged as a proxy for years where data was not made available and for the remaining training camp years. These media requests were made for the full length of the 13-day training camp period.
Local media was excluded from this analysis as their spending is not considered to be generated by training camp activities. To ensure accurate and conservative estimates of Team media’s fiscal impact, some media members were discounted based on assumptions of local media atten-dance.2 This provided an annual value of non-local media members which ranged between 46 and 52 total.
Spending values were then prepared to calculate total tax generation. These values were based on the spending patterns of business travel over 50 miles to Virginia (Virginia Tourism Corporation, 2017). This data provided the total spending by category for visiting media members. Tax revenue was generated by pairing these values with their respective tax percentages (listed in Table 2.11). It was determined that the daily tax generation for each visiting media member was $7.75. The total of the team’s visiting media members can be seen in Table 2.16.
2 Four local television news entities with 2 staff members each, 2 local radio sports news entities with 2 staff members each, 3 local print news entities with 1 staff member each for a total of 15 local media members were subtracted from the total value of media members.

FISC
AL
IMPA
CT/R
OI
■ ■ ■ ■ ■ ■ ■ ■ ■ ■ ■ ■ ■ ■ ■ ■ ■ ■ ■ ■ ■ ■ ■ ■ ■ ■ ■ ■ ■ ■ ■ ■ ■ ■ ■ ■ ■ ■ 18
TABLE 2.16 – TAX REVENUE GENERATED BY VISITING MEDIA
TEAM AGREEMENT PERIOD (2013-2020)
$39,479
SOURCE: Washington Redskins, City of Richmond, CURA
2.6 TAX REVENUE GENERATED BY VISITING TEAMS AND ASSOCIATED MEDIA SPENDINGThe Team holding training camp in Richmond attracted other teams for joint practices and scrim-mages. These teams included the New York Jets in 2018, the Houston Texans in 2015, and the New England Patriots in 2014. Each of these teams spent three nights in Richmond along with their associated media members.
To calculate the tax impact from visiting teams, the average daily tax generation of the host team was used as a proxy. It was determined that the host team spends $4,121 daily on a variety of taxes previously outlined. This daily tax generation was applied to each teams’ total amount of nights spend in Richmond and totals $37,090.
Visiting teams bring team staff and additional media members to Richmond. The host team’s media analysis was used as a proxy to determine the daily impact of media members. The team was only able to confirm the total media members for one visiting team, the New York Jets in 2018, with 24 additional media. This value of 24 was used as a proxy for visits by the Texans and Patriots. Unlike the host team’s media, visiting teams’ media members were not discounted as they were assumed to all visit from out of town. The average tax generation calculated from busi-ness visitor spending data provided by Virginia Tourism Corporation of $7.75 was used to calculate the total fiscal impact of visiting teams’ media members. The total impact of visiting team media members was estimated to be $1,673.
The total revenue of visiting teams and their associated media members is detailed in Table 2.17 below.
TABLE 2.17 – TAX REVENUE GENERATED BY VISITING TEAMS AND ASSOCIATED MEDIA SPENDING
TEAM AGREEMENT PERIOD (2013-2020)
$38,763
SOURCE: Washington Redskins, City of Richmond, CURA
It is possible that additional visiting teams for the 2019 and 2020 training camps may increase this number, but future visiting teams are thus far unconfirmed.
2.7 REVENUE GENERATED BY NAMING/SPONSORSHIP RIGHT PAYMENTSBon Secours served as the Naming Sponsor of the city’s hosting Team, according to the Nam-ing Rights Agreement between EDA and Bon Secours. This included four payments totaling $3,325,000 (CY) from 2013 through 2016. The total in 2018 dollars is presented in Table 2.18.

19
FISCAL IM
PACT/RO
I
■ ■ ■ ■ ■ ■ ■ ■ ■ ■ ■ ■ ■ ■ ■ ■ ■ ■ ■ ■ ■ ■ ■ ■ ■ ■ ■
TABLE 2.18 – REVENUE GENERATED BY NAMING/SPONSORSHIP RIGHT PAYMENTS
TEAM AGREEMENT PERIOD (2013-2020)
$3,526,844
SOURCE: City of Richmond, Bon Secours
2.8 REVENUE GENERATED BY NAMING/SPONSORSHIP RIGHT PAYMENTS TO RICHMOND PUBLIC SCHOOLSBon Secours, in addition to the previously listed naming/sponsorship payments, made addition-al payments to the Richmond City Public School System. These 10 payments of $100,000 (CY) have occurred from 2013 through 2018 and are expected to be paid the additional 4 remaining years on the term. The total in 2018 dollars can be viewed in Table 2.19.
TABLE 2.19 – REVENUE GENERATED BY NAMING/SPONSORSHIP RIGHT PAYMENTS TO RICHMOND CITY PUBLIC SCHOOL
TEAM AGREEMENT PERIOD (2013-2020)
REMAINING LIFE OF LOAN PERIOD (2021-2033)
$821,771 $189,308
SOURCE: City of Richmond, Bon Secours, CURA
2.9 REVENUE GENERATED BY BSHS RENT PAYMENTSThe Leigh Street and Westhampton sites are owned by the city. Bon Secours Health System is the tenant occupying the specified spaces. Rents in each specified space where Bon Secours Health System is the tenant have been calculated. These rents were calculated utilizing the stip-ulations of the governing lease agreements. The summarized lease agreements are as follows:
• Leigh Street Site – Base monthly rent of $22,917 (CY) for the initial term of 10 years with two additional five-year renewal terms that include an annual 3 percent increase (each of which, in CURA’s models, are assumed to be renewed).
• Westhampton Site – Base annual rent of $5,000 (CY) with the addition of $28,000 (CY) annually for maintenance of the playing fields on the leased site.3
The total calculated data and projected rental incomes for the two time periods are shown in Table 2.20. It should be noted that there are renewal periods for these rent payments that can extend well beyond 2033.
TABLE 2.20 – BSHS RENTAL OF LEIGH STREET AND WESTHAMPTON SITES
TEAM AGREEMENT PERIOD (2013-2020)
REMAINING LIFE OF LOAN PERIOD (2021-2033)
$2,237,215 $4,522,752SOURCE: City of Richmond, Bon Secours, CURA
3 There are two renewal periods outlined in the rental agreement with additional terms of 20 years. These renewal periods include the same $5,000 annual rental amounts without the $28,000 field maintenance payments. Due to the length of the initial rental period, these additional rental periods were not considered in CURA’s model.

FISC
AL
IMPA
CT/R
OI
■ ■ ■ ■ ■ ■ ■ ■ ■ ■ ■ ■ ■ ■ ■ ■ ■ ■ ■ ■ ■ ■ ■ ■ ■ ■ ■ ■ ■ ■ ■ ■ ■ ■ ■ ■ ■ ■ 20
2.10 TAX REVENUE GENERATED BY BSHS CONSTRUCTION ACTIVITIES (EAST END AND WESTHAMPTON PROJECTS)While construction on both East End and Westhampton projects has been delayed, local an-nouncements by BSHS have provided details on the total spending for these projects. Utilizing these details, researchers at CURA determined the total tax revenue generated by BSHS con-struction activities totaling $61,500,000 worth of investment. The final value for these calcula-tions can be found in Table 2.21.
TABLE 2.21 – TAX REVENUE GENERATED BY BSHS CONSTRUCTION ACTIVITIES
REMAINING LIFE OF LOAN PERIOD (2021-2033)
$336,649
SOURCE: Bon Secours, City of Richmond, CURA
2.11 TAX REVENUE GENERATED BY BSHS LEIGH STREET, WESTHAMPTON, AND EAST END PROPERTY TAXESIn accordance with signed agreements, BSHS has and will continue to pay real estate taxes for the rented Leigh Street site and the Westhampton Site, as well as for improvements to the East End Campus. Historic data for real estate taxes was gathered for Parcel ID’s N0001396001B, E0000713022, and W0210140001B to determine real estate tax payments based on assess-ments for the three sites as well as future real estate tax payments through 2021.
In 2022, BSHS real estate taxes are expected increase dramatically due to a considerable in-crease in improvement value of both their rented and owned properties as a whole. Utilizing projected construction cost data from BSHS as well as standard valuation discounts provided by the city, researchers at CURA determined future real estate tax generation. Total real estate tax generation for both periods of observation can be viewed in Table 2.22. It should be noted that a portion of these increased real estate tax payments will extend beyond 2033.
TABLE 2.22 – TAX REVENUE GENERATED BY BSHS PROPERTY TAXES
TEAM AGREEMENT PERIOD (2013-2020)
REMAINING LIFE OF LOAN PERIOD (2021-2033)
$991,575 $7,874,078
SOURCE: Bon Secours, City of Richmond, CURA

21
FISCAL IM
PACT/RO
I
■ ■ ■ ■ ■ ■ ■ ■ ■ ■ ■ ■ ■ ■ ■ ■ ■ ■ ■ ■ ■ ■ ■ ■ ■ ■ ■
2.12 TAX REVENUE GENERATED BY BSHS WESTHAMPTON COMMERCIAL OPERATIONSWith the completion of a mixed used development in 2022, the Westhampton Site will generate additional taxes from commercial operations in addition to real estate taxes. Information provided by BSHS on the square footage share of different intended commercial uses (office and retail) were used as the foundation of commercial operations tax estimations.
These square footage values were then used to predict employment by dividing them by square foot per employee data.4 The derived total employment per-square foot was then input into an IM-PLAN Pro™ model for the City of Richmond. This model produced the total earnings for each use. Taxes for these commercial earnings were then calculated. The totals for the observed periods of this report can be viewed in Table 2.23.5 It should be noted that these commercial tax payments will extend well beyond 2033.
TABLE 2.23 – TAX REVENUE GENERATED BY BSHS WESTHAMPTON COMMERCIAL OPERATIONS
REMAINING LIFE OF LOAN PERIOD (2021-2033)
$2,855,568
SOURCE: Bon Secours, City of Richmond, Fairfax County, CURA
2.13 REVENUE GENERATED BY BSHS WESTHAMPTON RESIDENTIAL SPENDINGIn addition to commercial taxes, the Westhampton Site will also generate additional tax revenues generated by the spending of residents that will live in the Westhampton mixed use develop-ment. Residential household spending patterns, city-wide vacancy rates, and the Richmond medi-an income was applied to the total number of units to be completed to generate total residential spending in the city by category (e.g., groceries, transportation, etc.).6 It was assumed that each unit would hold, on average, two residents, each spending 50 percent of their income in the city.
4 (Fairfax County, 2017)5 Commercial tax generation was not calculated for BSHS’s office uses as they are not taxed due to their non-profit desig-nation. These values include sub-tenant run commercial uses of the Westhampton Site.6 (U.S. Bureau of Labor Statistics, 2016)
COST OF ASSUMPTION: NON-RENEWAL OF THE LEIGH STREET SITE LEASE
The initial period of BSHS’ the Leigh Street Site will be completed in 2023. There are two optional renewal periods of 5-years each. Currently it is unknown if these renewals will be made. In order to ensure conservative estimates, researchers at CURA have calculated the potential cost of this assumption for each five year period.
The rental of the Leigh Street Site provides revenues to the city in the form of rents as well as real estate taxes as outlined in the Performance and Lease Agreements. The combined total for the first 5-year renewal period is estimated to be $1,960,011 and the second 5-year renewal period is estimated to be $2,039,787 for a total of $3,999,798 in revenue.

FISC
AL
IMPA
CT/R
OI
■ ■ ■ ■ ■ ■ ■ ■ ■ ■ ■ ■ ■ ■ ■ ■ ■ ■ ■ ■ ■ ■ ■ ■ ■ ■ ■ ■ ■ ■ ■ ■ ■ ■ ■ ■ ■ ■ 22
This spending was then applied to the appropriate tax coefficients (listed in Table 2.11) to derive the total annual tax generation from the households living in the future Westhampton Site. The totals for the observed periods of this report can be viewed in Table 2.24.7 It should be noted that this tax generated by residents will extend beyond 2033.
TABLE 2.24 – REVENUE GENERATED BY BSHS WESTHAMPTON RESIDENTIAL SPENDING
REMAINING LIFE OF LOAN PERIOD (2021-2033)
$927,917
SOURCE: Bon Secours, City of Richmond, U.S. Bureau of Labor Statistics, CURA
2.14 LEIGH STREET ASSET VALUE CONSIDERING DEPRECIATIONThe analysis thus far completed in this section is focused on revenue associated with the proj-ect. However, the asset value of the Leigh Street Site should be considered as well. While the renewal of the Team agreement and renewal of the BSHS rental second periods are currently un-known, the structure possesses value. Based on a total investment of $10,213,9158 and a 50-year economic lifespan of the structure the annual depreciation value was calculated to be $204,278. Considering the total investment at the end of the Team Agreement Period (2020) and at the end of the Remaining Life of Loan Period (2033) the value of the Leigh Street asset will be $8,783,967 and $6,128,349, respectively.
FISCAL ANALYSIS COST-BENEFIT SUMMARY OF RESULTSThe fiscal analysis of the Redskins’ training camp in Richmond is complex. Were this analysis focused only on the football activities, it is clear that the city would experience a net loss of rev-enue. However, these agreements include many additional layers such as partnerships, physical sites, and associated economic impacts that will continue to impact the City of Richmond for many years to come.
Relationships with city stakeholders will last longer than the training camp period and the life of the loan. The training camp is the tangible result of strong collaboration among—and associated agreements between—the partners. The training camp will continue only through 2020 if the term is not renewed, but it serves as the catalyst for associated development agreements with BSHS that will have continuing impacts.
The previously detailed fiscal cost-benefit analysis for the City of Richmond is summarized on the following page in Table 2.25.
7 There may be minimal double counting of the spending of residents on the site with the income of commercial entities on the site if residential spenders choose to patronize these businesses. However, this overlap is negligible.8 This value represents the total construction cost adjusted to 2018 dollar values.

23
FISCAL IM
PACT/RO
I
■ ■ ■ ■ ■ ■ ■ ■ ■ ■ ■ ■ ■ ■ ■ ■ ■ ■ ■ ■ ■ ■ ■ ■ ■ ■ ■
TABLE 2.25: SUMMARY OF FISCAL ANALYSIS – COST-BENEFIT FOR TRAINING CAMP AND ASSOCIATED DEVELOPMENT AGREEMENTS (2013-2033)
CATEGORY
TEAM AGREEMENT
PERIOD (2013-2020)
REMAINING LIFE OF LOAN
PERIOD (2021-2033)
GRAND TOTAL
(2013-2033)
CIT
Y
Cost of Construction Loan Debt Service $(10,945,403) - $(10,945,403)
Contributions to Team $(2,926,332) - $(2,926,332)
Cash $(1,972,880) - $(1,972,880)
In-Kind $(953,452) - $(953,452)
Sponsorship Credit* $1,154,513 - $1,154,513
TOTAL COST $(13,871,735) - $(13,871,735)
CIT
Y TRG by Leigh Street Construction Spending $55,911 - $55,911
Net RG by SMG at Leigh Street Site $368,339 $1,497,542 $1,865,880
TEA
M
TRG by Training Camp Attendees $1,366,272 - $1,366,272
TRG by Team Spending $428,594 - $428,594
TRG by Visiting Media $39,479 - $39,479
TRG by Visiting Teams and Associated Media $38,763 - $38,763
SP
ON
SO
R
RG by Naming/Sponsorship Right Payments $3,526,844 - $3,526,844
RG by Naming/Sponsorship Right Payments to RPS $821,771 $189,308 $1,011,079
RG by BSHS Rent Payments† $2,237,215 $4,522,752 $6,759,967
TRG by BSHS Construction Activities - $336,649 $336,649
TRG by BSHS Real Estate Taxes $991,575 $7,874,078 $8,865,654
TRG by BSHS Westhampton Commercial - $2,855,568 $2,855,568
TRG by BSHS Westhampton Residential Spending - $927,917 $927,917
TOTAL REVENUES $9,874,762 $18,203,815 $28,078,577
NET BENEFIT (REVENUES MINUS COSTS) $(3,996,973) $18,203,815 $14,206,842
DEPRECIATED ASSET VALUE IN FINAL YEAR $8,783,967 $6,128,349 $6,128,349
NET BENEFIT AND ASSET VALUE $4,786,994 $24,332,164 $20,335,191
SOURCE: VCU Center for Sport Leadership, Washington Redskins, City of Richmond, Bon Secours, SMG, CURA NOTE: RG = Revenue Generation, TRG = Tax Revenue Generation* Sponsorship Credit is not included as a cost or a revenue as it is a credit not paid by the city which offsets payments to the team† RG by BSHS Rent Payments includes $28,000 (CY) payments for Westhampton field maintenance

FISC
AL
IMPA
CT/R
OI
■ ■ ■ ■ ■ ■ ■ ■ ■ ■ ■ ■ ■ ■ ■ ■ ■ ■ ■ ■ ■ ■ ■ ■ ■ ■ ■ ■ ■ ■ ■ ■ ■ ■ ■ ■ ■ ■ 24
In the initially estimated period, the city is at a loss from a revenue standpoint. The total expense of $13,871,735 to construct the Leigh Street facility and provide payments to the team is not estimated to be recouped by the end of the team agreement period. In 2020, after the initial peri-od, Richmond will experience an estimated loss of $3,996,973. However, when the Leigh Street asset is considered along with revenue there is a total net benefit of $4,786,994.
The second observed term, which is fueled not by football activities, but by development funded by Bon Secours, has no associated cost to the city that had not allocated in the first observed term. The period of 2021 to 2033 will produce an estimated revenue of $18,203,815 for a com-bined net benefit of $14,206,842. Considering the Leigh Street asset, the net benefit is even higher at $20,335,191.
It is estimated that this project will be net positive based solely on revenue by 2022 (Figure 2.1). This break even year is of particular interest due to the earlier assumption that BSHS will renew both of its five year rental terms. As the first of these unconfirmed rental terms is not set to oc-cur until 2023, the break even year with the renewal assumption, it would only push the break even year into the future one year. However, a lack of renewal in 2023 or 2028 has the potential to reduce revenues to the city between $2,039,787 and $3,999,798 overall, depending on the rental renewal scenario. The sale of the Leigh Street site asset dependent on the sale value would considerably hasten the projected break even date.
FIGURE 2.1 – PROJECT CUMULATIVE REVENUE COST-BENEFIT 2013-2033
$(15,000,000)
$(10,000,000)
$(5,000,000)
$-
$5,000,000
$10,000,000
$15,000,000
$20,000,000
2013
2014
2015
2016
2017
2018
2019
2020
2021
2022
2023
2024
2025
2026
2027
2028
2029
2030
2031
2032
2033

25
FISCAL IM
PACT/RO
I
■ ■ ■ ■ ■ ■ ■ ■ ■ ■ ■ ■ ■ ■ ■ ■ ■ ■ ■ ■ ■ ■ ■ ■ ■ ■ ■
RETURN ON INVESTMENT (ROI)At the end of the Leigh Street financing period in 2033, the City of Richmond will realize an es-timated total revenue of $28,078,577. Considering the investment of $13,871,735 made by the city (the total cost), this yields a positive project revenue ROI of 102.4 percent by the end of the refinance period in 2033. The annual revenue ROI of the project is 3.4 percent over the 21-year observed period.
BENEFITS BEYOND 20332033 marks the end of the observed periods of this report. However, it does not mark the end of the revenues of the project. A portion of the revenues have already been outlined and will contin-ue past 2033. These continuing revenues previously outlined include:
• EDA revenues generated by the SMG management of the Leigh Street Site• EDA revenues generated by BSHS rent payments• City tax revenue generated by BSHS Leigh Street, Westhampton, and East End property
taxes• City tax revenue generated by BSHS Westhampton commercial operations • City tax revenue generated by BSHS Westhampton residential spending taxes
These five categories of continuing revenue are estimated to provide approximately $1,000,000 to the city in annual revenues beyond 2033. However, in 2033 with the construction loan and all contributions to the team completed, the EDA can reinvest its share of revenues to future proj-ects as opposed to repaying the city.
The asset value of the Leigh Street site has not been included in revenue ROI calculations . While the impact of its redevelopment or sale might be considerable, estimating these impacts is chal-lenging as the future of the site’s year of sale, ensuing potential sale value, and other factors are unknown.
The suite of agreements between the city, the team, and the sponsor will provide lasting fiscal benefits beyond 2033.
OVER A 21-YEAR OBSERVED PERIOD THIS PROJECT IS ESTIMATED TO YIELD A:
102.4%3.4% AVERAGE
ANNUAL ROI
PROJECT ROI
$14.2 MILLION BENEFIT

CON
CLU
SIO
N
■ ■ ■ ■ ■ ■ ■ ■ ■ ■ ■ ■ ■ ■ ■ ■ ■ ■ ■ ■ ■ ■ ■ ■ ■ ■ ■ ■ ■ ■ ■ ■ ■ ■ ■ ■ ■ ■ 26
CONCLUSIONCURA’s goal in this report was to provide a clear understanding of the economic and fiscal im-pacts of the training camp and associated development agreements in Richmond. With this goal in mind, CURA has avoided any analysis that goes beyond tangible values, historic or projected. However, based on estimates and calculations by CURA, this project, outlined by several legal agreements, will provide a net benefit to Richmond.
While this net benefit is yet to be realized, the training camp served as a catalyst for future phys-ical developments at the East End and Westhampton sites that will produce additional revenues for the city by the end of the observed project period in 2033.
The two periods, 2013 to 2020 and 2021 to 2033, were selected intentionally. With 2020 nearing and the end of the team’s initial term in sight, the project will shift into a period associated with benefits generated by the sponsor’s activity as opposed to just the training camp and relative sponsorship. While sponsor benefits in the initial period were still considerable, the long-term impacts of sponsor development and associated rents, tax revenues, and other financial benefits to the city make these agreements more substantial than an eight-year training camp agreement.

REFERENCES
i■ ■ ■ ■ ■ ■ ■ ■ ■ ■ ■ ■ ■ ■ ■ ■ ■ ■ ■ ■ ■ ■ ■ ■ ■ ■ ■
REFERENCESCity Auditor’s Office. (2018). Leigh Street Development Project Audit. Richmond: City of Rich-
mond.
Fairfax County. (2017, December 5). Fairfax County - Round 7.0: Non-residential Employment Factors. Retrieved from fairfaxcounty.gov: https://www.fairfaxcounty.gov/hr/sites/hr/files/Assets/documents/HR/chap10.pdf
Spiers, J. (2018, April 10). Developers Drop $5M for Interbake Site Off Boulevard. Retrieved from Richmond BizSense: https://richmondbizsense.com/2018/04/10/spy-rock-stanley-shield-drop-5m-interbake-site-boulevard/
U.S. Bureau of Labor Statistics. (2016, August). Consumer Expenditure Survey. Table 1702 Hous-ing Tenure and Type of Area: Annual Expenditure Means, Shares, Standard Errors, and Coefficients of Variation.
Virginia Tourism Corporation. (2017). Business Trip Profile. Retrieved from VATC.org: https://www.vatc.org/wp-content/uploads/2018/05/Business_TripProfile_FY2017.pdf